2.1. Expression of TFs by Cultured Aortic and Inflammatory Cells
Before experimenting with hard-to-get human aortic tissue samples, we carried out experiments with human cell lines representing the different types of cells present in the aortic wall. We used commercially available human aortic smooth muscle (HASMC), endothelial (HAEC) and macrophage (THP-1) cell lines. In disease states, such as AAA, cells in the aortic wall are exposed to different stressors including cytokines, reactive oxygen species, and matrix metalloproteinases. To mimic this environment, we cultured the cells in the presence or absence of lipopolysaccharides (LPS) or interferon γ (IFNγ), which have been shown to activate these cells [
21,
22].
We tested antibody specificity to ensure that we can identify binding sites specific for ELF1, ETS2, and RUNX1, the TFs chosen for the study based on our previous
in silico analyses [
8], as well as STAT5 identified as a key regular in our previous study on the complement cascade [
14].
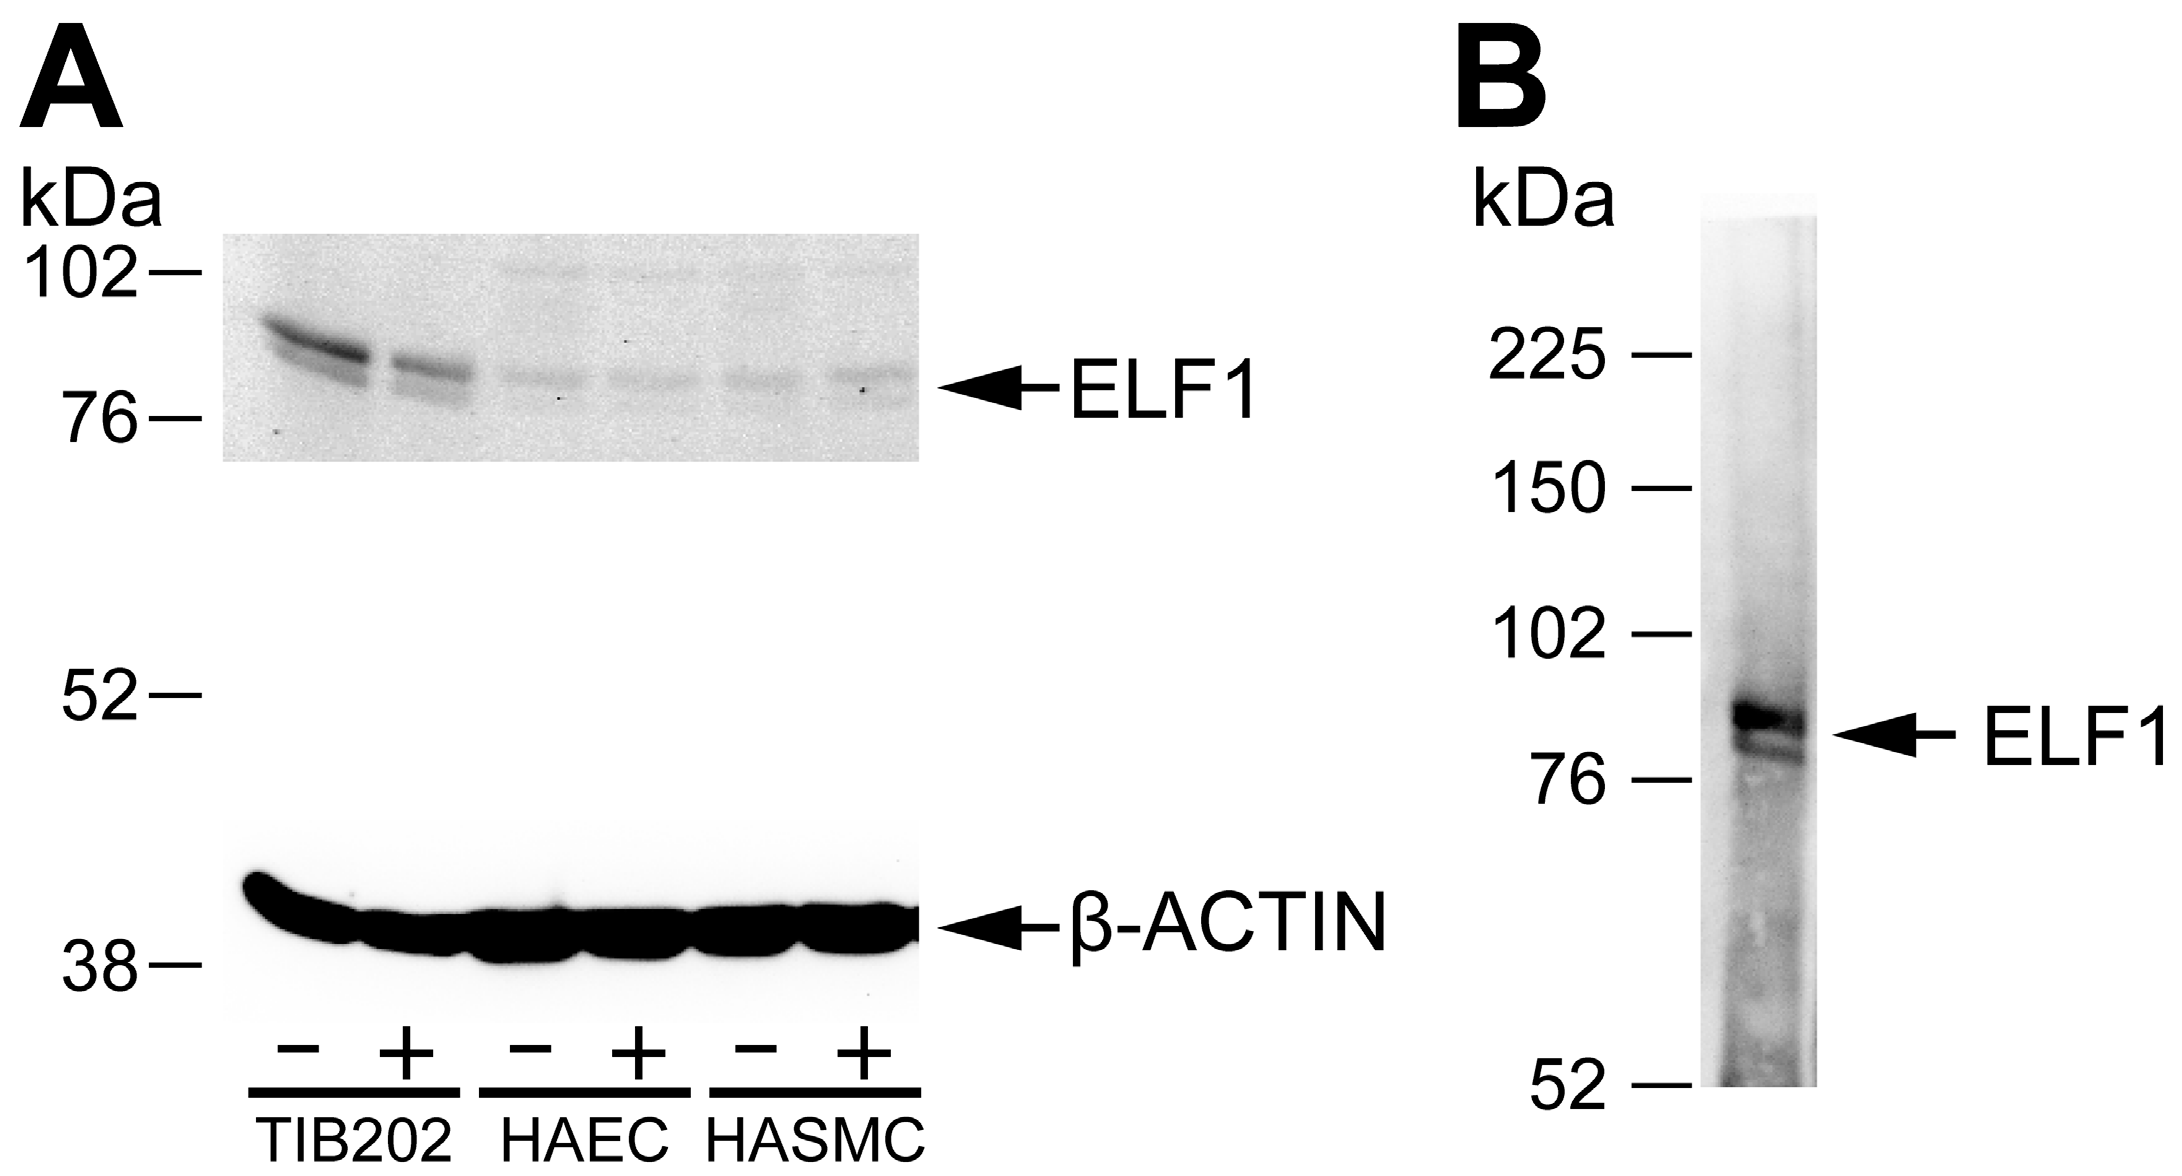
Figure 1 shows results using an antibody against ELF1 [
23,
24] in a Western blot against protein lysates obtained from the cell cultures (A), as well as an immunoprecipitation with this antibody, followed by Western using the same antibody (B). The immunoprecipitation was carried out using the same protocol as in ChIP except not doing the crosslinking step. The results demonstrated the specificity of the ELF1 antibody, and verified the expression of ELF1 protein by the cell lines. The stimulation of these cell lines with LPS or IFNγ led to an increase in the amount of ELF1 protein (1.8-fold increase in the nuclear form in HASMC when standardized with β-actin protein levels). Similar experiments were carried out with antibodies against ETS2 [
24,
25,
26], RUNX1 [
27] and STAT5 [
14] (not shown). All four TFs were expressed in all the cell lines (not shown).
Figure 1.
Western blots of (
A) protein lysates from three different cell lines and (
B) immunoprecipitated proteins from a macrophage cell line THP-1. (
A) Three different human cell types (macrophage, THP-1 also called TIB202; aortic endothelial, HAEC; and aortic smooth muscle, HASMC), were grown either unstimulated (−) or stimulated (+) with LPS or IFNγ, harvested, lysed and analyzed in Western blot using a commercially available ChIP-validated antibody against ELF1 [
23]. The lower part of the blot was incubated with β-actin antibody to use as a loading control. The β-actin antibody produced a strong band of the expected size (42 kDa); (
B) THP-1 cells were immunoprecipitated using the ELF1 antibody and the precipitated proteins detected in a Western blot against the same ELF1 antibody. The sizes of molecular weight markers are shown in kDa. The expected sizes of the cytoplasmic and nuclear form of ELF1 are 80 and 98 kDa, respectively.
2.2. Analysis of ChIP-Chip Results from Aortic Tissue
The ChIP-chip for aortic samples (
Table 2) was carried out in two pools of samples, “the AAA Pool” (combining six AAA tissue samples) and “the Control Pool” (combining five control tissue samples), due to the large amount of tissue required for the experiment. Each TF was analyzed in a separate experiment. The ChIP-enriched regions (chers), in the human genome are listed in
Table S1. After identifying the chers, we identified the genes in whose promoter regions (10 kb upstream of the transcription start site (TSS), or within the gene) the chers were located. The number of genes with chers per TF was similar in AAA (1330 to 1513) and control (1491 to 1570) tissues, and between the different ChIP experiments carried out with antibodies against different TFs (
Table 3). There was, however, only a small overlap of 147 to 175 genes between the AAA and control samples in different experiments (
Table 3). We examined the sequences of the chers to identify TF binding motifs, and found that approximately 76.4% of the chers contained transcription factor binding sites (TFBSs). All identified TFBSs are listed in
Table S2.
Table 2.
Donor information for aortic tissue samples.
Table 2.
Donor information for aortic tissue samples.
| Case ID | Age (Years) | Sex | Diagnostic Group | Cause of Death * |
|---|
| GHS01 | 67 | Male | AAA | NA |
| GHS03 | 88 | Male | AAA | NA |
| GHS07 | 65 | Female | AAA | NA |
| GHS13 | 78 | Male | AAA | NA |
| GHS14 | 75 | Male | AAA | NA |
| GHS15 | 66 | Male | AAA | NA |
| ME-02-04 | 50 | Male | Control | Drug Overdose |
| ME-02-05 | 78 | Male | Control | Cardiovascular |
| ME-05-01 | 69 | Female | Control | Trauma |
| ME-05-03 | 54 | Male | Control | Cardiovascular |
| ME-10-02 | 53 | Male | Control | Cardiovascular |
After identifying the chers with motifs for the TFBSs, we determined the distance from the predicted site to the TSS (
Table S2). We used the most proximal TSS for each gene, and found 4760 known genes that were enriched in AAA, 713 of which were differentially expressed in the previous mRNA expression study (
Table S3) [
7]. In addition we sampled control aortic tissue and found chers associated with 4985 known genes with 680 genes differentially expressed [
7].
The ChIP-chip data for the stimulated cultured mononuclear cells were analyzed using same methods as the tissue data. Overall we found fewer genes expressed in the mononuclear blood cell cultures compared to the tissue samples. Since none of the genes were enriched in both the cell and tissue experiments (not shown), further analyses were carried out with only the aortic tissue samples.
Table 3.
Number of genes with chers, genes with differential expression in AAA, and chers with TFBSs.
Table 3.
Number of genes with chers, genes with differential expression in AAA, and chers with TFBSs.
| Transcription Factor | Genes with Chers * | Genes with Chers in both AAA and Control | Differentially Expressed Genes † | Chers with TFBS N (%) |
|---|
| AAA N | Control N | N | % | AAA N | Control N | Overlap N (%) |
|---|
| RUNX1 | 1330 | 1491 | 147 | 5.2 | 209 | 186 | 18 (4.6) | 80.0 |
| ELF1 | 1513 | 1570 | 166 | 5.4 | 217 | 216 | 28 (6.5) | 81.3 |
| ETS2 | 1448 | 1539 | 175 | 5.9 | 201 | 215 | 30 (7.2) | 79.0 |
| STAT5 | 1490 | 1557 | 151 | 5.0 | 221 | 209 | 23 (5.3) | 79.1 |
2.4. Functional Classification of TF Target Genes
The target genes of the TFs identified in the ChIP-chip experiments were annotated using the Gene Ontology (GO) biological function categories (
Table 5,
Table 6,
Table 7,
Table 8,
Table 9 and
Tables S4–S8). All GO biological function categories can be found in
Figure 2,
Figure 3,
Figure 4,
Figure 5. To provide a balance between general and specific features, we discuss here the GO categories from the 6th level of hierarchy from all the analyses (
Table 5,
Table 6,
Table 7,
Table 8,
Table 9). A significant enrichment of genes belonging to several GO categories was found (
Table 5,
Table 6,
Table 7,
Table 8,
Table 9;
Figure 2,
Figure 3,
Figure 4,
Figure 5). In the AAA samples most significantly enriched biological function categories were “
leukocyte migration” (FDR = 3.09 × 10
−05), and “
intracellular protein kinase cascade” (FDR = 6.48 × 10
−05) (
Table 5;
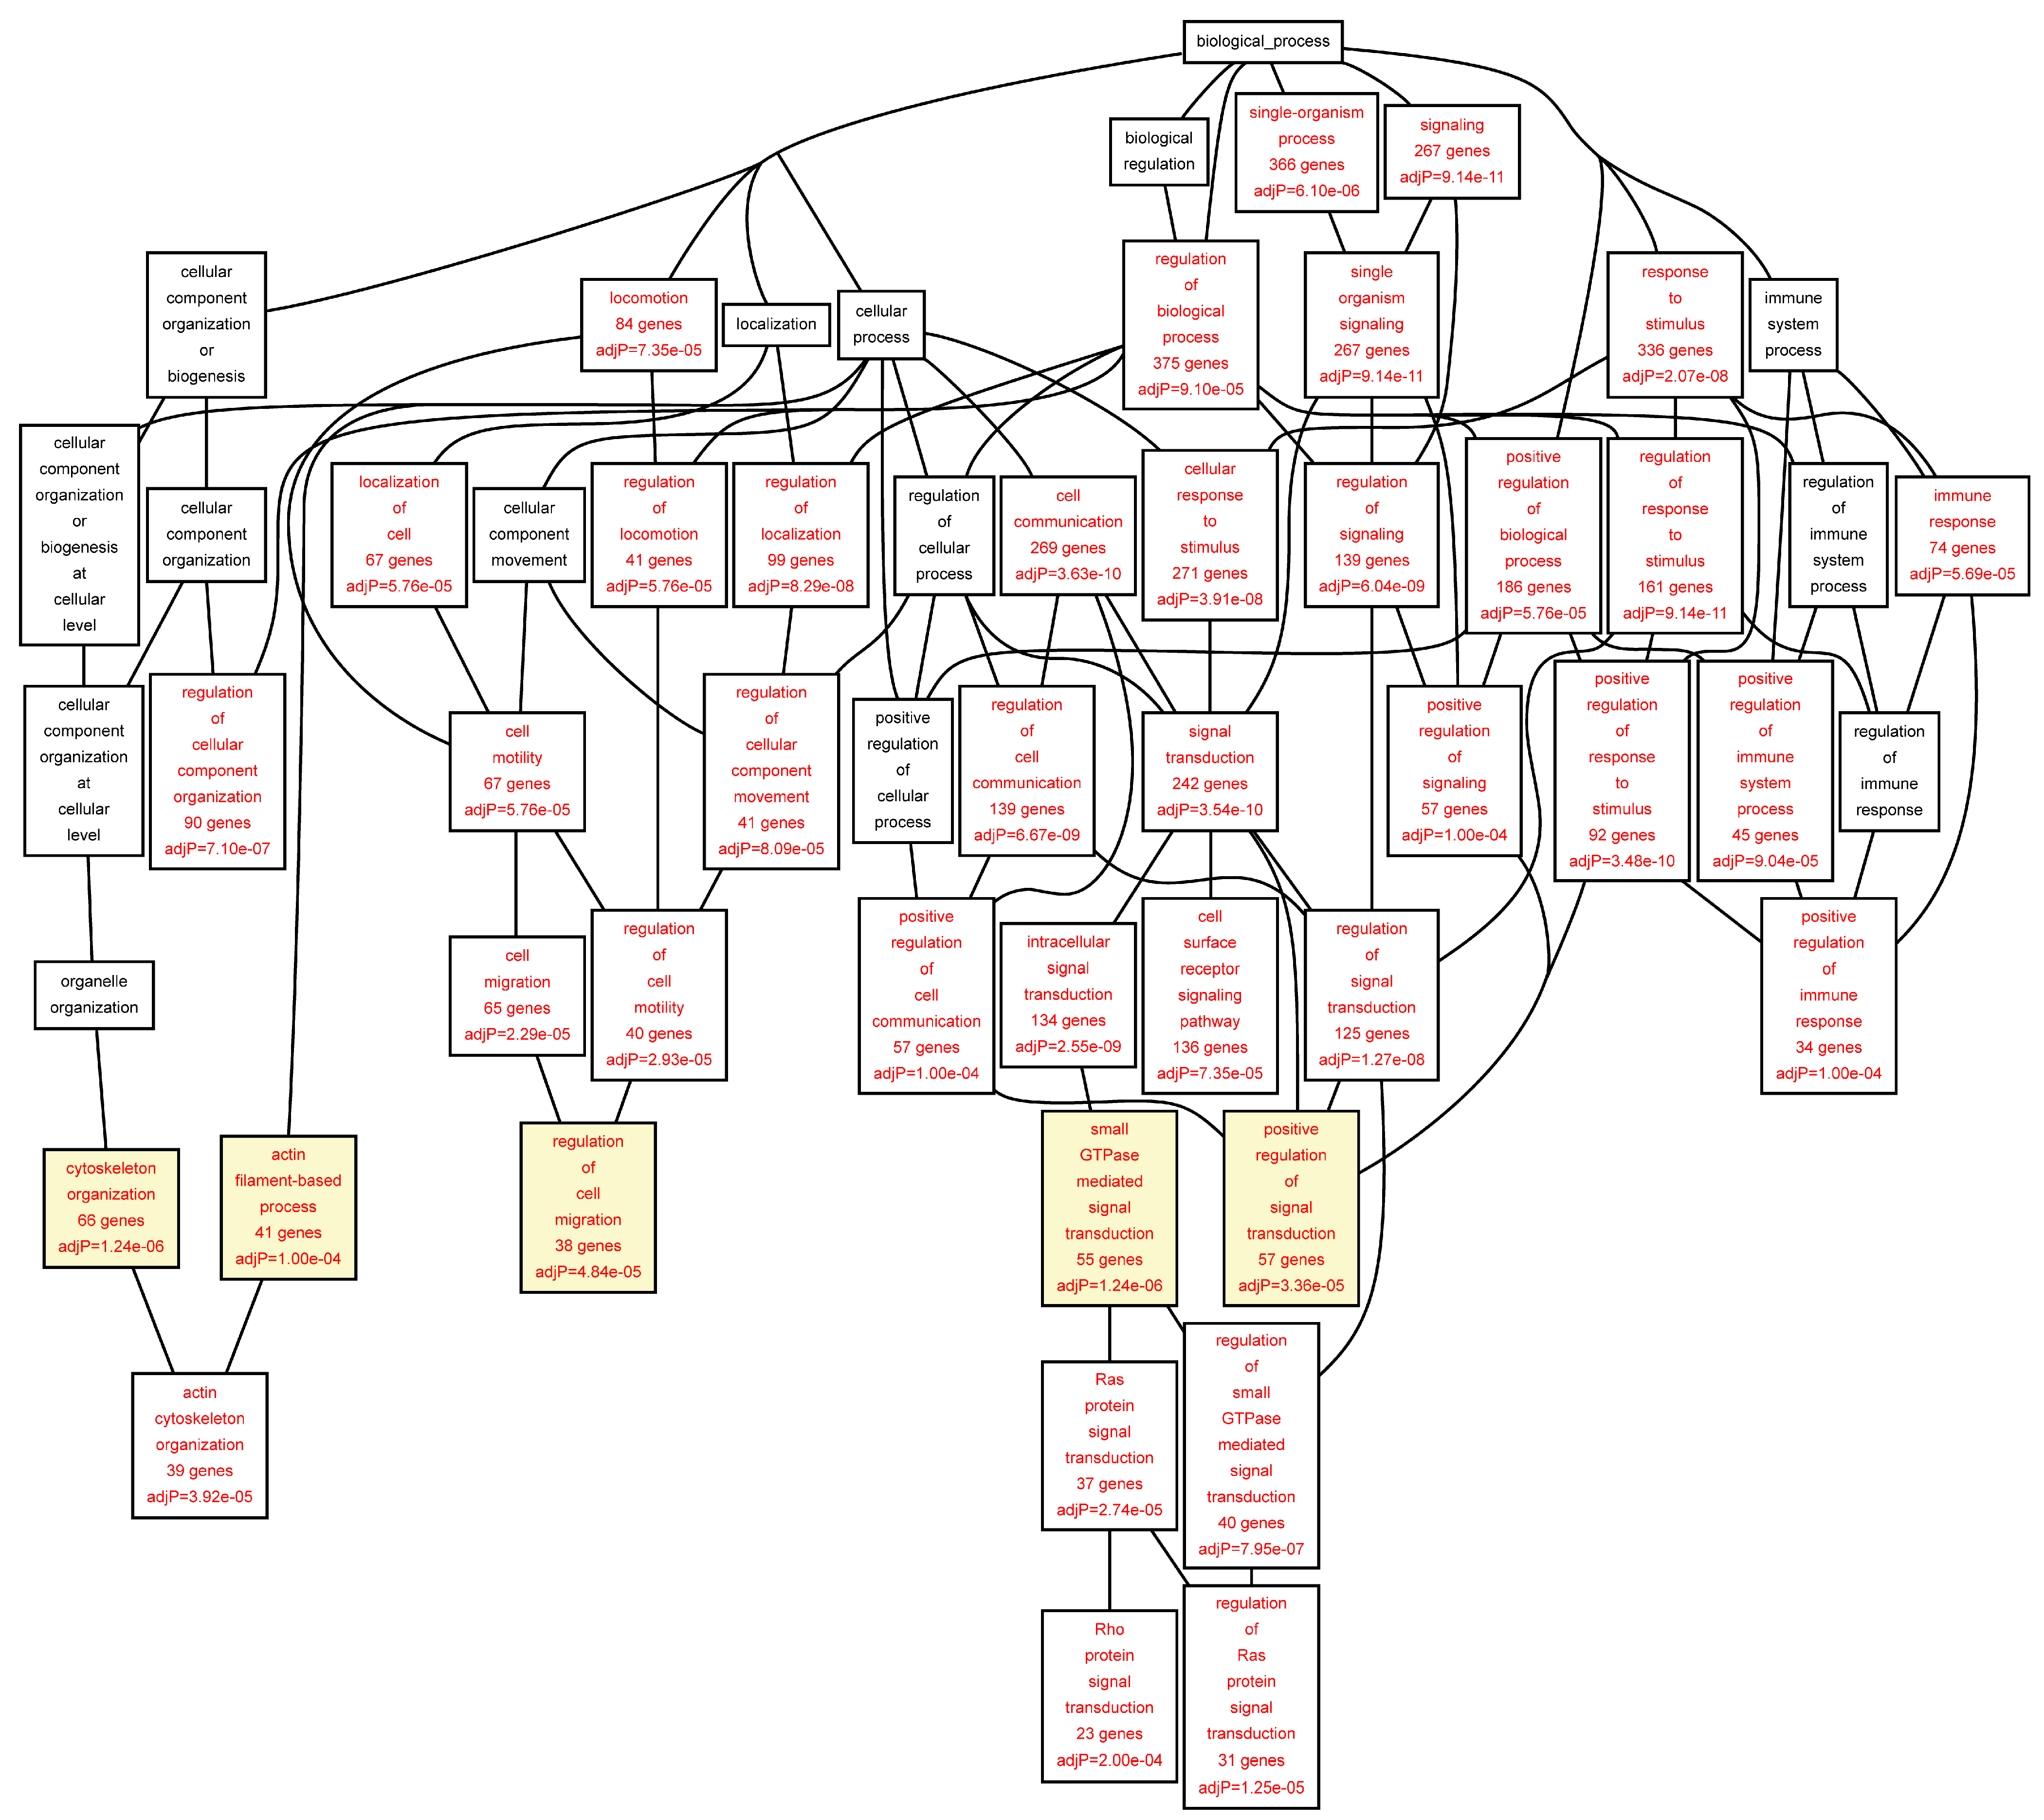
Figure 2). In the control aorta, the most significant GO categories differed from those in the AAA samples and included “
cytoskeleton organization” (FDR = 1.24 × 10
−06), and “
small GTPase mediated signal transduction” (FDR = 1.24 × 10
−06) (
Table 6;
Figure 3). The GO category “
positive regulation of signal transduction” was enriched in both AAA and control aorta (
Table 5 and
Table 6,
Figure 2 and
Figure 3).
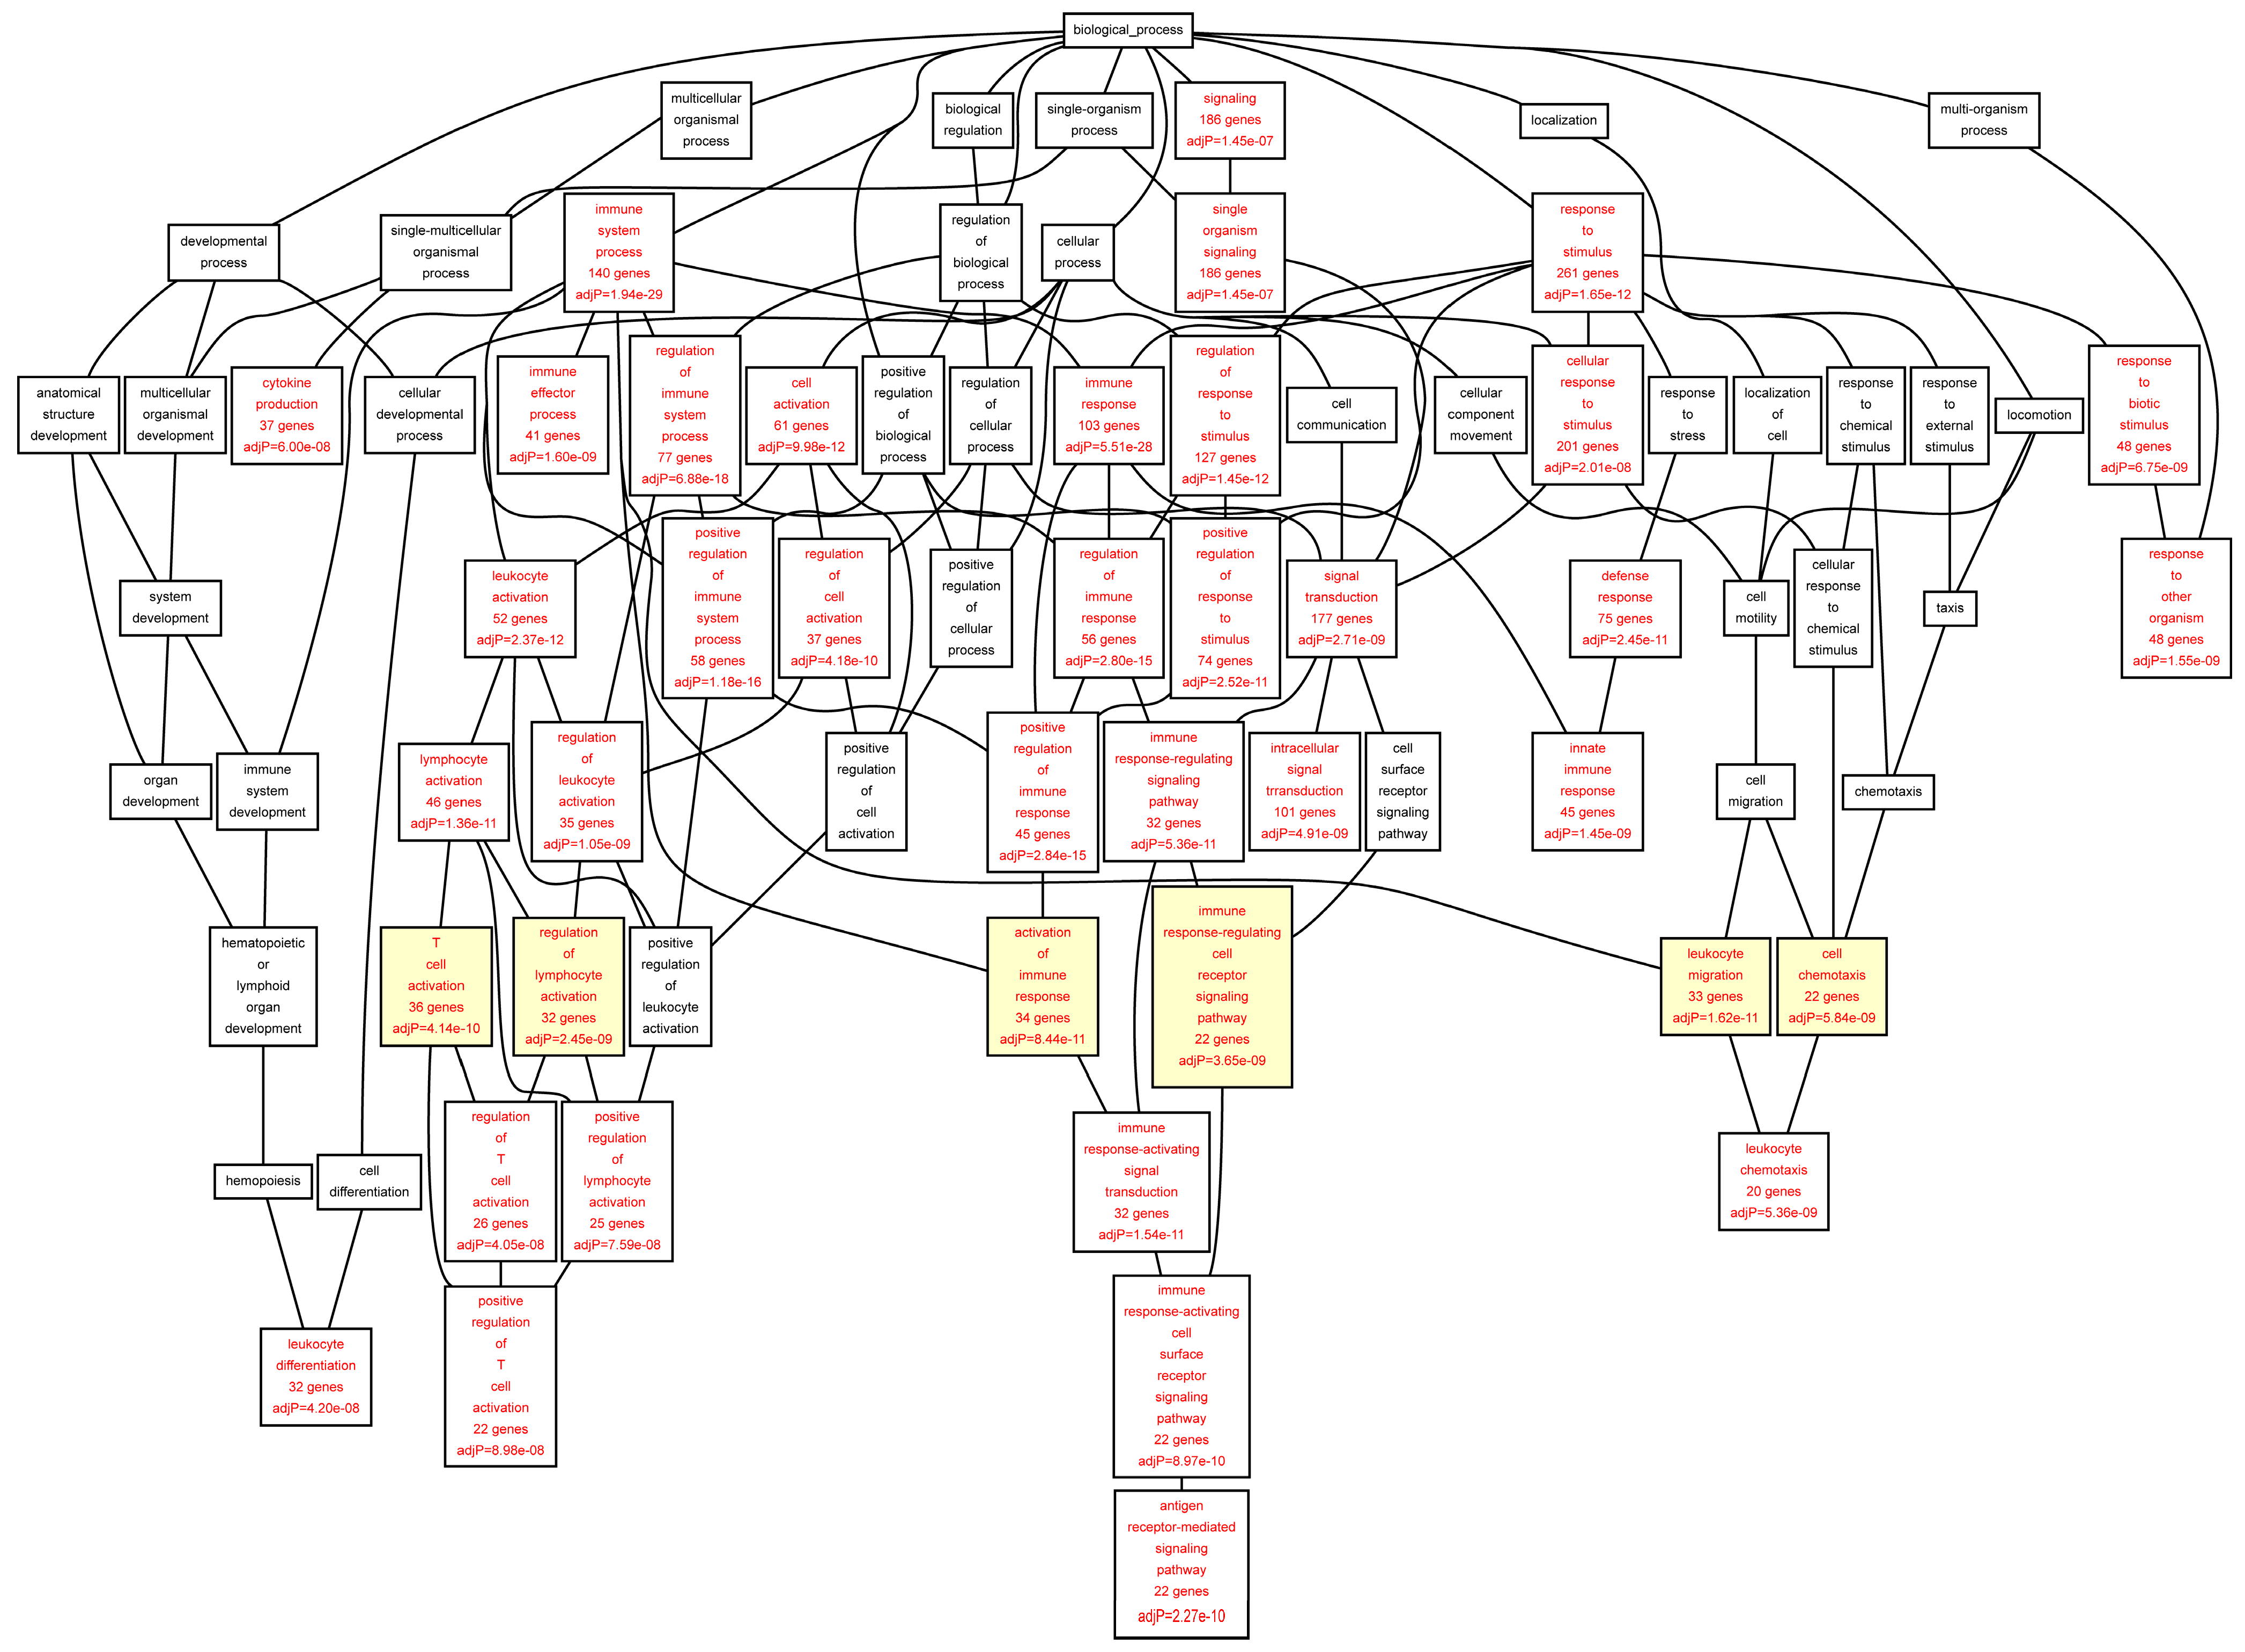
When we analyzed the target genes separately based on their mRNA levels in the AAA tissue, genes up-regulated in AAA tissue [
7] showed a highly significant enrichment for GO categories “
leukocyte migration” (FDR = 1.62 × 10
−11), “
activation of immune response” (FDR = 8.44 × 10
−11), “
T cell activation” (FDR = 4.14 × 10
−10), and “
regulation of lymphocyte activation” (FDR = 2.45 × 10
−09) (
Table 7;
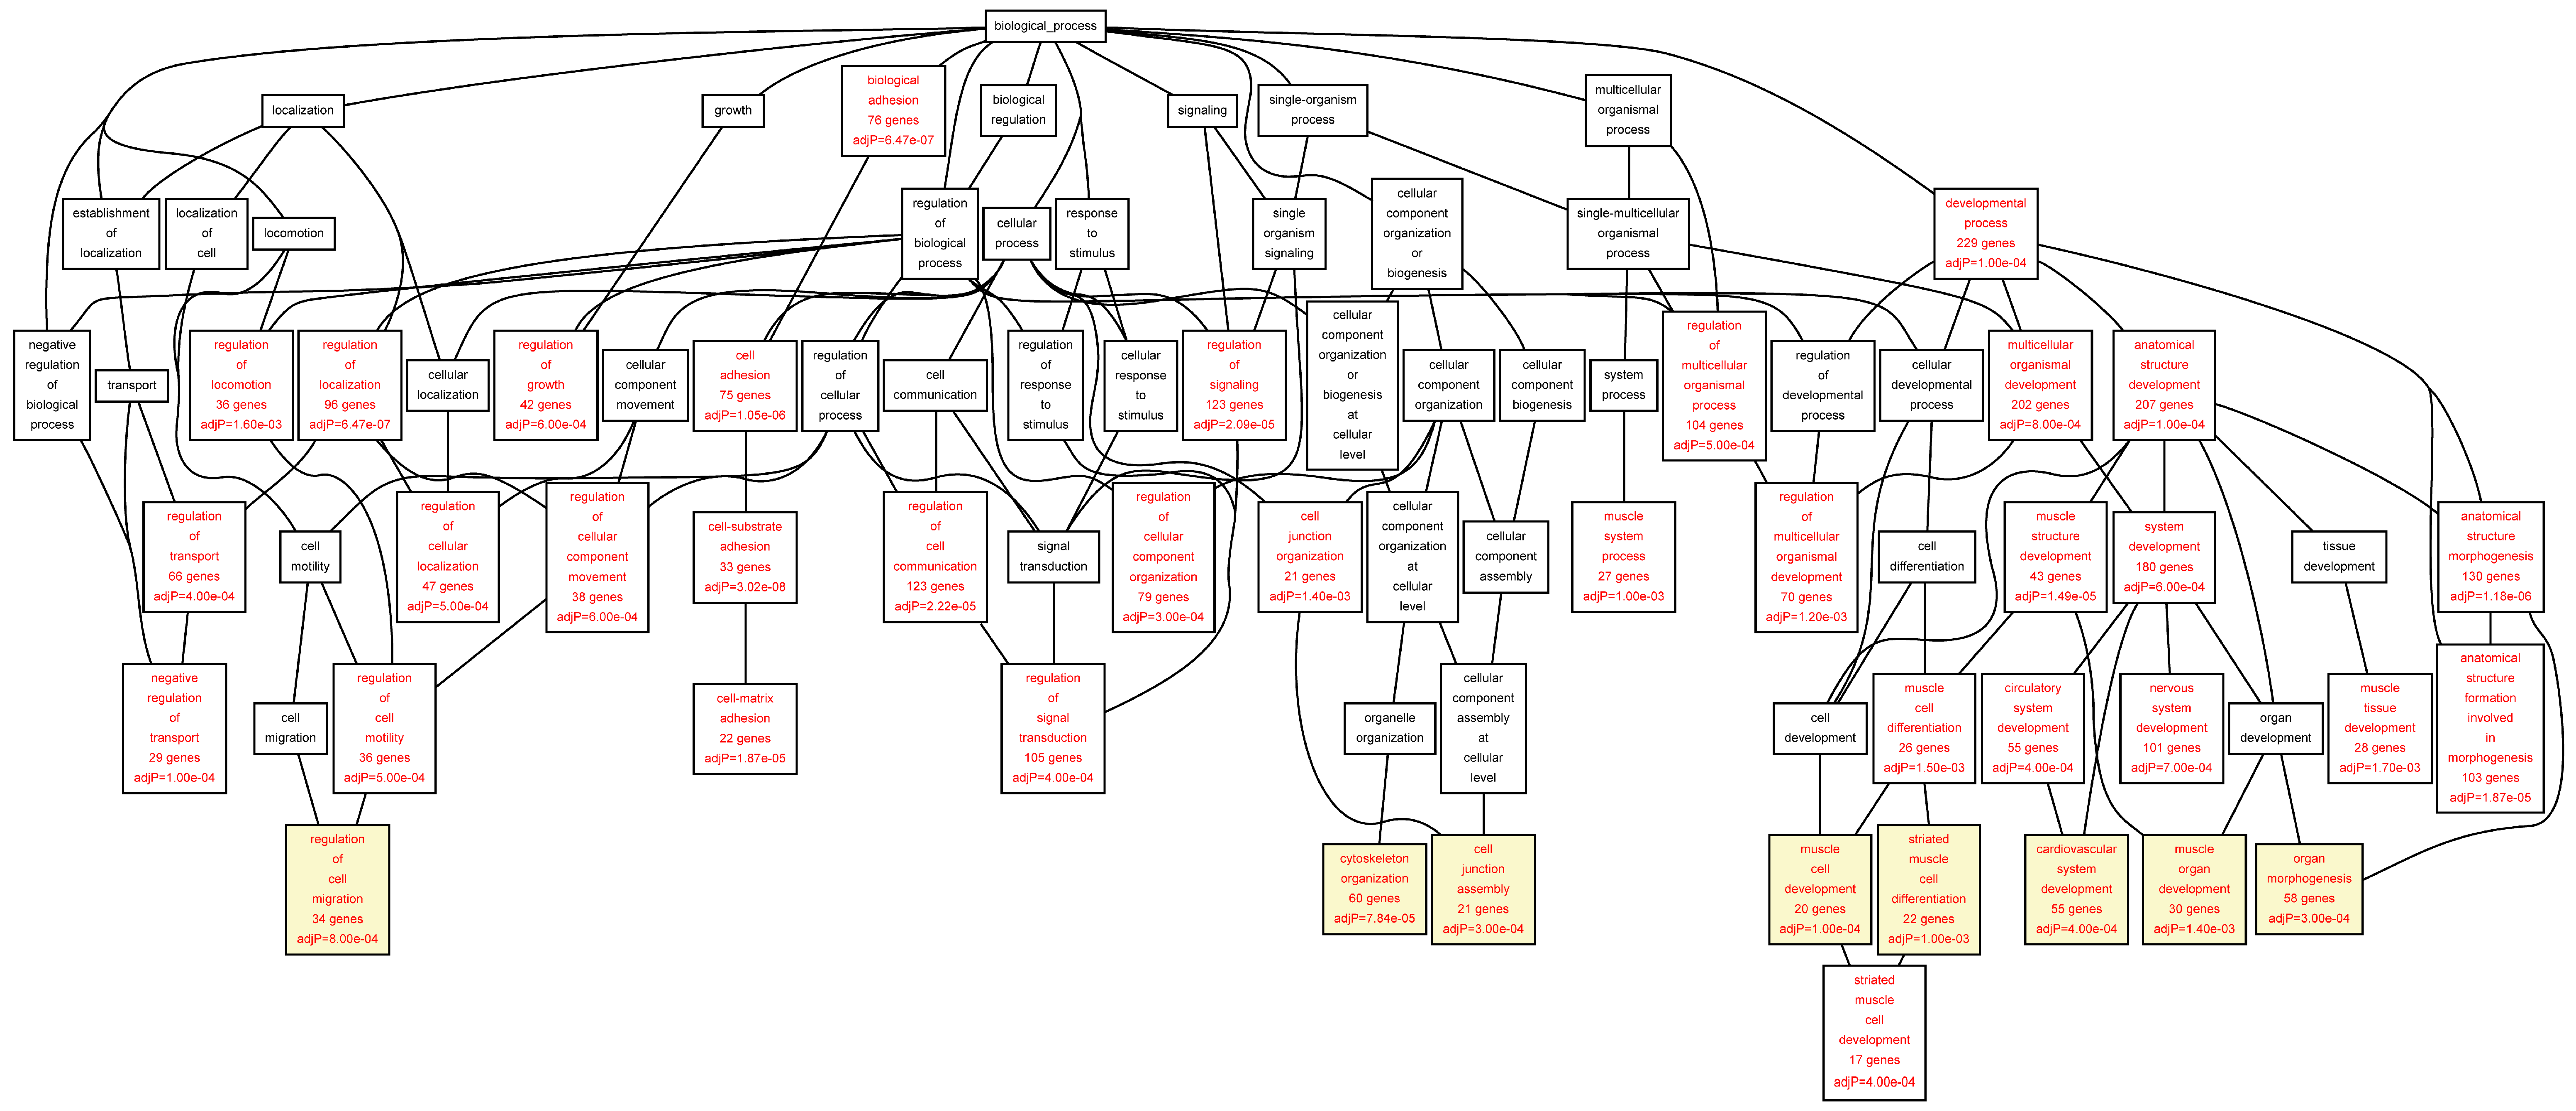
Figure 4). The genes down-regulated in AAA were enriched in completely different GO categories including “
cytoskeleton organization” (FDR = 7.84 × 10
−05), “
muscle cell development” (FDR = 1.00 × 10
−04), “
organ morphogenesis” (FDR = 3.00 × 10
−04), and “
cell junction assembly” (FDR = 3.00 × 10
−04) (
Table 8,
Figure 5).
We noticed that there was substantial overlap in GO categories for the individual TFs for all but ETS2. We therefore performed a GO analysis in which the target genes of ETS2 were omitted and only the target genes for RUNX1, STAT5 and ELF1 were included. The most significantly enriched categories were “
leukocyte migration” (FDR = 9.60 × 10
−05), “
positive regulation of leukocyte proliferation”, “
T cell activation”, “
cell chemotaxis” and “
intracellular protein kinases cascade” (all with FDR = 8.00 × 10
−04) (
Table 9). The results were very similar to that obtained with all the TFs (
Table 5), suggesting that RUNX1, STAT5 and ELF1 contribute most to the cellular immune response (T cell activation, lymphocyte and leukocyte activation and proliferation) in the AAA tissue.
Table 5.
Enriched Gene Ontology (GO) biological process categories for the target genes identified in AAA ChIP-chip with transcription factors RUNX1, ELF1, ETS2 and STAT5.
Table 5.
Enriched Gene Ontology (GO) biological process categories for the target genes identified in AAA ChIP-chip with transcription factors RUNX1, ELF1, ETS2 and STAT5.
| GO Biological Process Category | GO ID | Number of Genes | p | FDR |
|---|
| Reference Set | Aorta Set | Expected |
|---|
| Leukocyte migration | 0050900 | 248 | 30 | 3 | 1.21 × 10−07 | 3.09 × 10−05 |
| Intracellular protein kinase cascade | 0007243 | 867 | 67 | 34 | 4.17 × 10−07 | 6.48 × 10−05 |
| Positive regulation of signal transduction | 0009967 | 708 | 57 | 29 | 8.99 × 10−07 | 1.00 × 10−04 |
| Positive regulation of leukocyte activation | 0002696 | 230 | 26 | 9 | 3.04 × 10−06 | 2.00 × 10−04 |
| Regulation of lymphocyte activation | 0051249 | 287 | 30 | 12 | 2.75 × 10−06 | 2.00 × 10−04 |
| T cell activation | 0042110 | 332 | 33 | 2 | 2.68 × 10−06 | 2.00 × 10−04 |
Table 6.
Enriched GO biological process categories for the target genes identified in control aorta ChIP-chip with transcription factors RUNX1, ELF1, ETS2 and STAT5.
Table 6.
Enriched GO biological process categories for the target genes identified in control aorta ChIP-chip with transcription factors RUNX1, ELF1, ETS2 and STAT5.
| GO Biological Process Category | GO ID | Number of Genes | p | FDR |
|---|
| Reference Set | Aorta Set | Expected |
|---|
| Cytoskeleton organization | 0007010 | 792 | 66 | 31 | 7.57 × 10−09 | 1.24 × 10−06 |
| Small GTPase mediated signal transduction | 0007264 | 604 | 55 | 24 | 7.27 × 10−09 | 1.24 × 10−06 |
| Positive regulation of signal transduction | 0009967 | 708 | 57 | 28 | 2.77 × 10−07 | 3.36 × 10−05 |
| Regulation of cell migration | 0030334 | 395 | 38 | 16 | 4.33 × 10−07 | 4.84 × 10−05 |
| Actin-filament-based process | 0030029 | 463 | 41 | 18 | 1.34 × 10−06 | 1.00 × 10−04 |
Table 7.
Enriched GO biological process categories for the up-regulated target genes identified in AAA ChIP-chip with transcription factors RUNX1, ELF1, ETS2 and STAT5.
Table 7.
Enriched GO biological process categories for the up-regulated target genes identified in AAA ChIP-chip with transcription factors RUNX1, ELF1, ETS2 and STAT5.
| GO Biological Process Category | GO ID | Number of Genes | p | FDR |
|---|
| Reference Set | Aorta Set | Expected |
|---|
| Leucocyte migration | 0050900 | 248 | 33 | 7 | 9.09 × 10⁻¹⁴ | 1.62 × 10⁻¹¹ |
| Activation of immune response | 0002253 | 281 | 34 | 8 | 6.18 × 10⁻¹³ | 8.44 × 10⁻¹¹ |
| T cell activation | 0042110 | 332 | 36 | 9 | 3.39 × 10⁻¹² | 4.14 × 10⁻¹⁰ |
| Regulation of lymphocyte activation | 0051249 | 287 | 32 | 8 | 2.74 × 10⁻¹¹ | 2.45 × 10−09 |
| Immune response-regulating cell surface receptor signaling pathway | 0002768 | 139 | 22 | 6 | 4.40 × 10⁻¹¹ | 3.65 × 10−09 |
| Cell chemotaxis | 0060326 | 143 | 22 | 4 | 7.80 × 10⁻¹¹ | 5.84 × 10−09 |
Table 8.
Enriched GO biological process categories for the down-regulated target genes identified in AAA ChIP-chip with transcription factors RUNX1, ELF1, ETS2 and STAT5.
Table 8.
Enriched GO biological process categories for the down-regulated target genes identified in AAA ChIP-chip with transcription factors RUNX1, ELF1, ETS2 and STAT5.
| GO Biological Process Category | GO ID | Number of Genes | p | FDR |
|---|
| Reference Set | Aorta Set | Expected |
|---|
| Cytoskeleton organization | 0007010 | 792 | 60 | 30 | 3.31 × 10−07 | 7.84 × 10−05 |
| Muscle cell development | 0055001 | 145 | 20 | 6 | 6.94 × 10−07 | 1.00 × 10−04 |
| Organ morphogenesis | 0009887 | 802 | 58 | 31 | 2.35 × 10−06 | 3.00 × 10−04 |
| Cell junction assembly | 0034329 | 170 | 21 | 7 | 2.30 × 10−06 | 3.00 × 10−04 |
| Cardiovascular system development | 0072358 | 754 | 55 | 29 | 3.37 × 10−06 | 4.00 × 10−04 |
| Regulation of cell migration | 0030334 | 395 | 34 | 15 | 9.72 × 10−06 | 8.00 × 10−04 |
| Striated muscle cell differentiation | 0051146 | 204 | 22 | 8 | 1.24 × 10−05 | 1.00 × 10−03 |
| Muscle organ development | 0007517 | 340 | 30 | 13 | 2.03 × 10−05 | 1.40 × 10−03 |
Table 9.
Enriched GO biological process categories for the target genes identified in AAA ChIP-chip with a combined analysis of transcription factorsRUNX1, STAT5 and ELF1.
Table 9.
Enriched GO biological process categories for the target genes identified in AAA ChIP-chip with a combined analysis of transcription factorsRUNX1, STAT5 and ELF1.
| GO Biological Process Category | GO ID | Number of Genes | p | FDR |
|---|
| Reference Set | Aorta Set | Expected |
|---|
| Leukocyte migration | 0050900 | 248 | 26 | 8.3 | 2.44 × 10−07 | 9.60 × 10−05 |
| Positive regulation of leukocyte proliferation | 0070665 | 102 | 14 | 3.4 | 7.05 × 10−06 | 8.00 × 10−04 |
| Cell chemotaxis | 0060326 | 143 | 17 | 4.8 | 5.59 × 10−06 | 8.00 × 10−04 |
| T cell activation | 0042110 | 332 | 28 | 11 | 6.66 × 10−06 | 8.00 × 10−04 |
| Intracellular protein kinase cascade | 0007243 | 867 | 54 | 29 | 6.51 × 10−06 | 8.00 × 10−04 |
| Positive regulation of signal transduction | 0009967 | 708 | 46 | 24 | 1.14 × 10−05 | 1.00 × 10−03 |
| Regulation of lymphocyte activation | 0051249 | 287 | 25 | 9.6 | 1.20 × 10−05 | 1.00 × 10−03 |
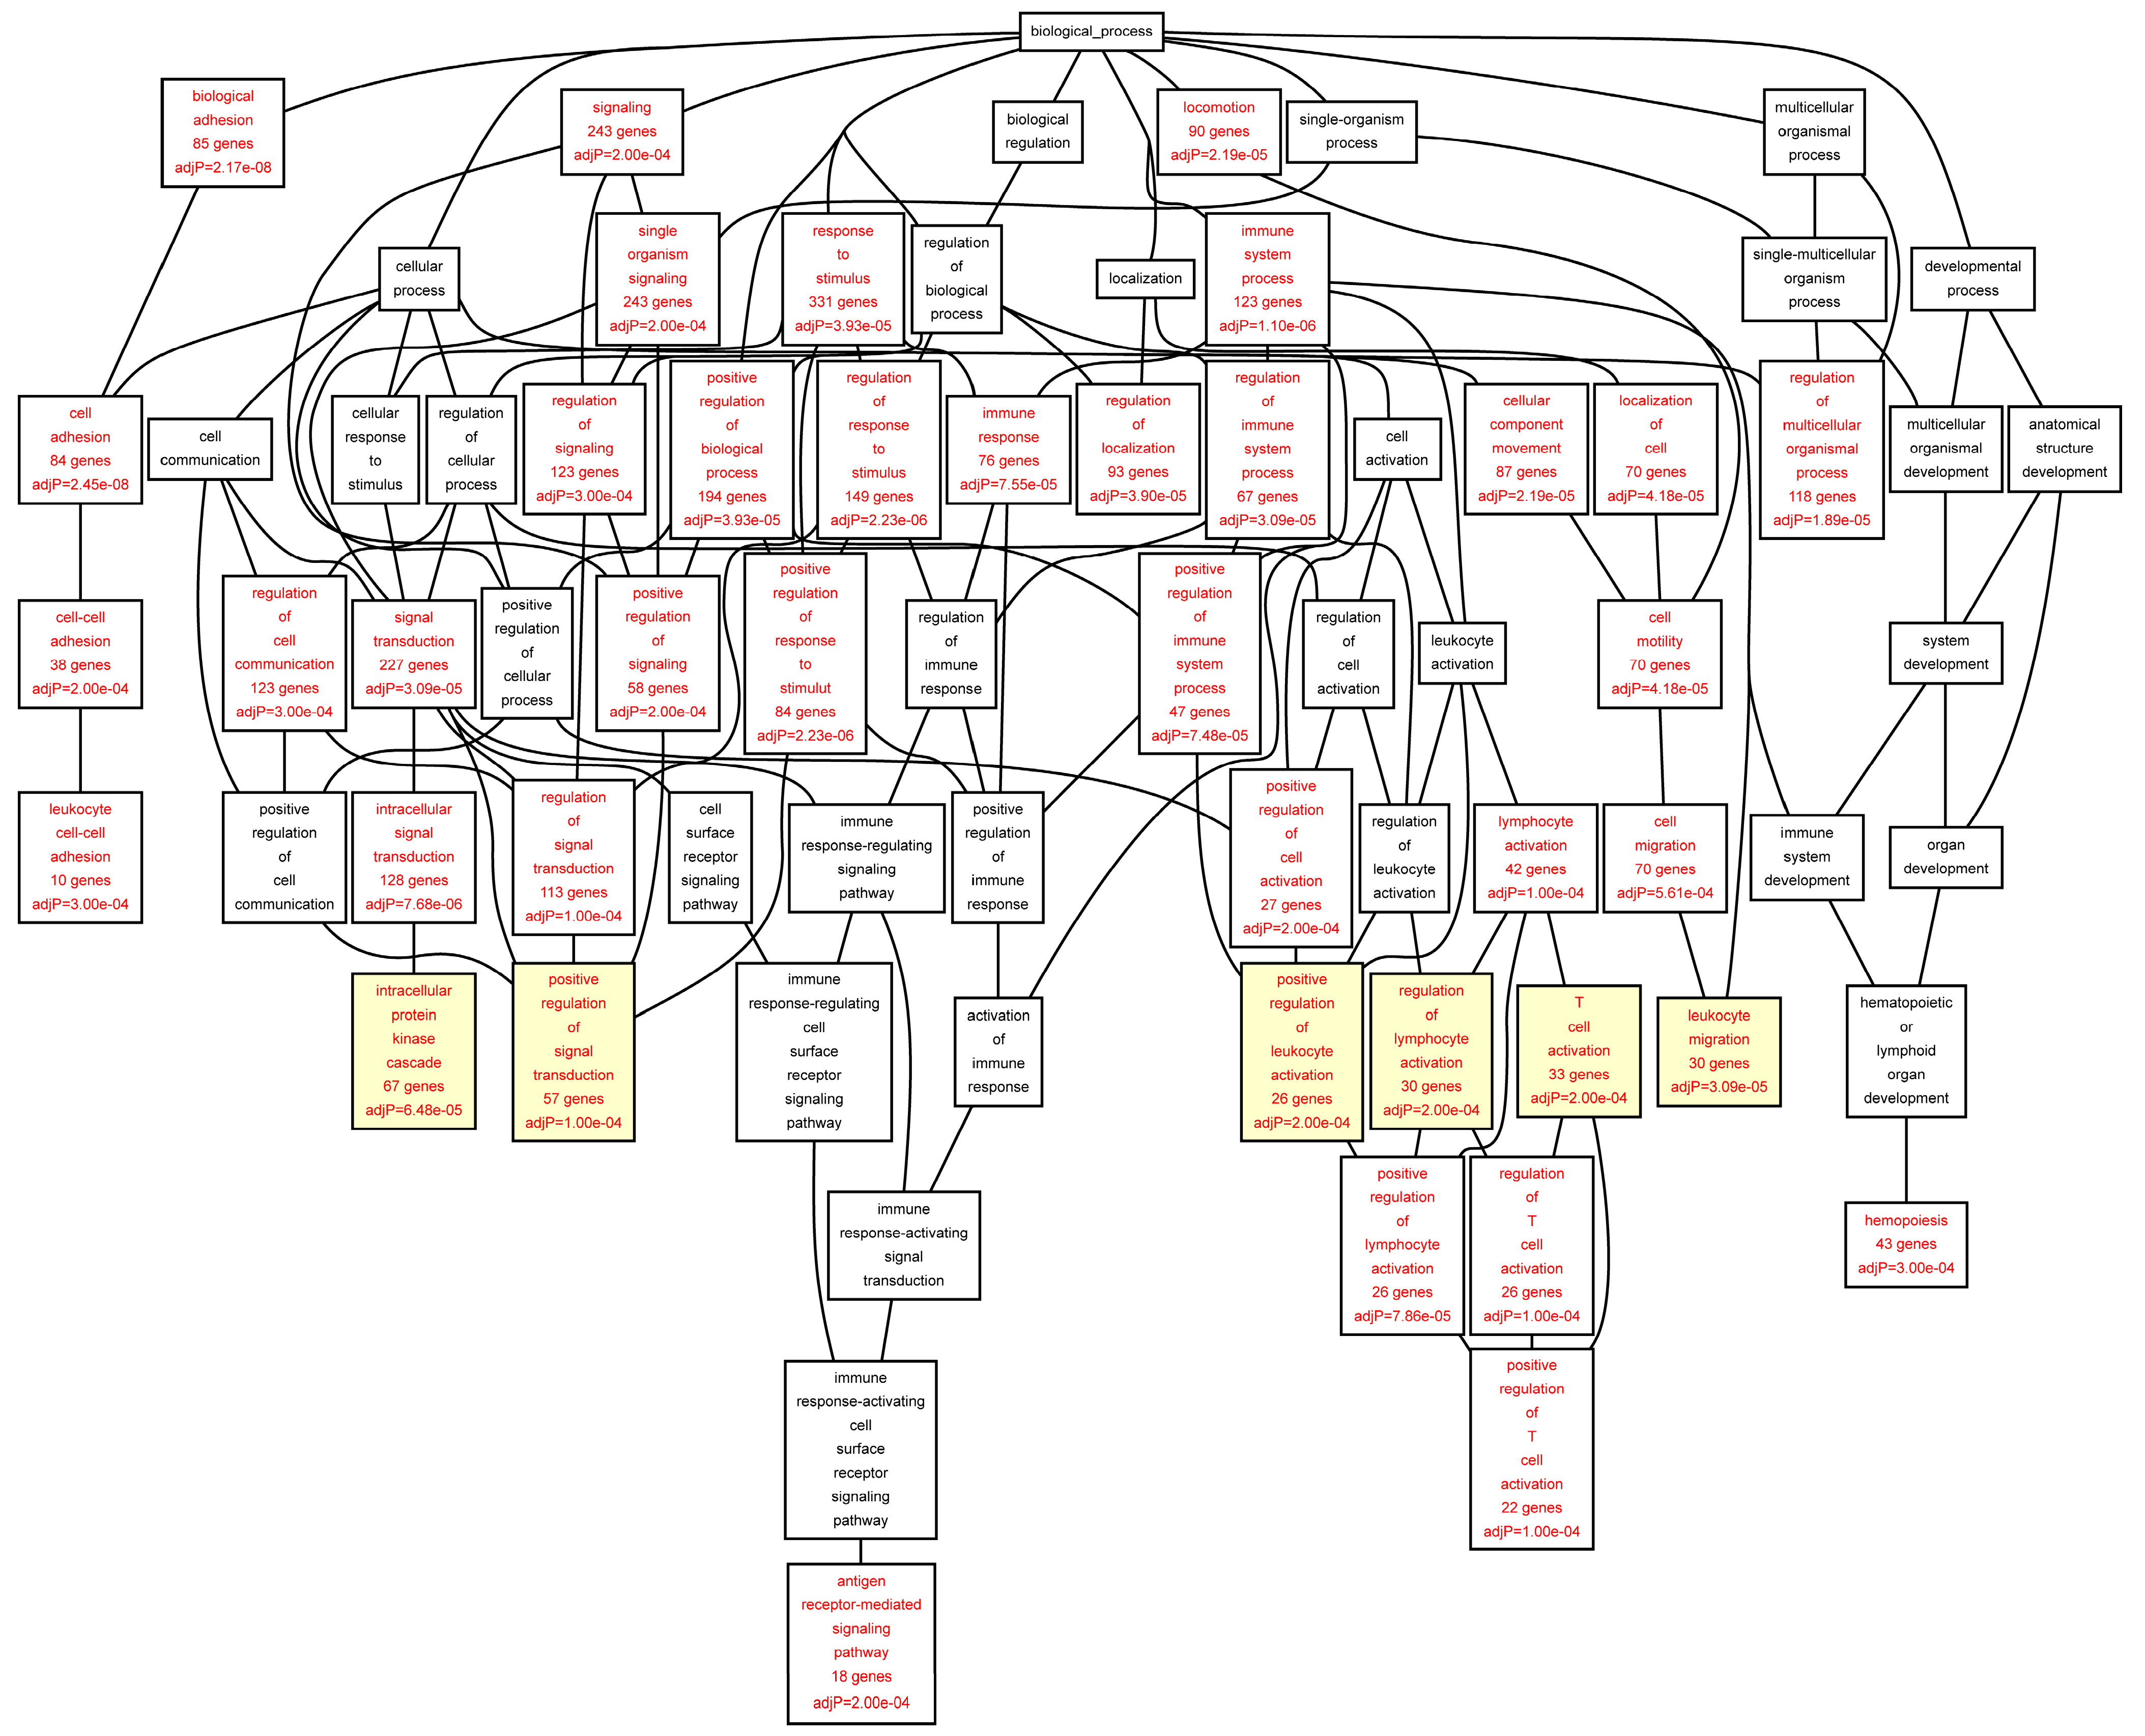
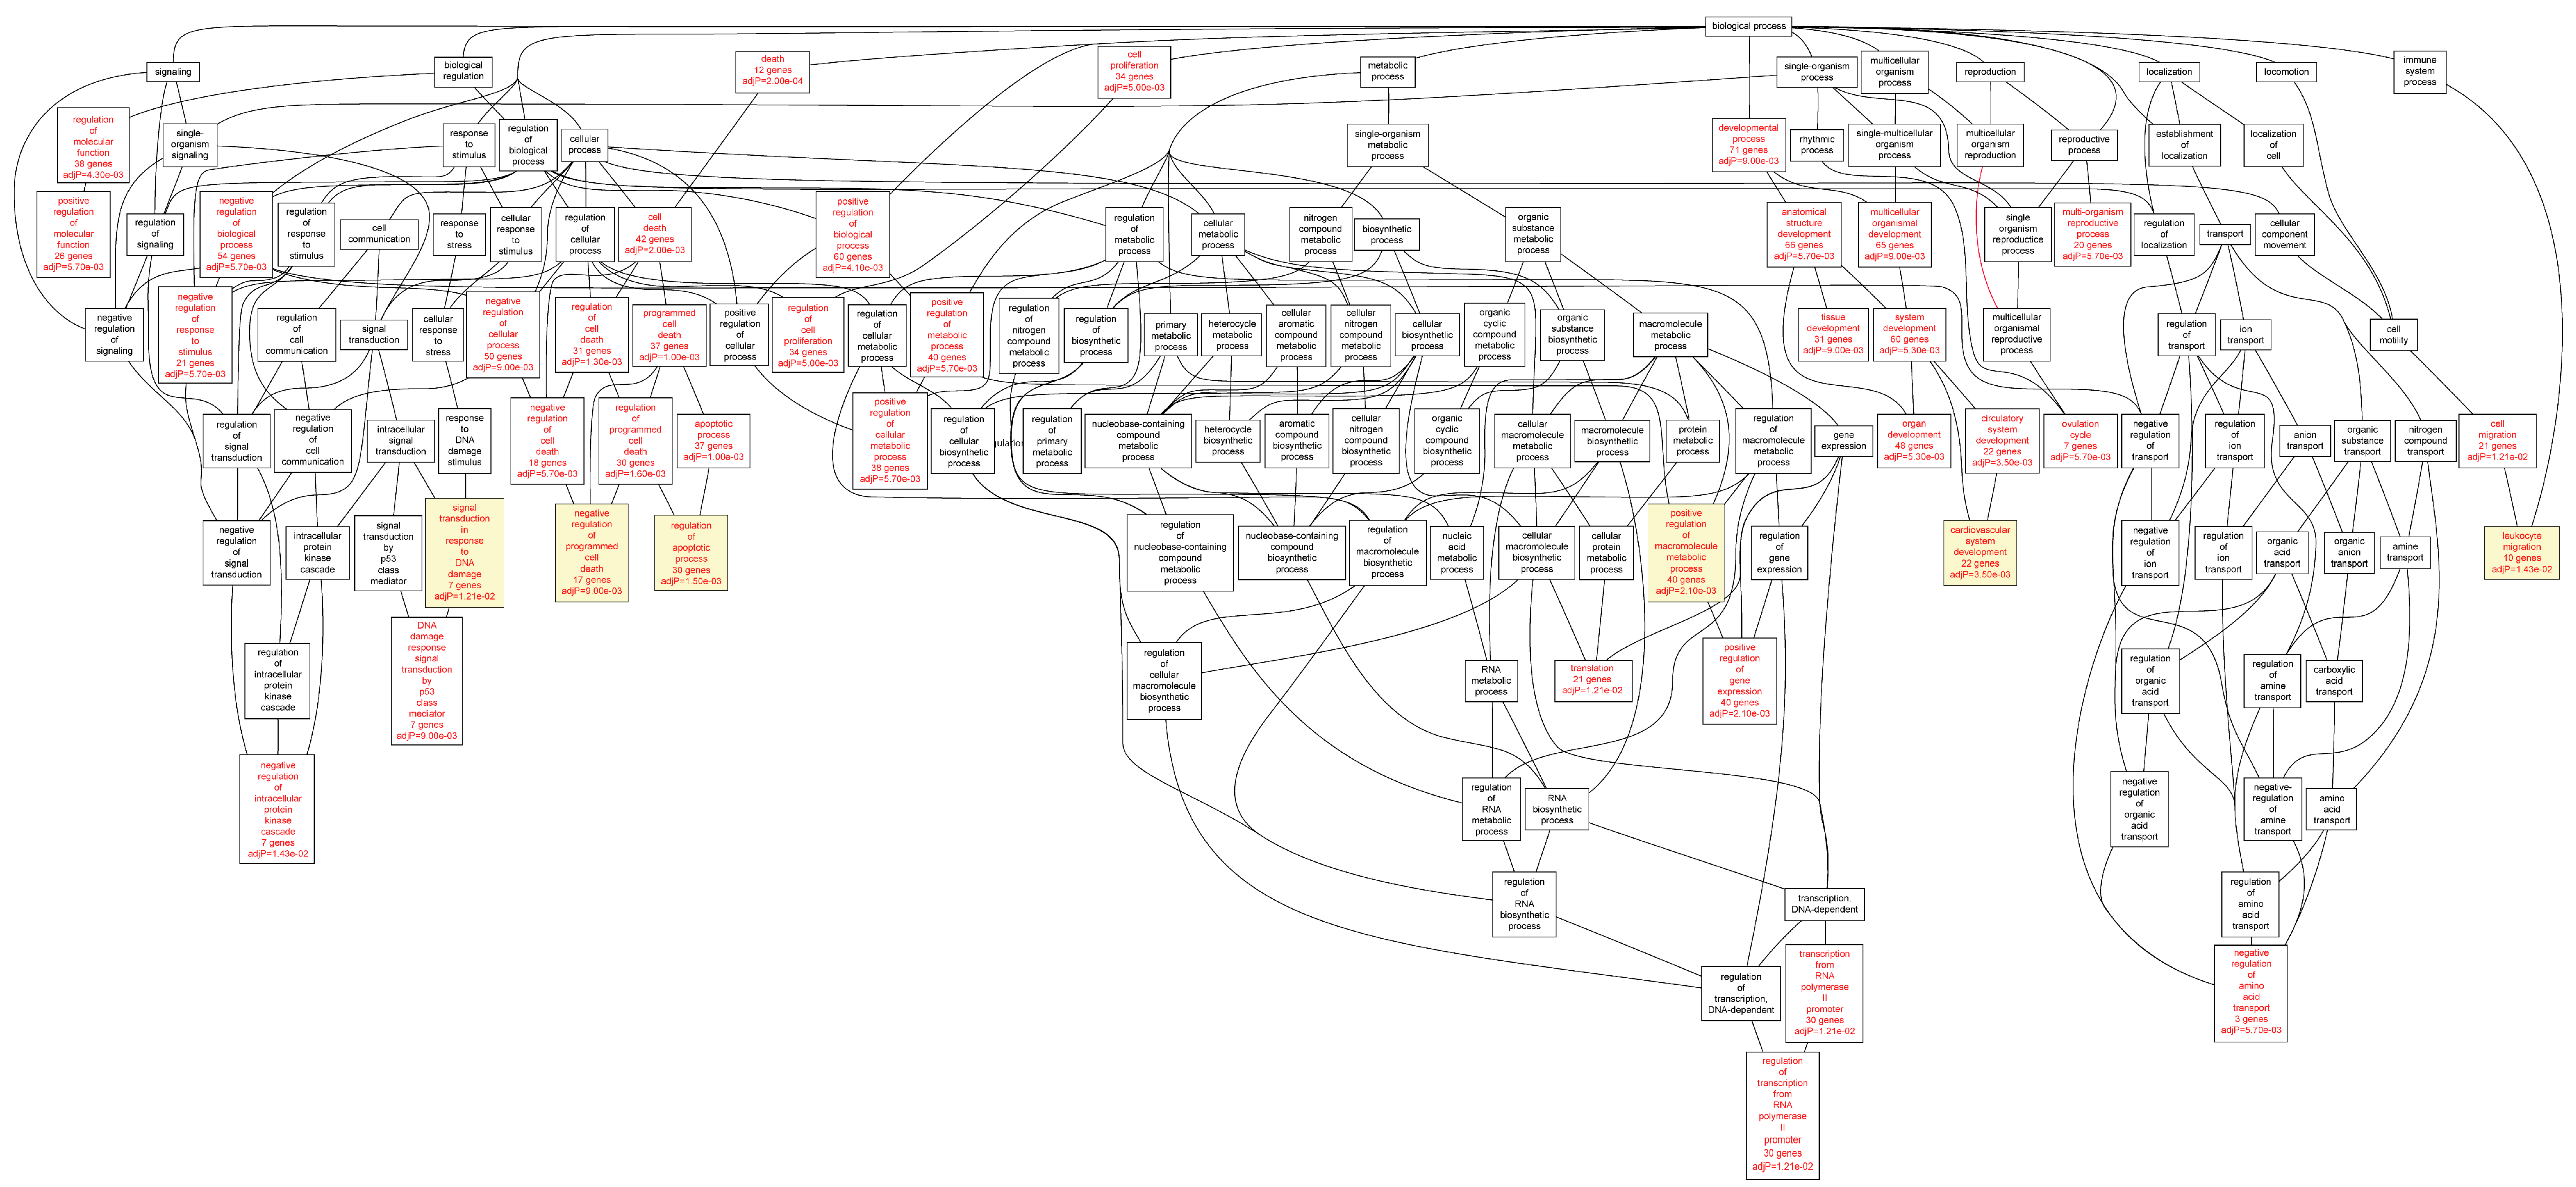
Figure 2.
Biological categories of the differentially expressed target genes of transcription factors RUNX1, ELF1, ETS2 and STAT5 in the AAA tissue. A DAG of the GO categories of the set of 711 genes containing at least one cher in AAA tissue was generated by the web application WebGestalt [
32]. Categories shown in red were significant (adjusted
p < 0.001). The categories on the 6th level of hierarchy are discussed in the text and are shown here with a yellow background. See
Table 5 and
Table S4 for additional information.
Figure 3.
Biological categories of the differentially expressed target genes of transcription factors RUNX1, ELF1, ETS2 and STAT5 in the control aorta. A DAG of the GO categories of the set of 679 genes containing at least one cher in control tissue was generated by the web application WebGestalt [
32]. Categories shown in red were significant (adjusted
p < 0.001). The categories on the 6th level of hierarchy are discussed in the text and are shown here with a yellow background. See
Table 6 and
Table S5 for additional information.
Figure 4.
Biological categories of the up-regulated target genes of transcription factors RUNX1, ELF1, ETS2 and STAT5 in the AAA tissue. A DAG of the GO categories of the set of 395 genes was generated by the web application WebGestalt [
32]. Categories shown in red were significant (adjusted
p < 0.001). The categories on the 6th level of hierarchy are discussed in the text and are shown here with a yellow background. See
Table 7 and
Table S6 for additional information.
Figure 5.
Biological categories of the down-regulated target genes of transcription factors RUNX1, ELF1, ETS2 and STAT5 in the AAA tissue. A DAG of the GO categories of the set of 551 genes was generated by the web application WebGestalt [
32]. Categories shown in red were significant (adjusted
p < 0.001). The categories on the 6th level of hierarchy are discussed in the text and are shown here with a yellow background. See
Table 8 and
Table S7 for additional information.
The differentially expressed TF target genes were also mapped to KEGG pathways (
Table 10 and
Table 11). In the AAA samples, the most enriched pathways were “
primary immunodeficiency”, “
amoebiasis”, “
hematopoietic cell lineage”, and “
B cell receptor signaling pathway” (
Table 10), whereas in the control aorta “
Fc γ R-mediated phagocytosis”, “
bacterial invasion of epithelial cells”, “
viral myocarditis” and “
arrhythmogenic right ventricular cardiomyopathy” were the top pathways (
Table 11).
Table 10.
Enriched KEGG pathways for the target genes identified in ChIP-chip with human AAA tissue and transcription factors RUNX1, ELF1, ETS2 and STAT5.
Table 10.
Enriched KEGG pathways for the target genes identified in ChIP-chip with human AAA tissue and transcription factors RUNX1, ELF1, ETS2 and STAT5.
| KEGG ID | n | Expected | N | p-Value | Pathway Name |
|---|
| hsa05340 | 9 | 1.89 | 35 | 0.00001 | Primary immunodeficiency |
| hsa05146 | 14 | 5.74 | 106 | 0.00052 | Amoebiasis |
| hsa04640 | 12 | 4.76 | 88 | 0.00081 | Hematopoietic cell lineage |
| hsa04662 | 10 | 4.06 | 75 | 0.0021 | B cell receptor signaling pathway |
| hsa05414 | 11 | 4.87 | 90 | 0.0031 | Dilated cardiomyopathy |
| hsa05410 | 10 | 4.49 | 83 | 0.0048 | Hypertrophic cardiomyopathy (HCM) |
| hsa04510 | 19 | 10.82 | 200 | 0.005 | Focal adhesion |
| hsa05150 | 7 | 3.03 | 56 | 0.010 | Staphylococcus aureus infection |
| hsa05142 | 11 | 5.63 | 104 | 0.010 | Chagas disease (American trypanosomiasis) |
| hsa04614 | 3 | 0.92 | 17 | 0.011 | Renin-angiotensin system |
| hsa04330 | 6 | 2.54 | 47 | 0.012 | Notch signaling pathway |
| hsa04666 | 10 | 5.14 | 95 | 0.013 | Fc γ R-mediated phagocytosis |
| hsa05222 | 9 | 4.60 | 85 | 0.016 | Small cell lung cancer |
| hsa04520 | 8 | 3.95 | 73 | 0.016 | Adherens junction |
| hsa05220 | 8 | 3.95 | 73 | 0.016 | Chronic myeloid leukemia |
| hsa00740 | 2 | 0.60 | 11 | 0.019 | Riboflavin metabolism |
| hsa04380 | 12 | 6.93 | 128 | 0.020 | Osteoclast differentiation |
| hsa04810 | 18 | 11.58 | 214 | 0.022 | Regulation of actin cytoskeleton |
| hsa05214 | 7 | 3.52 | 65 | 0.023 | Glioma |
| hsa04670 | 11 | 6.33 | 117 | 0.024 | Leukocyte transendothelial migration |
| hsa04960 | 5 | 2.27 | 42 | 0.024 | Aldosterone-regulated sodium reabsorption |
| hsa01040 | 3 | 1.14 | 21 | 0.024 | Biosynthesis of unsaturated fatty acids |
| hsa04664 | 8 | 4.28 | 79 | 0.026 | Fc epsilon RI signaling pathway |
| hsa00524 | 1 | 0.27 | 5 | 0.026 | Butirosin and neomycin biosynthesis |
| hsa04142 | 11 | 6.55 | 121 | 0.030 | Lysosome |
| hsa04660 | 10 | 5.85 | 108 | 0.031 | T cell receptor signaling pathway |
| hsa04514 | 12 | 7.36 | 136 | 0.032 | Cell adhesion molecules (CAMs) |
| hsa05221 | 6 | 3.14 | 58 | 0.036 | Acute myeloid leukemia |
| hsa05100 | 7 | 3.84 | 71 | 0.037 | Bacterial invasion of epithelial cells |
| hsa00061 | 1 | 0.32 | 6 | 0.038 | Fatty acid biosynthesis |
| hsa04512 | 8 | 4.60 | 85 | 0.039 | ECM-receptor interaction |
| hsa04722 | 11 | 6.87 | 127 | 0.041 | Neurotrophin signaling pathway |
| hsa05140 | 7 | 3.95 | 73 | 0.042 | Leishmaniasis |
| hsa04012 | 8 | 4.71 | 87 | 0.045 | ErbB signaling pathway |
| hsa05412 | 7 | 4.01 | 74 | 0.045 | Arrhythmogenic right ventricular cardiomyopathy (ARVC) |
| hsa05200 | 24 | 17.70 | 327 | 0.049 | Pathways in cancer |
| hsa05131 | 6 | 3.36 | 62 | 0.049 | Shigellosis |
| hsa00534 | 3 | 1.41 | 26 | 0.049 | Glycosaminoglycan biosynthesis—Heparan sulfate |
| hsa04062 | 15 | 10.23 | 189 | 0.049 | Chemokine signaling pathway |
Table 11.
Enriched KEGG pathways for the target genes identified in ChIP-chip with human non-aneurysmal infrarenal aorta and transcription factors RUNX1, ELF1, ETS2 and STAT5.
Table 11.
Enriched KEGG pathways for the target genes identified in ChIP-chip with human non-aneurysmal infrarenal aorta and transcription factors RUNX1, ELF1, ETS2 and STAT5.
| KEGG ID | n | Expected | N | p-Value | Pathway Name |
|---|
| hsa04666 | 13 | 5.29 | 95 | 0.00070 | Fc γ R-mediated phagocytosis |
| hsa05100 | 10 | 3.95 | 71 | 0.00170 | Bacterial invasion of epithelial cells |
| hsa05416 | 9 | 4.01 | 72 | 0.0061 | Viral myocarditis |
| hsa05412 | 9 | 4.12 | 74 | 0.0074 | Arrhythmogenic right ventricular cardiomyopathy (ARVC) |
| hsa00640 | 5 | 1.78 | 32 | 0.0075 | Propanoate metabolism |
| hsa04810 | 20 | 11.91 | 214 | 0.0076 | Regulation of actin cytoskeleton |
| hsa04662 | 9 | 4.17 | 75 | 0.0081 | B cell receptor signaling pathway |
| hsa05340 | 5 | 1.95 | 35 | 0.012 | Primary immunodeficiency |
| hsa04510 | 18 | 11.13 | 200 | 0.015 | Focal adhesion |
| hsa05410 | 9 | 4.62 | 83 | 0.016 | Hypertrophic cardiomyopathy (HCM) |
| hsa04520 | 8 | 4.06 | 73 | 0.019 | Adherens junction |
| hsa05414 | 9 | 5.01 | 90 | 0.027 | Dilated cardiomyopathy |
| hsa00524 | 1 | 0.28 | 5 | 0.028 | Butirosin and neomycin biosynthesis |
| hsa05110 | 6 | 3.01 | 54 | 0.029 | Vibrio cholerae infection |
| hsa05120 | 7 | 3.78 | 68 | 0.034 | Epithelial cell signaling in Helicobacter pylori infection |
| hsa00061 | 1 | 0.33 | 6 | 0.040 | Fatty acid biosynthesis |
We used the IPA
® tool to elucidate the interactions between the target genes of the four TFs to investigate how these genes may contribute to the biological mechanisms of AAA. The IPA’s Core Analysis generated 25 networks (
Table S9), the top five of which were (1) “
cellular function and maintenance,
hematological system development and function,
hematopoiesis” (score: 41); (2) “
respiratory system development and function,
tissue morphology,
cardiovascular system development and function” (score: 41); (3) “
cell morphology,
cell-to-cell signaling and interaction,
developmental disorder” (score: 39); (4) “
embryonic development,
cellular function and maintenance,
hematological system development and function” (score: 36); and (5) “
cellular function and maintenance,
cell death and survival,
cardiovascular disease”(score: 34). We then merged the networks into a single interaction figure indicating the genes with significantly elevated or decreased expression levels according to our prior microarray-based mRNA expression study (
Figure 6) [
7].
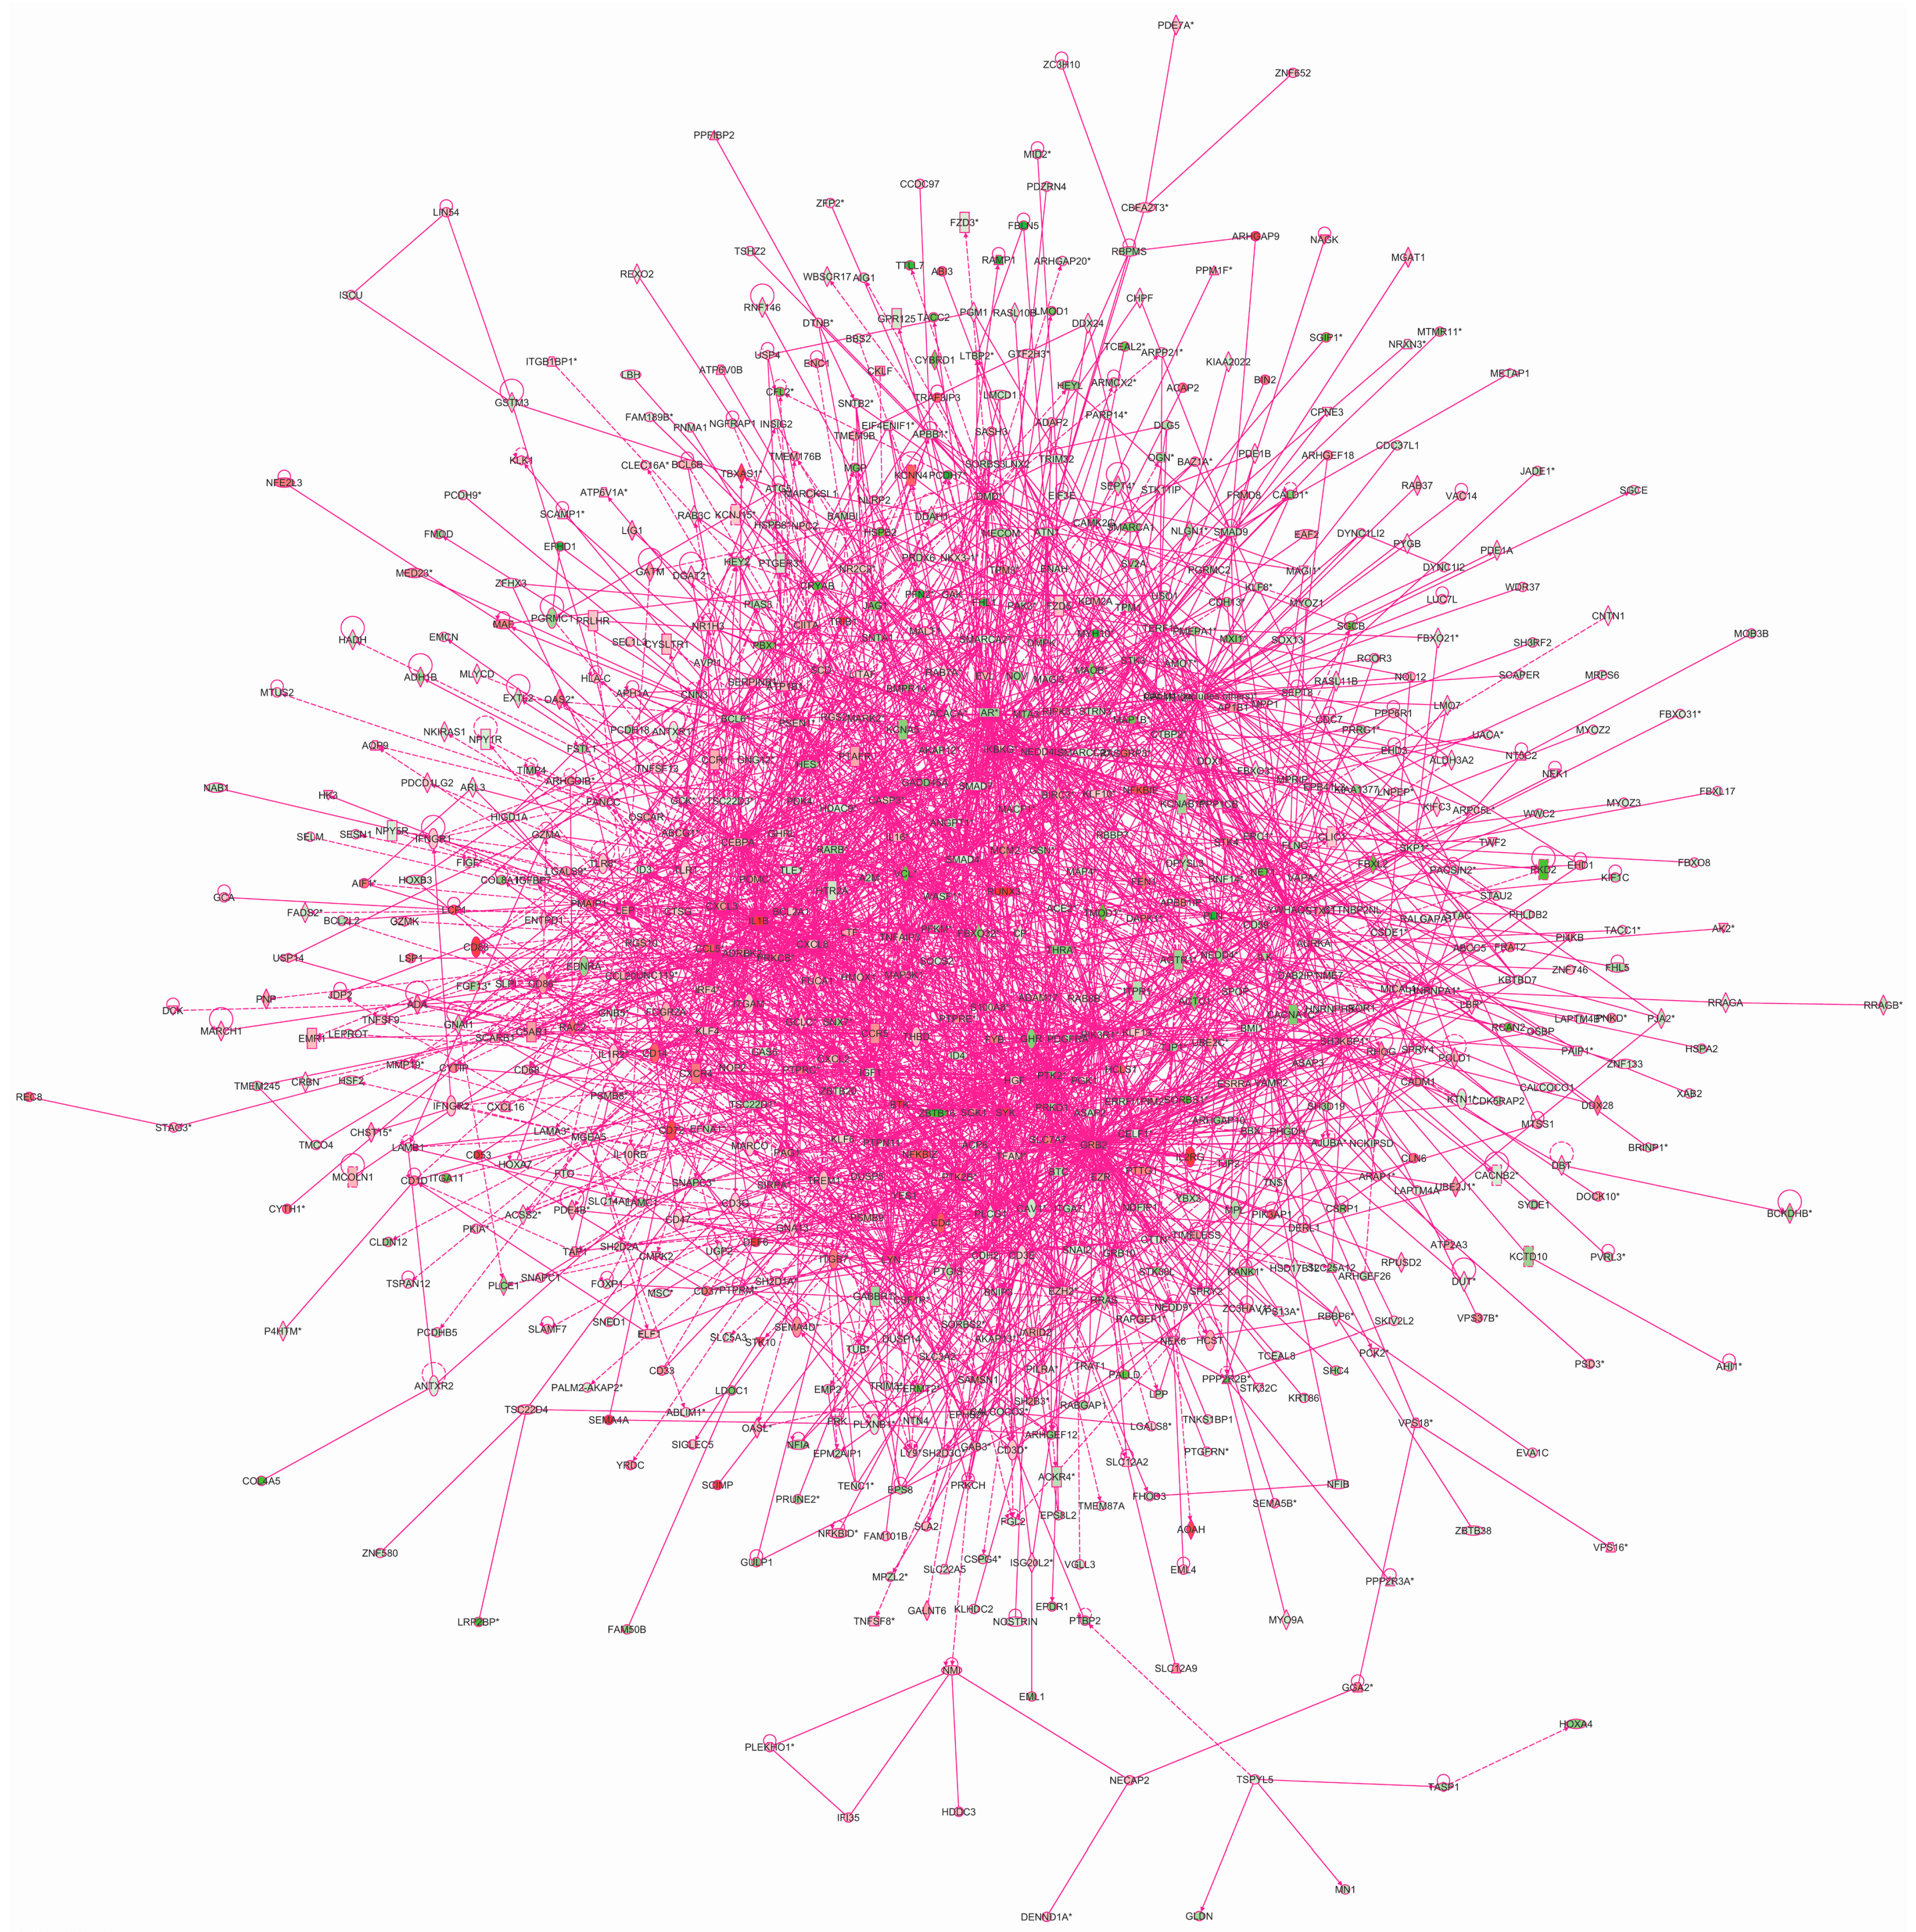
Figure 6.
Network of interactions of the transcription factor target genes. Qiagen’s Ingenuity Pathway Analysis
® tool was used to analyze the genes with chers based on the current study using ChIP-chip. This analysis yielded 25 networks, which were then merged. Green molecules showed decreased and red increased mRNA expression in AAA in our previous microarray expression analysis [
7]. Molecules are represented as nodes, and the biological relationship between two nodes is represented as a line. Solid lines represent direct interactions and dashed lines indirect interactions. All lines are supported by at least one literature citation or from canonical information stored in the Ingenuity Pathways Knowledge Base. Nodes are displayed using various shapes that represent the functional class of the gene product. See
Table S9 for listing of networks.
We carried out additional functional analyses with the IPA® tool. The top canonical pathways were: (1) “p70S6K signaling” (p = 2.52 × 10−06); (2) “CCR5 signaling in macrophages” (p = 4.88 × 10−06); (3) “protein kinase A signaling” (p = 5.15 × 10−06); (4) “hepatic fibrosis/hepatic stellate cell activation” (p = 5.18 × 10−06); and (5) “RhoA signaling” (p = 1.37 × 10−05). The five most significant “molecular and cellular functions” were: (1) “cellular development” (378 molecules); (2) “cellular growth and proliferation” (406 molecules); (3) “cell morphology” (319 molecules); (4) “cellular movement”(266 molecules) and (5) “cellular function and maintenance” (380 molecules).
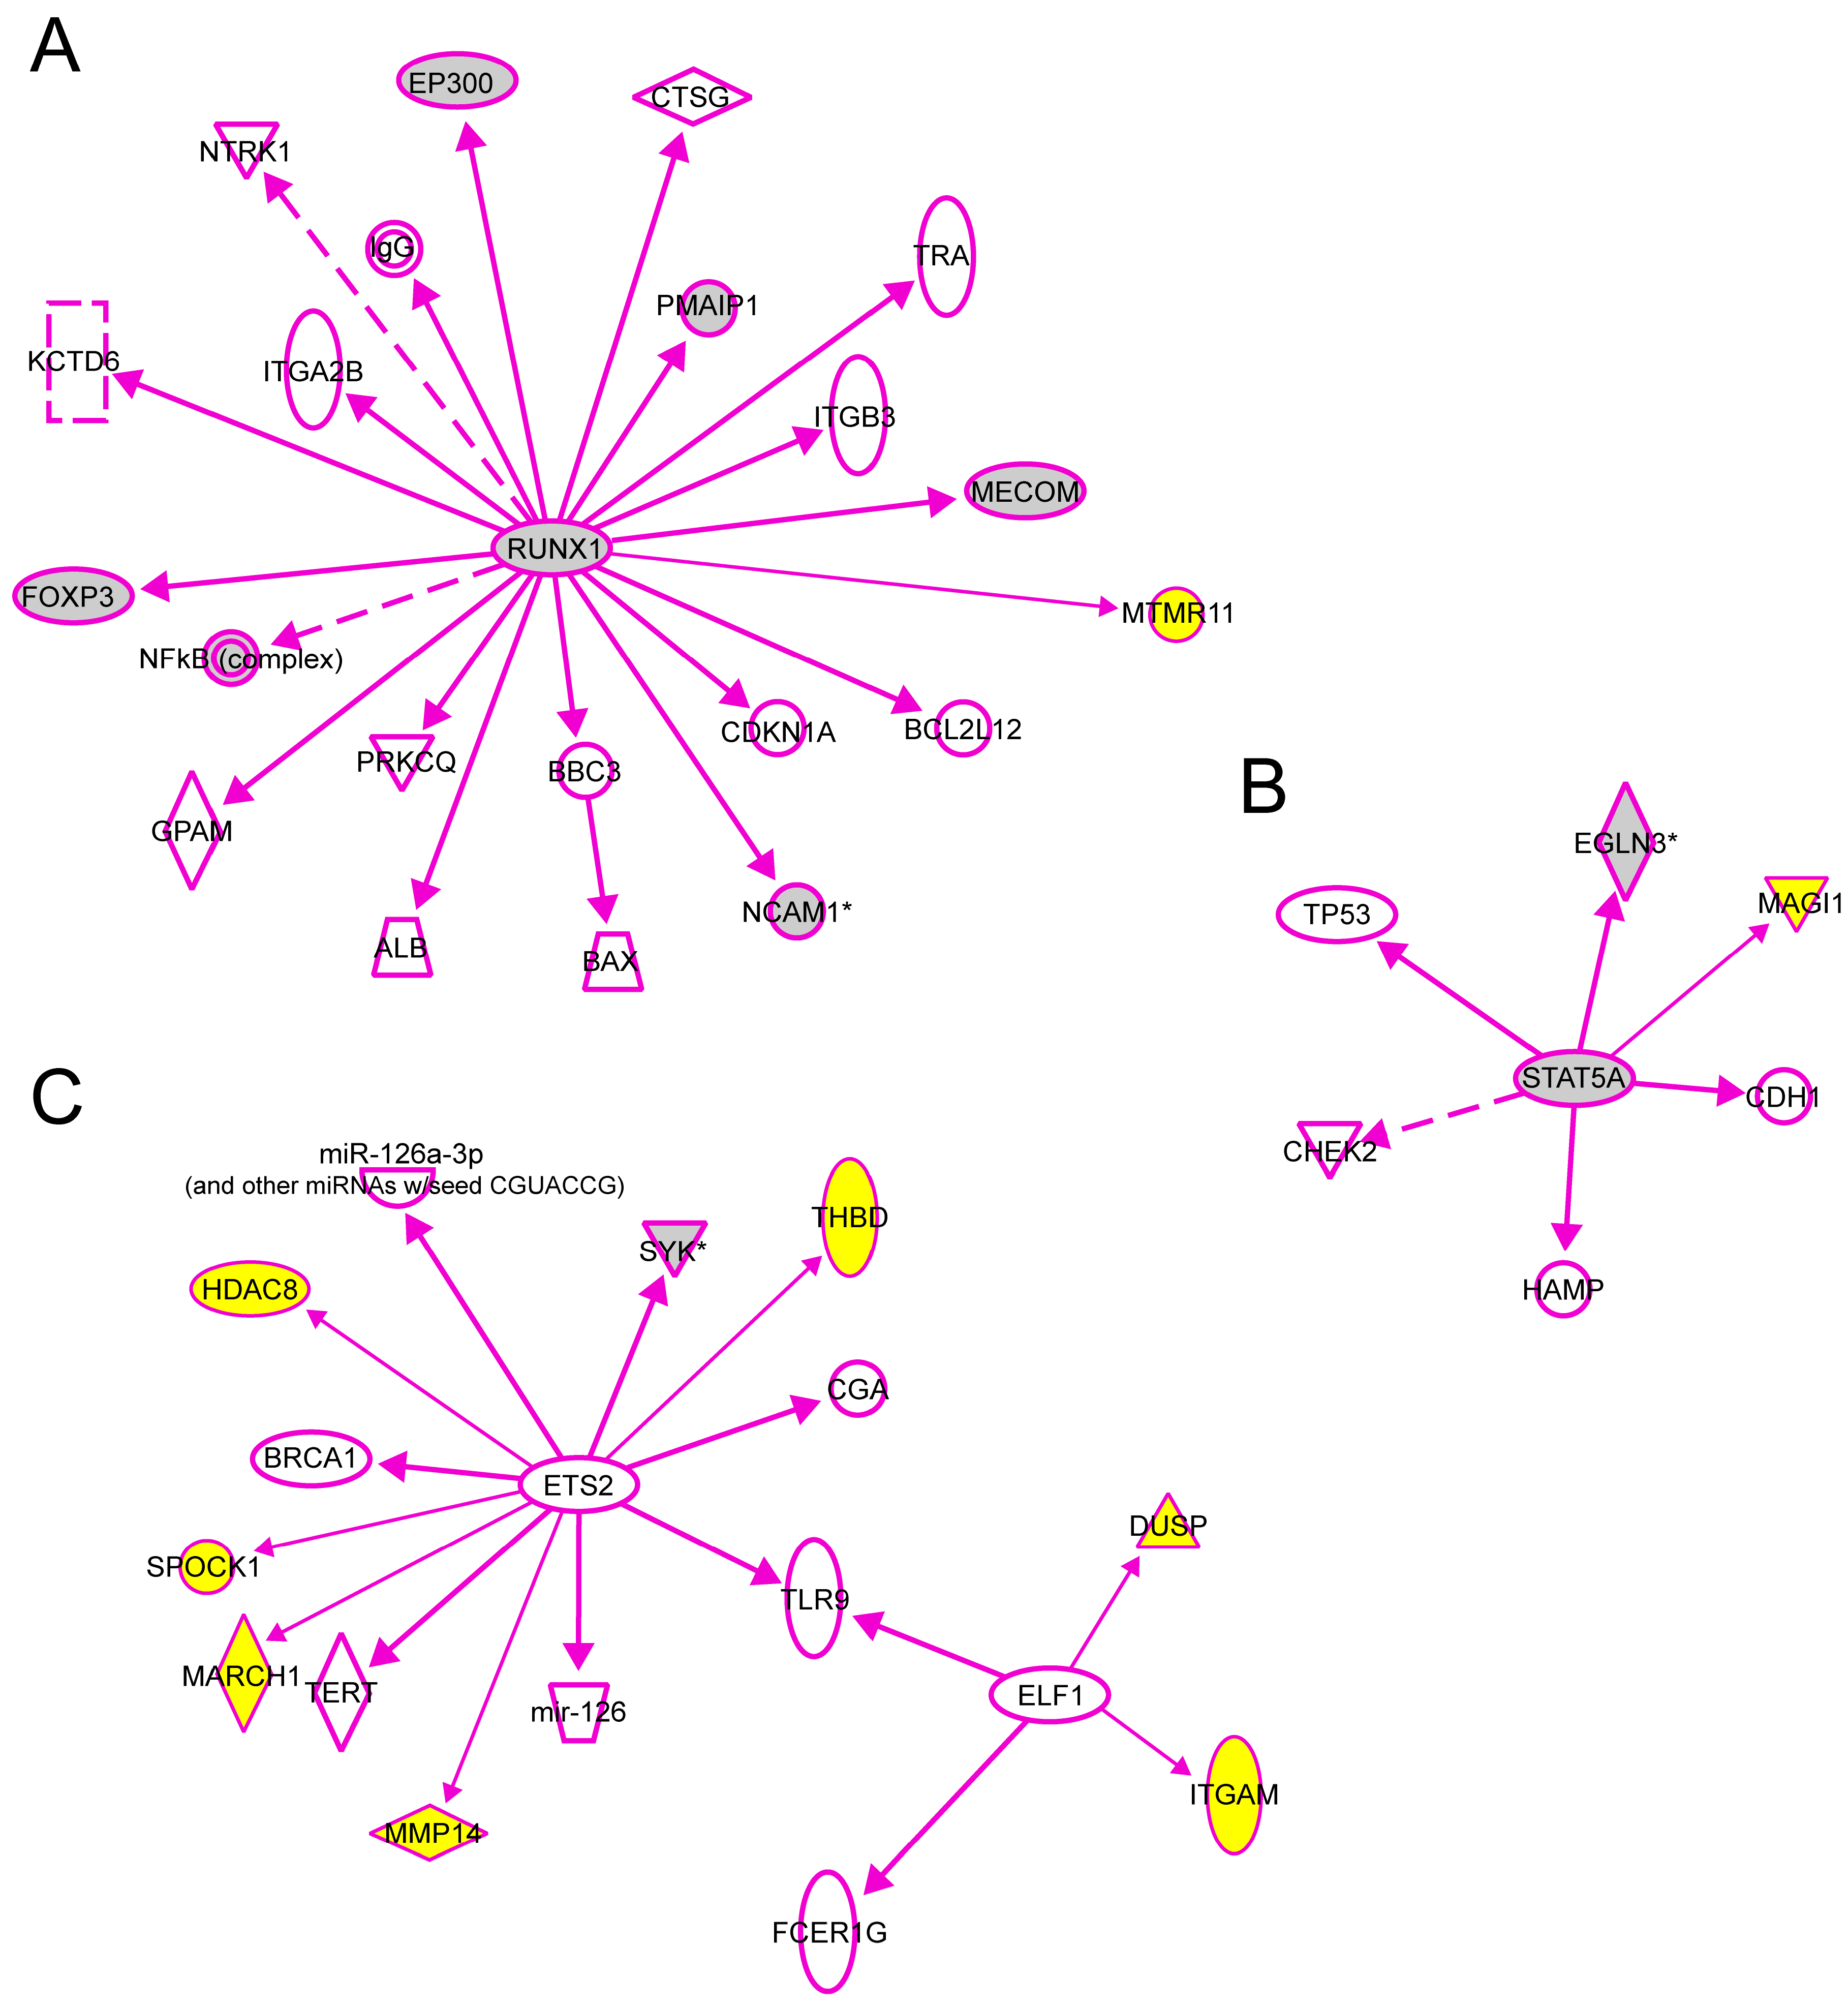
We also used the IPA tool to demonstrate the downstream interactions of TFs to genes with experimental evidence that their transcription is regulated directly by one of the TFs studied here. There were a total of 20 genes regulated directly by RUNX1, 7 with ETS2, 5 with STAT5 and 2 with ELF1 (
Figure 7). We then added to these interaction graphs shown in
Figure 7 the genes
MTMR11,
DUSP10,
ITGAM,
MARCH1,
HDAC8,
MMP14,
MAGI1,
THBD and
SPOCK1 (shown with yellow background in
Figure 7) identified as target genes for these TFs in the human aorta in the current study using ChIP-chip and q-PCR. Eight of the previously known target genes (gray symbols) were also identified in the current ChIP-chip dataset. Two of the target genes shown in
Figure 7 (
SYK and
PMAIP1) had significantly different mRNA levels between AAA and control aorta [
7].
RUNX1, ELF1, ETS2, and STAT5 are important regulators of immune cell proliferation, differentiation, and activation [
14,
34,
35,
36]. Further investigation on the pattern of RUNX1, ETS2, and STAT5 expression early in AAA pathogenesis may clarify these roles. RUNX1, STAT5, and ELF1 may play crucial roles in the immune response seen in AAA.
Several intriguing observations of genes with associated specific chip enriched regions may have relevance to AAA pathogenesis. Two RUNX1 and one ETS2 chromatin enriched regions were associated with CD59, a suppressor of the complement response, in control samples. Only one RUNX1 chip-enriched region was present in the AAA (
Table S1). Inhibition of CD59 attenuates aneurysm formation in the angiotensin mouse model of AAA [
37]. DUSP10 up-regulated in AAA had both ETS2 and ELF1 binding sites (
Table 4;
Table S1). DUSP10 (Dual specificity protein phosphatase 10) regulates magnitude of p38 activity in response to oxidative stress in HEK 293-T cells [
38]. ETS2 was enriched near the MMP14 locus (
Table 4;
Table S1). Previously ETS protein inhibitors were suggested to reduce MMP expression [
39]. Further investigation may determine if this pattern represents a cell type specific transcription factor binding pattern or if it represents combinatorial control of gene expression. Other genes found in our ChIP-chip analysis are involved in immune activation and apoptosis; however a complete discussion on the relevance of these genes to AAA is outside the scope of our analysis (
Figure 2 and
Figure 8).
Figure 7.
Experimentally validated direct interactions of transcription factors (
A) RUNX1, (
B) STAT5 and (
C) ELF1, ETS2 with their target genes. Qiagen’s Ingenuity Pathway Analysis
® tool was used to demonstrate the downstream interactions of TFs to genes with experimental evidence that their transcription is regulated directly by one of the TFs studied here. In addition, the genes
MTMR11,
DUSP10,
ITGAM,
MARCH1,
HDAC8,
MMP14,
MAGI1,
THBD and
SPOCK1 identified as target genes for these TFs in human aorta in the current study using ChIP-chip and q-PCR were also included (yellow symbols). Eight of the previously known target genes (gray symbols) were also identified in the current ChIP-chip dataset. Two of the target genes shown in this figure (
SYK and
PMAIP1) had significantly different mRNA levels between AAA and control aorta [
7].
Figure 8.
Biological categories of the target genes of transcription factors RUNX1, ELF1, ETS2 and STAT5 that were also differentially expressed in the AAA neck region. The gene list was obtained from a previously published study on RNA samples isolated from the neck regions of AAAs [
40]. A DAG of the GO categories of the set of 282 genes was generated by the web application WebGestalt [
32]. Categories shown in red were significant (adjusted
p < 0.001). The categories on the 6th level of hierarchy are discussed in the text and are shown here with a yellow background. See
Tables 12 and S11 for additional information.
2.6. Limitations of the Study
We realize that experimental cataloging of the target genes of each TF is only the first step in the process of understanding transcriptional regulation contributing to human diseases [
10,
41]. The binding of TFs to their target sequences can be influenced by many factors including the specificity of the binding site sequence, differences in the chromatin structure, and availability of co-factors, including co-activators and repressors increasing the complexity of the transcriptional control [
42]. The chromatin structure can be influenced by post-translational histone modifications and DNA methylation [
42]. According to previous studies, members of the ETS and STAT protein families often bind to relatively weak binding sites because they are part of protein complexes, which relaxes the requirement for a strong TFBS [
13,
43]. ELF1, although a member of the ETS TF family, is an exception in that it has stricter core binding motif requirements [
13,
44]. RUNX1 is known to form a complex with CBFB (core-binding factor, beta subunit), which does not, however, bind directly to the DNA and primarily stabilizes RUNX1 binding [
45].
As pointed out by Todeschini
et al. [
46] in a recent review article, the “footprints of TF binding” (as they called them) need to be combined with dynamic information to distinguish specific functional binding of TFs with a direct consequence in gene expression from non-functional binding, either specific or non-specific, without influencing the transcriptional control. ChIP-chip results show where TFs bind, but provide no kinetic information on the binding. They are influenced by experimental details such as how long the chromatin was exposed to the fixative as well as bioinformatics tools and algorithms used to detect the peaks [
46].
In the current study, we chose four TFs for the ChIP-chip based on our previous
in silico analyses [
8]. It is, however, likely that many additional TFs are important in the transcriptional regulation of human AAA. Some of these TFs are yet to be discovered as TFs [
9]. In addition, performing ChIP-seq, in which the ChIP is followed by whole genome sequencing would allow cataloging of all TFBSs and not limiting to those present on the microarray used for hybridization [
47].
The results discussed here are based on experiments with human aortic tissue samples from patients affected with AAA in the infrarenal aorta and age- and sex-matched controls without AAA. We considered it important to use the aortic tissue, since large differences have been reported in the number of putative binding sites for different TFs and cell types [
42]. We acknowledge the limitations of the study due to limited availability of human aortic tissue from AAA patients and that samples can only be obtained at the end-stage of the disease when the AAA is large enough to warrant a surgical repair. At this stage it is difficult to collect samples from the different layers (intima, media and adventitia) of the aortic wall in large enough quantities for the type of experiments described here, due to extensive degradation and remodeling of the aorta. Nevertheless, the results provide intriguing preliminary results on the transcriptional control of gene expression in the human AAA. By combining the ChIP-chip results with the available mRNA expression profiles for AAA and control aorta we were able to generate more meaningful results related to the transcriptional control of gene expression in human AAA [
48].


