
The Changes of Angiogenesis and Immune Cell Infiltration in the Intra- and Peri-Tumoral Melanoma Microenvironment

Abstract
:1. Introduction
2. Results and Discussion
2.1. Results

| Evaluated Parameters | Melanomas (n = 82) | Nevi (n = 25) | p | ||||||||
|---|---|---|---|---|---|---|---|---|---|---|---|
| Median | Q1 | Q3 | Min. | Max. | Median | Q1 | Q3 | Min. | Max. | ||
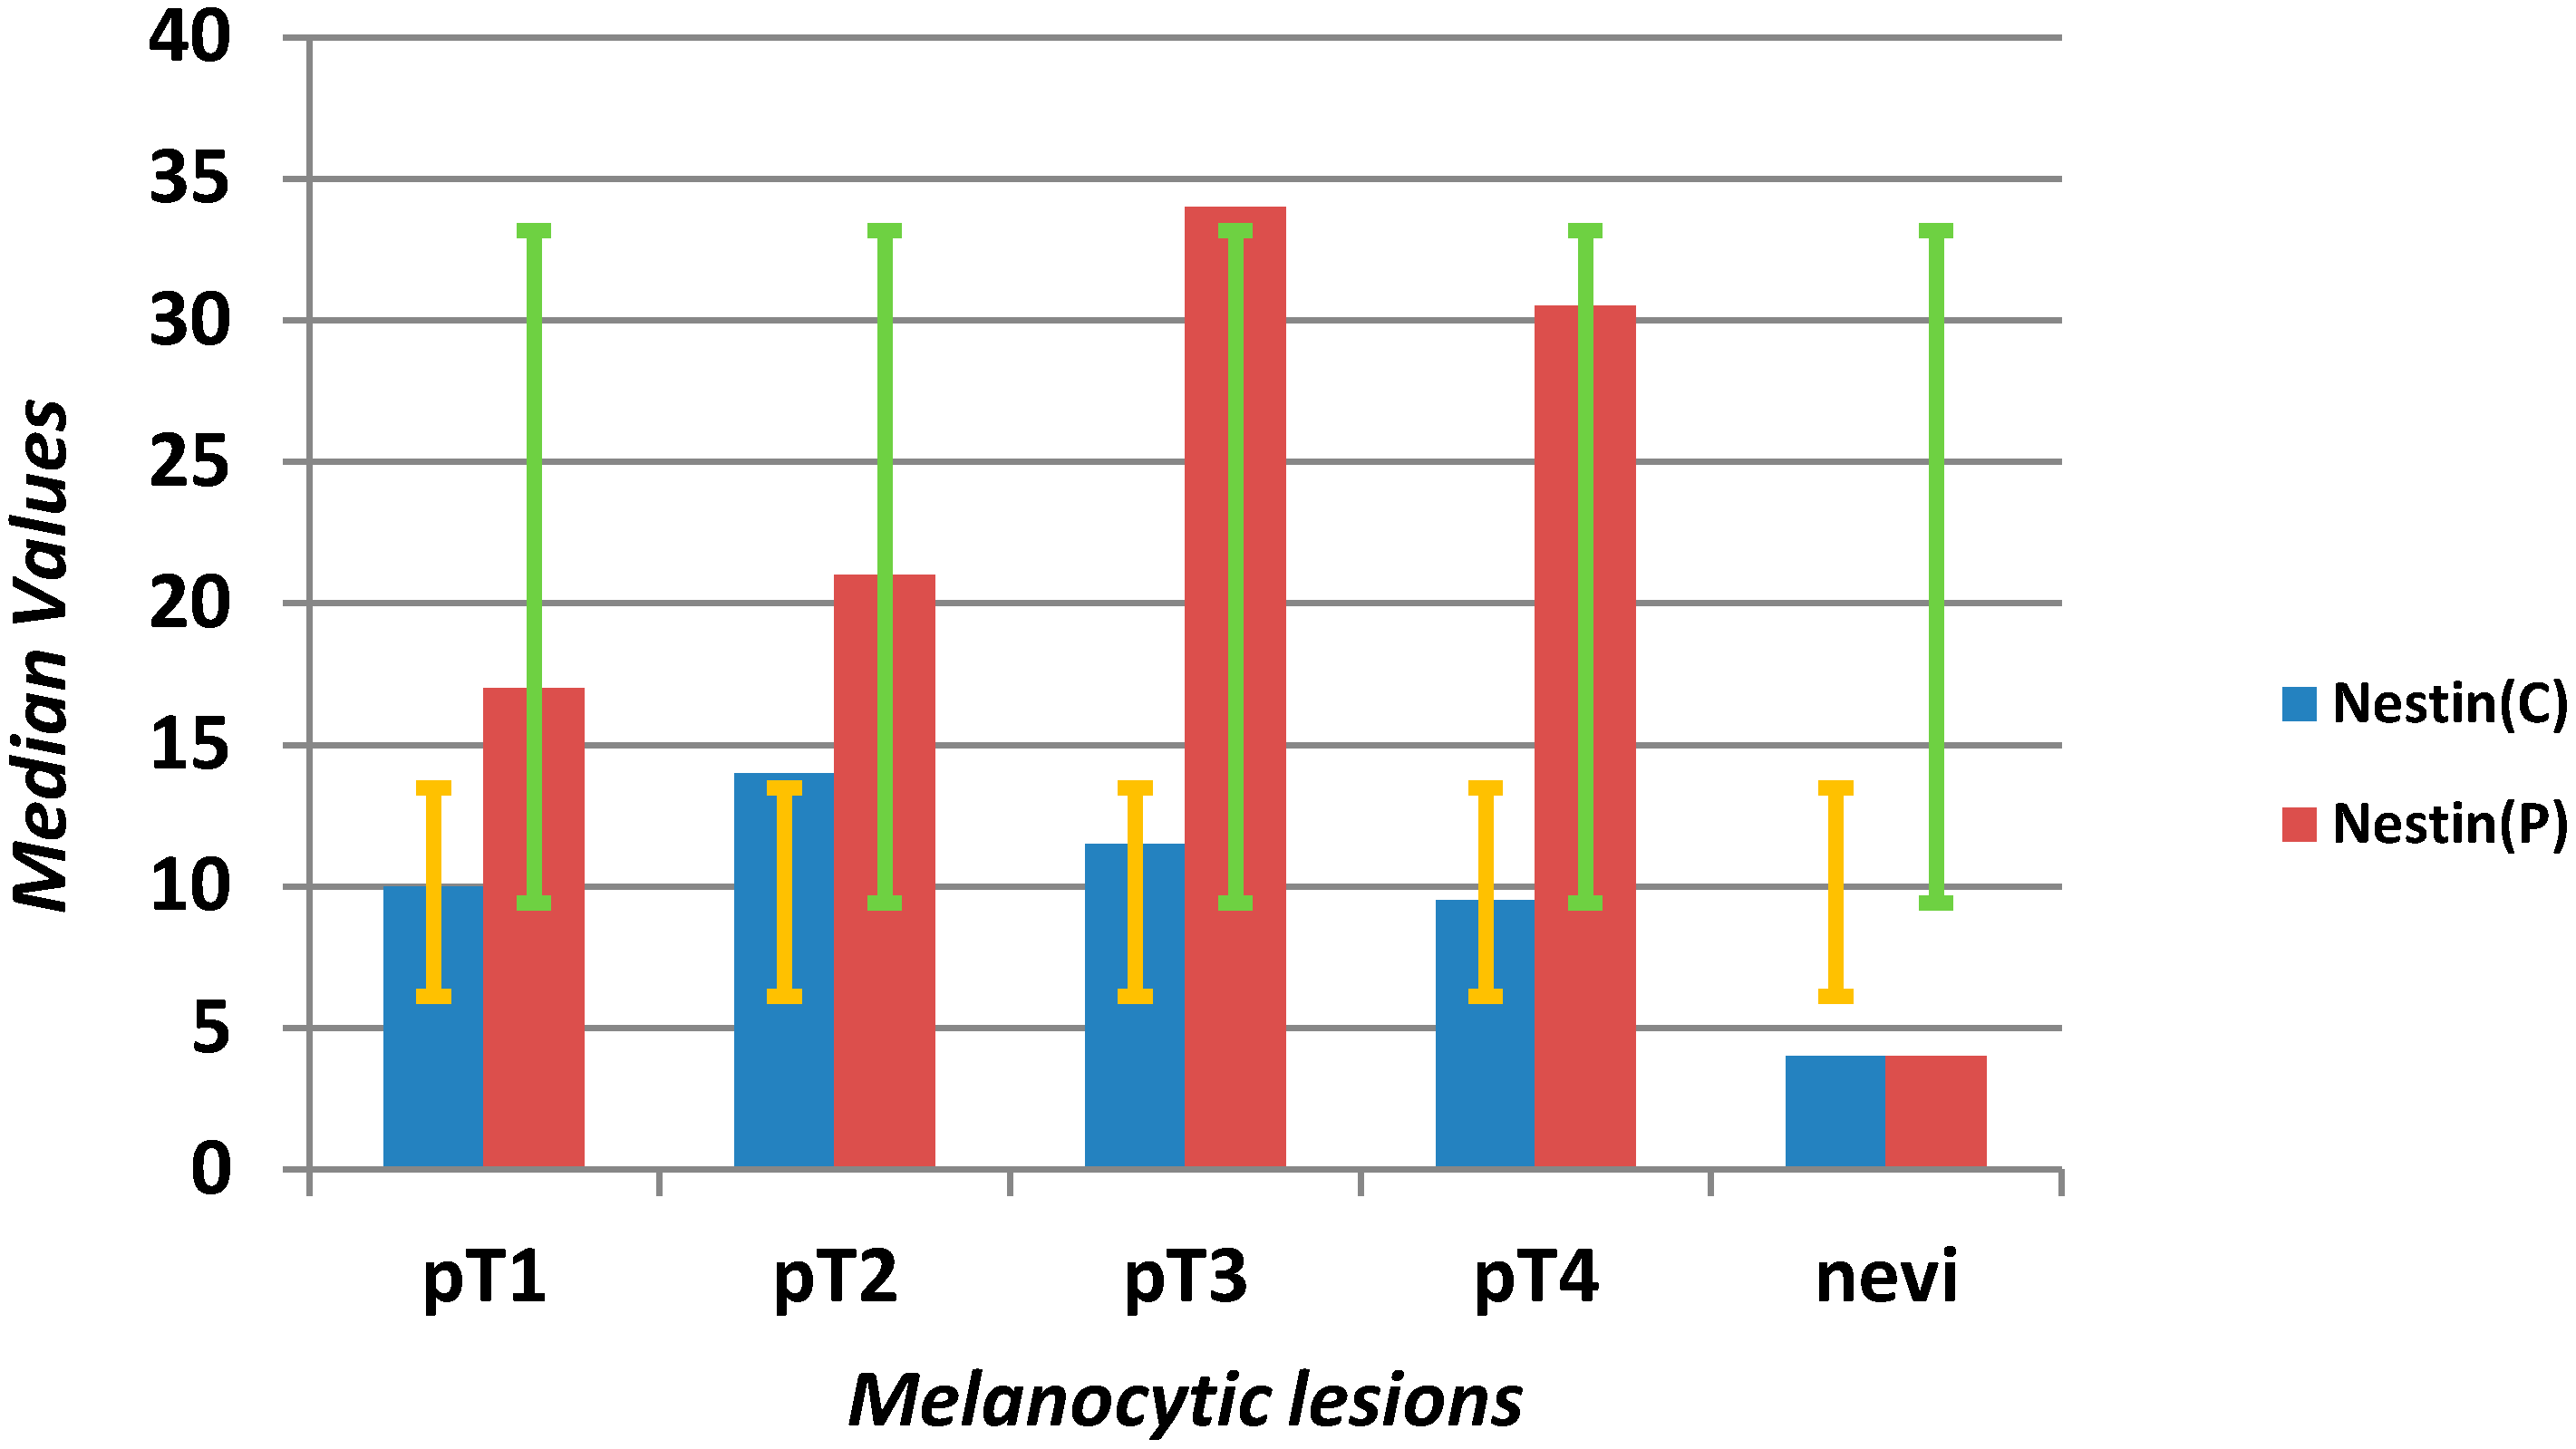
| Nestin C (mm2) | 10 | 6.75 | 20 | 0 | 62 | 4 | 2 | 9 | 0 | 26 | 0.0001 |
| Nestin P (mm2) | 22 | 13.75 | 38 | 2 | 78 | 4 | 1.5 | 8.5 | 0 | 17 | <0.0001 |
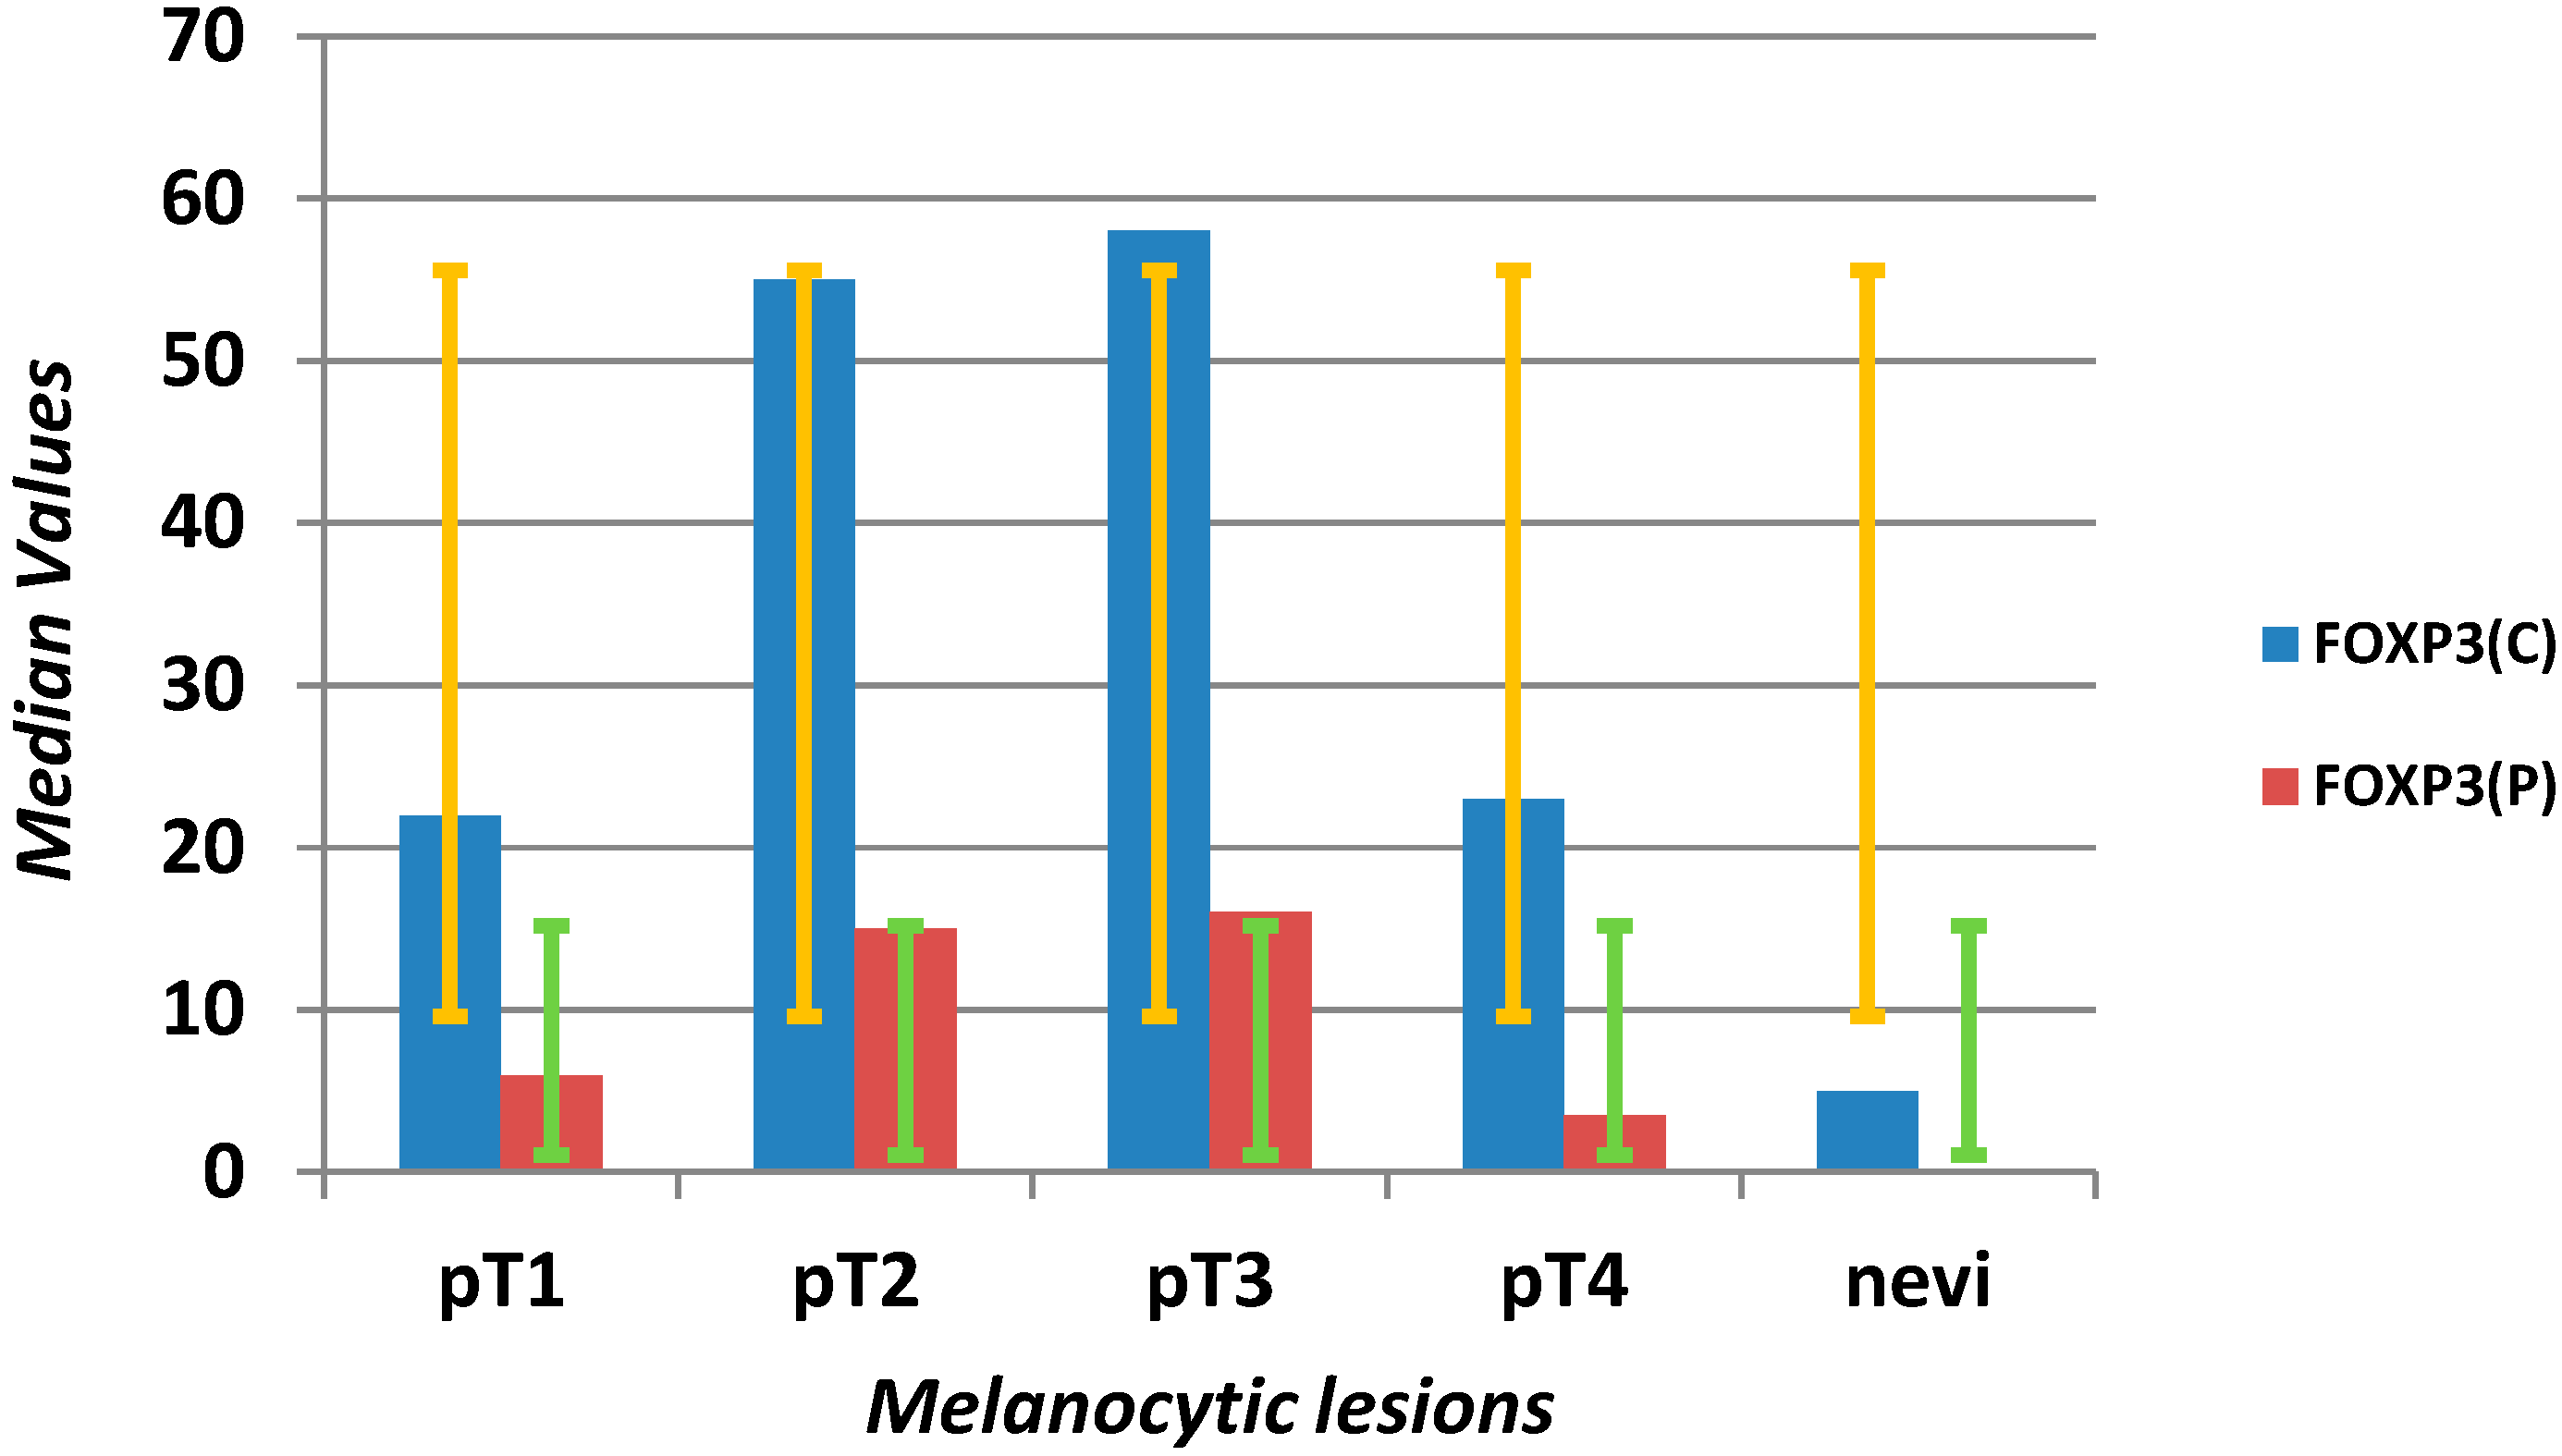
| FOXP3 C (mm2) | 30 | 6.75 | 75.75 | 1 | 192 | 5 | 2 | 10.5 | 1 | 36 | <0.0001 |
| FOXP3 P (mm2) | 9.5 | 2 | 18 | 1 | 160 | 1 | 1 | 1 | 1 | 21 | <0.0001 |
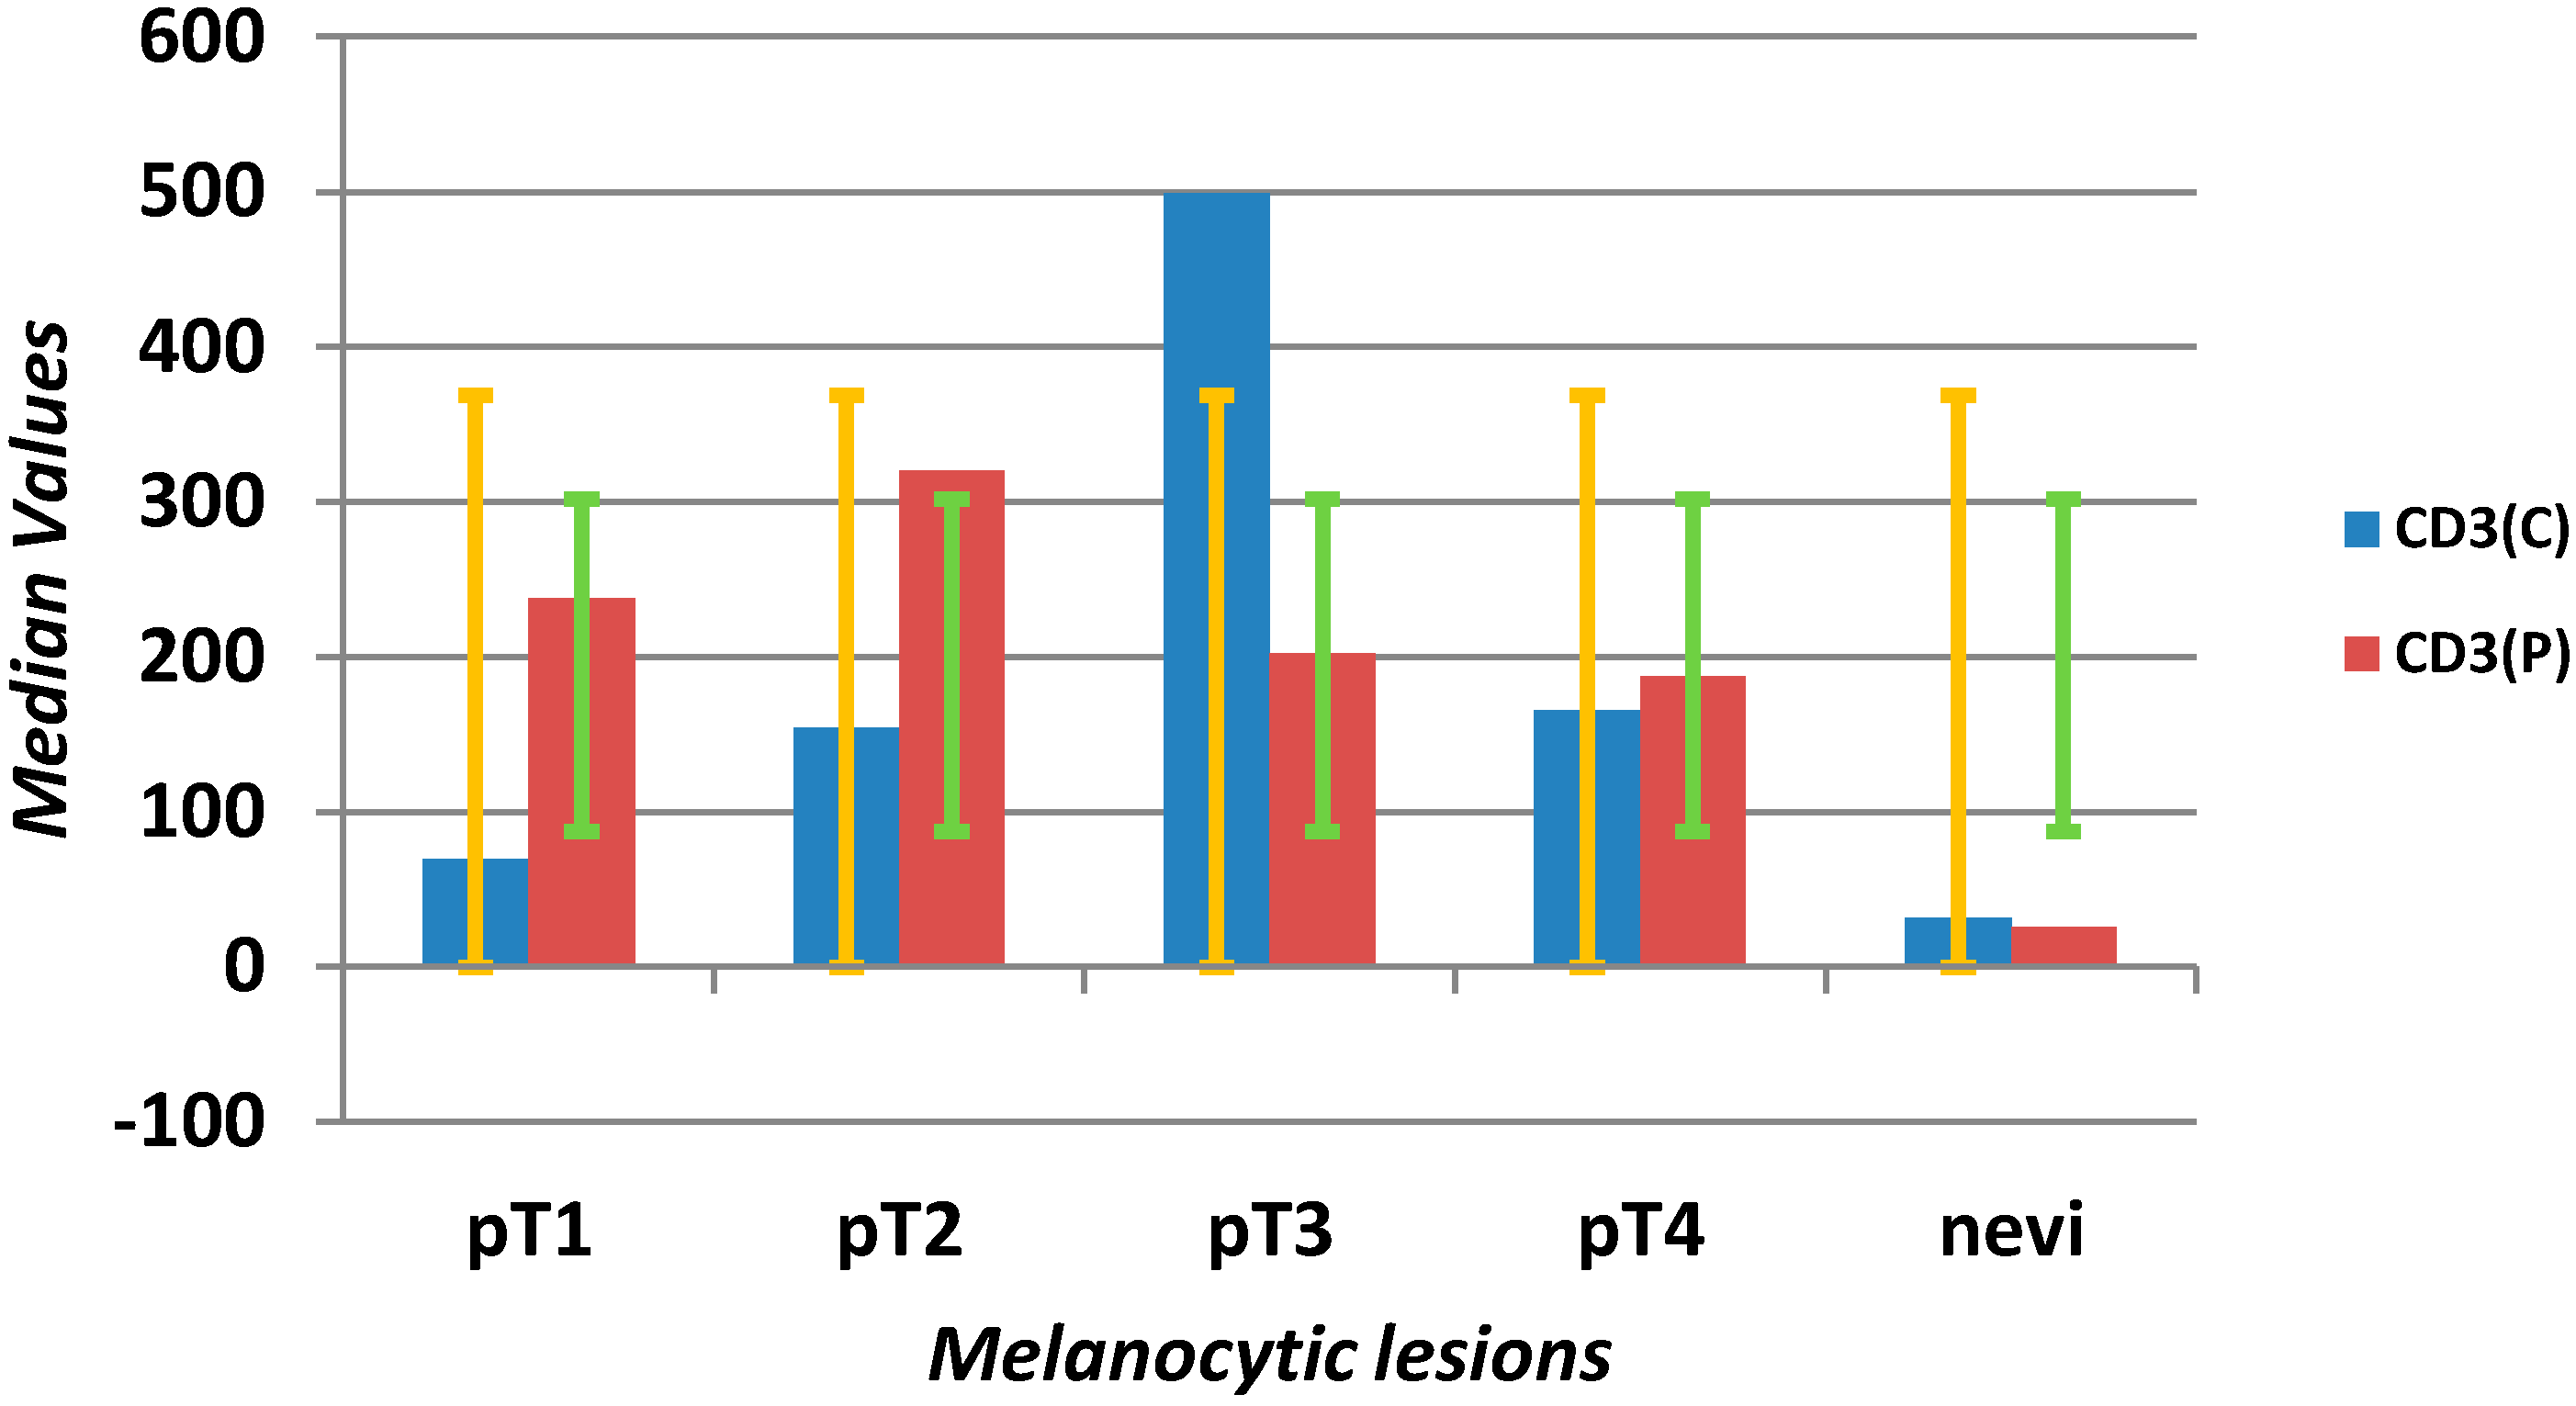
| CD3 C (mm2) | 141 | 66 | 425 | 5 | 1330 | 38 | 21 | 55 | 2 | 158 | <0.0001 |
| CD3 P (mm2) | 233.5 | 153 | 480 | 40 | 980 | 22 | 10 | 31 | 2 | 125 | <0.0001 |
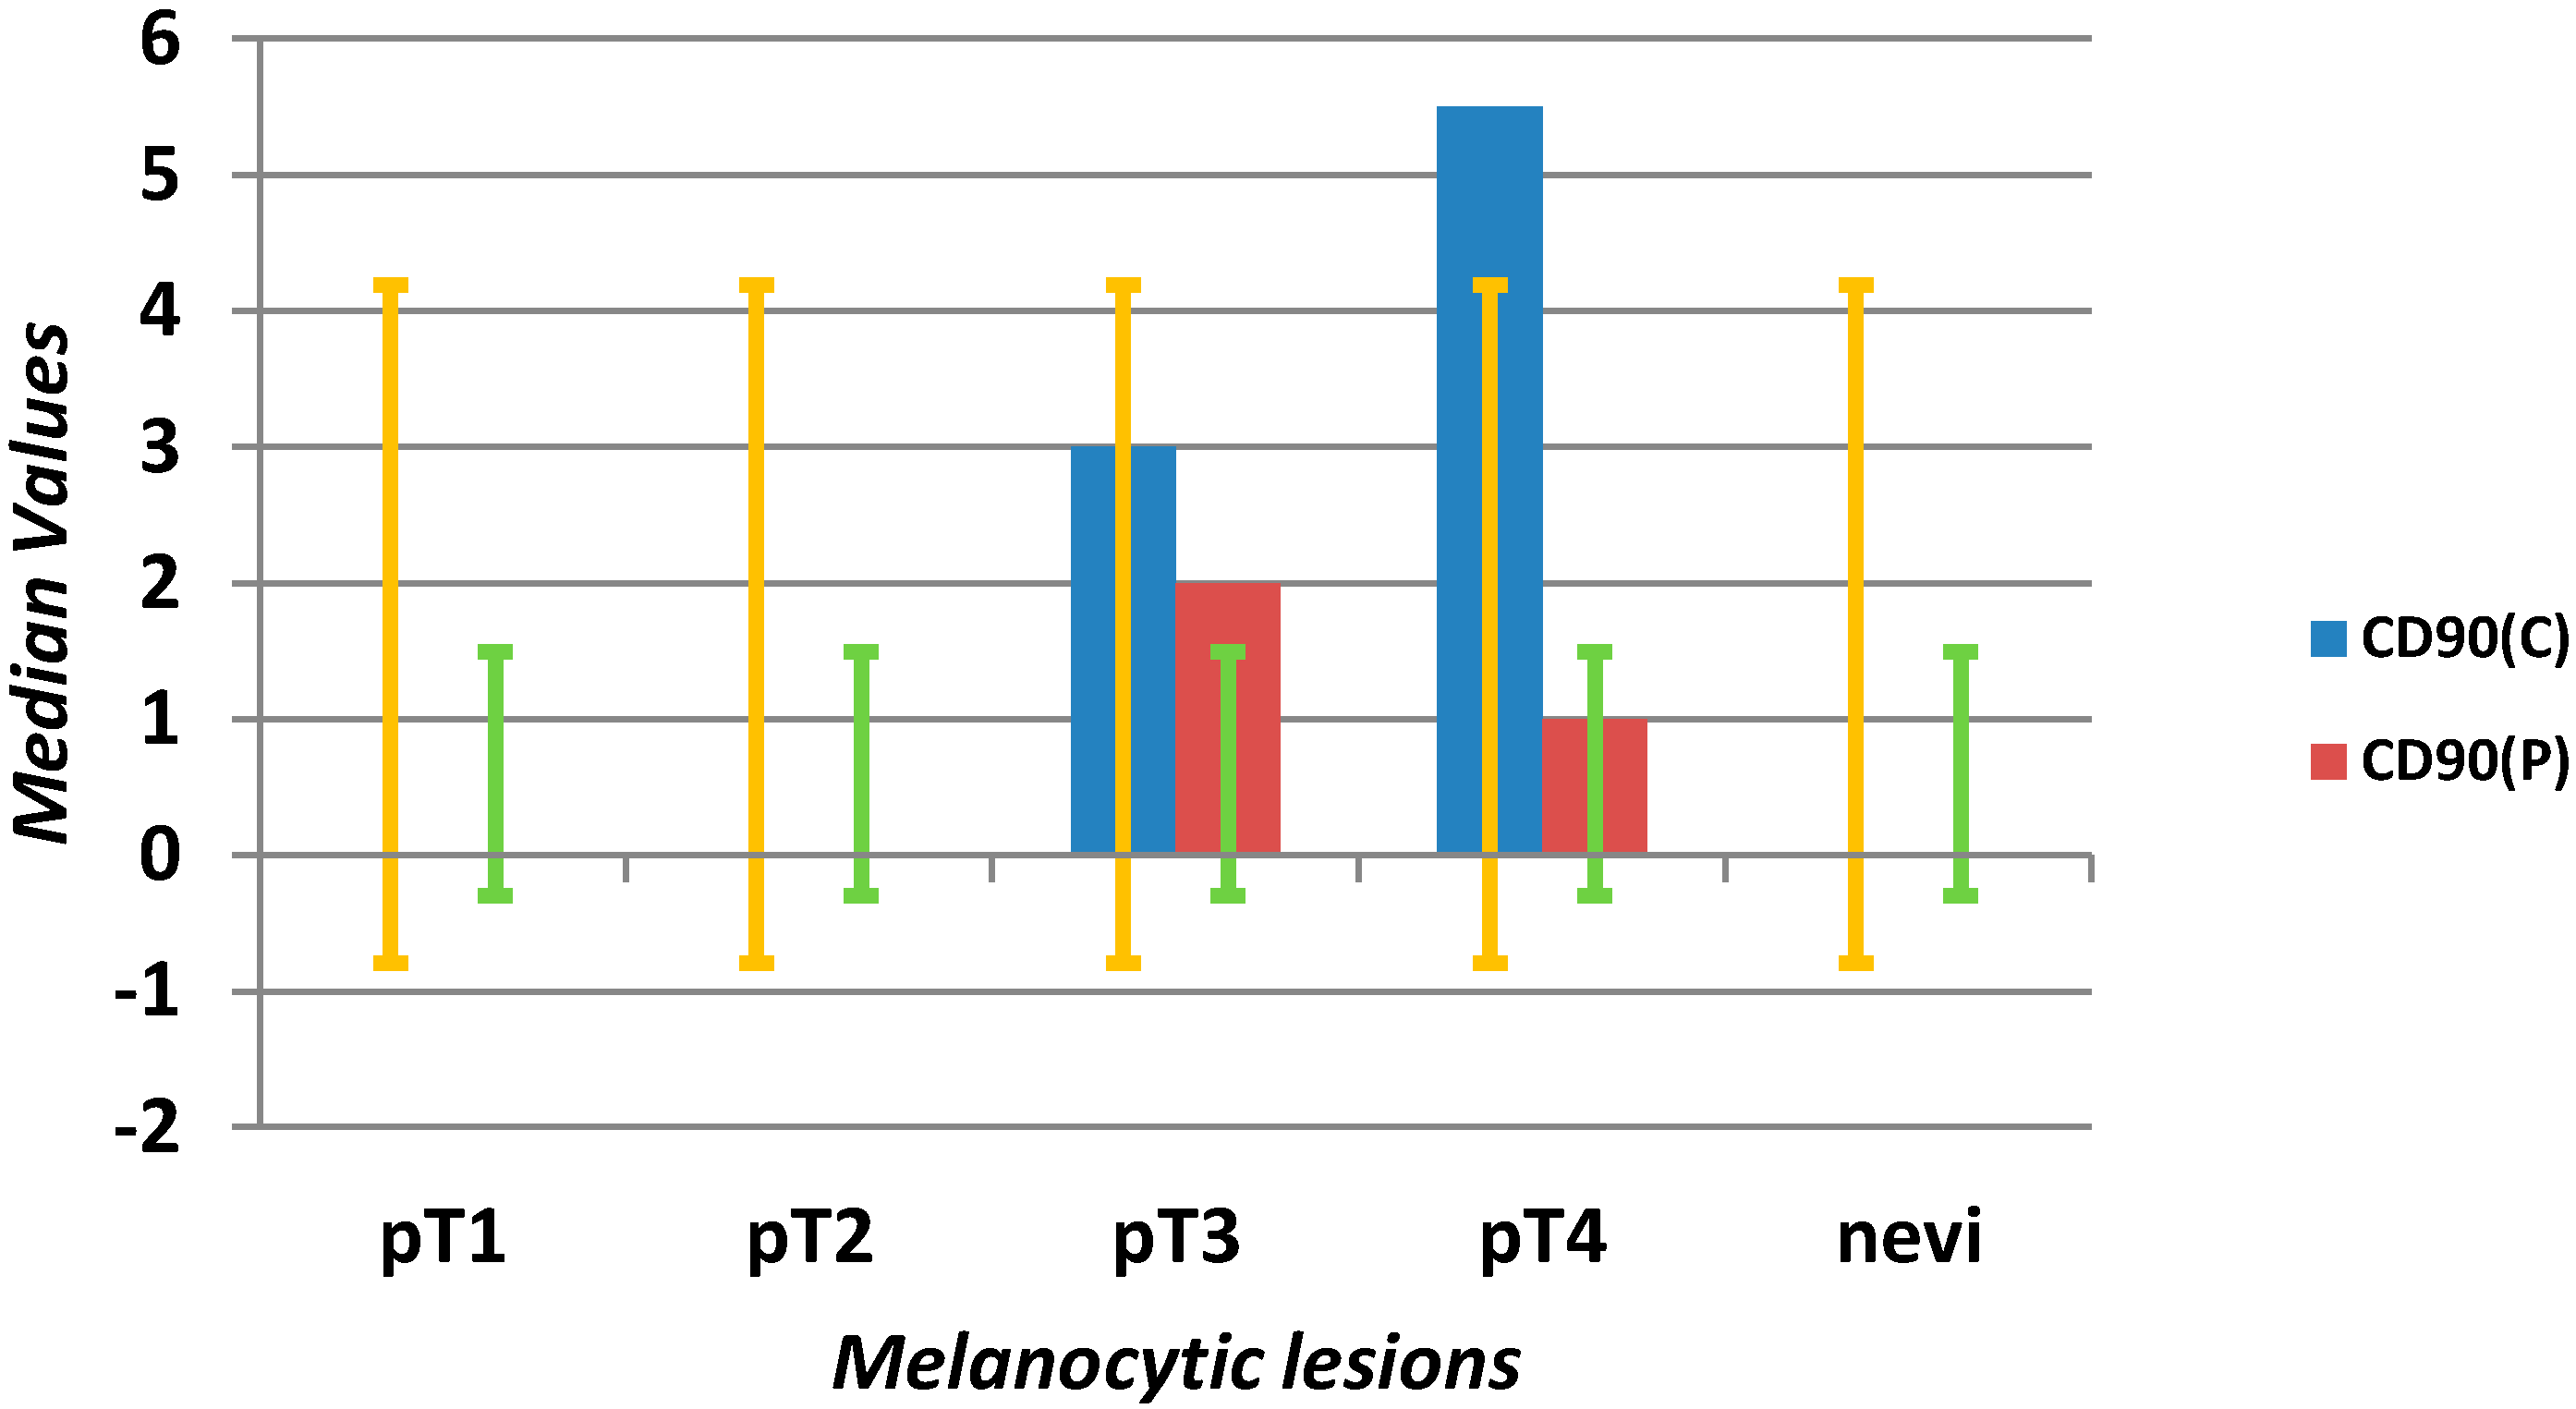
| CD90 C (mm2) | 0 | 0 | 3 | 0 | 15 | 0 | 0 | 0 | 0 | 4 | <0.0001 |
| CD90 P (mm2) | 0 | 0 | 1 | 0 | 15 | 0 | 0 | 0 | 0 | 2 | <0.0001 |
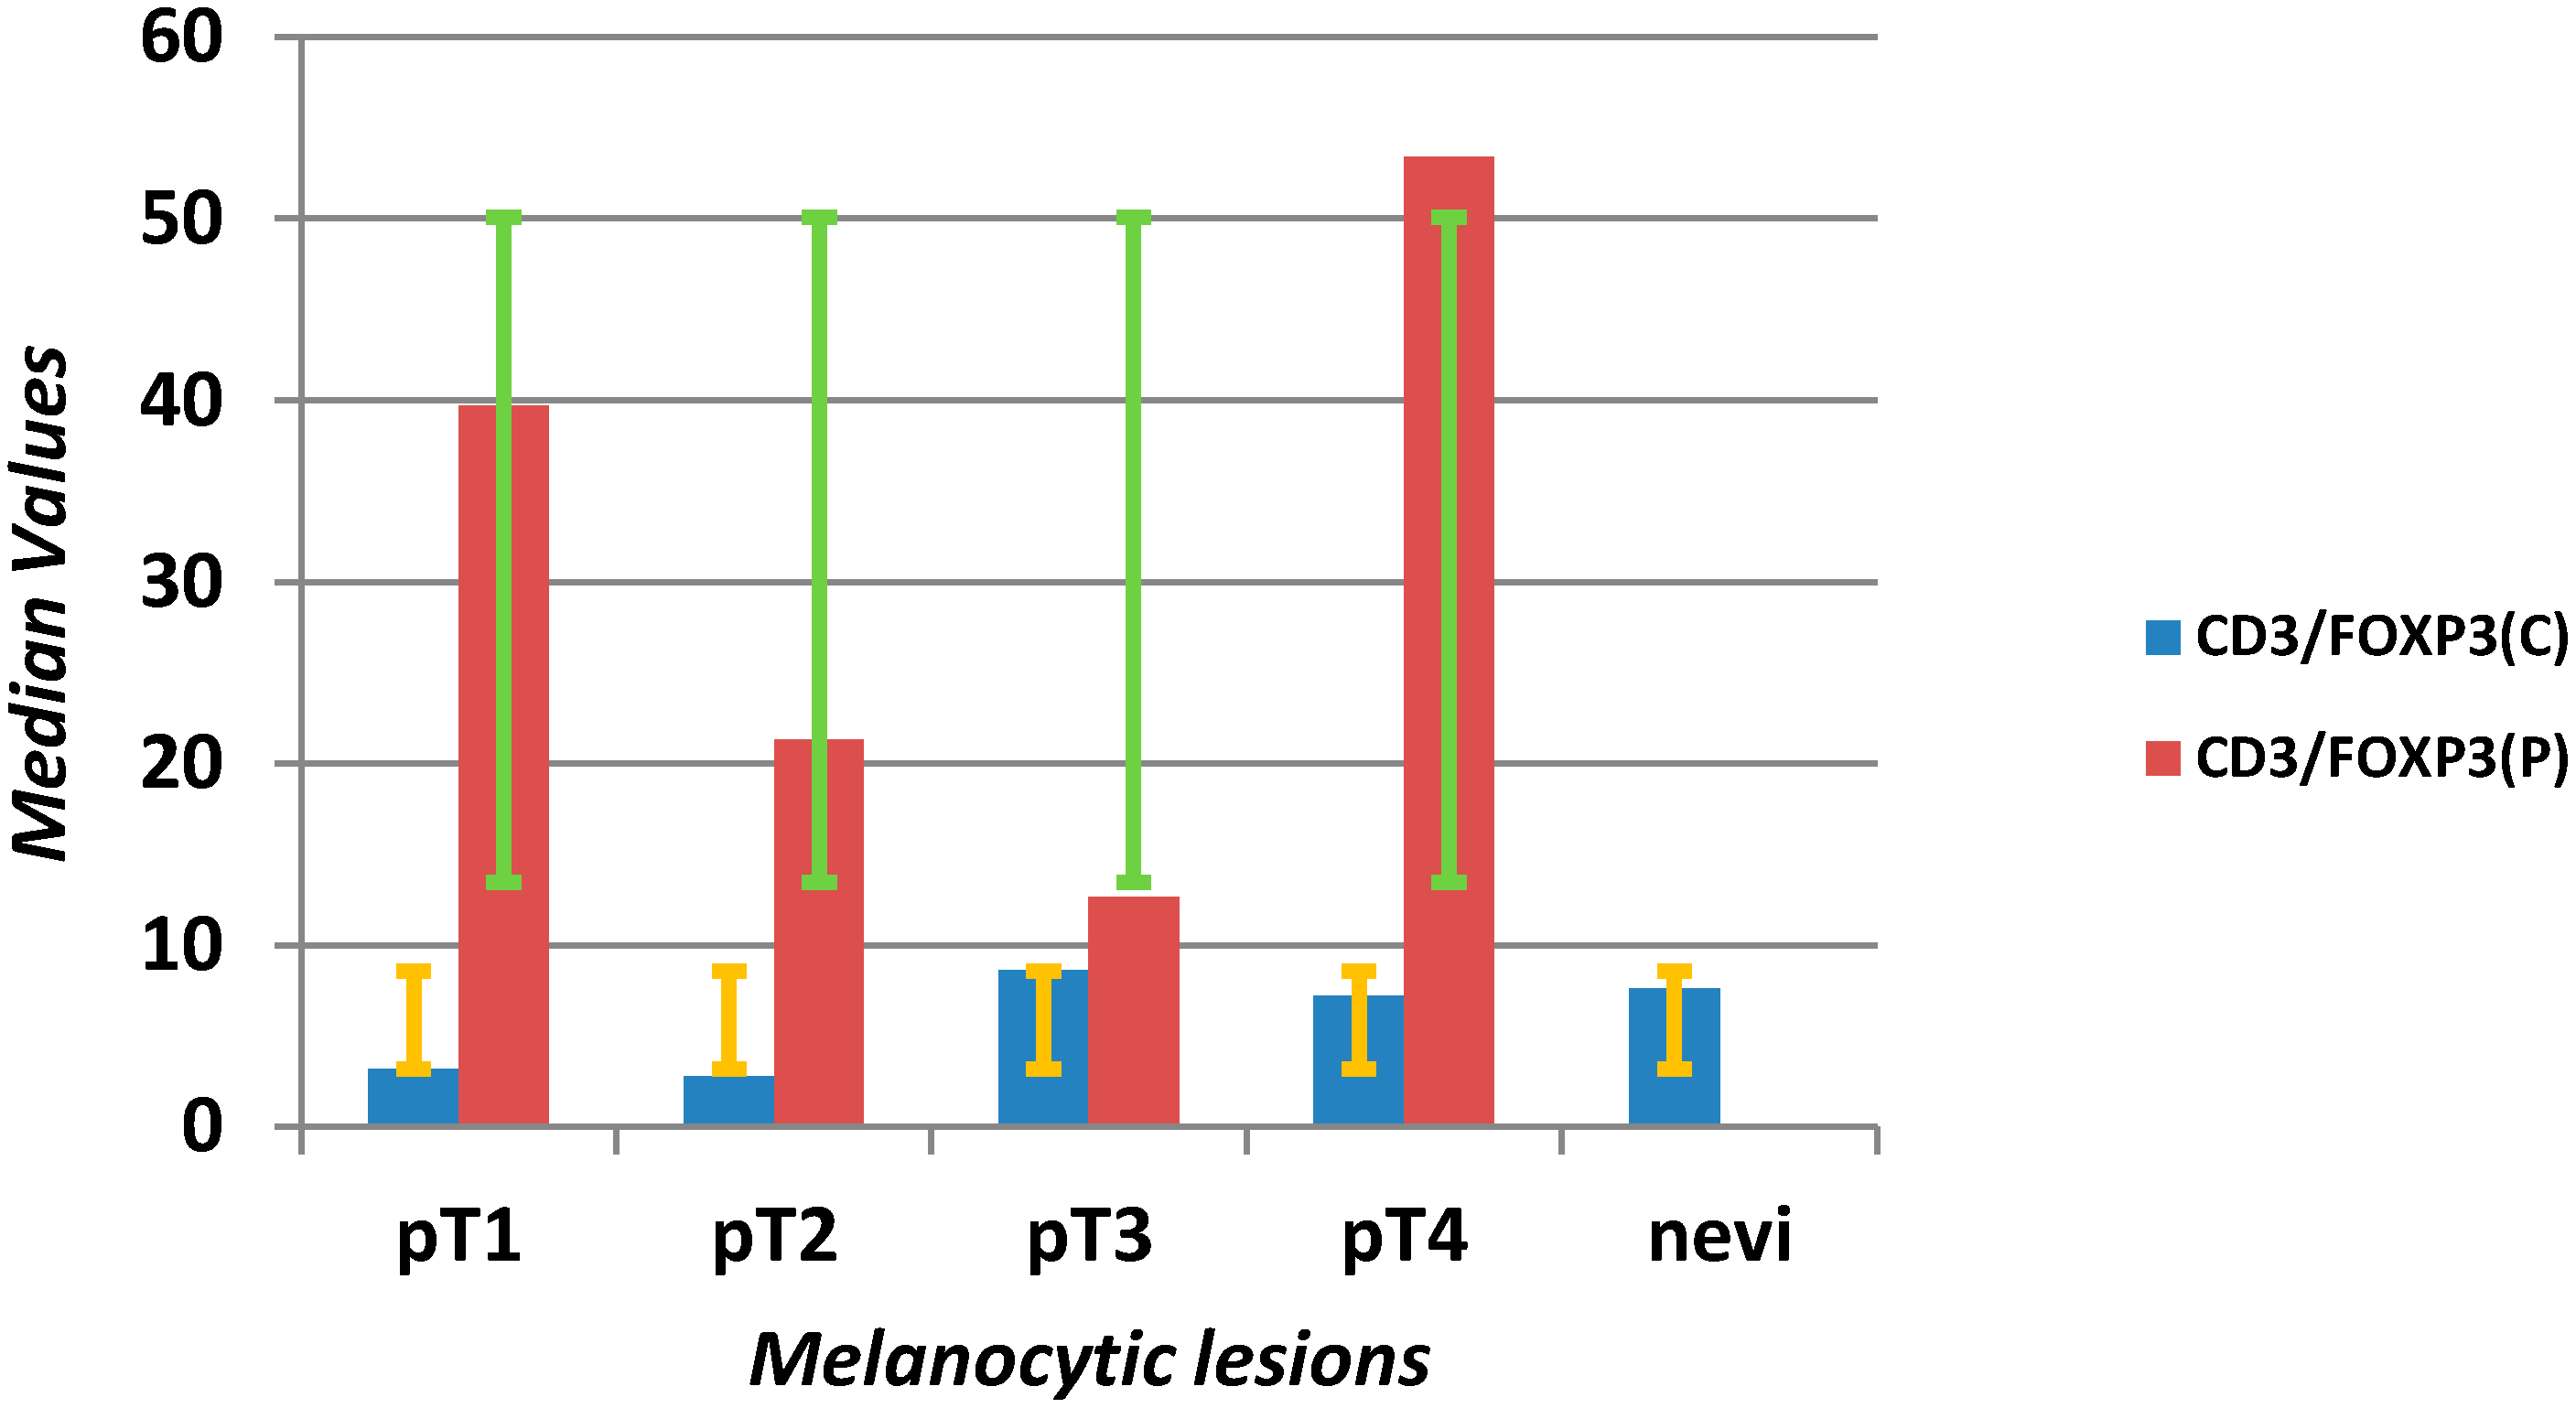
| CD3 C/FOXP3 C | 6.12 | 2.21 | 19.03 | 0.08 | 265 | 7.67 | 3.32 | 14.00 | 0.18 | 58 | 0.611 |
| CD3 P/FOXP3 P | 33.25 | 12.23 | 101.07 | 2.97 | 630 | 20.00 | 4.70 | 30.00 | 2.00 | 52 | 0.002 |
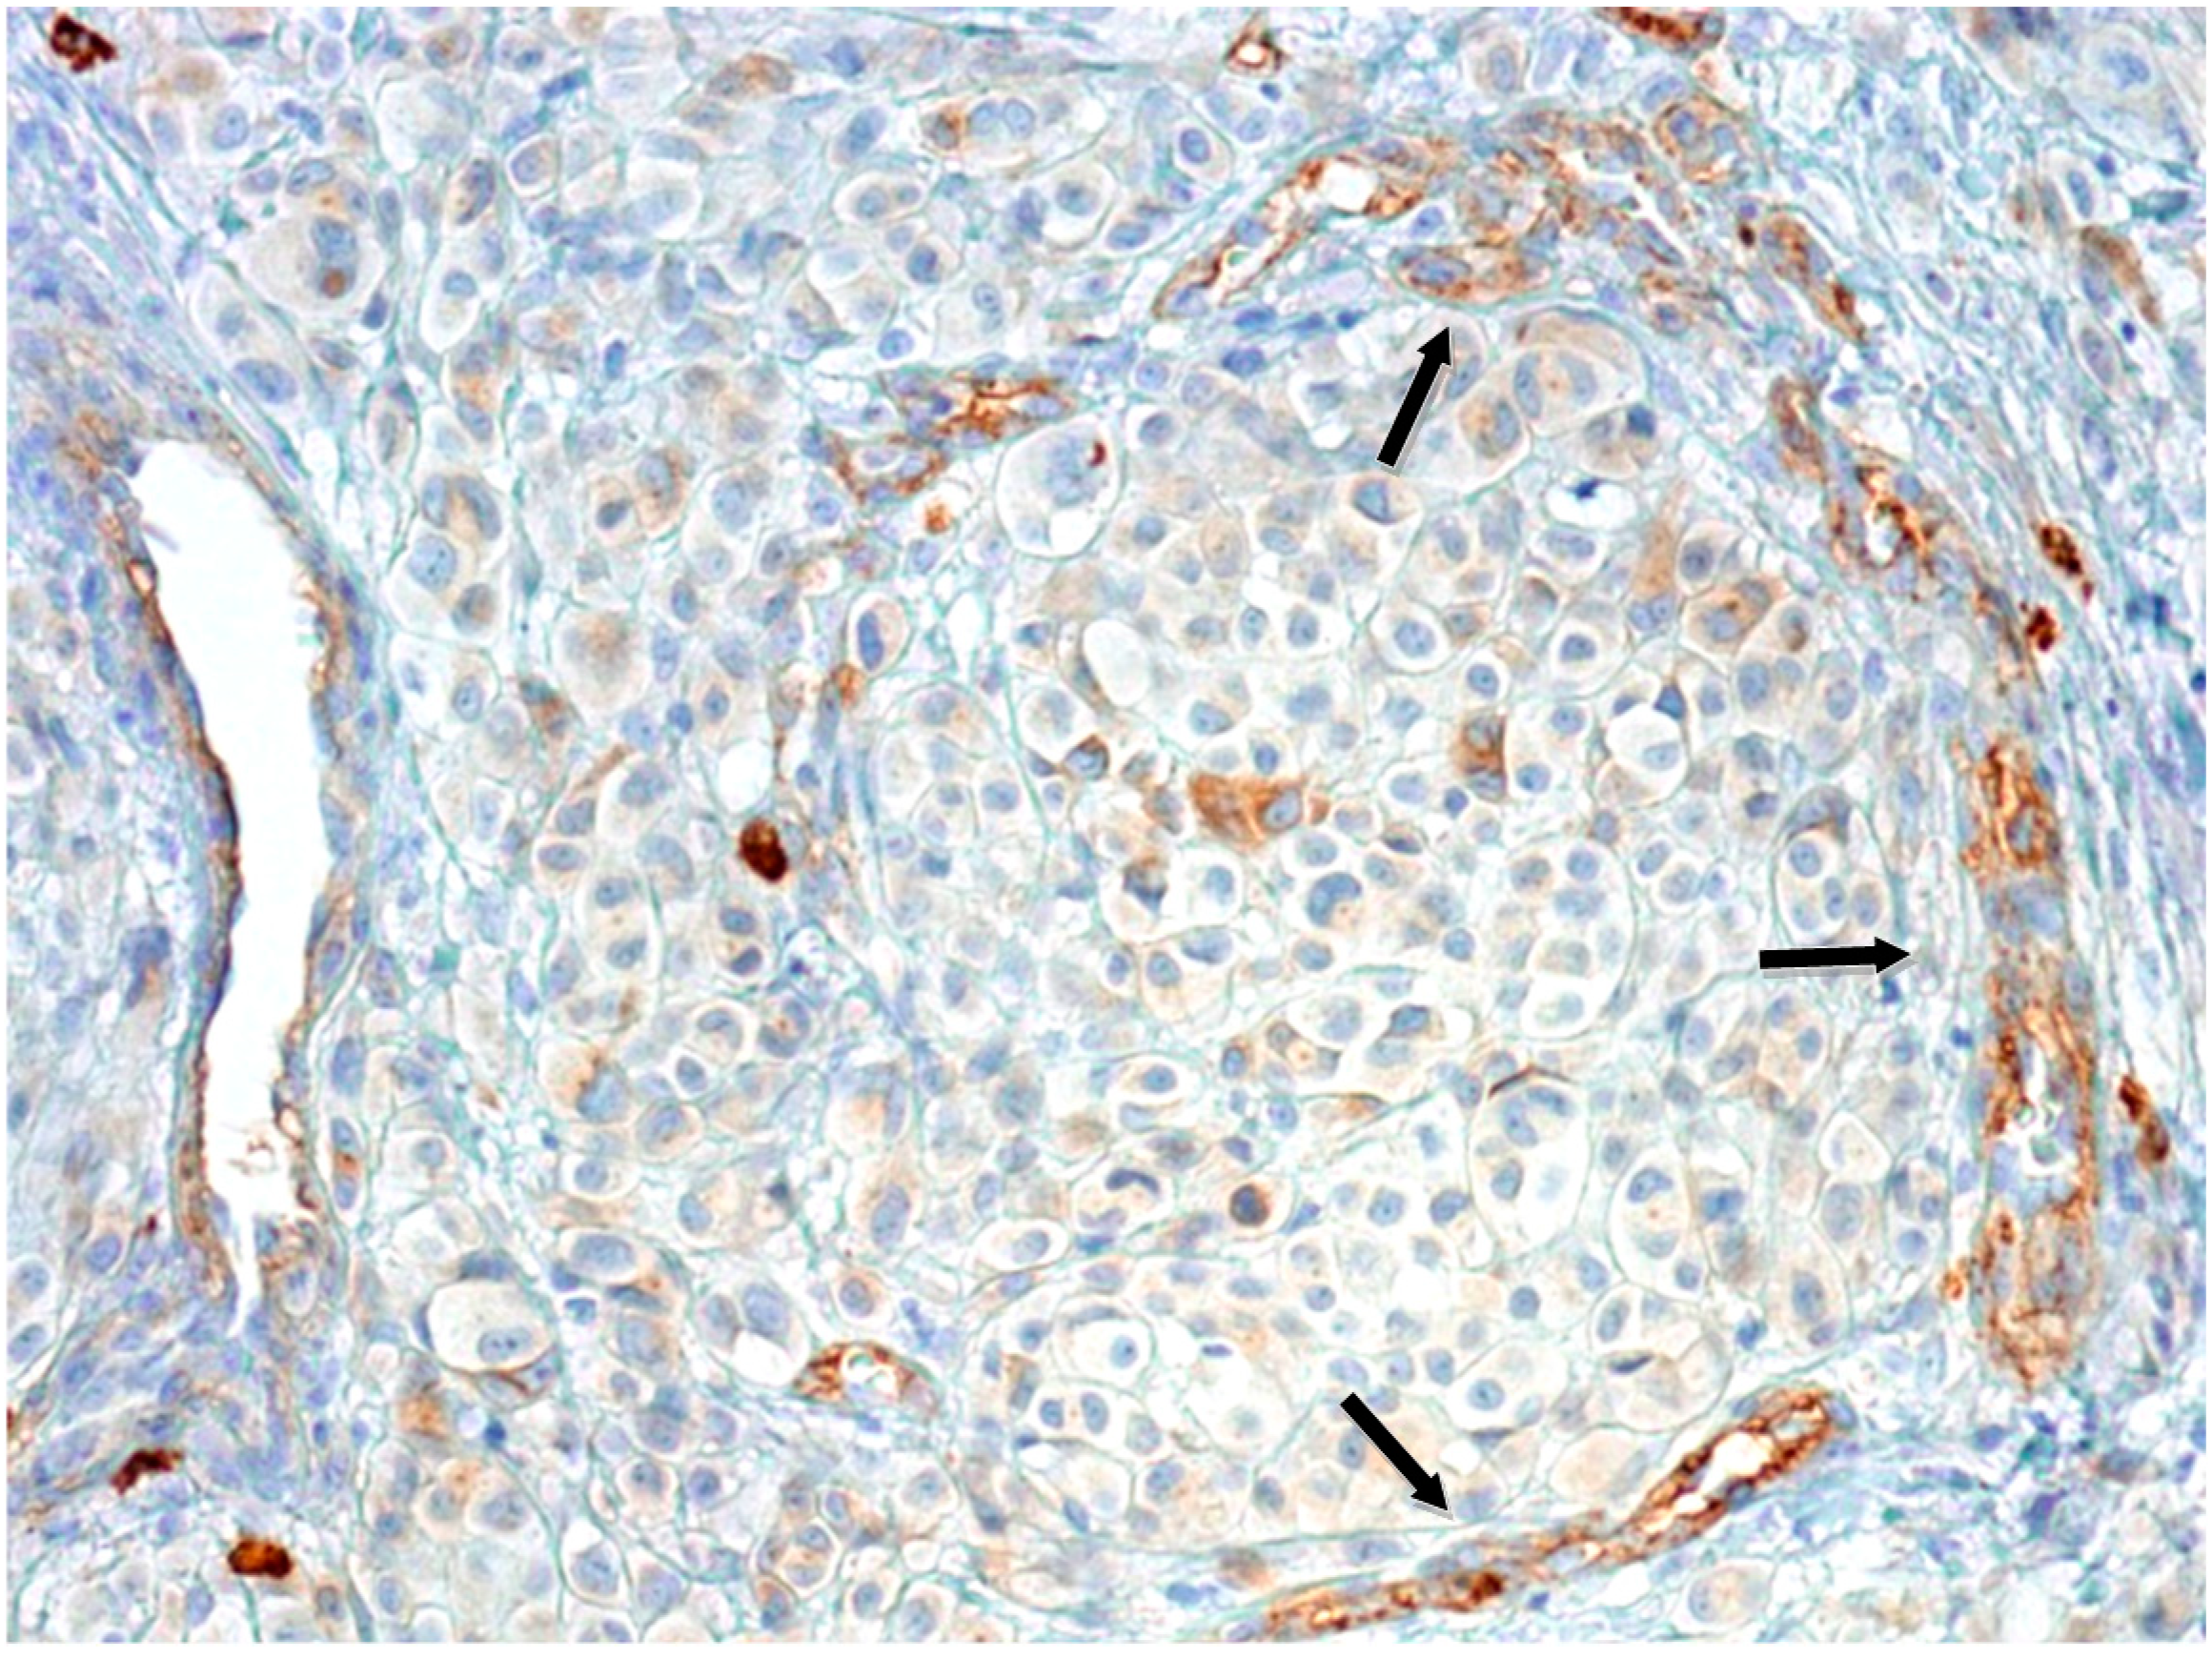
2.1.1. Microvascular Density with Anti-Nestin Antibody
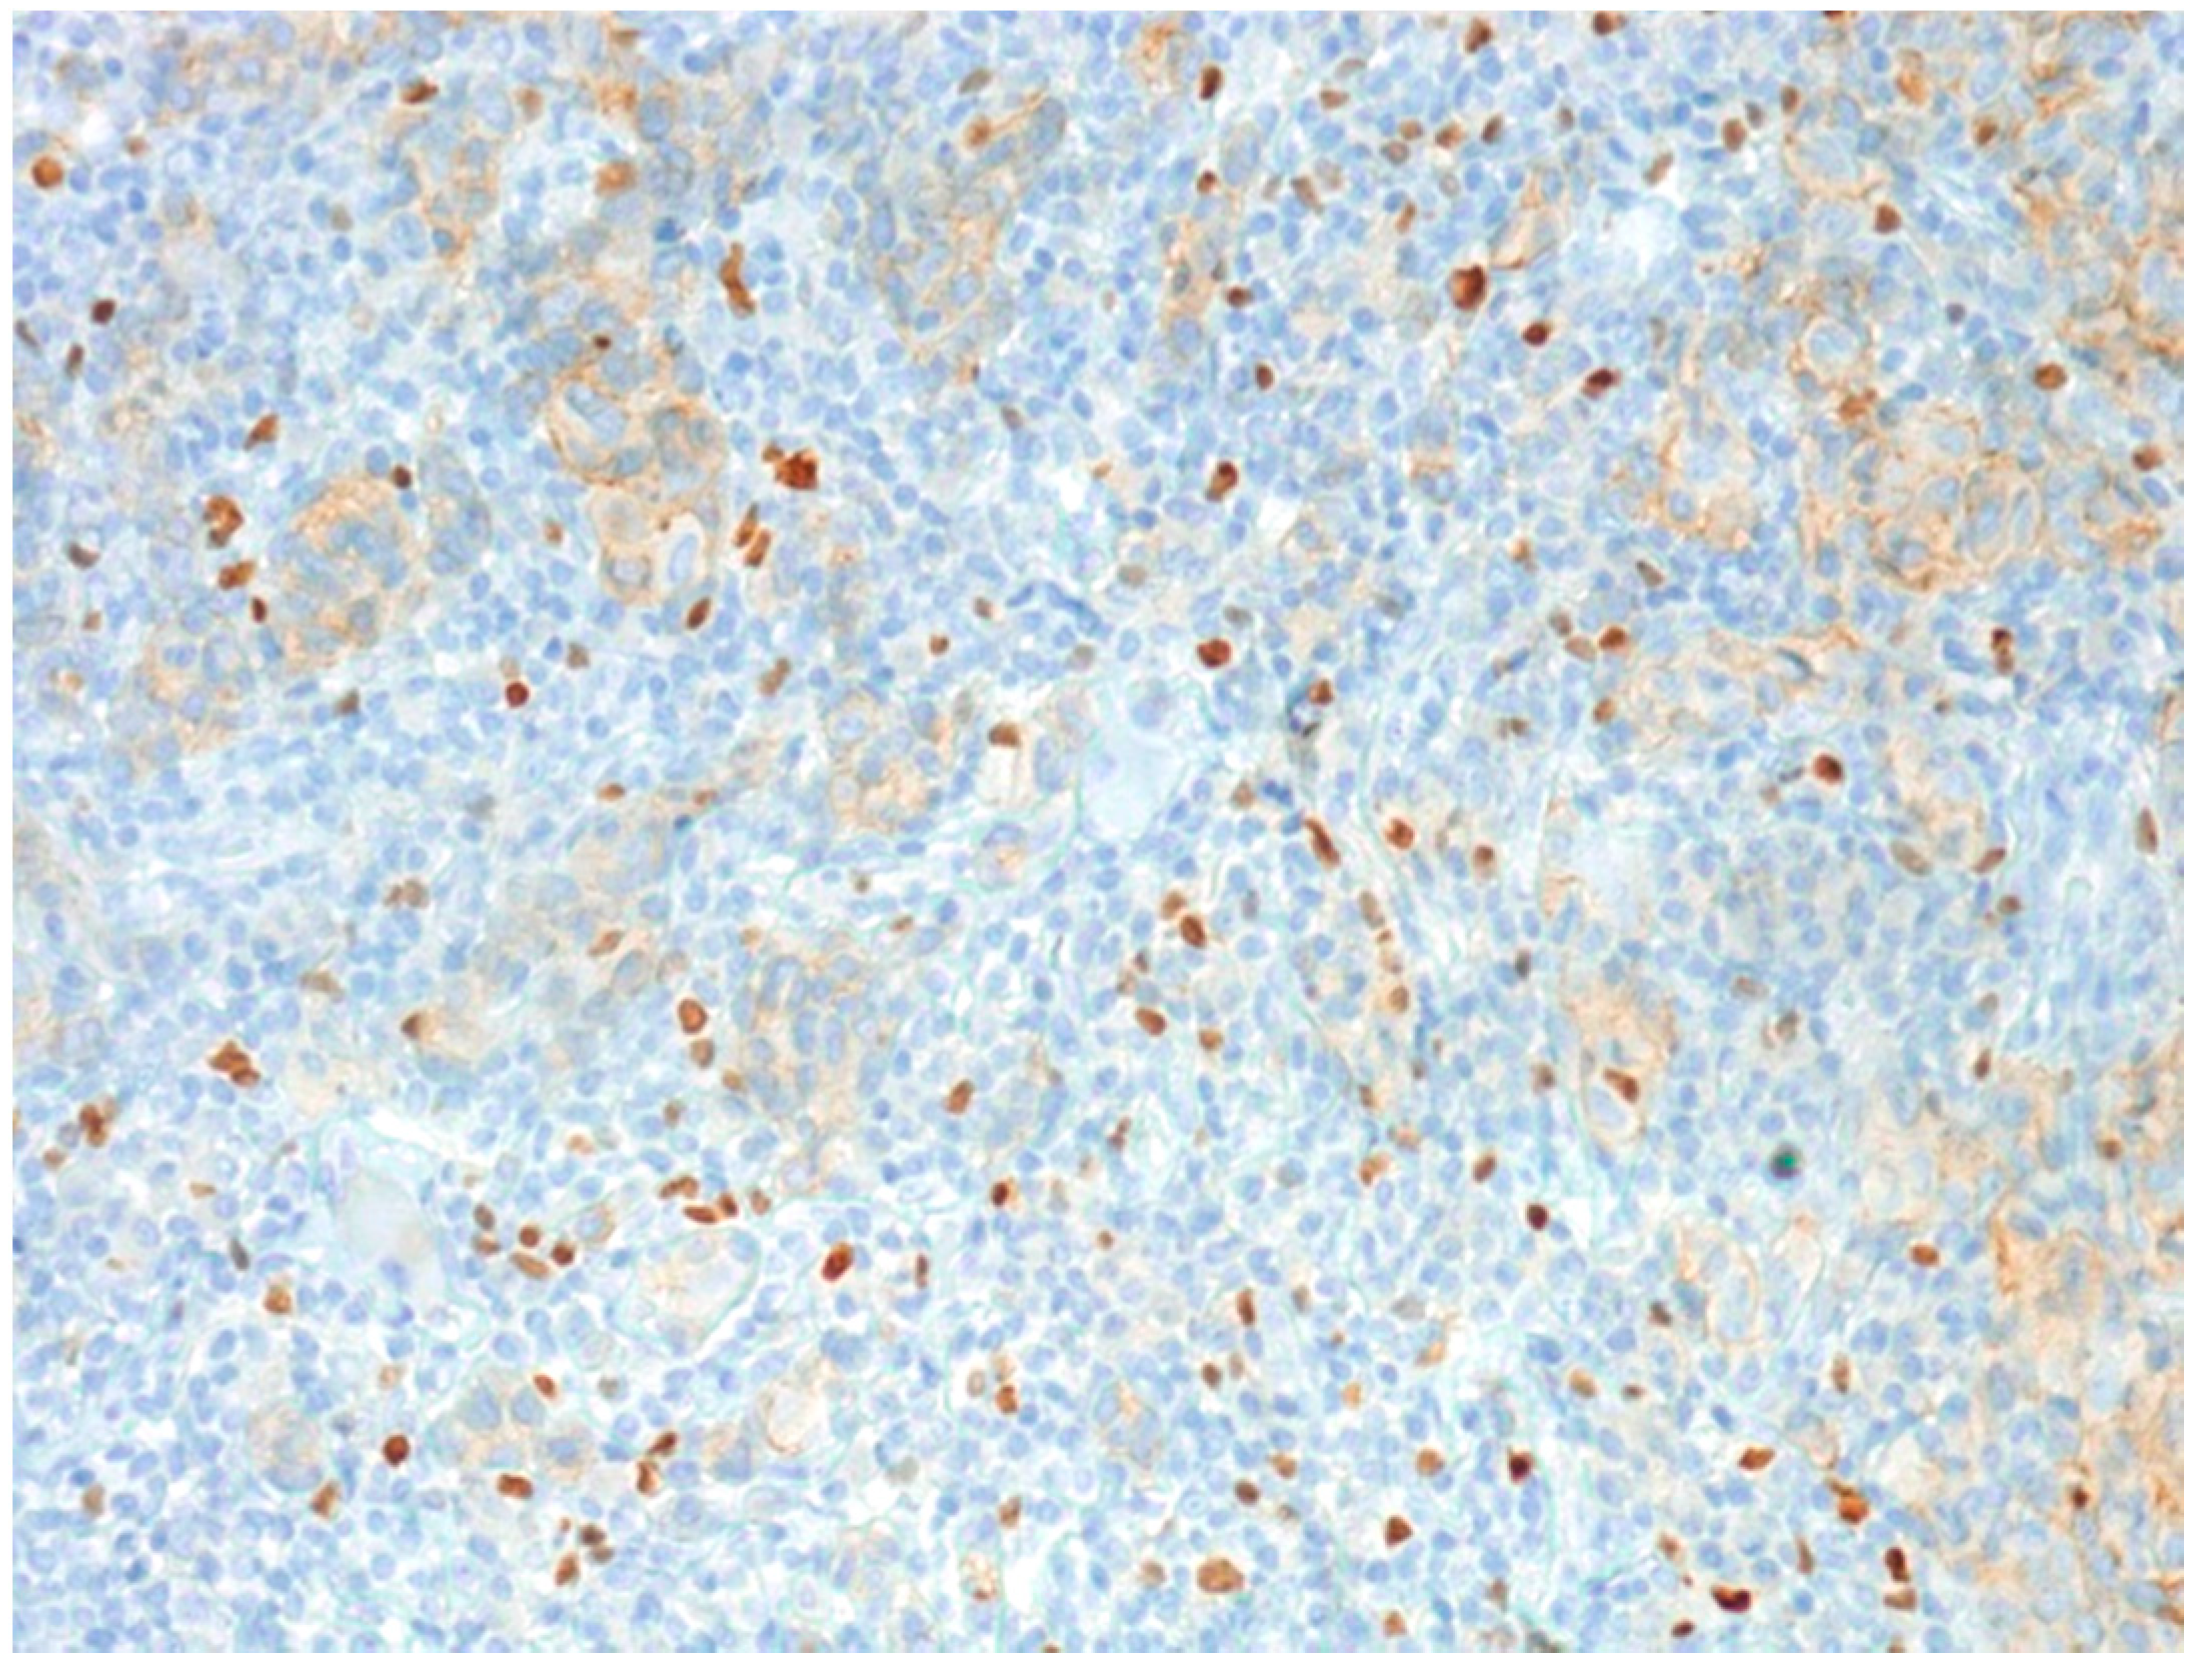
2.1.2. Microvascular Density with Anti-CD90 Antibody

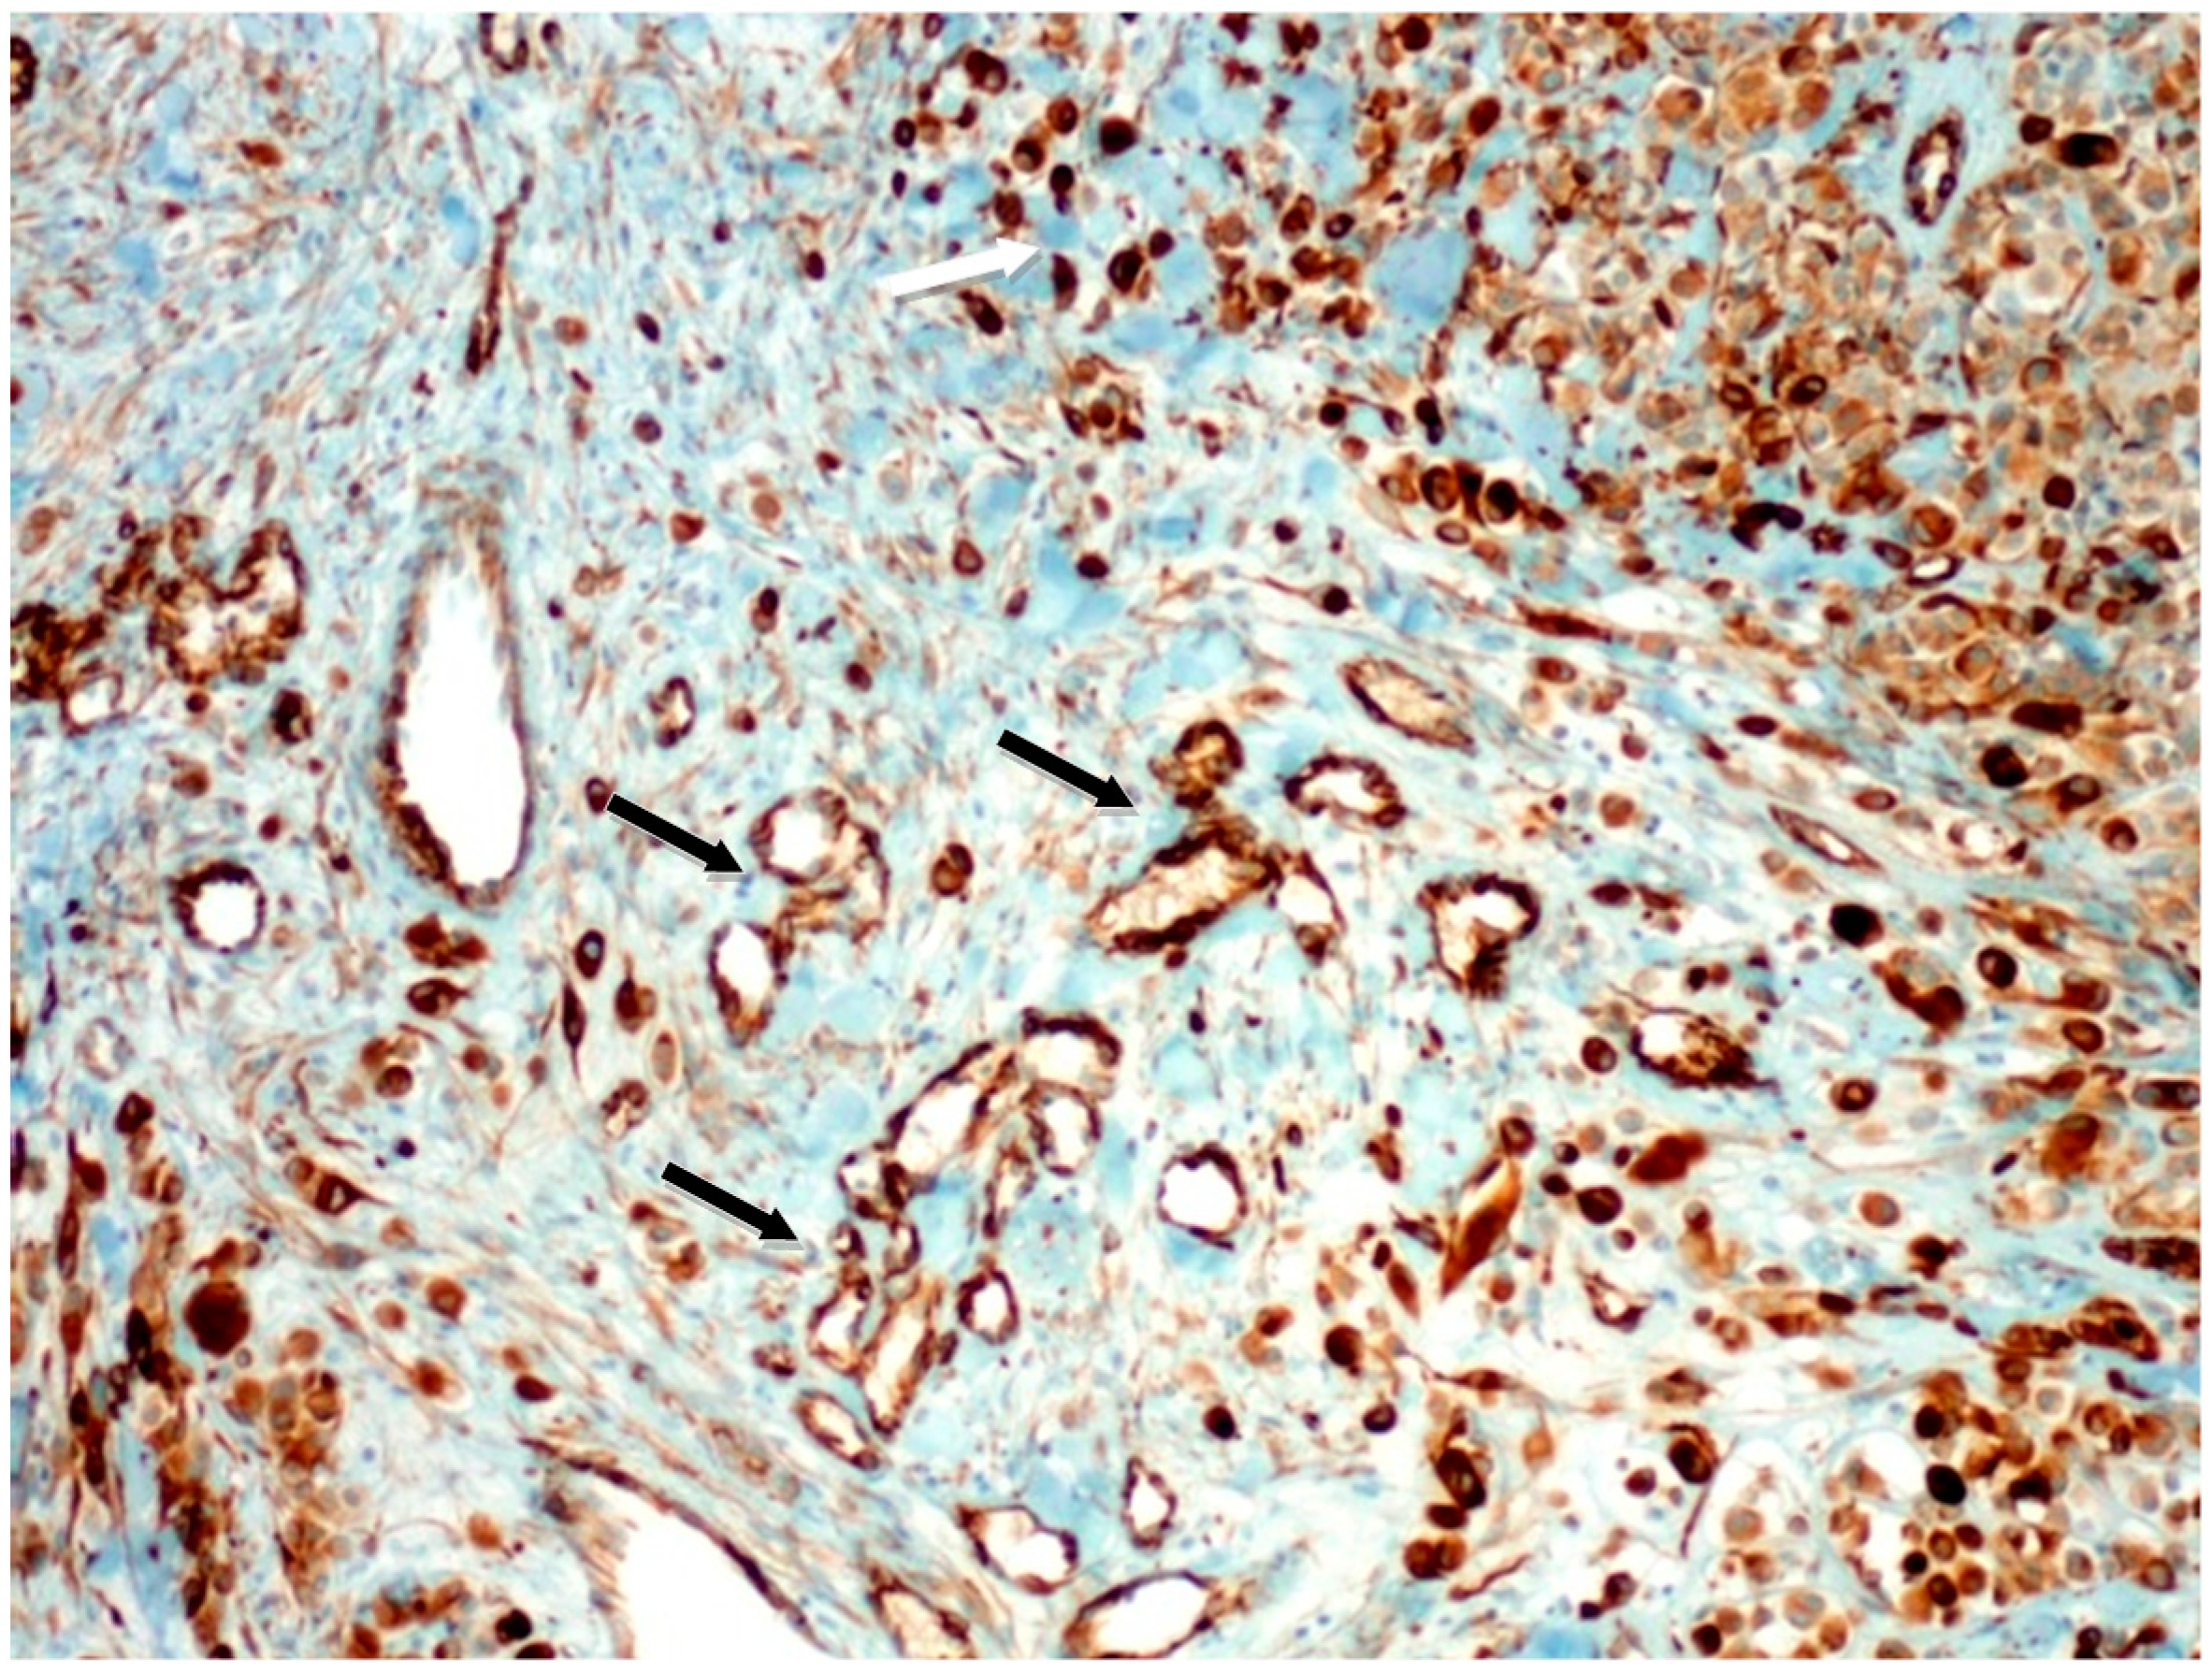
2.1.3. Tumor-Infiltrating Lymphocytes


2.2. Discussion
3. Experimental Section
4. Conclusions
Acknowledgments
Author Contributions
Conflicts of Interest
References
- Eriksson, H.; Frohm-Nilsson, M.; Järås, J.; Kanter-Lewensohn, L.; Kjellman, P.; Månsson-Brahme, E.; Vassilaki, I.; Hansson, J. Prognostic factors in localized invasive primary cutaneous malignant melanoma: Results of a large population-based study. Br. J. Dermatol. 2015, 172, 175–186. [Google Scholar] [CrossRef]
- Brandner, J.M.; Haass, N.K. Melanoma’s connections to the tumour microenvironment. Pathology 2013, 45, 443–452. [Google Scholar] [CrossRef] [PubMed]
- Mao, Y.; Poschke, I.; Wennerberg, E.; de Coana, P.; Brage, S.E.; Schultz, I.; Hansson, J.; Masucci, G.; Lundqvist, A.; Kiessling, R. Melanoma-educated CD14+ cells acquire a myeloid-derive suppressor cell phenotype through COX-2-dependent mechanisms. Cancer Res. 2013, 73, 3877–3887. [Google Scholar] [CrossRef] [PubMed]
- Nico, B.; Benagiano, V.; Mangieri, D.; Maruotti, N.; Vacca, A.; Ribatti, D. Evaluation of microvascular density in tumors, pro and contra. Histol. Histopathol. 2008, 23, 601–607. [Google Scholar] [PubMed]
- Matsuda, Y.; Hagio, M.; Ishiwata, T. Nestin: A novel angiogenesis marker and possible target for tumor angiogenesis. World J. Gastroenterol. 2013, 19, 42–48. [Google Scholar] [CrossRef] [PubMed]
- Ria, R.; Reale, A.; Castrovilli, A.; Mangialardi, G.; Dammacco, F.; Ribatti, D.; Vacca, A. Angiogenesis and prognosis in human melanoma. Dermatol. Res. Pract. 2010, 2010. Article ID 185687. [Google Scholar]
- Ehrmann, J.; Kolar, Z.; Mokry, J. Nestin as a diagnostic and prognostic marker: Immunohistochemical analysis of its expression in different tumours. J. Clin. Pathol. 2005, 58, 222–223. [Google Scholar] [CrossRef]
- Brychtova, S.; Fiuraskova, M.; Hlobilkova, A.; Brychta, T.; Hirnak, J. Nestin expression in cutaneous melanomas and melanocytic nevi. J. Cutan. Pathol. 2007, 34, 370–375. [Google Scholar] [CrossRef] [PubMed]
- Janikova, M.; Skarda, J.; Dziechciarkova, M.; Radova, L.; Chmelova, J.; Krejci, V.; Sedlakova, E.; Zapletalova, J.; Langova, K.; Klein, J.; et al. Identification of CD133+/nestin+ putative cancer stem cells in non-small cell lung cancer. Biomed. Pap. Med. Fac. Univ. Palacky Olomouc. Czech Repub. 2010, 154, 321–326. [Google Scholar] [CrossRef]
- Kretschmer, S.; Dethlefsen, I.; Hagner-Benes, S.; Marsch, L.M.; Garn, H.; König, P. Visualization of intrapulmonary lymph vessels in healthy and inflamed murine lung using CD90/Thy-1 as a marker. PLoS ONE 2013, 8. [Google Scholar] [CrossRef] [PubMed]
- Jurisic, G.; Iolyeva, M.; Proulx, S.T.; Halin, C.; Detmar, M. Thymus cell antigen 1 (Thy1, CD90) is expressed by lymphatic vessels and mediates cell adhesion to lymphatic endothelium. Exp. Cell Res. 2010, 316, 2982–2992. [Google Scholar] [CrossRef] [PubMed]
- Schubert, K.; Gutknecht, D.; Köberle, M.; Anderegg, U.; Saalbach, A. Melanoma cells use Thy-1 (CD90) on endothelial cells for metastasis formation. Am. J. Pathol. 2013, 182, 266–276. [Google Scholar] [CrossRef] [PubMed]
- Saalbach, A.; Wetzel, A.; Haustein, U.F.; Sticherling, M.; Simon, J.C.; Anderegg, U. Interaction of human Thy-1 (CD90) with the integrin αvβ3 (CD51/CD61): An important mechanism mediating melanoma cell adhesion to activated endothelium. Oncogene 2005, 24, 4710–4720. [Google Scholar] [CrossRef]
- Gerber, A.L.; Münst, A.; Schalpbach, C.; Shafingi, M.; Kiermeir, D.; Hüsler, R.; Hunger, R.E. High expression of FOXP3 in primary melanoma is associated with tumour progression. Br. J. Dermathol. 2014, 170, 103–109. [Google Scholar] [CrossRef]
- Zhang, S.; Zhang, D.; Sun, B. Vasculogenic mimicry: Current status and future prospects. Cancer Lett. 2007, 254, 157–164. [Google Scholar] [CrossRef] [PubMed]
- Wilke, M.C.; Wu, K.; Zhao, E.; Wand, G.; Zou, W. Prognostic significance of regulatory T cells in tumor. Int. J. Cancer 2010, 127, 748–758. [Google Scholar] [PubMed]
- Niu, J.; Jiang, C.H.; Li, C.H.; Liu, L.; Li, K. Foxp3 expression in melanoma cells as a possible mechanism of resistance to immune destruction. Cancer Immunol. Immunother. 2011, 60, 1109–1118. [Google Scholar] [CrossRef]
- Baumgartner, J.; Wilson, C.; Palmer, B.; Richter, D.; Banerjee, A.; McCarter, M. Melanoma induces immunosuppression by upregulating FOXP3+ regulatory T cells. J. Surg. Res. 2007, 141, 72–77. [Google Scholar] [CrossRef] [PubMed]
- Deschoolmeester, V.; Baay, M.; Marc, V.E.; Weyler, J.; Vermeulen, P.; Lardon, F.; Vermorken, J.B. Tumor infiltrating lymphocytes: An intriguing player in the survival of colorectal cancer patients. BMC Immunol. 2010, 12, 11–19. [Google Scholar]
- Titu, L.V.; Monson, J.R.; Greenman, J. The role of CD8+ T cells in immune responses to colorectal cancer. Cancer Immunol. Immunother. 2002, 51, 235–247. [Google Scholar] [CrossRef] [PubMed]
- Loose, D.; van de Wiele, C. The immune system and cancer. Cancer Biother. Radiopharm. 2009, 24, 369–376. [Google Scholar] [CrossRef] [PubMed]
- Yu, P.; Fu, Y. Tumor-infiltrating T lymphocytes: Friends or foes? Lab. Investig. 2006, 86, 231–245. [Google Scholar] [CrossRef] [PubMed]
- Lizee, G.; Overwijk, W.W.; Radvanyi, L.; Gao, J.; Sharma, P.; Hwu, P. Harnessing the power of the immune system to target cancer. Annu. Rev. Med. 2013, 64, 71–90. [Google Scholar] [CrossRef] [PubMed]
- Ma, M.W.; Medicherla, R.C.; Qian, M.; Vega-Saenz de Miera, E.; Friedman, E.B.; Berman, R.S.; Shapiro, R.L.; Pavlick, A.C.; Ott, P.A.; Bhardwaj, N.; et al. Immune response in melanoma: An in-depth analysis of the primary tumor and corresponding sentinel lymph node. Mod. Pathol. 2012, 25, 1000–1010. [Google Scholar] [CrossRef] [PubMed]
- Koch, M.; Beckhove, P.; Op den Winkel, J.; Autenrieth, D.; Wagner, P.; Nummer, D.; Specht, S.; Antolovic, D.; Galindo, L.; Schmitz-Winnenthal, F.H.; et al. Tumor infiltrating T lymphocytes in colorectal cancer: Tumor-selective activation and cytotoxic activity in situ. Ann. Surg. 2006, 244, 986–992. [Google Scholar] [CrossRef]
- Prall, F.; Dührkop, T.; Weirich, V.; Ostwald, C.; Lenz, P.; Nizze, H.; Barten, M. Prognostic role of CD8+ tumor-infiltrating lymphocytes in stage III colorectal cancer with and without microsatellite instability. Hum. Pathol. 2004, 35, 808–816. [Google Scholar] [CrossRef]
- Casati, C.; Dalerba, P.; Rivoltini, L.; Gallino, G.; Deho, P.; Rini, F.; Belli, F.; Mezzanzanica, D.; Costa, A.; Andreola, S.; et al. The apoptosis inhibitor protein survivin induces tumor-specific CD8+ and CD4+ T cells in colorectal cancer patients. Cancer Res. 2003, 63, 4507–4515. [Google Scholar]
- Teranishi, N.; Naito, Z.; Ishiwata, T.; Tanaka, N.; Furukawa, K.; Seya, T.; Shinji, S.; Tajiri, T. Identification of neovasculature using nestin in colorectal cancer. Int. J. Oncol. 2007, 30, 593–603. [Google Scholar] [PubMed]
- Pastushenko, I.; Vermuelen, P.B.; Carapeto, F.J.; van den Eynden, G.; Rutten, A.; Ara, M.; Dirix, L.Y.; van Laere, S. Blood microvessel density, lymphatic microvessel density and lymphatic invasion in predicting melanoma metastases: Systematic review and meta-analysis. Br. J. Dermatol. 2014, 170, 66–77. [Google Scholar] [CrossRef] [PubMed]
- Kerr, E.H.; Wang, D.; Lewis, J.S.; Said-Al-Naief, N.; Hameed, O. Lack of correlation between microvascular density and pathological features and outcomes in sinonasal and oral mucosal melanomas. Head Neck Pathol. 2011, 5, 199–204. [Google Scholar] [CrossRef] [PubMed]
- Cuitino, M.C.; Massone, A.R.; Idiart, J.R. Lack of prognostic significance of angiogenesis in canine melanocytic tumours. J. Comp. Pathol. 2012, 147, 147–152. [Google Scholar] [CrossRef] [PubMed]
- Ishiwata, T.; Matsuda, Y.; Naito, Z. Nestin in gastrointestinal and colorectal cancers: Effects on cells and tumor angiogenesis. World J. Gastroenterol. 2011, 17, 409–418. [Google Scholar] [CrossRef] [PubMed]
- Gershenwald, E.J.; Soong, S.; Balch, M.Ch.; On behalf of the American Joint Committee on Cancer (AJCC) Melanoma Staging Committee. 2010 TNM staging system for cutaneous melanoma and beyond. Ann. Surg. Oncol. 2010, 17, 1475–1477. [Google Scholar] [CrossRef]
© 2015 by the authors; licensee MDPI, Basel, Switzerland. This article is an open access article distributed under the terms and conditions of the Creative Commons Attribution license (http://creativecommons.org/licenses/by/4.0/).
Share and Cite
Zidlik, V.; Brychtova, S.; Uvirova, M.; Ziak, D.; Dvorackova, J. The Changes of Angiogenesis and Immune Cell Infiltration in the Intra- and Peri-Tumoral Melanoma Microenvironment. Int. J. Mol. Sci. 2015, 16, 7876-7889. https://doi.org/10.3390/ijms16047876
Zidlik V, Brychtova S, Uvirova M, Ziak D, Dvorackova J. The Changes of Angiogenesis and Immune Cell Infiltration in the Intra- and Peri-Tumoral Melanoma Microenvironment. International Journal of Molecular Sciences. 2015; 16(4):7876-7889. https://doi.org/10.3390/ijms16047876
Chicago/Turabian StyleZidlik, Vladimir, Svetlana Brychtova, Magdalena Uvirova, Dusan Ziak, and Jana Dvorackova. 2015. "The Changes of Angiogenesis and Immune Cell Infiltration in the Intra- and Peri-Tumoral Melanoma Microenvironment" International Journal of Molecular Sciences 16, no. 4: 7876-7889. https://doi.org/10.3390/ijms16047876