Article

The Neuronal-Specific SGK1.1 (SGK1_v2) Kinase as a Transcriptional Modulator of BAG4, Brox, and PPP1CB Genes Expression

by
Rebeca González-Fernández
1,
Julio Ávila
1,
María F. Arteaga
2,3,
Cecilia M. Canessa
2,4 and
Pablo Martín-Vasallo
1,*
1
Laboratorio de Biología del Desarrollo, UD de Bioquímica y Biología Molecular and Centro de Investigaciones Biomédicas de Canarias (CIBICAN), Universidad de La Laguna, Av Astrofísico Sánchez s/n, La Laguna, Tenerife 38201, Spain
2
Department of Cellular and Molecular Physiology, Yale University, 333 Cedar Street, New Haven, CT 06510, USA
3
Department of Medicine A, Hematology, Hemostaseology, Oncology and Pneumology, University of Muenster, Muenster 48149, Germany
4
Department of Basic Medical Sciences, Tsinghua University School of Medicine, Beijing 100084, China
*
Author to whom correspondence should be addressed.
Int. J. Mol. Sci. 2015, 16(4), 7462-7477; https://doi.org/10.3390/ijms16047462
Submission received: 30 January 2015 / Revised: 25 March 2015 / Accepted: 30 March 2015 / Published: 2 April 2015
(This article belongs to the Section Biochemistry)

Abstract

:
The Serum- and Glucocorticoid-induced Kinase 1, SGK1, exhibits a broad range of cellular functions that include regulation of the number of ion channels in plasma membrane and modulation of signaling pathways of cell survival. This diversity of functions is made possible by various regulatory processes acting upon the SGK1 gene, giving rise to various isoforms: SGK1_v1–5, each with distinct properties and distinct aminotermini that serve to target proteins to different subcellular compartments. Among cellular effects of SGK1 expression is to indirectly modulate gene transcription by phosphorylating transcriptional factors of the FOXO family. Here we examined if SGK1.1 (SGK1_v2; NM_001143676), which associates primarily to the plasma membrane, is also able to regulate gene expression. Using a differential gene expression approach we identified six genes upregulated by SGK1.1 in HeLa cells. Further analysis of transcript and protein levels validated two genes: BCL2-associated athanogene 4 (BAG-4) and Brox. The results indicate that SGK1.1 regulates gene transcription upon a different set of genes some of which participate in cell survival pathways (BAG-4) and others in intracellular vesicular traffic (Brox).

1. Introduction

The human and mouse genomes contain three independent genes coding for closely related protein families known as SGK1, SGK2, and SGK3 [1,2]. SGK1 participates in many different signaling pathways. The most studied is modulation of ion channels like the epithelial sodium channel, ENaC [3,4] and the voltage gated K+ channel Kv [5,6]. SGK1 either directly phosphorylates the channel proteins [7] or regulates their abundance in the plasma membrane through modulating the activity of the E3 ubiquitin ligase Nedd4-2 [8,9]. In addition, SGK1 also participates in various cell survival signaling pathways through the regulation of transcriptional factors like FKHRL1 [10,11], p53 [12,13], NF-κB [14,15] or β-catenin [16].
Participation of SGK1 in such a broad spectrum of cellular functions is made possible by a multilayer system of regulation that includes regulation of gene transcription by different promoters, differential splicing of transcripts that generates various isoforms (SGK1_v1–5), phosphorylation of the kinase domain that increases enzymatic activity, and specific subcellular localization of isoforms within cells [17,18,19,20,21,22]. SGK1.1 (SGK1_v2; NM_001143676) is a splice isoform conserved from rodent to humans and highly expressed in the nervous system [23,24]. These neuronal isoform differ from SGK1 in the amino terminus, which determines higher protein stability [23]. Despite a preferential localization of some SGK1 isoforms to specific subcellular compartments (SGK1 associates to endoplasmic reticulum membranes and SGK1.1 to the plasma membrane) all isoforms travel to the nucleus either constitutively or in response to external stimuli [25]. For instance, the aminoterminus of the SGK1.1 isoform contains a cluster of large hydrophobic and positively charged residues that together form a motif that binds PtdIns(4,5)P2 thereby sending SGK1.1 to the plasma membrane in resting cells [23]. Hydrolysis of PtdIns(4,5)P2 by phospholipase C triggers rapid translocation of SGK1.1 to the cytosol and nucleus raising the possibility that SGK1.1 may regulate transcription of genes involved in channel function or in cell survival [23].
The mutant SGK1.1S515D carries a negatively charged residue in the carboxyterminal hydrophobic motif where serine 515 is phosphorylated by PDK1 (3-phosphoinositide dependent protein kinase 1); this phosphorylation renders the kinase enzymatically active. Introduction of a negative residue, aspartic acid in position 515, mimics permanent phosphorylation thereby making the SGK1.1 protein constitutively active. In the mutant SGK1.1K220A lysine 220, located in the ATP binding site, has been replaced by alanine to eliminate enzymatic activity thus, this mutation is a non-active kinase [23,26].
We examined the differential gene expression induced in HeLa cells [27] by the constitutively active form SGK1.1S515D vs. the inactive form SGK1.1K220A.

2. Results and Discussion

Transfection of SGK1.1 mutants SGK1.1S515D and SGK1.1K220A in HeLa cells was performed with similar efficiency of expression at the protein level.

2.1. Screening the Subtracted cDNA Library Identified Six Independent and Differentially Expressed Clones

A subtraction was performed in order to generate a library enriched in cDNAs specifically activated by SGK1.1. The hybridization procedure separates differentially expressed cDNAs and excludes those common to cells transfected with active SGK1.1S515D and those transfected with non-active SGK1.1K220A forms. Screening of 960 clones yielded 27 that were differentially expressed between the two conditions. To confirm that those selected clones were expressed in different amounts, PCR amplified DNA was subjected to dot blot as stated in “Materials and Methods” section. Expression differences were confirmed in all 27 clones. DNA sequencing of these clones identified six independent genes while the other clones contained segments of the cloning vector. The genes were: BCL2-associated athanogene 4 (BAG4, NM_001204878.1) found in one clone; Pongo abelii BRO1 domain and CAAX motif containing (Brox, NM_144695.3) was found in three clones; radixin (RDX, NM_001260492.1) in one clone; lysocardiolipin acyltransferase (LYCAT, NM_001002257.1) in two clones; protein phosphatase 1, catalytic subunit, beta isozyme (PPP1CB, NM_002709.2) in one; and chromosome 6 open reading frame 62 (C6ORF62, XM_005249433.1) in one clone.

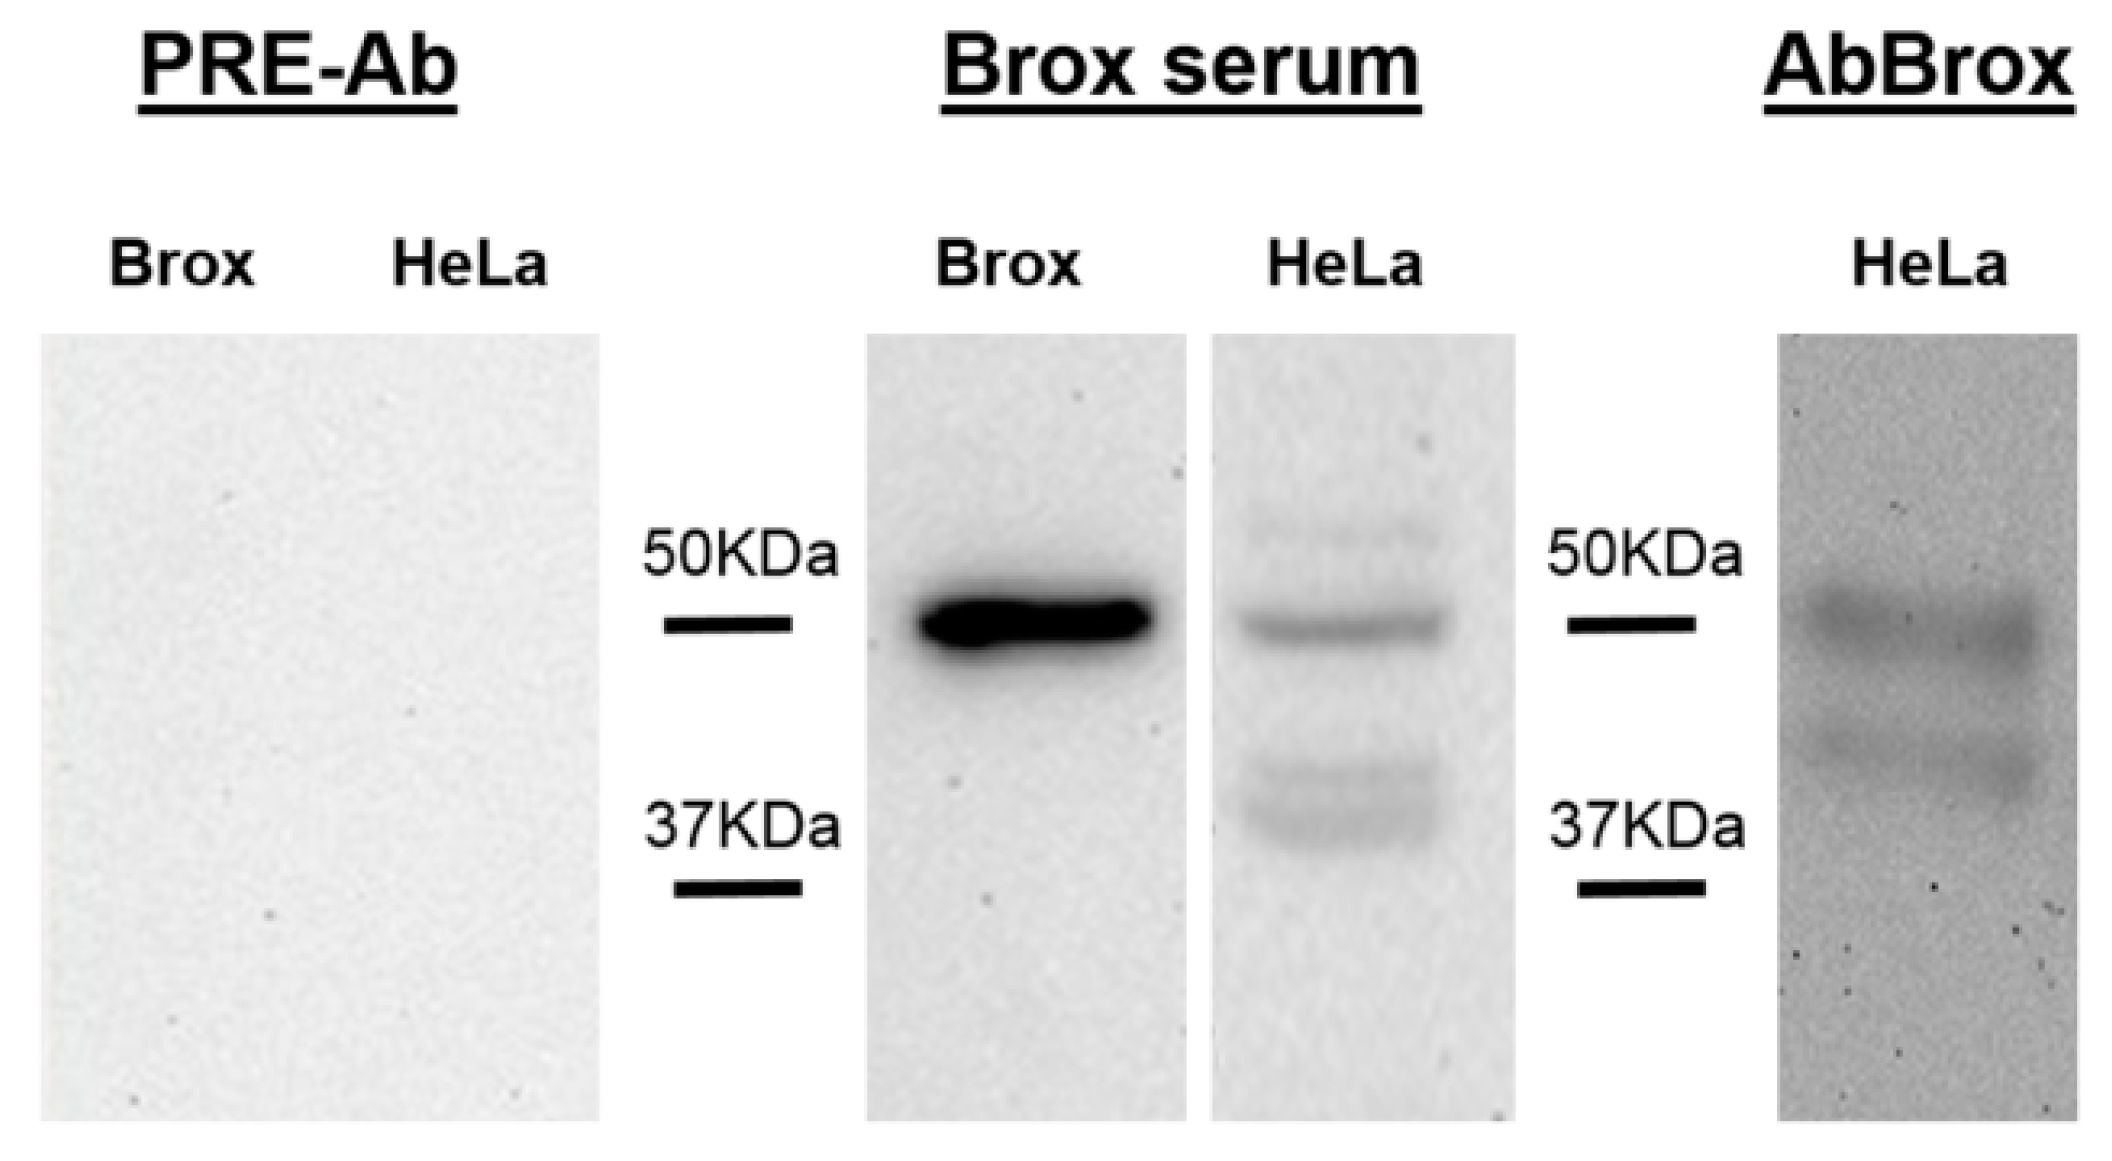
2.2. Anti-Brox Antibody (Brox-Ab) Specificity

In order to check the specificity of the antibody generated against recombinant Brox, the serum was used to probe in Western blots the E. coli recombinant protein and HeLa cells lysates. Additionally, pre-immune serum was also checked. Pre-immune serum did not recognize the recombinant protein used for the immunization or any protein in HeLa cells lysates (Figure 1). Brox anti-serum recognized the recombinant protein and identified four bands in HeLa cells, one of these with the expected molecular weight, 50 kDa. To further test the specific Brox band, we purified the serum as detailed in the Materials and Methods section. After purification, AbBrox antibody recognized two proteins identified as Brox-1 and Brox-2 of 50 and 40 kDa, respectively (Figure 1).

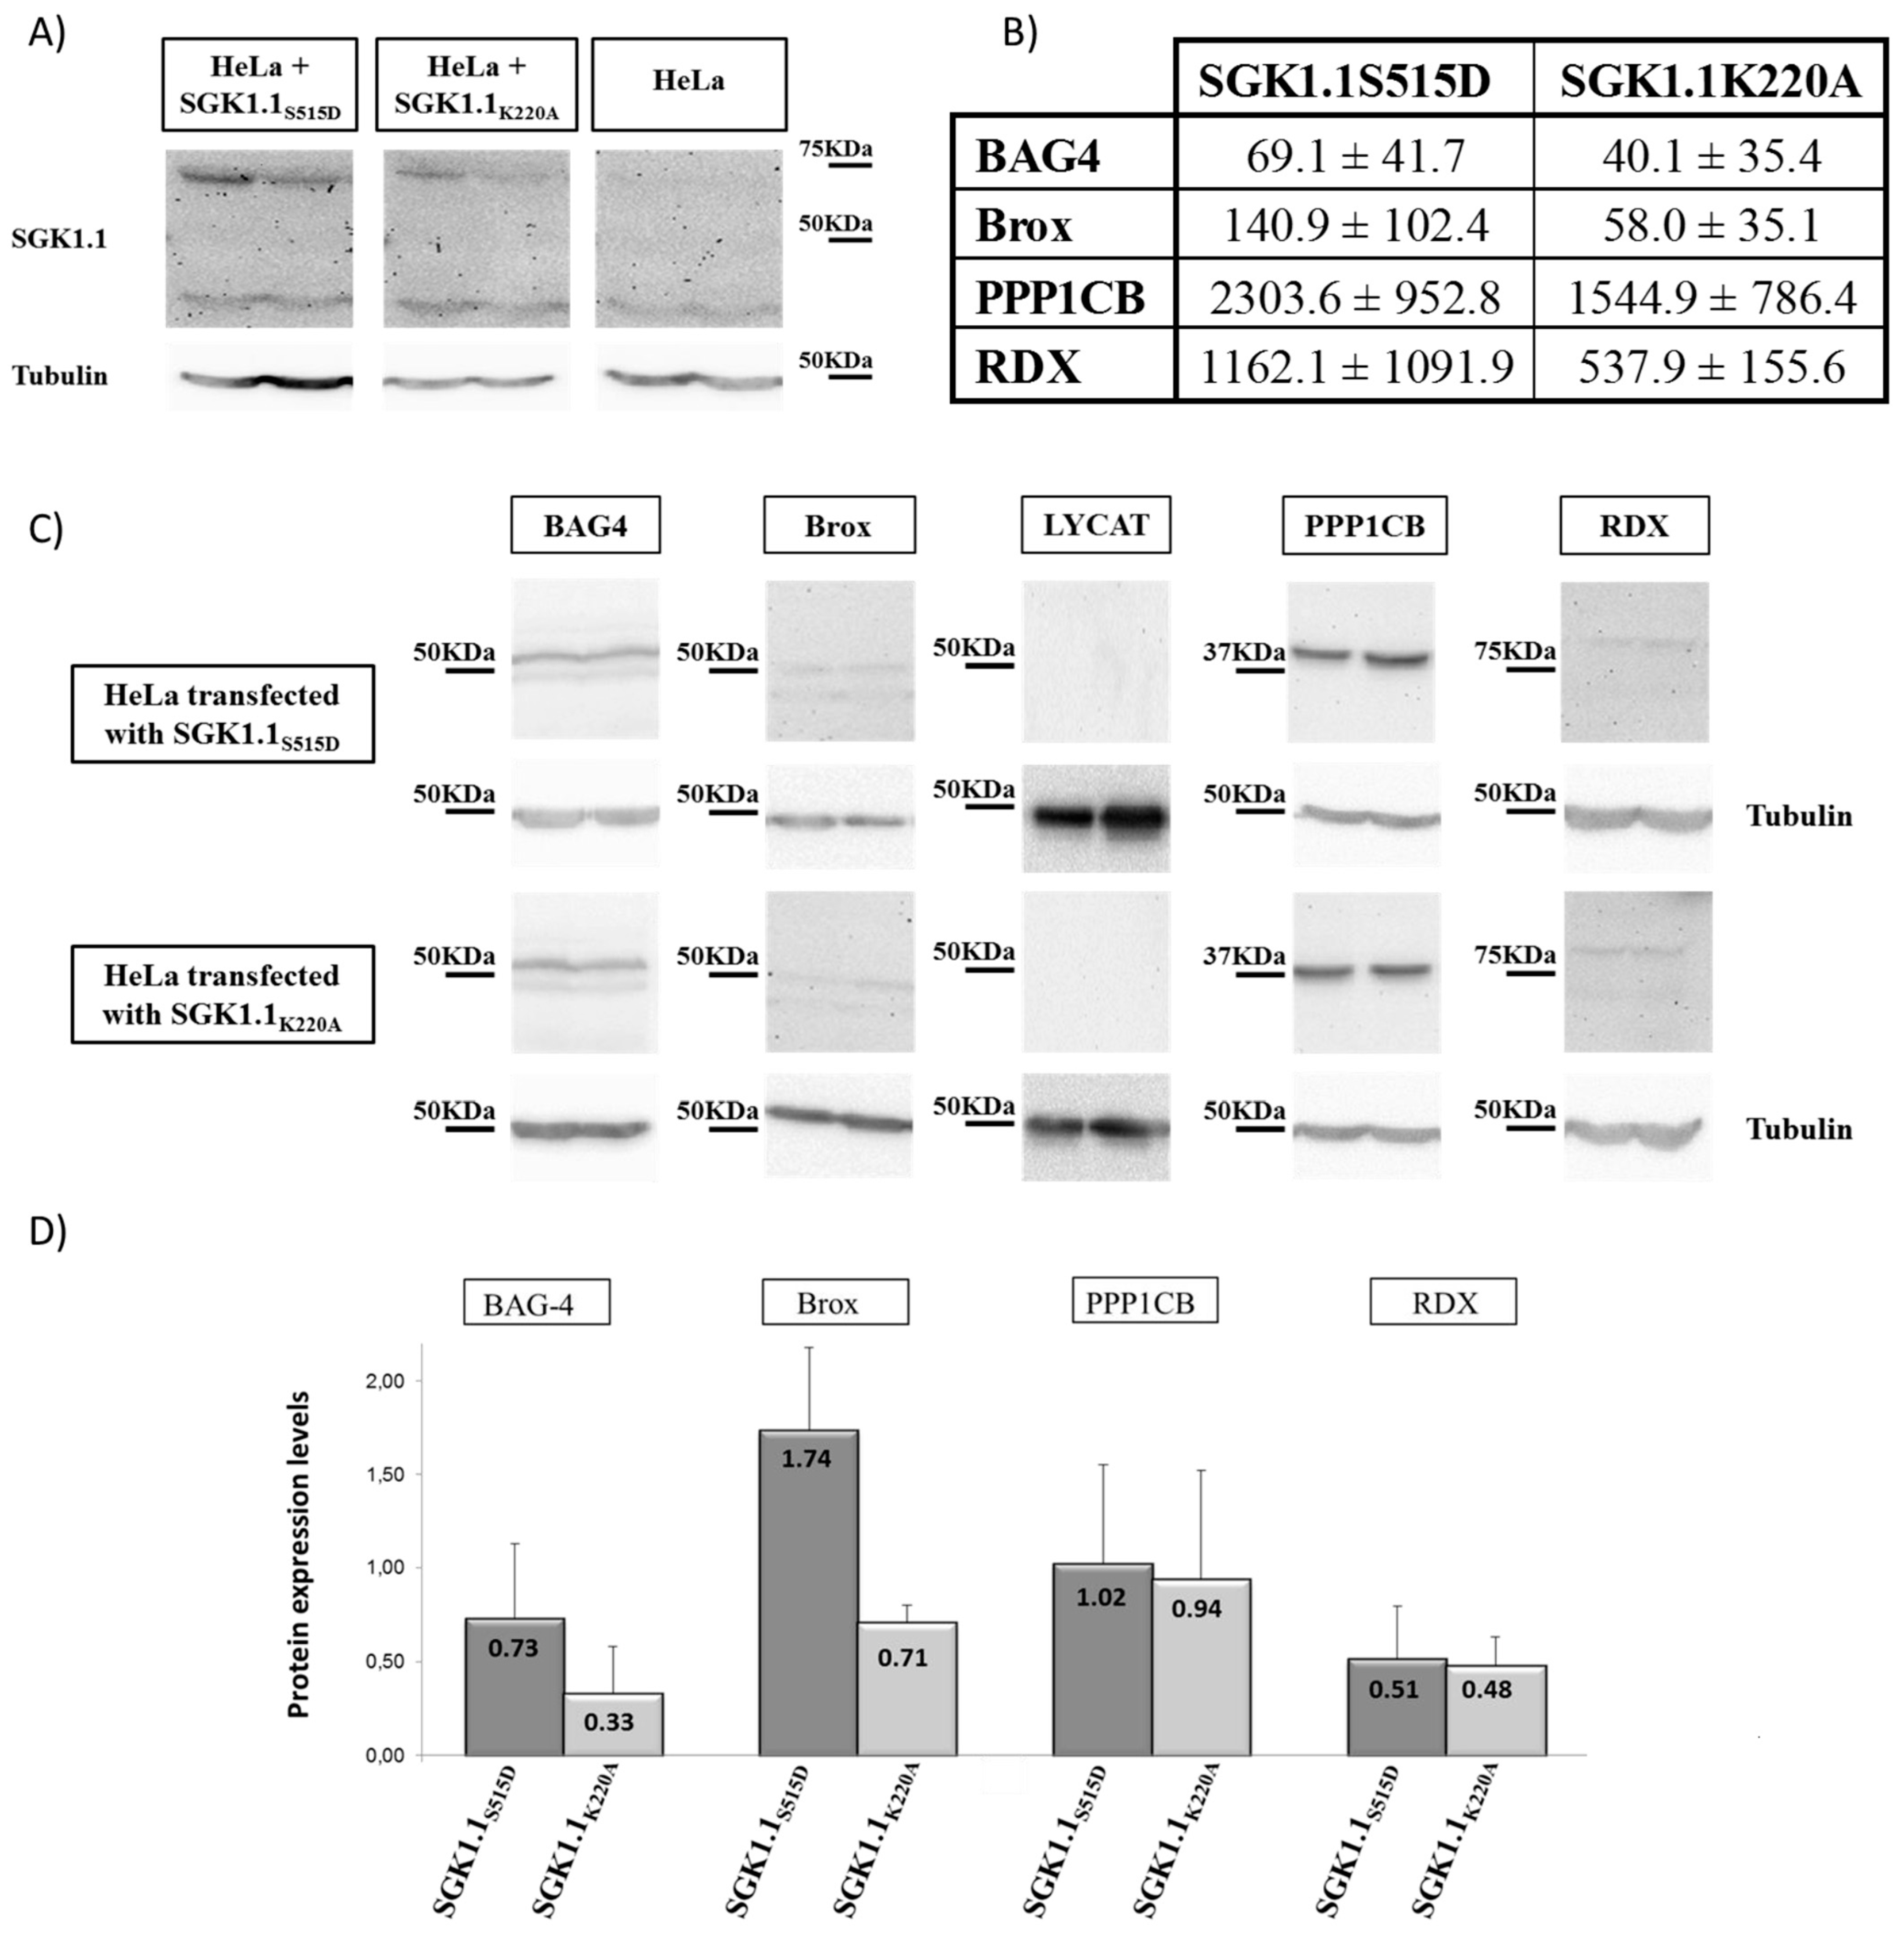
2.3. Validation of Genes Identified by Subtraction Screening

To verify reproducibility of genes identified by the subtraction method, we assessed their level of transcription by qRT-PCR in SGK1.1 transfected HeLa cells using specific primers for each of the identified genes. Twenty different batches of transfected cells (SGK1.1S515D vs. SGK1.1K220A) were analyzed. In addition, as a control for transfection efficiency, SGK1.1 expression was measured in all twenty samples. Because there is not endogenous expression of SGK1.1 in HeLa cells, no expression was found in non-transfected cells (1.5 ± 1.3) compared to SGK1.1S515D (152,235.4 ± 186,661.0) and SGK1.1K220A (36,030.0 ± 32,508.8) transfected cells.
Figure 1. Western blot of HeLa cells lysates and purified recombinant Brox protein (Brox) probed with pre-immune serum (PRE-Ab), Brox serum and purified Brox specific antibodies (AbBrox).
Ijms 16 07462 g001
From the six identified genes all showed increased expression levels in cells transfected with active SGK1.1 except for C6ORF62 whose increase was not statistically significant (Table 1). On the whole, these results suggest SGK1.1S515D up regulates expression of the remaining five genes.
Table 1. Quantification of mRNA expression of identified genes by qRT-PCR in transfected HeLa cells. Mean ± standard deviation for BAG-4, Brox, LYCAT, PPP1CB, RDX and C6ORF62 gene expression levels are expressed as ×105 relative to β-actin expression in SGK1.1S515D (active) and SGK1.1K220A (non-active) transfected cells. p value column shows the bilateral significance for each mean comparison using t student test (statistically significant difference p < 0.05).
GeneSGK1.1S515DSGK1.1K220Ap Value
BAG496.5 ± 62.141.3 ± 27.30.001
Brox178.8 ± 101.981.7 ± 61.60.001
LYCAT319.9 ± 210.1196.6 ± 117.40.029
PPP1CB2492.9 ± 1625.41528.0 ± 832.20.023
RDX1355.0 ± 961.6829.7 ± 638.50.042
C6ORF624684.2 ± 2856.74341.8 ± 3026.00.715
We next examined expression of the identified genes at the protein level by Western blot using commercially available antibodies and β-tubulin as reference for relative expression (Figure 2). Panel A shows an example of two Western blot lines from the eight Western blots performed for each protein in active and non-active transfected cells. Panel B shows mean and typical error of BAG4, Brox, PPP1CB and RDX relative protein expression in SGK1.1S515D and SGK1.1K220A transfected cells. Bars in chart (Figure 2, panel B) represent the mean of eight independent experiments.
No LYCAT expression at the protein level was observed in HeLa cells, thus no densitometry analysis was performed (Western blot in Figure 2). SGK1.1 expression served as a control for transfection efficiency of each group SGK1.1S515D = 2.10 ± 1.15; SGK1.1K220A = 1.78 ± 0.82; vs. non-transfected cells that gave a value of 0.23 ± 0.09 relative to β-tubulin expression.
Figure 2. Western blots (A,C), quantification of mRNA relative expression (B) and bar chart of protein expression (D) of BAG-4, Brox, LYCAT, PPP1CB and RDX of same eight HeLa cultures of transfected cells used for (D) data. (A) Examples of SGK1.1 expression in transfected and no transfected HeLa cells and tubulin reference; (B) Mean ± standard deviation for BAG-4, Brox, PPP1CB and RDX gene expression as ×105 relative to β-actin; (C) Examples of quantitated proteins and tubulin reference; (D) BAG-4, Brox, PPP1CB and RDX proteins expression levels relative to β-tubulin shown as mean ± standard deviation.
Ijms 16 07462 g002
Endogenous BAG4 and Brox proteins expressed at higher levels in the presence of SGK1.1S515D than SGK1.1K220A while no significant difference was observed with PPP1CB and RDX. These results are in agreement with the transcripts abundance in the same transfected cultures used for protein quantification (Figure 2, panel C), strengthening the validity of the subtraction screening. Exceptions are RDX and PPP1CB, whose transcript was increased in the eight samples (Figure 2, panel C), however, at the protein level the increment was much smaller, indicating that in the present model the final regulation of RDX and PPP1CB expression is much more complex than expected.

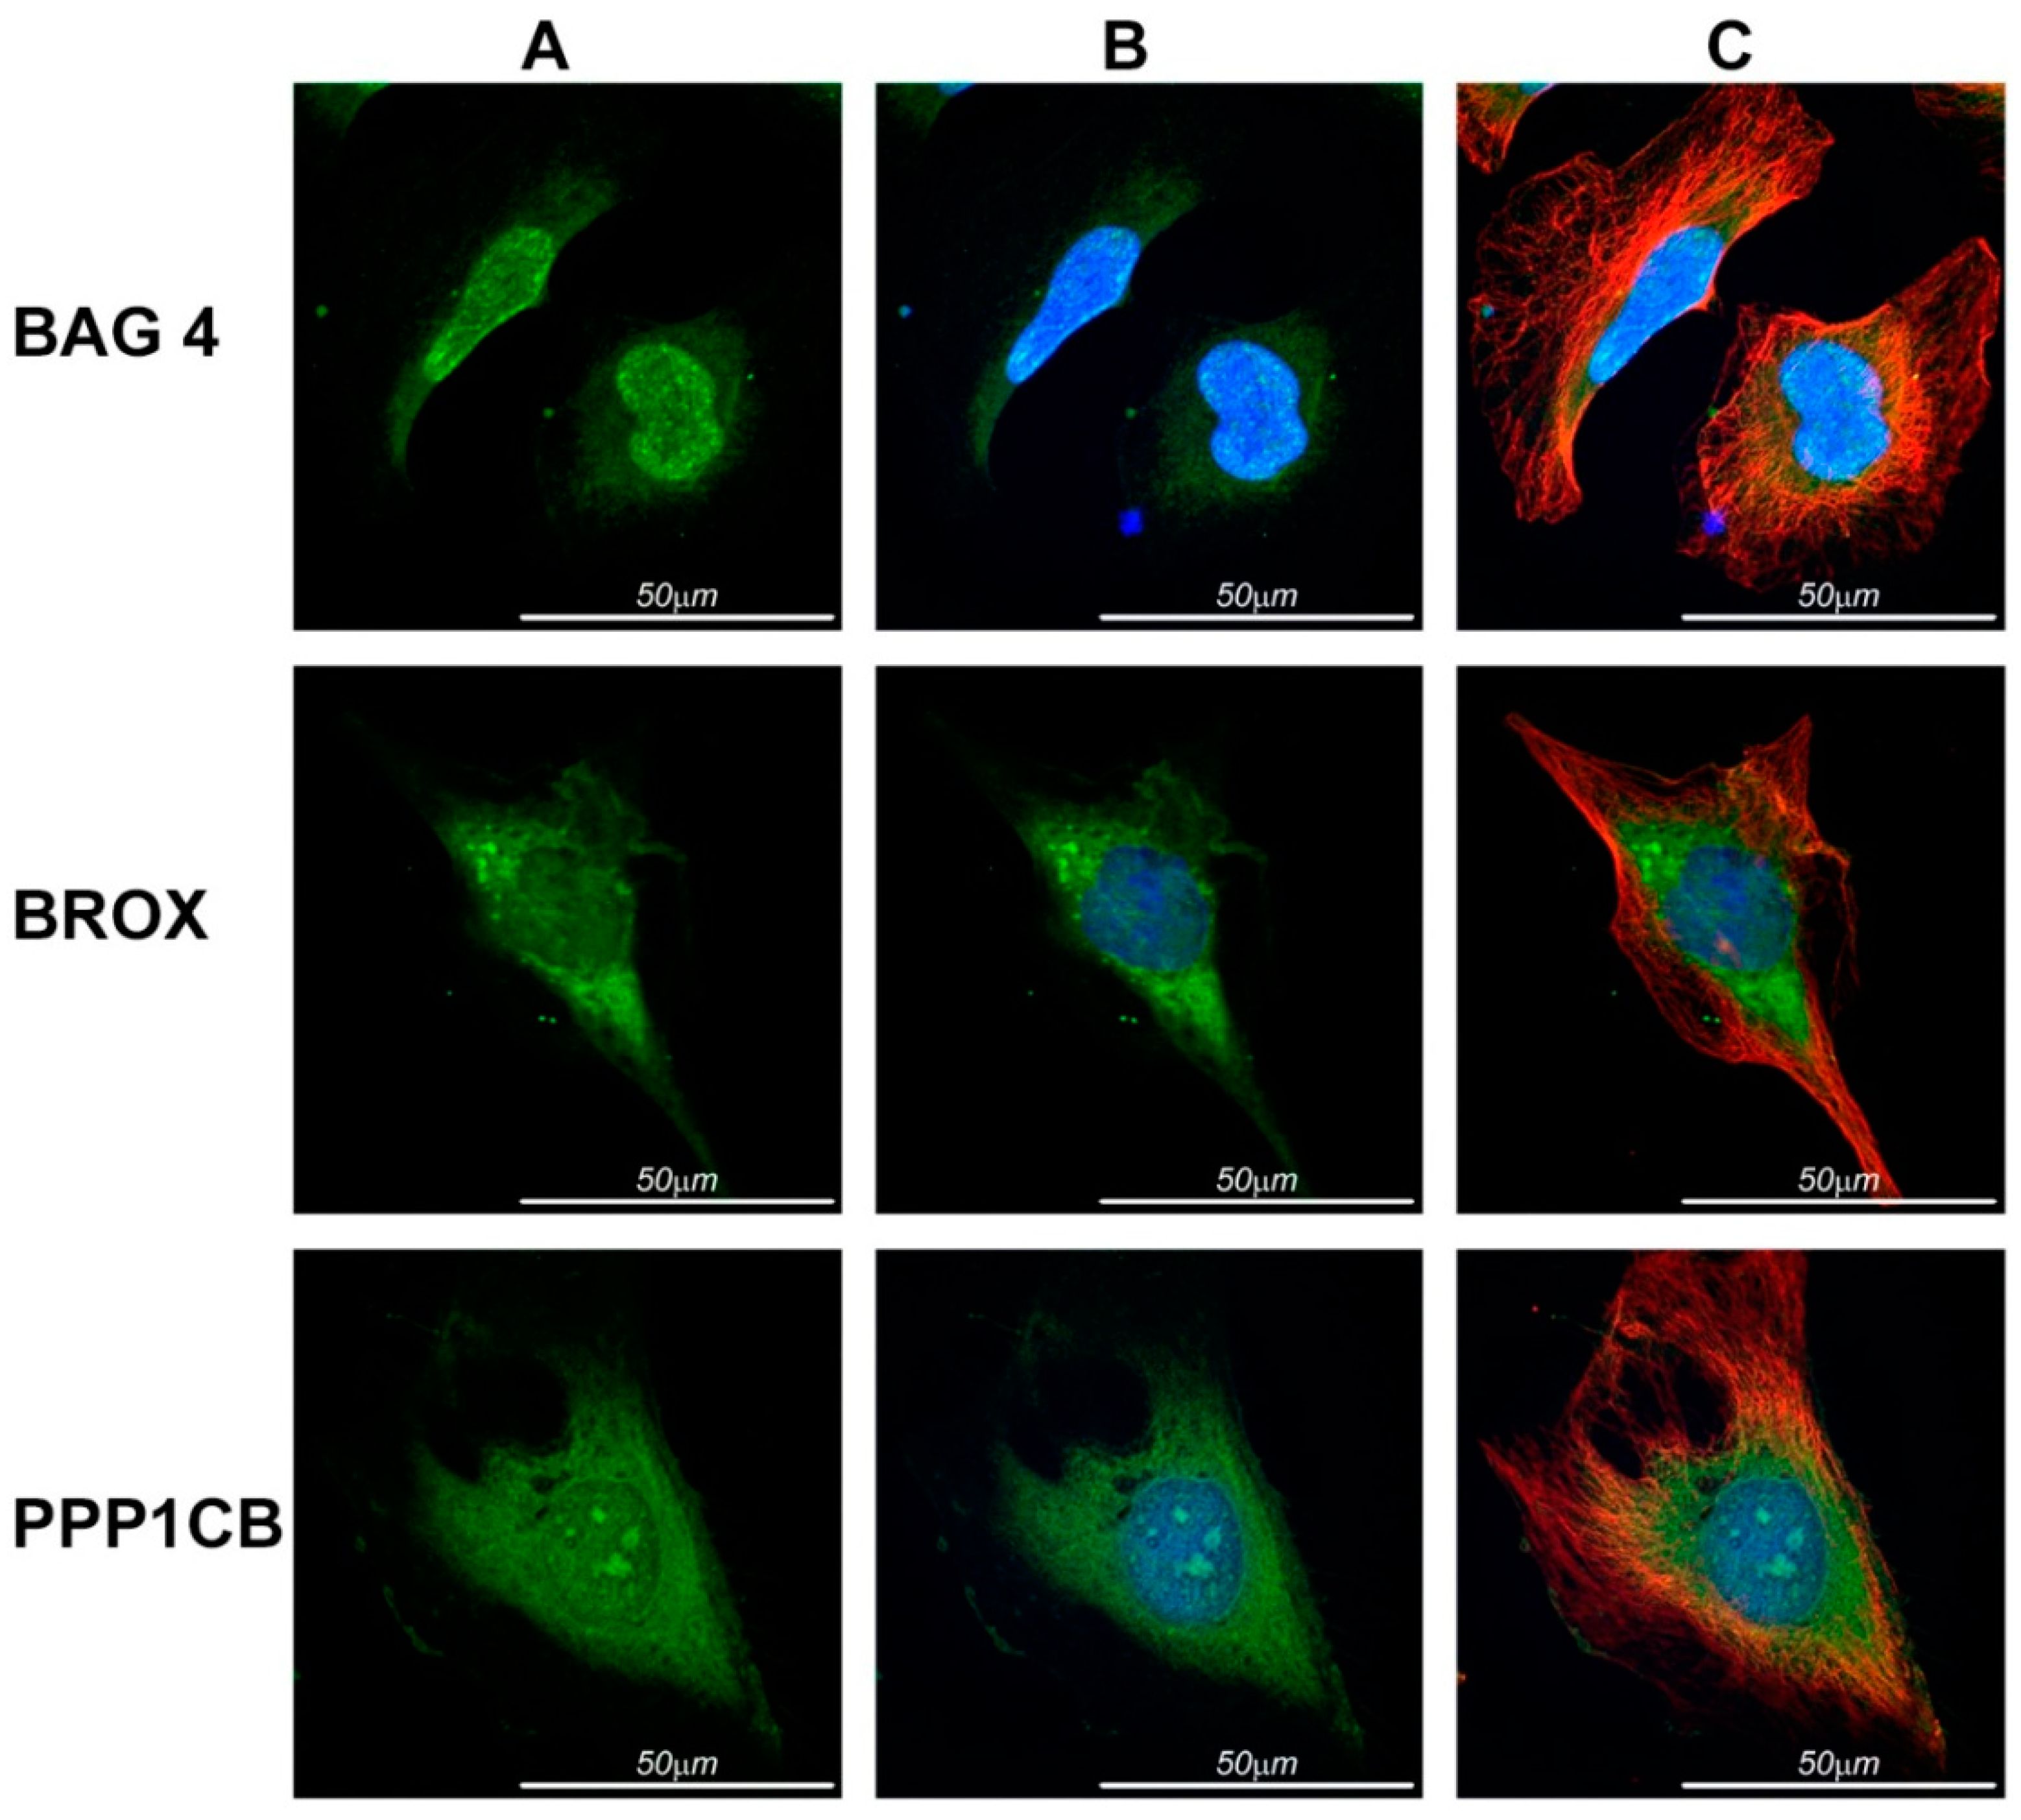
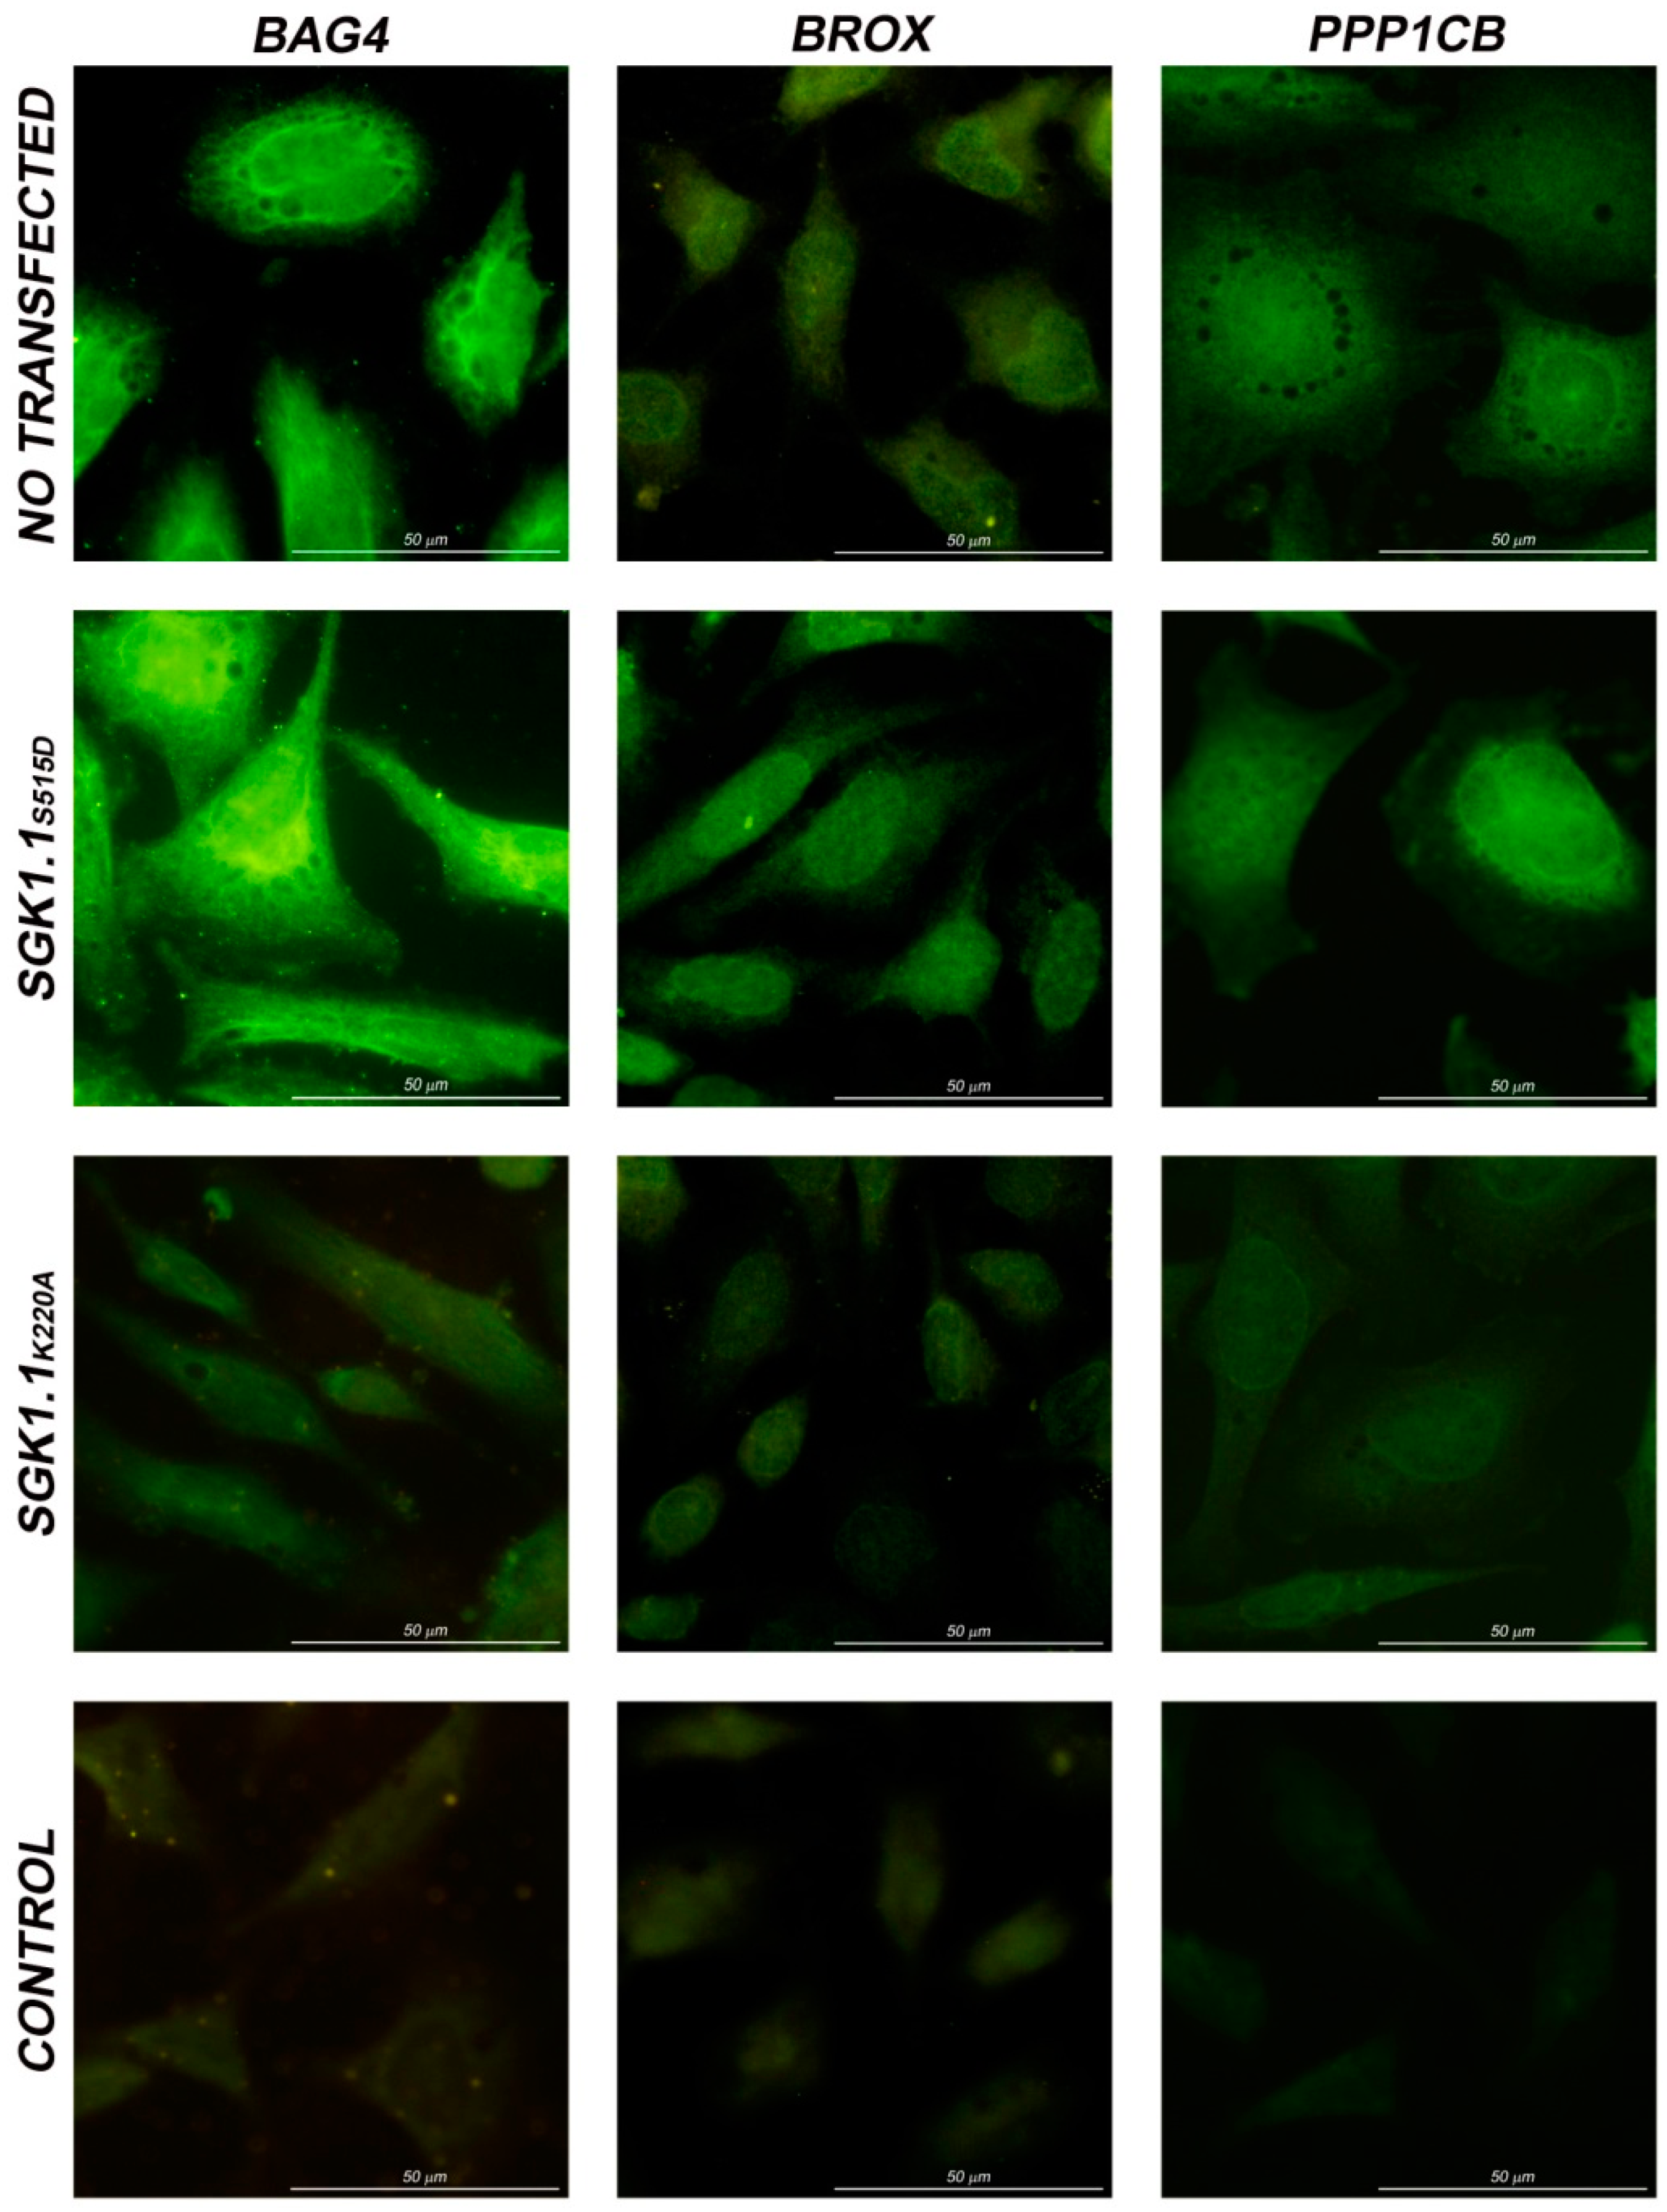
2.4. Immunolocalization in HeLa Cells

Immunocytochemistry of endogenous BAG-4, Brox and PPP1CB proteins was performed on HeLa cells using antibodies specific for each protein and co-staining with DAPI and β-tubulin and confocal microscopy images taken (Figure 3).
Figure 3. Subcellular localization of BAG4, Brox and PPP1CB in non-transfected HeLa cells. (A) Studied proteins using specifics antibodies are shown in green; (B) merge of studied proteins (green) and nucleus (blue) labeled with DAPI; (C) merge of studied proteins (green), nucleus (blue) and β tubulin (red).
Ijms 16 07462 g003
Immunostaining of BAG4 was localized in nucleus and cytoplasm, mainly in the perinuclear area, extending as thin branches over the cytoplasm. Brox fluorescent signal was found around nuclei and also in the cytoplasm, where showed in a granular pattern suggestive of intracellular vesicles. PPP1CB signal was located throughout the cell in a punctum pattern.
Fluorescence intensity was higher in cells transfected with active SGK1.1 than in those transfected with the non-active form (Figure 4). All three proteins exhibited the same subcellular localization and pattern of expression in non-transfected and SGK1.1 transfected cells.
Figure 4. Immunolocalization of BAG-4, Brox and PPP1CB in non-transfected HeLa cells and SGK1.1S515D or SGK1.1K220A transfected HeLa cells. Negative control for secondary antibody at the same exposure time of the corresponding experiment.
Ijms 16 07462 g004
BAG4, Brox and PPP1CB expression in non-transfected cells is higher than in non-active SGK1.1 transfected cells. However, we must consider that SGK1.1K127A is an enzymatically inactive mutant, but with the same structure and the same binding capacity that SGK1.1. Furthermore, as SGK1.1 modulates the expression of these genes, but not exclusively, the overexpression of the inactive form could interfere the action of other possible kinases also involved in transcriptional regulation by competing for the binding of common substrates.
To determine whether SGK1.1 also functions as a regulator of gene expression and to identify genes under transcriptional control by SGK1.1, we constructed and screened a differential subtraction library between cells expressing constitutively active and non-active SGK1.1 mutants. Six differentially expressed genes were identified in HeLa cells. We chose HeLa cells in order to avoid the effect of endogenous SKG1.1 background expression in the present study. We can then be sure that the differential changes are due to transfected SGK1.1. Further analysis validated five of those genes that were up-regulated at the transcription level: BAG-4, Brox, LYCAT, PPP1CB and RDX. At the protein level, BAG4 and Brox were validated by Western blot and immunohistochemistry analysis. In Western blot, differences in PPP1CB protein levels between active and non-active SGK1.1 transfected cells observed were small; however, these differences were clearly observed in immunocytochemistry experiments showing cell by cell contrasting staining levels. No change in subcellular distribution was observed. For Western blot we used the total cells obtained in the transfected culture in which not all the individual cells are transfected. No expression of LYCAT at the protein level was found using available antibodies. However, we confirmed that the antibody recognized LYCAT in liver and heart tissues samples (data not shown).
The identified and validated genes belong to families of proteins that have very different functions: cell survival by inhibiting signaling pathways that lead to apoptosis (BAG-4) [28,29], modulation of endosomal traffic (Brox) [30,31], and phosphatase activity (PPP1CB) [32]. The specific contributions of these proteins to the effects carried by SGK1.1, namely regulation of ion channel activity or cell survival, are not known yet but deserve further investigation. In particular, involvement of Brox in vesicular traffic is of great interest given the recognized importance of endocytosis and vesicular recycling in setting the number of ion channels at the plasma membrane.
Since SGK1.1 is a protein kinase and not a transcription factor, the most likely mechanism underlying the upregulation of gene expression is phosphorylation of a transcriptional factor or enhancer. Indeed, the isoform SGK1 phosphorylates and negatively regulates members of the FOXO family of transcription factors involved in promoting apoptosis [10,33]. No genes identified in the subtraction library have their transcription controlled by FOXO suggesting that SGK1.1 effects occur by targeting some other transcription factors different from FOXO. The difference might lie in the localization to the plasma membrane that exposes SGK1.1 to a different set of substrate molecules and a different mode of activation than those of the isoform SGK1.
In addition, it is possible that SGK1.1 targeted genes are cell specific. Consequently, a similar subtraction experiment conducted in other cell lines or tissues may lead to identifying additional genes. It would be worth conducting this experiment in cells that express endogenous ENaC, Kv1.3 or other ion channels regulated by SGK1.1 in order to identify novel regulatory genes.
SGK1 increases cell survival in development [14], T cell differentiation [34], and the proliferation of cancer cells; to a large extent—though not exclusively—by inhibiting apoptosis. The molecular pathways vary in different cell types and conditions. For instance, DNA damage induces SGK1 that by phosphorylating and inactivating the FOXO3a transcription factor increases survival [13], or by activating IкB kinase [15]. SGK1 phosphorylation of glycogen synthetase-3 leads to macrophage survival by stabilizing the antiapoptotic protein Mcl-1 [35]. Hence, SGK1.1 upregulation of BAG-4, a protein that binds to TNF-R1 and inhibits activation by TNFα, is in concordance with the overall antiapoptotic functions of SGK1.
SGK1 also regulates the ubiquitin ligase Nedd4 that promotes endocytosis of cell surface membrane proteins [36]. We found here that SGK1.1 upregulates Brox, a protein that binds to the endosomal sorting complex required for transport of ubiquitinated cargos into multivesicular bodies. Thus, SGK1 targets several steps in this pathway: ubiquitination of cargo at the plasma membrane and transport of endosomes containing ubiquitinated cargo for degradation in multivesicular bodies.

3. Experimental Section

3.1. Site Directed Mutagenesis

Mouse SGK1.1 cloned in pcDNA3.1/v5–His–TOPO (Invitrogen, Carlsbad, CA, USA) was used as the expression vector. Point mutations in SGK1.1 sequence were introduced using QuickChange Site-Directed Mutagenesis Kit (Stratagene, La Jolla, CA, USA) to generate the active mutant SGK1.1S515D and the non-active mutant SGK1.1K220A [23,26]. DNA sequencing confirmed presence of the introduced mutations.

3.2. Cell Culture and Transfection

HeLa cells were cultured in F12K (Kaighn’s modification of Ham’s F12) medium with 10% fetal calf serum at 37 °C, 5% CO2. Cells 90%–95% confluent were transfected with SGK1.1S515D, SGK1.1K220A, or with empty pcDNA 3.1 TOPO vector using Lipofectamin 2000 (Invitrogen, Carlsbad, CA, USA). The amount of DNA and lipofectamin used was half of that indicated in the manufacture instructions. By using half of the dose recommended we achieved equal transfection efficiency at increased cell viability. Twelve hours after transfection, culture medium was substituted for fresh medium with no fetal calf serum, and cells were incubated for four additional hours until collected in cold PBS (in mM): 137 NaCl, 2.7 KCl, 8 Na2HPO4, and 1.8 KH2PO4.

3.3. mRNA Extraction from Cells, Double Stranded cDNA Synthesis and PCR Amplification

HeLa cells were collected by centrifugation at 300× g for 5 min. mRNA from the pellet was extracted with Total Aurum RNA extraction kit (Bio–Rad, Mannheim, Germany), following the manufacturer’s instructions.
cDNA to be used in real-time quantitative RT-PCR (qRT-PCR) assay was synthesized using the iScript cDNA Synthesis kit (Bio–Rad, Mannheim, Germany). For the subtraction library we used the Super SMART PCR cDNA Synthesis kit (Clontech Laboratories, Mountain View, CA, USA), according to the manufacturer’s instructions. This kit uses PowerScript Reverse Transcriptase (Clontech), which allows synthesis of a high percentage of full-length cDNAs. Clean ds-cDNA was amplified by LD-PCR. Only full-length cDNA was amplified by using 5' PCR primer IIA, which hybridizes to the small sequence added during the cDNA synthesis process. Protocol was as follows: 95 °C for 60 s and X cycles of 95 °C for 15 s, 65 °C for 30 s and 68 °C for 6 min. X is the number of cycles previous to saturation, but enough for amplifying all cDNA of the sample in order to maintain the original ratio of gene expression.

3.4. ds-cDNA Subtraction and Library Construction

A subtraction library was prepared using the “Clontech PCR Select cDNA Subtraction Kit” (Clontech, Palo Alto, CA, USA) [37] following the manufacturer’s instructions using ds-cDNA from SGK1.1S515D and SGK1.1K220A transfected cells. The pool of differentially expressed Non-subtracted cDNAs from SGK1.1S515D were cloned into pBluescript SK+ vector using T4 ligase (Promega, Madison, WI, USA) at 16 °C overnight and transformed into competent E. coli XL2-Blue cells by electroporation.

3.5. Dot-Blot Screening

Probes used were subtracted cDNA obtained from cells transfected with active and non-active SGK1.1 and digoxigenin-dUTP labelled (Roche Diagnostic, Indianapolis, IN, USA) using Klenow enzyme (Roche Diagnostic, Indianapolis, IN, USA).
Electroporated E. coli XL2-Blue cells were seeded in LB agar plates containing ampicillin (0.1 mg/mL), X-Gal (40 µg/mL) and IPTG (0.2 mM) and incubated at 37 °C overnight. Colonies containing insert were picked and placed into 96-well plates in liquid LB-ampicillin (0.1 mg/mL) medium and incubated at 37 °C overnight. A volume of 1 µL from each cultured well was placed by duplicate onto two different Roche (Roche Diagnostic, Indianapolis, IN, USA) nylon membranes and incubated at 37 °C overnight over LB-ampicillin (0.1 mg/mL) solid medium plates. Duplicate membranes were probed with both probes overnight at 68 °C. After washing and blocking, the membranes were incubated in Blocking solution containing Anti-Digoxigenin-AP (Roche Diagnostic, Indianapolis, IN, USA) for 30 min, washed twice and detected with CDP-Star (Roche Diagnostic, Indianapolis, IN, USA) as directed by manufacturer.
Positive clones were re-tested by double-dot-blotting of the PCR amplified product using T3 and T7 flanking sequences primers. Membranes were probed and detected as stated above.

3.6. DNA Sequencing and Sequence Identification

DNA from each clone was prepared with the Qiaprep kit (Qiagen, Hilden, Germany) following manufacturer’s instructions. DNA inserts were sequenced from both ends at La Laguna University DNA Sequencing Facility. Obtained DNA sequences were aligned to those in the GenBank, EMBL, DDBJ and PDB databases using the BLASTN and BLASTX algorithms [38].

3.7. Gene Expression Analysis by Quantitative RT-PCR (qRT-PCR)

All PCR reactions were carried out using a Bio–Rad CFX96 Real-Time PCR System (Bio–Rad, Hercules, CA, USA). Primers specific for each gene amplification were: BAG-4 (F = ACTGTCAGACTGAAGCACC; R = AACACTACGATTACCATCTCC), Brox (F = TTTGATCTCACCAAAAGACC; R = GATGTAGCACCCAGTGTCC), LYCAT (F = GCAACATGGCTCACCCTACC; R = ATTCCACAGGAACATCCAGTCC), PPP1CB (F = GGAGGATTGTCACCAGACC; R =AGACCATAGCAAATCACAGAGC), RDX (F = CGAGGAAGAACGTGTAACC; R = CCTGCTTTAACATTCTCAGC), C6ORF62 (F = TACAGCTCCATGCTCCTCG; R = GCTCATCAGATTCTTTCCACC) and SGK1.1 (F = CCCCAACTTGAAGTACACTGG; R = CATCCCCCTTTGGAAAGC). PCR was performed in a 10 μL final volume containing 2× SYBR Green Supermix (100 mM KCl, 40 mM Tris–HCL pH 8.4, 0.4 mM of each dNTP, iTaq DNA polymerase 50 units/mL, 6 mM MgCl2, SYBR Green I, 20 nM fluorescein, and stabilizers (Bio–Rad Laboratories, Hercules, CA, USA) and 10 μM of each primer.
Samples were analyzed in triplicate, and multiple water blanks were included in experiments. The thermal profile consisted on: 5 min denaturation at 95 °C, 40 cycles of PCR performed at 95 °C for 10 s, 59 °C for 20 s and 72 °C for 15 s, and melting curve program 65 to 95 °C with a heating rate of 0.1 °C/s and read every 0.5 °C. The housekeeping gene β-actin (F = CTTCCTTCCTGGGCATGG; R = GCCGCCAGACAGCACTGT) was amplified as a reference for mRNA quantification. Expression levels of each gene are presented as individual data points as 2ΔCt [39]. All gene expression data are referred as ×105 relative to β-actin expression.

3.8. Plasmid Construction and Preparation of Recombinant Brox Protein

Human Brox sequence was amplified by PCR from cDNA of HeLa cells using Phusion polymerase (Thermo Scientific, Waltham, MA, USA) following the manufacturer’s instructions. A 1275 pb BamHI/EcoR1I fragment representing the entire Brox coding region was amplified (Brox; F1 = CGGGATCCCGGAGAAAATGACCCATTGG, R1 = CGGAATTCCGCTGCTAGAGAAATTCTAAGTGC). Sequence fidelity was checked by sequencing after cloning into pRSET-c expression vector (Invitrogen, Carlsbad, CA, USA). The recombinant protein was expressed in Escherichia coli BL21(DE) cells by induction with 1 mM isopropyl-β-d-thiogalactopyranoside (IPTG) at 37 °C for 4 h. Purification of the recombinant protein was performed using HisTrap FF column (GE Healthcare, Little Chalfont, UK) following the manufacturer’s instructions.

3.9. Production and Purification of Polyclonal Antibodies against the Brox

Antiserum against human recombinant Brox was raised in a male New Zealand rabbit in the La Laguna University Animal Care Facility. Animal care and experimental procedures used for this work were approved by the Institutional Animal Care and Use Ethical Committee at the University of La Laguna, for founded projects FIS PI11/00114 (September 2011) and FIS PI12/00729 (September 2012). Before injecting the immunogen, pre-immune serum was collected and treated as described above for the Brox serum. The rabbit was injected subcutaneously with 0.5 mL (200 µg) of purified recombinant protein emulsified with an equal volume of Freund’s complete adjuvant. Two additional injections were given with a ten days interval, with 100 µg recombinant protein mixed with incomplete Freund’s adjuvant in same proportions. Ten days after the final injection, blood was collected and clotting allowed for one hour at 37 °C and overnight at 4 °C. The antiserum (Brox serum) was collected by centrifugation (7000× g, 5 min).
Purification of anti-Brox antibodies was performed using HisTrap FF column (GE Healthcare, Little Chalfont, UK) linked to Brox recombinant protein. After passing the serum through the column, specific antibodies retained were eluted with 100 mM glycine pH 2.5 (AbBrox). Neutral pH was restored by adding 1/10 of total volume of 1 M Tris buffer pH 8. Antibodies were further purified by ionic exchange chromatography in columns of protein A-Sepharosa from S. aureus (Sigma, St. Louis, MO, USA).

3.10. Protein Expression Analysis by Western Blot

Protein extract from homogenized cells were electrophoresed on a denaturing 12% polyacrylamide gel and transferred to Immobilon™-P membranes (Millipore, Bedford, MA, USA) by electroblotting. Membranes were blocked in PBS/5% BSA for 1 h. Protein detection was performed using available antibodies BAG-4 (SODD H300, 1:1000; Santa Cruz Biotechnology, Santa Cruz, CA, USA), Brox (AbBrox, 1:5000; P. Martín-Vasallo/J. Ávila), LYCAT (Anti-LCLAT1 antibody-C-terminal, 1:1000; Abcam, Cambridge, UK) PPP1CB (PPP1CB, 1:100,000; Abcam, Cambridge, UK), RDX (RDX 215R+, 1:1000; a gift from Dr Woodward, [40] ) and SGK1 (SGK ct, 1:5000; [3]. Secondary antibody was anti-rabbit Ig Horseradish peroxidase (GE Healthcare, Little Chalfont, UK) and secondary sheep anti-mouse (Sigma, St Louis, MO, USA). Detection was performed using ECL plus (GE Healthcare, Little Chalfont, UK) reagents according to the manufacturer’s instructions. Western blot quantification was measured using Quantity One Image software in a Molecular Imager, ChemiDoc XRS (Bio–Rad Laboratories, Hercules, CA, USA), as relative expression compared to β-tubulin (β Tubulin (37), 1:1000; Santa Cruz Biotechnology, Santa Cruz, CA, USA). ChemiDoc XRS software converts Western blot signals into digital data and allows us to measure the total signal intensity inside a defined area, subtracts local background, and quantifies the relative protein expression [41].

3.11. Immunofluorescence Microscopic Analyses

HeLa cells seeded on 15 mm coverslips pre-coated with poly l-lysine (Sigma, St. Louis, MO, USA), were fixed in methanol 100% for 6 min at −20 °C. After washing three times with PBS buffer, the cells was blocking with universal blocking buffer (1% BSA, 0.1% gelatine, 0.5% Triton X-100, 0.05% sodium azide, 0.01 M PBS pH 7.4). Then, cells were incubated for 1 h at room temperature with the primary antibody (BAG-4 1:500, AbBrox 1:500, PPP1CB 1:500, β-tubulin 1:150) diluted in blocking solution, washed three times with PBS buffer and incubated 1 h with Anti-rabbit IgG FITC conjugate (Sigma, St. Louis, MO, USA) and, in the co-staining experiments, with Anti-mouse IgG-Fc DyLight 650 (Abcam, Cambridge, UK) diluted in TBS-T (0.05 M Tris, 0.9% NaCl, 0.05% Tween 20, pH 8.4). Finally, the coverslips were mounted with glycerol: PBS 9:1 and analyzed under Olympus BX-50 fluorescence microscope (Olympus, Tokyo, Japan) or with ProLong Diamond Antifade Mountant with DAPI (Thermo Fisher Scientific Inc., Waltham, MA, USA) under Leica AF confocal microscope (Leica Microsystems CMS, Mannheim, Germany).

3.12. Statistical Analysis

Statistical analysis was performed using the SPSS 20 software (IBM, Madrid, Spain). Measure of statistical dispersion of mean difference was calculated as unpaired t-test analysis and p < 0.05 was considered statistically significant.

4. Conclusions

This work shows that the isoform SGK1.1 modulates transcription of genes that are distinct from those regulated by the more ubiquitous isoform SGK1: BAG, Brox, RDX, LYCAT, and PPP1CB genes. Most likely, the differential effect is mediated through phosphorylation of isoform-specific transcription factors and/or enhancers. The novel genes identified here participate in signaling pathways that promote cell survival and in modulating vesicular traffic, which has implications for shuttling ion channels to and from the plasma membrane.
This fact might play a role during development of neurodegenerative diseases and responses to noxious stimuli to the brain. However, this hypothesis needs to be tested further.

Acknowledgments

This work was supported by grant FIS PI11/00114 to Pablo Martín-Vasallo and grant FIS PI12/00729, Spain, to Julio Ávila. We thank Sonja Kennington, for English language supervision.

Author Contributions

Conceived and designed the study and experiments: Rebeca González-Fernández, Julio Ávila, María F. Arteaga, Cecilia M. Canessa and Pablo Martín-Vasallo. Performed the experiments: Rebeca González-Fernández, Julio Ávila and María F. Arteaga. Analyzed the data: Rebeca González-Fernández, Julio Ávila, Cecilia M. Canessa and Pablo Martín-Vasallo. Wrote the paper: Rebeca González-Fernández, Cecilia M. Canessa, Julio Ávila and Pablo Martín-Vasallo.

Conflicts of Interest

The authors declare no conflict of interest.

References

  1. Kobayashi, T.; Deak, M.; Morrice, N.; Cohen, P. Characterization of the structure and regulation of two novel isoforms of serum- and glucocorticoid-induced protein kinase. Biochem. J. 1999, 344 Pt 1, 189–197. [Google Scholar] [CrossRef]
  2. Kobayashi, T.; Cohen, P. Activation of serum- and glucocorticoid-regulated protein kinase by agonists that activate phosphatidylinositide 3-kinase is mediated by 3-phosphoinositide-dependent protein kinase-1 (PDK1) and PDK2. Biochem. J. 1999, 339, 319–328. [Google Scholar] [CrossRef] [PubMed]
  3. Alvarez, D.L.R.; Canessa, C.M. Role of SGK in hormonal regulation of epithelial sodium channel in A6 cells. Am. J. Physiol. Cell Physiol. 2003, 284, C404–C414. [Google Scholar] [CrossRef] [PubMed]
  4. Watt, G.B.; Ismail, N.A.; Caballero, A.G.; Land, S.C.; Wilson, S.M. Epithelial Na+ channel activity in human airway epithelial cells: The role of serum and glucocorticoid-inducible kinase 1. Br. J. Pharmacol. 2012, 166, 1272–1289. [Google Scholar] [CrossRef] [PubMed]
  5. Baltaev, R.; Strutz-Seebohm, N.; Korniychuk, G.; Myssina, S.; Lang, F.; Seebohm, G. Regulation of cardiac shal-related potassium channel Kv 4.3 by serum- and glucocorticoid-inducible kinase isoforms in Xenopus oocytes. Pflugers Arch. 2005, 450, 26–33. [Google Scholar]
  6. Boehmer, C.; Laufer, J.; Jeyaraj, S.; Klaus, F.; Lindner, R.; Lang, F.; Palmada, M. Modulation of the voltage-gated potassium channel Kv1.5 by the SGK1 protein kinase involves inhibition of channel ubiquitination. Cell Physiol. Biochem. 2008, 22, 591–600. [Google Scholar]
  7. Wang, D.; Sun, H.; Lang, F.; Yun, C.C. Activation of NHE3 by dexamethasone requires phosphorylation of NHE3 at Ser663 by SGK1. Am. J. Physiol. Cell Physiol. 2005, 289, C802–C810. [Google Scholar] [CrossRef] [PubMed]
  8. Loffing, J.; Flores, S.Y.; Staub, O. SGK kinases and their role in epithelial transport. Annu. Rev. Physiol. 2006, 68, 461–490. [Google Scholar] [CrossRef] [PubMed]
  9. Henke, G.; Maier, G.; Wallisch, S.; Boehmer, C.; Lang, F. Regulation of the voltage gated K+ channel Kv1.3 by the ubiquitin ligase Nedd4–2 and the serum and glucocorticoid inducible kinase SGK1. J. Cell Physiol. 2004, 199, 194–199. [Google Scholar]
  10. Brunet, A.; Park, J.; Tran, H.; Hu, L.S.; Hemmings, B.A.; Greenberg, M.E. Protein kinase SGK mediates survival signals by phosphorylating the forkhead transcription factor FKHRL1 (FOXO3a). Mol. Cell. Biol. 2001, 21, 952–965. [Google Scholar] [CrossRef] [PubMed]
  11. Luft, F.C. SGK1 survival through various lives may save us all. J. Mol. Med. 2007, 85, 657–659. [Google Scholar] [CrossRef] [PubMed]
  12. Amato, R.; D’Antona, L.; Porciatti, G.; Agosti, V.; Menniti, M.; Rinaldo, C.; Costa, N.; Bellacchio, E.; Mattarocci, S.; Fuiano, G.; et al. Sgk1 activates MDM2-dependent p53 degradation and affects cell proliferation, survival, and differentiation. J. Mol. Med. 2009, 87, 1221–1239. [Google Scholar]
  13. You, H.; Jang, Y.; You-Ten, A.I.; Okada, H.; Liepa, J.; Wakeham, A.; Zaugg, K.; Mak, T.W. p53-dependent inhibition of FKHRL1 in response to DNA damage through protein kinase SGK1. Proc. Natl. Acad. Sci. USA 2004, 101, 14057–14062. [Google Scholar] [CrossRef] [PubMed]
  14. Endo, T.; Kusakabe, M.; Sunadome, K.; Yamamoto, T.; Nishida, E. The kinase SGK1 in the endoderm and mesoderm promotes ectodermal survival by down-regulating components of the death-inducing signaling complex. Sci. Signal. 2011, 4, ra2. [Google Scholar] [PubMed]
  15. Zhang, L.; Cui, R.; Cheng, X.; Du, J. Antiapoptotic effect of serum and glucocorticoid-inducible protein kinase is mediated by novel mechanism activating IκB kinase. Cancer Res. 2005, 65, 457–464. [Google Scholar] [PubMed]
  16. Wang, K.; Gu, S.; Nasir, O.; Foller, M.; Ackermann, T.F.; Klingel, K.; Kandolf, R.; Kuhl, D.; Stournaras, C.; Lang, F. SGK1-dependent intestinal tumor growth in APC-deficient mice. Cell Physiol. Biochem. 2010, 25, 271–278. [Google Scholar] [CrossRef] [PubMed]
  17. Firestone, G.L.; Giampaolo, J.R.; O’Keeffe, B.A. Stimulus-dependent regulation of serum and glucocorticoid inducible protein kinase (SGK) transcription, subcellular localization and enzymatic activity. Cell Physiol. Biochem. 2003, 13, 1–12. [Google Scholar] [CrossRef] [PubMed]
  18. Lang, F.; Artunc, F.; Vallon, V. The physiological impact of the serum and glucocorticoid-inducible kinase SGK1. Curr. Opin. Nephrol. Hypertens. 2009, 18, 439–448. [Google Scholar] [CrossRef] [PubMed]
  19. Lang, F.; Cohen, P. Regulation and physiological roles of serum- and glucocorticoid-induced protein kinase isoforms. Sci. STKE 2001, 2001, re17. [Google Scholar] [PubMed]
  20. Tessier, M.; Woodgett, J.R. Serum and glucocorticoid-regulated protein kinases: Variations on a theme. J. Cell Biochem. 2006, 98, 1391–1407. [Google Scholar] [CrossRef] [PubMed]
  21. Arteaga, M.F.; Wang, L.; Ravid, T.; Hochstrasser, M.; Canessa, C.M. An amphipathic helix targets serum and glucocorticoid-induced kinase 1 to the endoplasmic reticulum-associated ubiquitin-conjugation machinery. Proc. Natl. Acad. Sci. USA 2006, 103, 11178–11183. [Google Scholar] [CrossRef] [PubMed]
  22. Bogusz, A.M.; Brickley, D.R.; Pew, T.; Conzen, S.D. A novel N-terminal hydrophobic motif mediates constitutive degradation of serum- and glucocorticoid-induced kinase-1 by the ubiquitin-proteasome pathway. FEBS J. 2006, 273, 2913–2928. [Google Scholar] [CrossRef] [PubMed]
  23. Arteaga, M.F.; Coric, T.; Straub, C.; Canessa, C.M. A brain-specific SGK1 splice isoform regulates expression of ASIC1 in neurons. Proc. Natl. Acad. Sci. USA 2008, 105, 4459–4464. [Google Scholar] [CrossRef] [PubMed]
  24. Raikwar, N.S.; Snyder, P.M.; Thomas, C.P. An evolutionarily conserved N-terminal Sgk1 variant with enhanced stability and improved function. Am. J. Physiol. Renal Physiol. 2008, 295, F1440–F1448. [Google Scholar] [CrossRef] [PubMed]
  25. Arteaga, M.F.; de la Rosa, A.; Alvarez, J.A.; Canessa, C.M. Multiple translational isoforms give functional specificity to serum- and glucocorticoid-induced kinase 1. Mol. Biol. Cell 2007, 18, 2072–2080. [Google Scholar] [CrossRef] [PubMed]
  26. Wesch, D.; Miranda, P.; Afonso-Oramas, D.; Althaus, M.; Castro-Hernandez, J.; Dominguez, J.; Morty, R.E.; Clauss, W.; Gonzalez-Hernandez, T.; de la Rosa, A.; et al. The neuronal-specific SGK1.1 kinase regulates δ-epithelial Na+ channel independently of PY motifs and couples it to phospholipase C signaling. Am. J. Physiol Cell Physiol. 2010, 299, C779–C790. [Google Scholar]
  27. Gey, G.O.; Coffman, W.D.; Kubicek, M.T. Tissue culture studies of the proliferative capacity of cervical carcinoma and normal epithelium. Cancer Res. 1952, 12, 264. [Google Scholar]
  28. Doong, H.; Vrailas, A.; Kohn, E.C. What’s in the “BAG”?—A functional domain analysis of the BAG-family proteins. Cancer Lett. 2002, 188, 25–32. [Google Scholar]
  29. Kabbage, M.; Dickman, M.B. The BAG proteins: A ubiquitous family of chaperone regulators. Cell Mol. Life Sci. 2008, 65, 1390–1402. [Google Scholar] [CrossRef] [PubMed]
  30. Ichioka, F.; Kobayashi, R.; Katoh, K.; Shibata, H.; Maki, M. Brox, a novel farnesylated Bro1 domain-containing protein that associates with charged multivesicular body protein 4 (CHMP4). FEBS J. 2008, 275, 682–692. [Google Scholar] [CrossRef] [PubMed]
  31. Mu, R.; Dussupt, V.; Jiang, J.; Sette, P.; Rudd, V.; Chuenchor, W.; Bello, N.F.; Bouamr, F.; Xiao, T.S. Two distinct binding modes define the interaction of Brox with the C-terminal tails of CHMP5 and CHMP4B. Structure 2012, 20, 887–898. [Google Scholar] [CrossRef] [PubMed]
  32. Ceulemans, H.; Bollen, M. Functional diversity of protein phosphatase-1, a cellular economizer and reset button. Physiol. Rev. 2004, 84, 1–39. [Google Scholar] [CrossRef] [PubMed]
  33. Dehner, M.; Hadjihannas, M.; Weiske, J.; Huber, O.; Behrens, J. Wnt signaling inhibits Forkhead box O3a-induced transcription and apoptosis through up-regulation of serum- and glucocorticoid-inducible kinase 1. J. Biol. Chem. 2008, 283, 19201–19210. [Google Scholar] [CrossRef] [PubMed]
  34. Heikamp, E.B.; Patel, C.H.; Collins, S.; Waickman, A.; Oh, M.H.; Sun, I.H.; Illei, P.; Sharma, A.; Naray-Fejes-Toth, A.; Fejes-Toth, G.; et al. The AGC kinase SGK1 regulates TH1 and TH2 differentiation downstream of the mTORC2 complex. Nat. Immunol. 2014, 15, 457–464. [Google Scholar]
  35. Burgon, J.; Robertson, A.L.; Sadiku, P.; Wang, X.; Hooper-Greenhill, E.; Prince, L.R.; Walker, P.; Hoggett, E.E.; Ward, J.R.; Farrow, S.N.; et al. Serum and glucocorticoid-regulated kinase 1 regulates neutrophil clearance during inflammation resolution. J. Immunol. 2014, 192, 1796–1805. [Google Scholar]
  36. Eaton, D.C.; Malik, B.; Bao, H.F.; Yu, L.; Jain, L. Regulation of epithelial sodium channel trafficking by ubiquitination. Proc. Am. Thorac. Soc. 2010, 7, 54–64. [Google Scholar] [CrossRef] [PubMed]
  37. Diatchenko, L.; Lau, Y.F.; Campbell, A.P.; Chenchik, A.; Moqadam, F.; Huang, B.; Lukyanov, S.; Lukyanov, K.; Gurskaya, N.; Sverdlov, E.D.; et al. Suppression subtractive hybridization: A method for generating differentially regulated or tissue-specific cDNA probes and libraries. Proc. Natl. Acad. Sci. USA 1996, 93, 6025–6030. [Google Scholar]
  38. Altschul, S.F.; Madden, T.L.; Schaffer, A.A.; Zhang, J.; Zhang, Z.; Miller, W.; Lipman, D.J. Gapped BLAST and PSI-BLAST: A new generation of protein database search programs. Nucleic Acids Res. 1997, 25, 3389–3402. [Google Scholar] [CrossRef] [PubMed]
  39. Schmittgen, T.D.; Livak, K.J. Analyzing real-time PCR data by the comparative C(T) method. Nat. Protoc. 2008, 3, 1101–1108. [Google Scholar] [CrossRef] [PubMed]
  40. Woodward, A.M.; Crouch, D.H. Cellular distributions of the ERM proteins in MDCK epithelial cells: Regulation by growth and cytoskeletal integrity. Cell Biol. Int. 2001, 25, 205–213. [Google Scholar] [CrossRef] [PubMed]
  41. Elbaggari, A.; McDonald, K.; Alburo, A. Imaging of chemiluminescent western blots: Comparison of digital imaging and X-ray film. Available online: http://www.bio-rad.com/webroot/web/pdf/lsr/literature/Bulletin_5809.pdf (accessed on 19 March 2015).

