
Application of Green Tea Catechin for Inducing the Osteogenic Differentiation of Human Dedifferentiated Fat Cells in Vitro


Abstract
:
1. Introduction

| Media | Abbreviation | Composition | Dex |
|---|---|---|---|
| Control medium | Control | Basal Dulbecco’s modified eagle medium with 10% FBS and 1% antibiotics | − |
| Osteogenic medium 1 | OM | Control medium with 50 μM AA2P and 10 mM bGP | − |
| Osteogenic medium 1 with EGCG | OM + EGCG(N) | OM with 1.25–10 μM EGCG | − |
| Osteogenic medium 2 | OM(Dex) | Control medium with 50 μM AA2P, 10 mM bGP and 100 nM Dex | + |
| Osteogenic medium 2 with EGCG | OM(Dex) + EGCG(N) | OM(Dex) with 1.25–10 μM EGCG | + |
2. Results
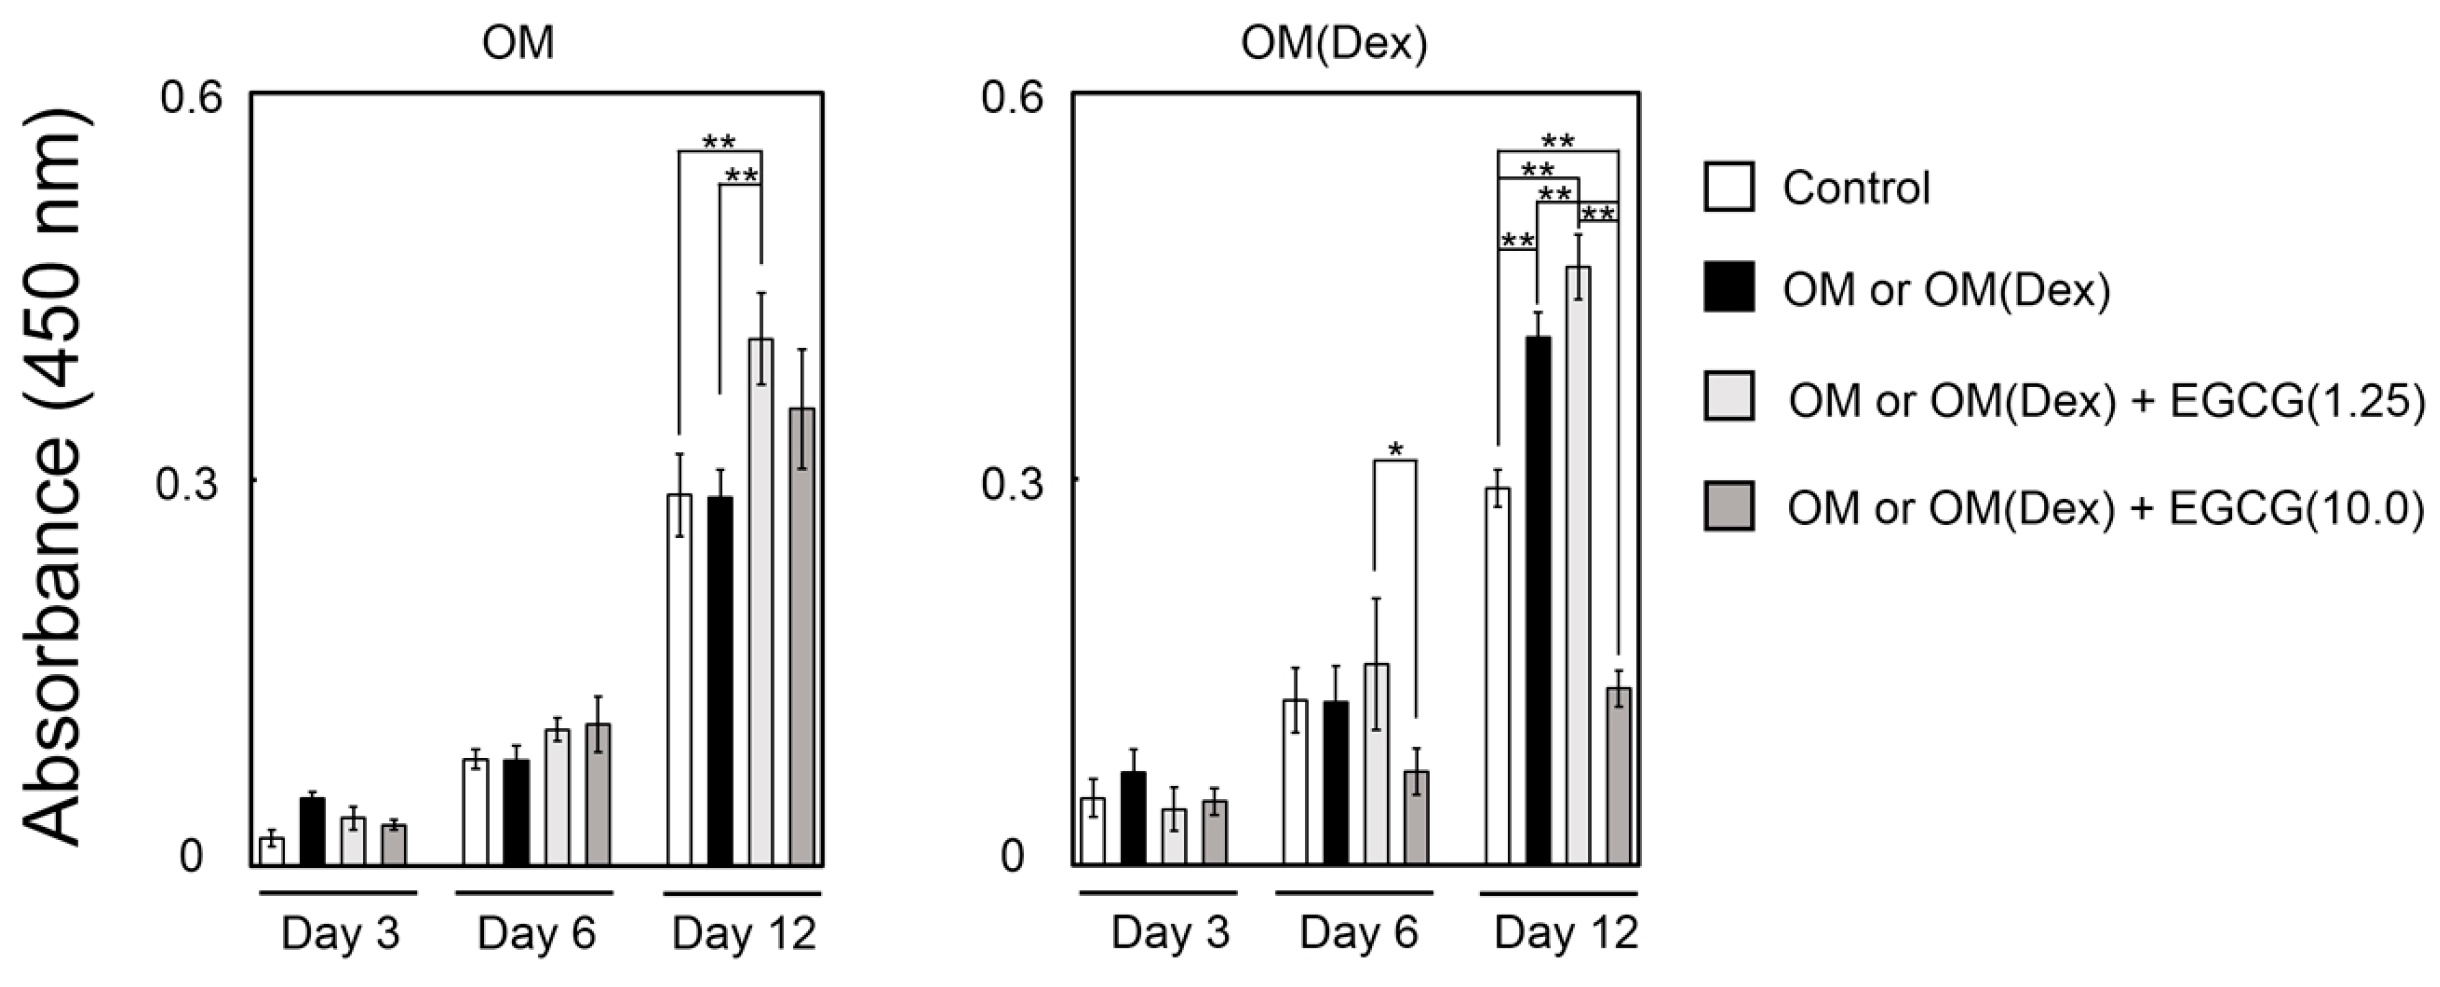
2.1. Effect of Epigallocatechin-3-Gallate (EGCG) on the Proliferation of Dedifferentiated Fat (DFAT) Cells

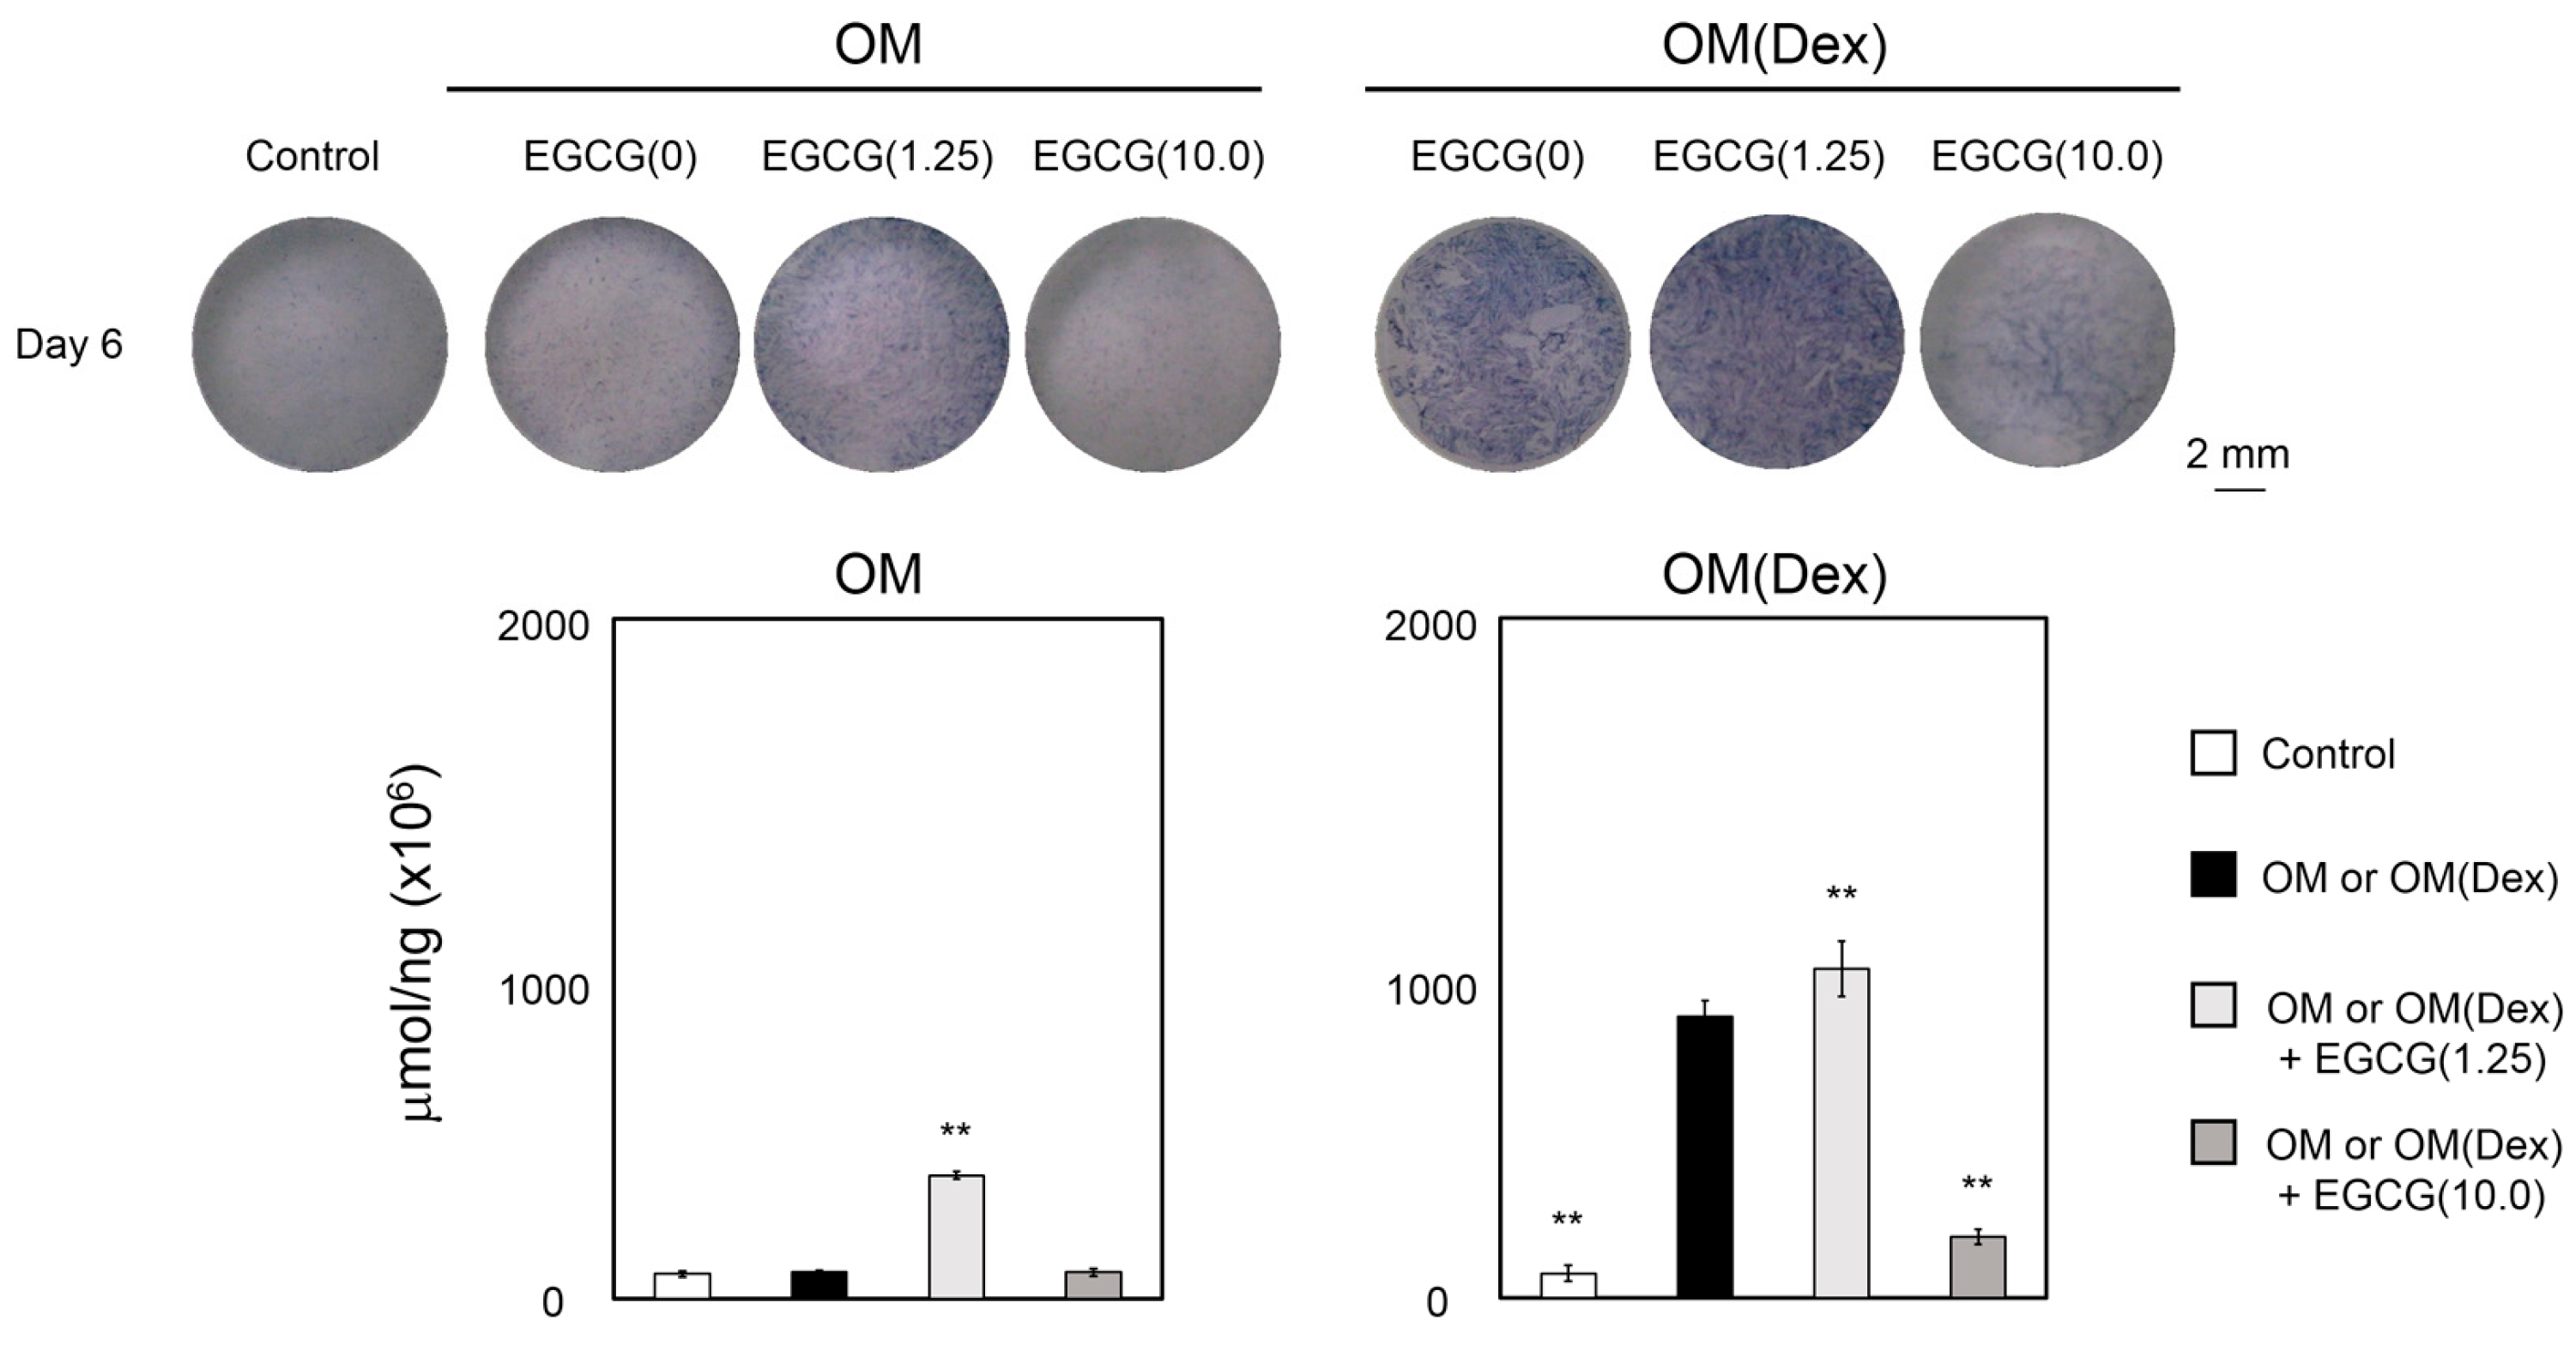
2.2. mRNA Expression Levels of Osteogenic Markers and Alkaline Phosphatase Assay
| mRNA | COL1A1 | RUNX2 | OSX | DLX5 |
|---|---|---|---|---|
| Media Methods Units | qPCR Fold (vs. Control) | Digital PCR Copy/μL | Digital PCR Copy/μL | Digital PCR Copy/μL |
| Control | 1.08 ± 0.46 c,d | 32.99 ± 4.27 c | 15.42 ± 1.38 d | 22.78 ± 1.85 b,c |
| OM | 3.32 ± 1.20 | 223.59 ± 15.17 | 13.33 ± 0.81 | 32.21 ± 2.55 |
| OM + EGCG(1.25) | 31.10 ± 7.93 c | 276.72 ± 3.44 c | 71.11 ± 20.84 c | 26.43 ± 1.05 a |
| OM + EGCG(10.0) | 8.16 ± 5.65 | 19.33 ± 0.84 | 21.00 ± 3.39 | 27.05 ± 1.27 a |
| OM(Dex) | 0.72 ± 0.45 | 36.11 ± 2.29 | 9.81 ± 0.01 | 26.51 ± 0.17 |
| OM(Dex) + EGCG(1.25) | 7.07 ± 1.29 d | 60.93 ± 4.28 d | 12.32 ± 0.07 d | 25.58 ± 0.66 |
| OM(Dex) + EGCG(10.0) | 1.97 ± 0.72 | 17.38 ± 0.57 d | 18.66 ± 0.77 d | 26.16 ± 1.09 |
| mRNA | COL1A1 | RUNX2 | OSX | DLX5 | OCN |
|---|---|---|---|---|---|
| Media Units | Fold (vs. Control) | Fold (vs. Control) | Fold (vs. Control) | Fold (vs. Control) | Fold (vs. Control) |
| Control | 1.02 ± 0.23 c,d | 1.17 ± 0.71 b,c | 1.01 ± 0.12 c,d | 1.02 ± 0.21 c,d | 1.16 ± 0.59 d |
| OM | 0.15 ± 0.02 | 5.00 ± 0.79 | 20.68 ± 6.58 | 2.54 ± 0.14 | 31.74 ± 12.28 |
| OM + EGCG(1.25) | 0.27 ± 0.08 | 4.56 ± 0.72 | 36.01 ± 3.10 c | 3.41 ± 0.15 c | 140.46 ± 65.44 c |
| OM + EGCG(10.0) | 0.20 ± 0.03 | 3.71 ± 1.35 | 52.57 ± 9.29 c | 2.38 ± 0.13 | 71.83 ± 5.45 |
| OM(Dex) | 0.52 ± 0.08 | 2.79 ± 0.58 | 16.94 ± 0.71 | 1.93 ± 0.20 | 0.43 ± 0.03 |
| OM(Dex) + EGCG(1.25) | 0.40 ± 0.04 | 2.38 ± 0.40 | 29.62 ± 4.60 d | 2.39 ± 0.44 | 1.03 ± 0.10 d |
| OM(Dex) + EGCG(10.0) | 0.18 ± 0.02 d | 3.04 ± 0.89 | 25.24 ± 0.18 d | 2.17 ± 0.04 | 0.88 ± 0.15 d |

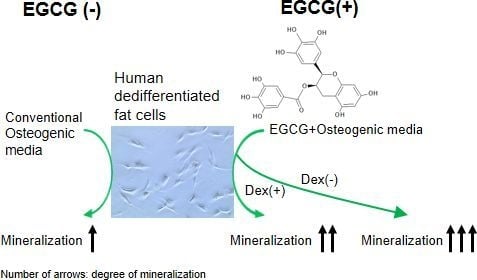
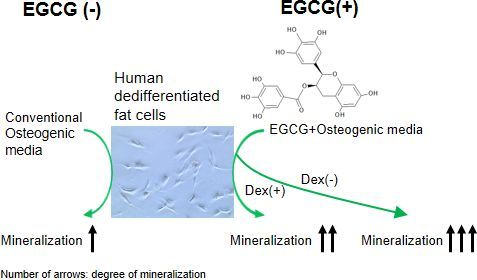
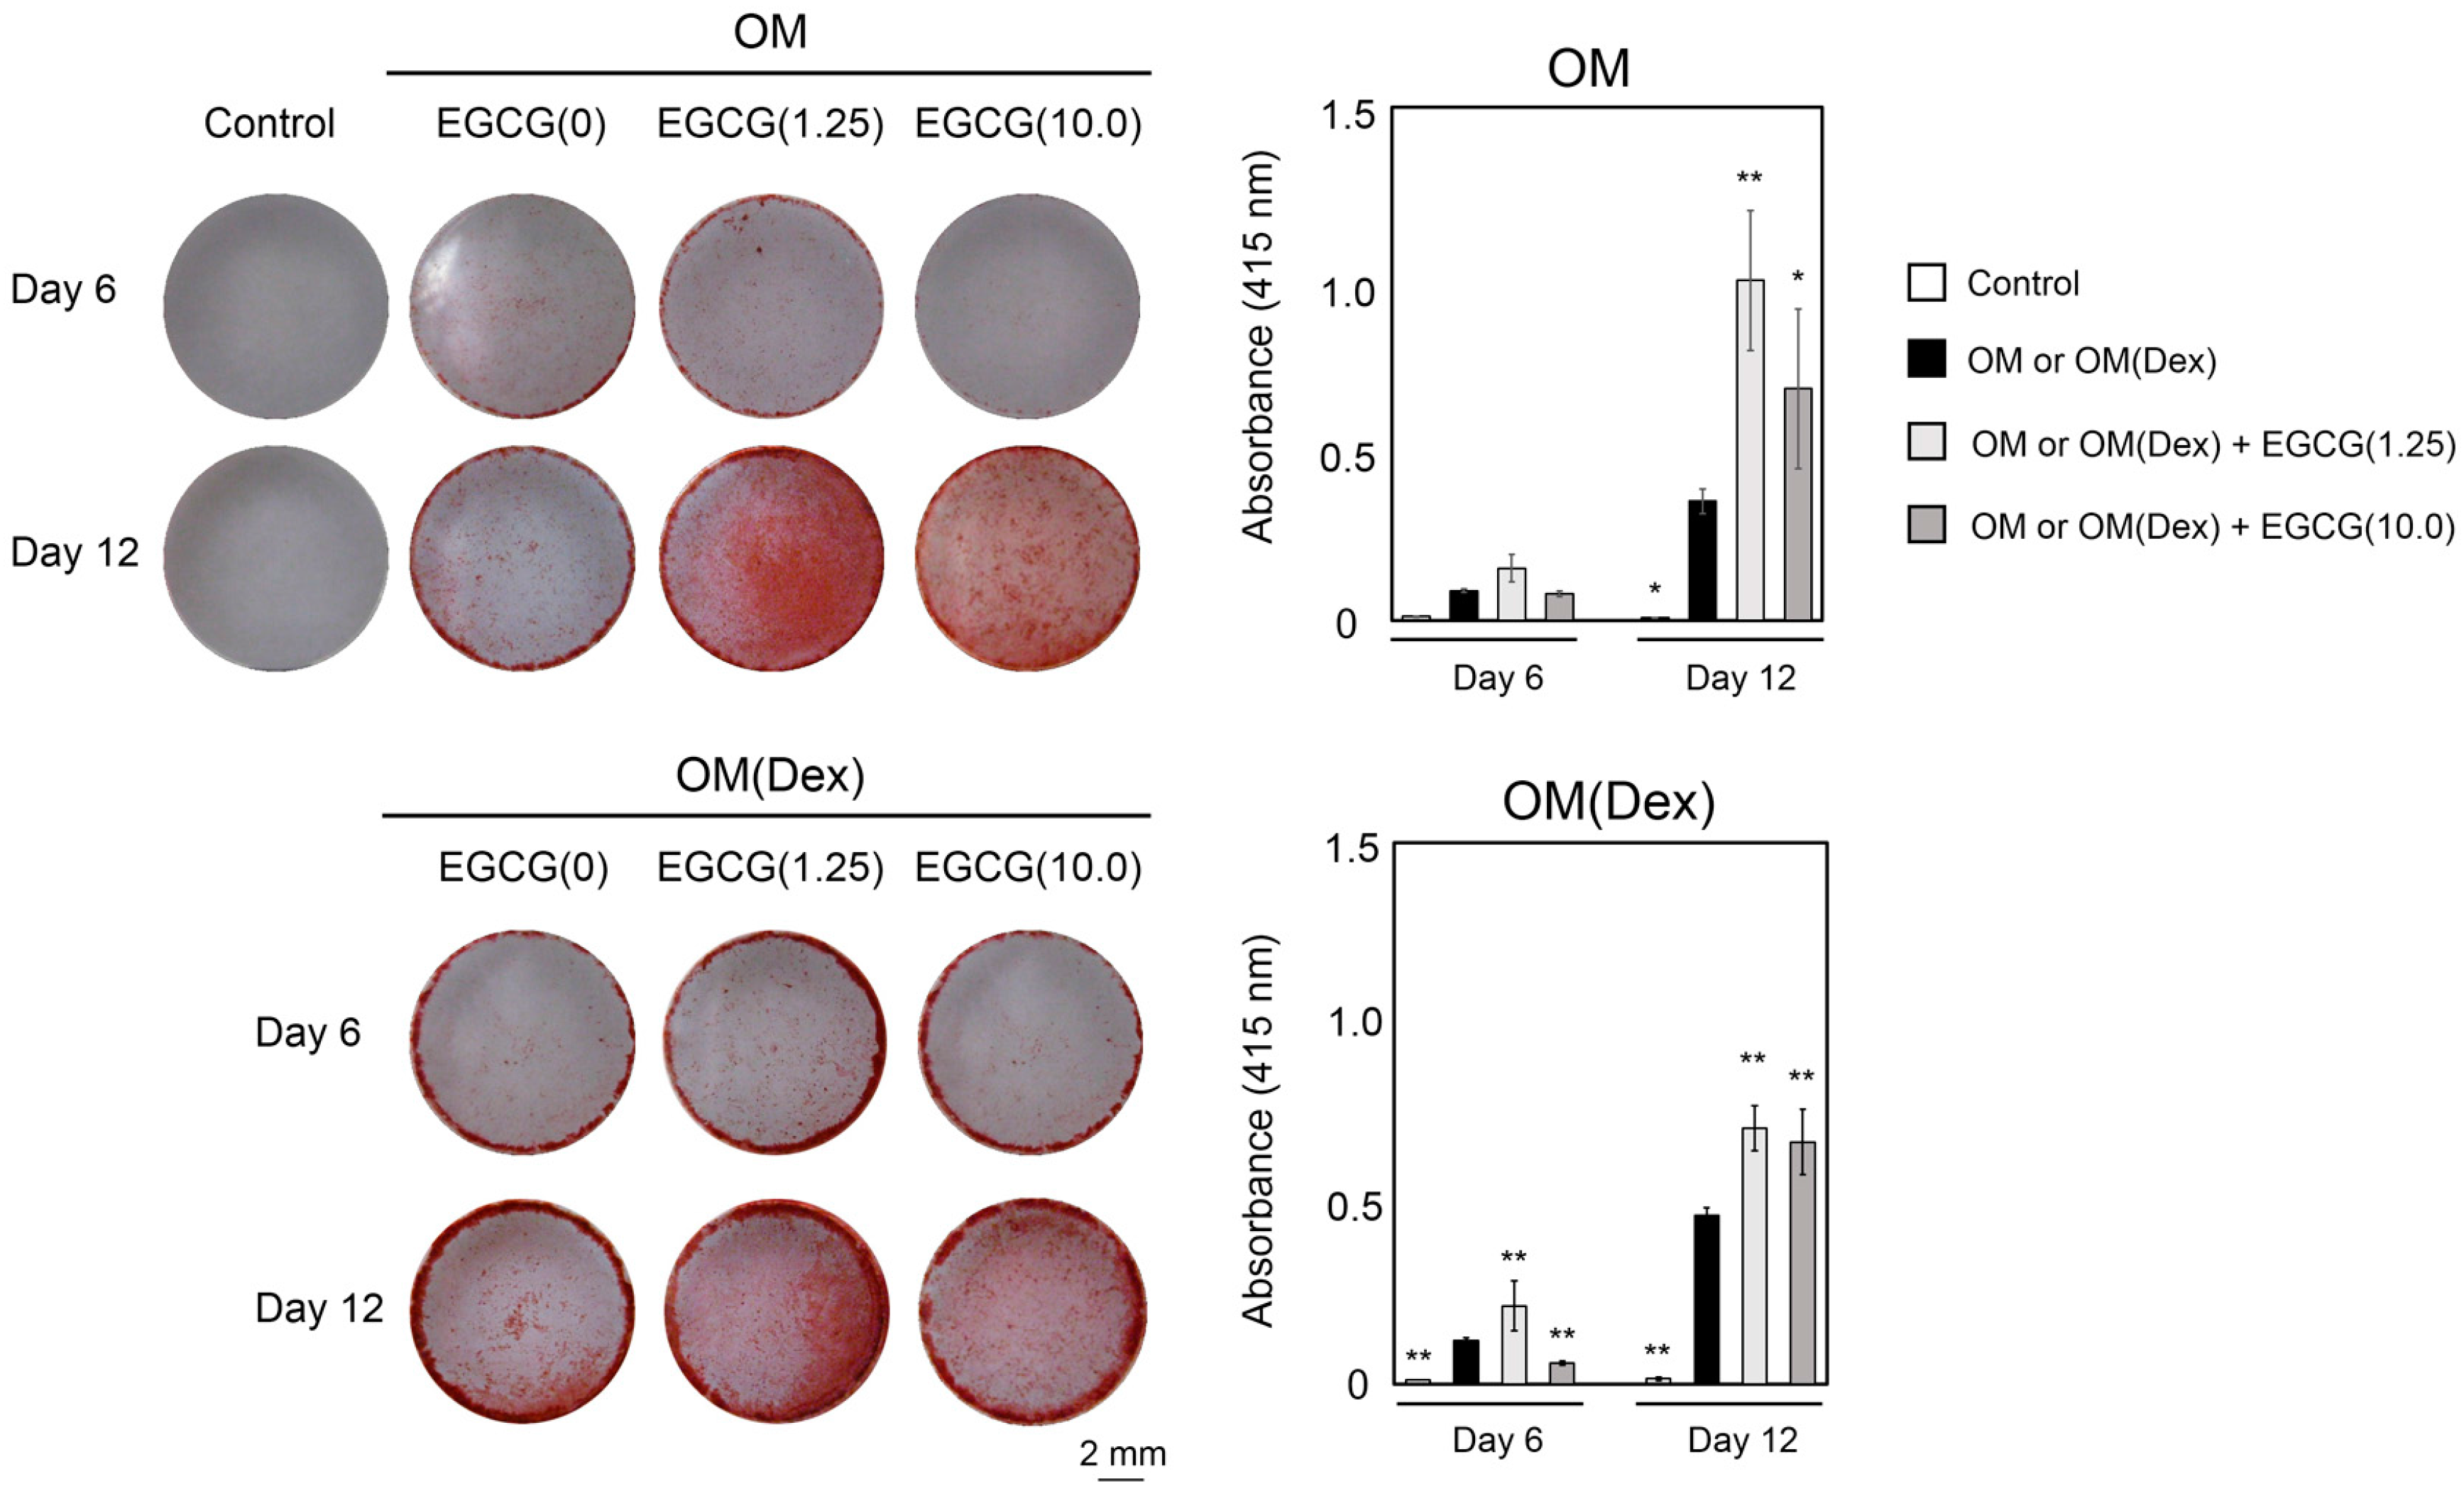
2.3. Mineralization

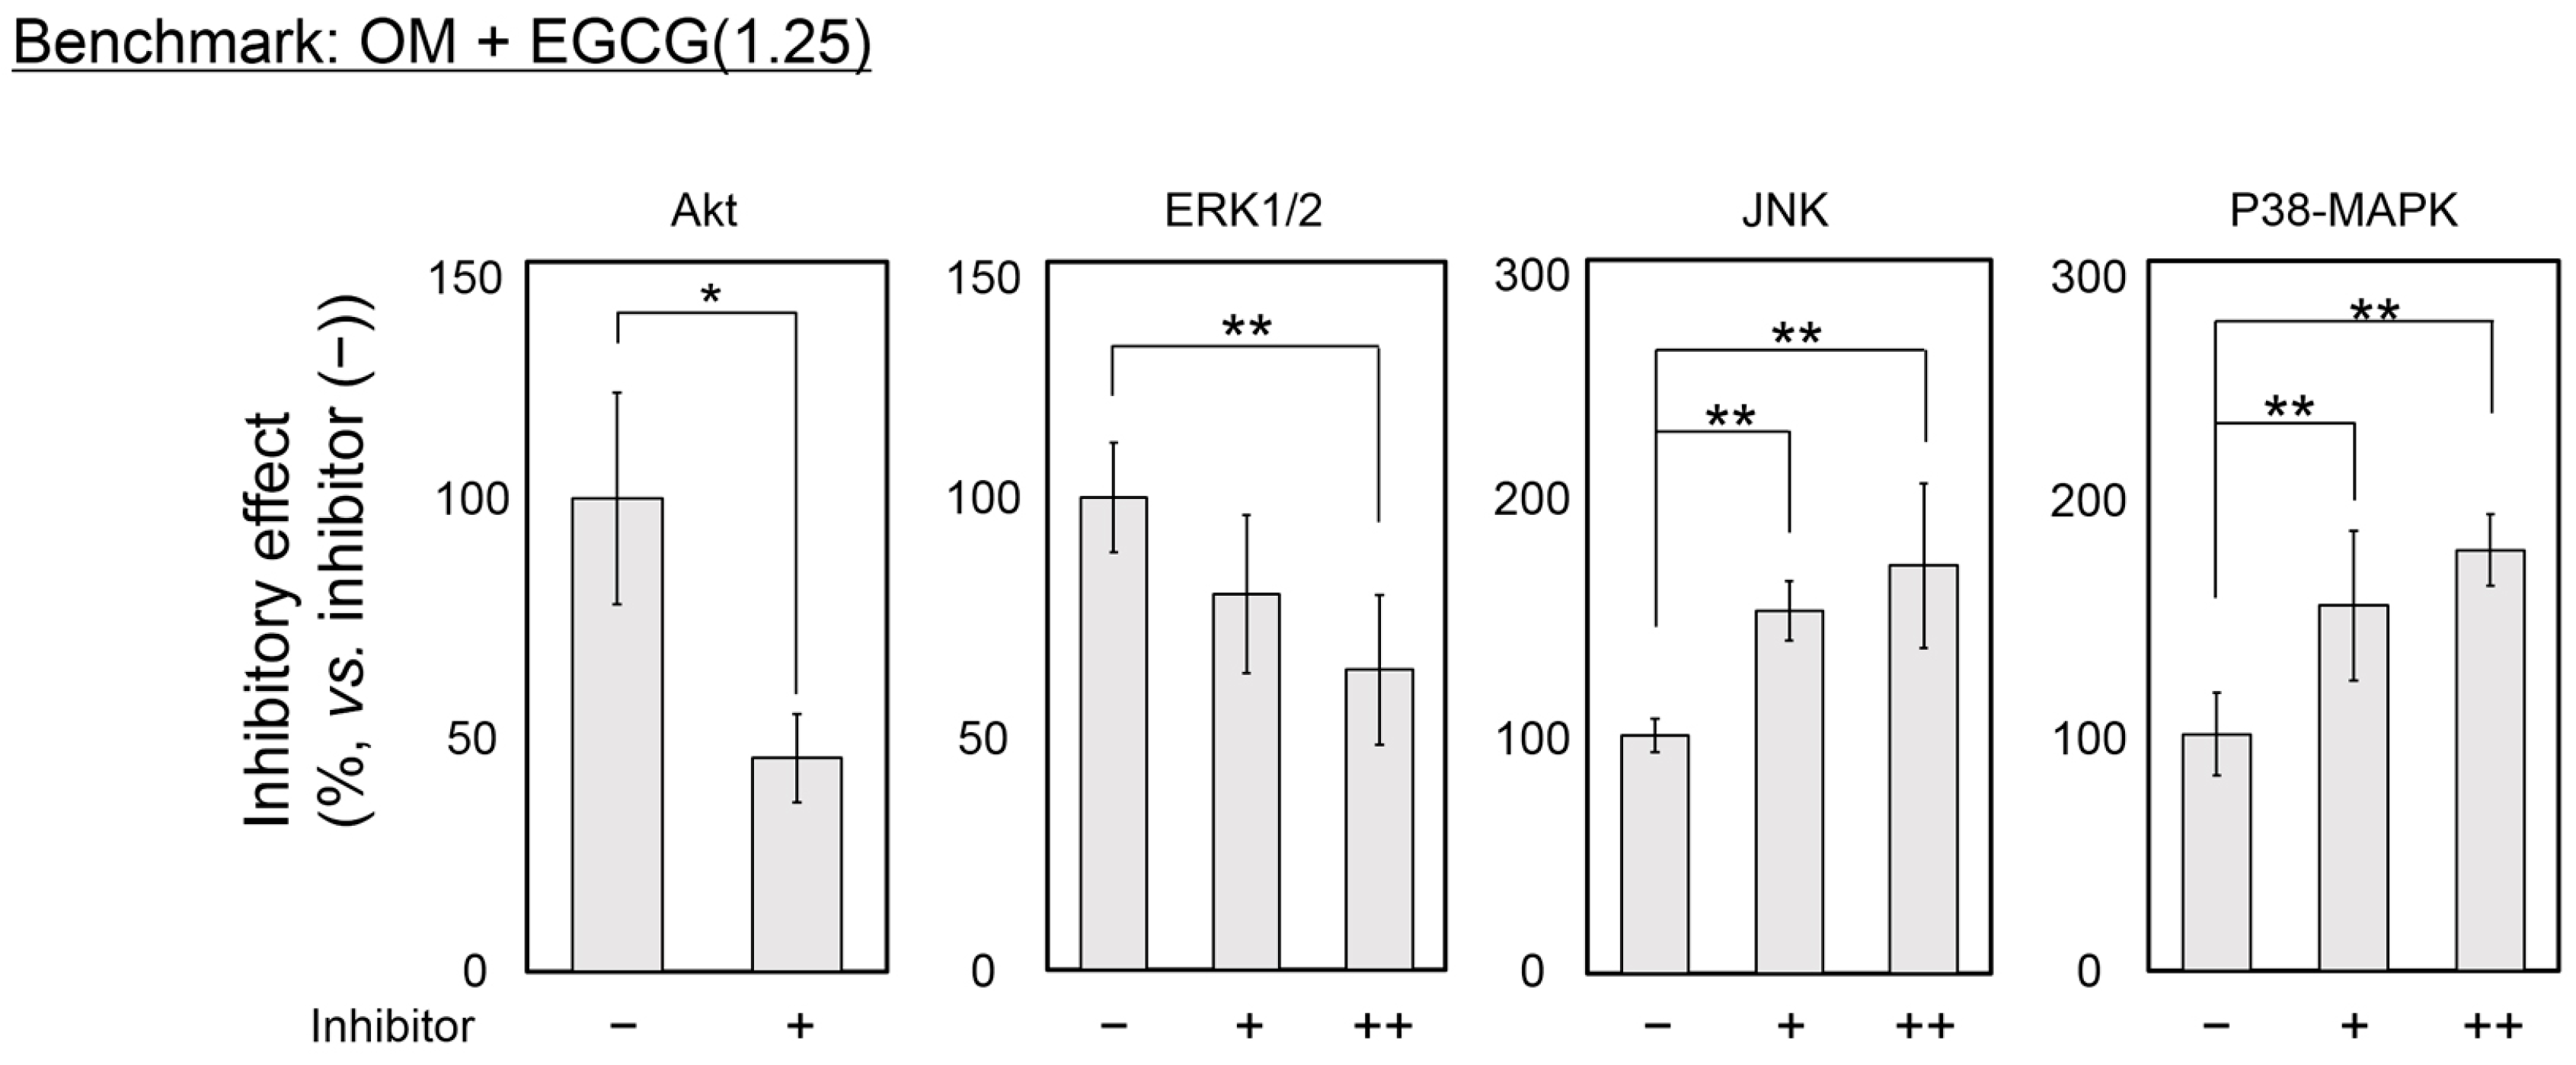
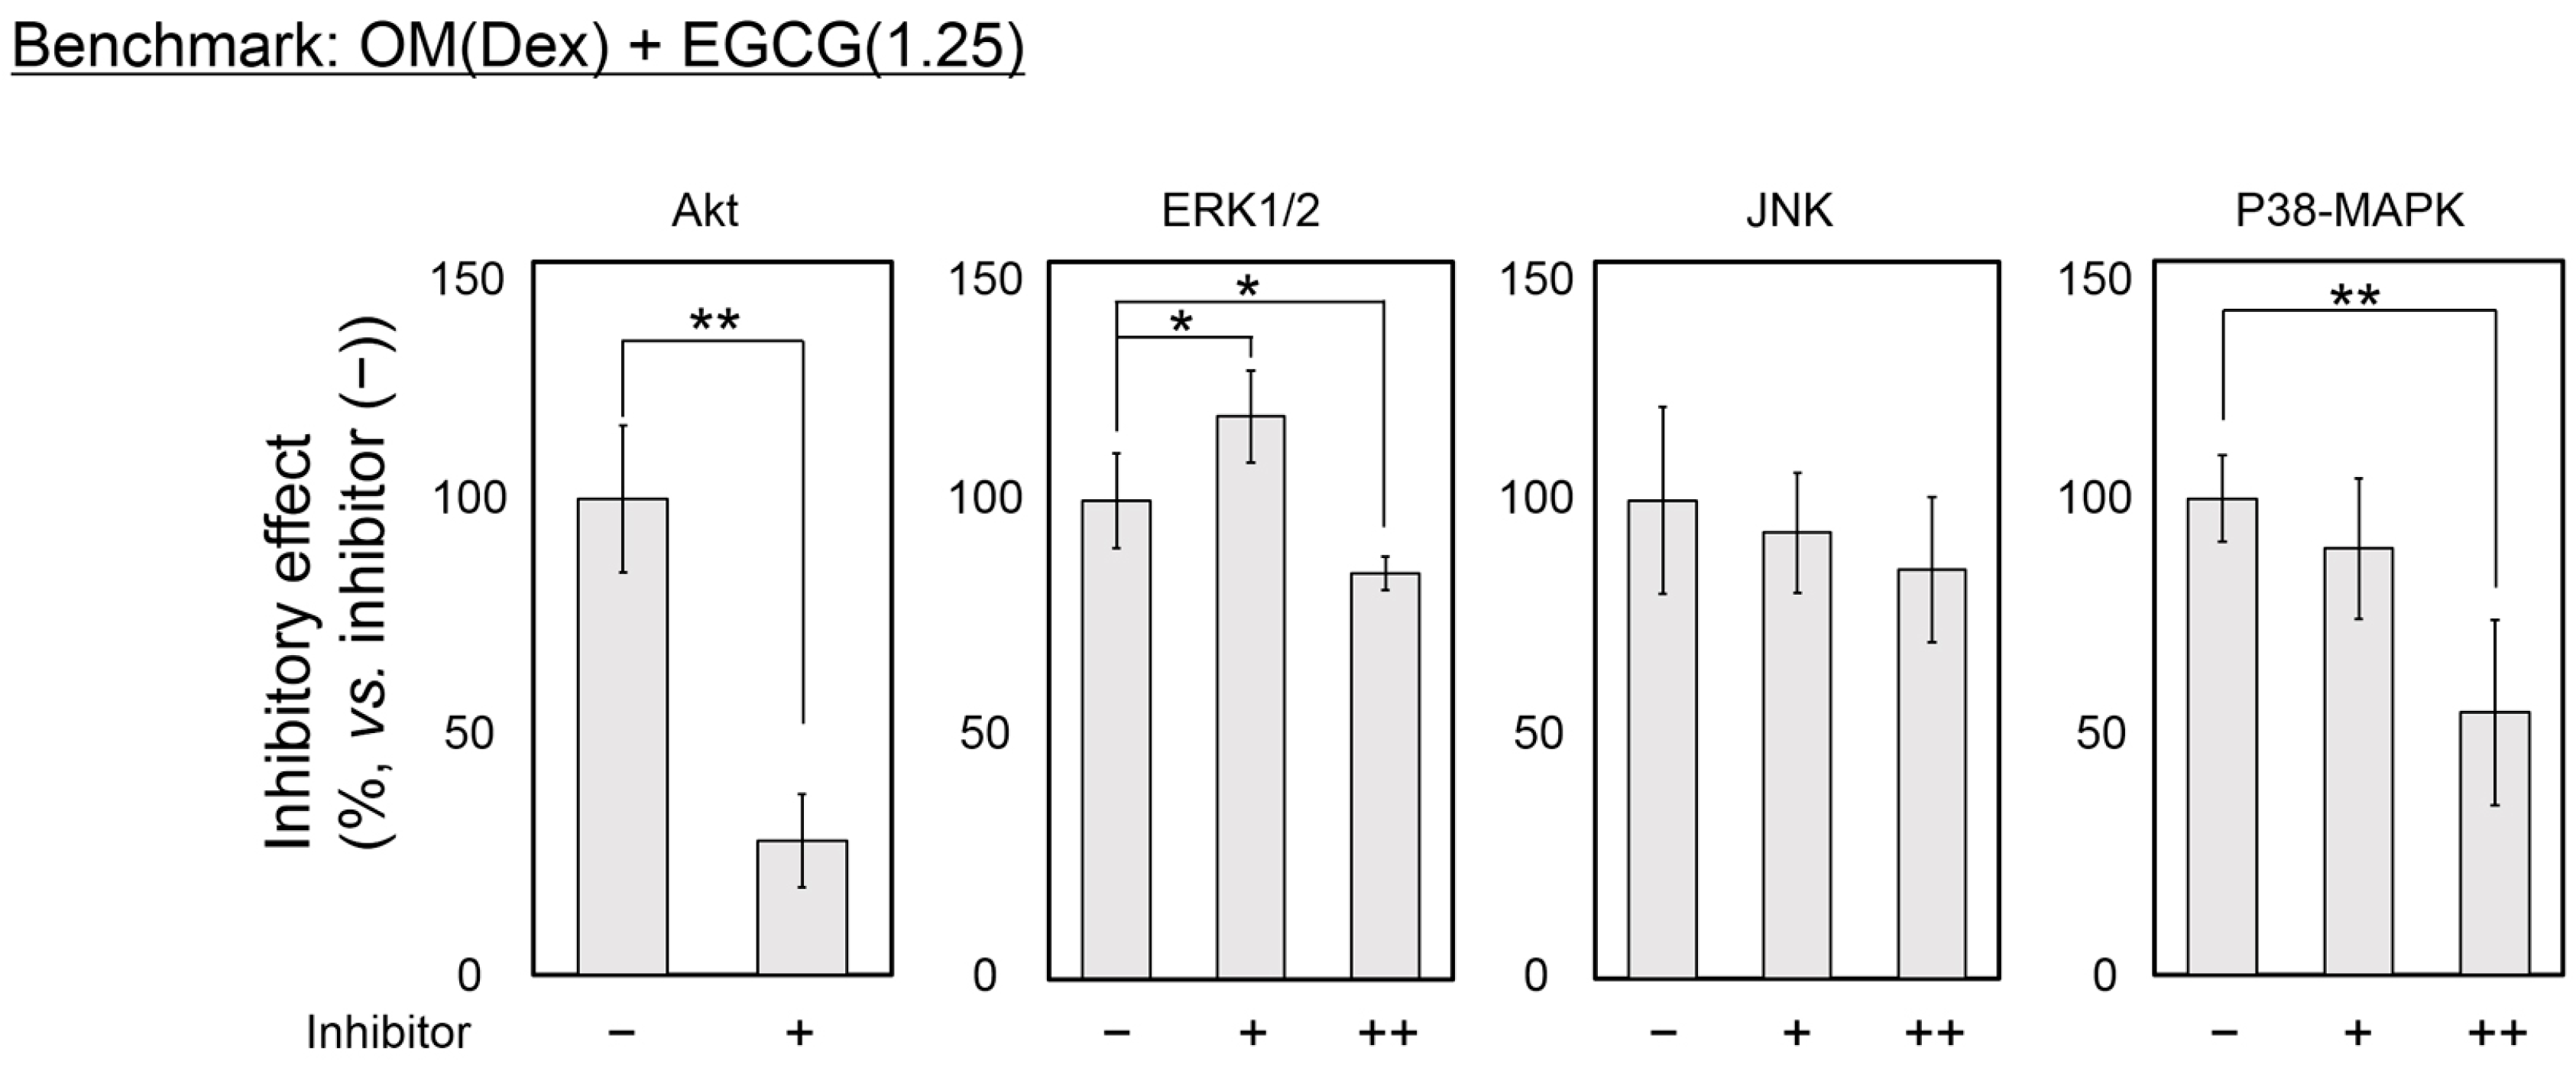
2.4. Inhibitory Assay to Evaluate EGCG-Induced Osteoblast Differentiation of DFAT Cells


3. Discussion
4. Experimental Section
4.1. Chemicals
4.2. Preparation and Maintenance of Primary Human DFAT Cells
4.3. Cell Seeding Conditions for the Proliferation Assay and Osteogenic Differentiation
4.4. Cell Proliferation Assay
4.5. RNA Isolation, Quantitative Real Time-PCR (qPCR), and Digital PCR
4.6. ALP Staining, and Alizarin Red Staining
4.7. Inhibitory Assay for Four Signaling Pathways
4.8. Statistical Analysis
5. Conclusions
Supplementary Materials
Acknowledgments
Author Contributions
Conflicts of Interest
References
- Egusa, H.; Sonoyama, W.; Nishimura, M.; Atsuta, I.; Akiyama, K. Stem cells in dentistry—Part I: Stem cell sources. J. Prosthodont. Res. 2012, 56, 151–165. [Google Scholar] [CrossRef] [PubMed]
- Lee, E.; Hui, J. The potential of stem cells in orthopaedic surgery. J. Bone Jt. Surg. 2006, 88B, 841–851. [Google Scholar] [CrossRef] [PubMed]
- Matsumoto, T.; Kano, K.; Kondo, D.; Fukuda, N.; Iribe, Y.; Tanaka, N.; Matsubara, Y.; Sakuma, T.; Satomi, A.; Otaki, M.; et al. Mature adipocyte-derived dedifferentiated fat cells exhibit multilineage potential. J. Cell. Physiol. 2008, 215, 210–222. [Google Scholar] [CrossRef] [PubMed]
- Sugihara, H.; Yonemitsu, N.; Miyabara, S.; Yun, K. Primary cultures of unilocular fat cells: Characteristics of growth in vitro and changes in differentiation properties. Differentiation 1986, 31, 42–49. [Google Scholar] [CrossRef] [PubMed]
- Huber, B.; Kluger, P.J. Decelerating mature adipocyte dedifferentiation by media composition. Tissue Eng. Part C Methods 2015. [Google Scholar] [CrossRef] [PubMed]
- Justesen, J.; Pedersen, S.B.; Stenderup, K.; Kassem, M. Subcutaneous adipocytes can differentiate into bone-forming cells in vitro and in vivo. Tissue Eng. 2004, 10, 381–391. [Google Scholar] [CrossRef] [PubMed]
- Kishimoto, N.; Momota, Y.; Hashimoto, Y.; Ando, K.; Omasa, T.; Kotani, J. Dedifferentiated fat cells differentiate into osteoblasts in titanium fiber mesh. Cytotechnology 2013, 65, 15–22. [Google Scholar] [CrossRef] [PubMed]
- Kishimoto, N.; Momota, Y.; Hashimoto, Y.; Tatsumi, S.; Ando, K.; Omasa, T.; Kotani, J. The osteoblastic differentiation ability of human dedifferentiated fat cells is higher than that of adipose stem cells from the buccal fat pad. Clin. Oral Investig. 2014, 18, 1893–1901. [Google Scholar] [CrossRef] [PubMed]
- Kishimoto, N.; Momota, Y.; Mori, M.; Hashimoto, Y.; Imai, K.; Omasa, T.; Kotani, J. Bone regenration using dedifferentiated fat cells with pure matrix. J. Oral Tissue Eng. 2008, 6, 127–134. [Google Scholar]
- Kishimoto, N.; Momota, Y.; Hashimoto, Y.; Omasa, T.; Kotani, J. Self-assembling peptide RADA16 as a scaffold in bone tissue engineering using dedifferentiated fat cells. J. Oral Tissue Eng. 2011, 8, 151–161. [Google Scholar]
- Nakamura, T.; Shinohara, Y.; Momozaki, S.; Yoshimoto, T.; Noguchi, K. Co-stimulation with bone morphogenetic protein-9 and FK506 induces remarkable osteoblastic differentiation in rat dedifferentiated fat cells. Biochem. Biophys. Res. Commun. 2013, 440, 289–294. [Google Scholar] [CrossRef] [PubMed]
- Shirakata, Y.; Nakamura, T.; Shinohara, Y.; Taniyama, K.; Sakoda, K.; Yoshimoto, T.; Noguchi, K. An exploratory study on the efficacy of rat dedifferentiated fat cells (rDFATs) with a poly lactic-co-glycolic acid/hydroxylapatite (PLGA/HA) composite for bone formation in a rat calvarial defect model. J. Mater. Sci. Mater. Med. 2014, 25, 899–908. [Google Scholar] [CrossRef] [PubMed]
- Oki, Y.; Watanabe, S.; Endo, T.; Kano, K. Mature adipocyte-derived dedifferentiated fat cells can trans-differentiate into osteoblasts in vitro and in vivo only by all-trans retinoic acid. Cell Struct. Funct. 2008, 33, 211–222. [Google Scholar] [CrossRef] [PubMed]
- Sakuma, T.; Matsumoto, T.; Kano, K.; Fukuda, N.; Obinata, D.; Yamaguchi, K.; Yoshida, T.; Takahashi, S.; Mugishima, H. Mature, adipocyte derived, dedifferentiated fat cells can differentiate into smooth muscle-like cells and contribute to bladder tissue regeneration. J. Urol. 2009, 182, 355–365. [Google Scholar] [CrossRef] [PubMed]
- Peng, X.; Song, T.; Hu, X.; Zhou, Y.; Wei, H.; Peng, J.; Jiang, S. Phenotypic and functional properties of porcine dedifferentiated fat cells during the long-term culture in vitro. Biomed. Res. Int. 2015, 2015, 673651. [Google Scholar] [CrossRef] [PubMed]
- Okita, N.; Honda, Y.; Kishimoto, N.; Liao, W.; Azumi, E.; Hashimoto, Y.; Matsumoto, N. Supplementation of strontium to a chondrogenic medium promotes chondrogenic differentiation of human dedifferentiated fat cells. Tissue Eng. Part A 2015, 21, 1695–1704. [Google Scholar] [CrossRef] [PubMed]
- Yagi, K.; Kondo, D.; Okazaki, Y.; Kano, K. A novel preadipocyte cell line established from mouse adult mature adipocytes. Biochem. Biophys. Res. Commun. 2004, 321, 967–974. [Google Scholar] [CrossRef] [PubMed]
- Kazama, T.; Fujie, M.; Endo, T.; Kano, K. Mature adipocyte-derived dedifferentiated fat cells can transdifferentiate into skeletal myocytes in vitro. Biochem. Biophys. Res. Commun. 2008, 377, 780–785. [Google Scholar] [CrossRef] [PubMed]
- Jumabay, M.; Matsumoto, T.; Yokoyama, S.; Kano, K.; Kusumi, Y.; Masuko, T.; Mitsumata, M.; Saito, S.; Hirayama, A.; Mugishima, H.; et al. Dedifferentiated fat cells convert to cardiomyocyte phenotype and repair infarcted cardiac tissue in rats. J. Mol. Cell. Cardiol. 2009, 47, 565–575. [Google Scholar] [CrossRef] [PubMed]
- Obinata, D.; Matsumoto, T.; Ikado, Y.; Sakuma, T.; Kano, K.; Fukuda, N.; Yamaguchi, K.; Mugishima, H.; Takahashi, S. Transplantation of mature adipocyte-derived dedifferentiated fat (DFAT) cells improves urethral sphincter contractility in a rat model. Int. J. Urol. 2011, 18, 827–834. [Google Scholar] [CrossRef] [PubMed]
- Jumabay, M.; Abdmaulen, R.; Urs, S.; Heydarkhan-Hagvall, S.; Chazenbalk, G.D.; Jordan, M.C.; Roos, K.P.; Yao, Y.; Bostrom, K.I. Endothelial differentiation in multipotent cells derived from mouse and human white mature adipocytes. J. Mol. Cell. Cardiol. 2012, 53, 790–800. [Google Scholar] [CrossRef] [PubMed]
- Shen, J.F.; Sugawara, A.; Yamashita, J.; Ogura, H.; Sato, S. Dedifferentiated fat cells: An alternative source of adult multipotent cells from the adipose tissues. Int. J. Oral Sci. 2011, 3, 117–124. [Google Scholar] [CrossRef] [PubMed]
- Watson, J.E.; Patel, N.A.; Carter, G.; Moor, A.; Patel, R.; Ghansah, T.; Mathur, A.; Murr, M.M.; Bickford, P.; Gould, L.J.; et al. Comparison of markers and functional attributes of human adipose-derived stem cells and dedifferentiated adipocyte cells from subcutaneous fat of an obese diabetic donor. Adv. Wound Care 2014, 3, 219–228. [Google Scholar] [CrossRef] [PubMed]
- Sakamoto, F.; Hashimoto, Y.; Kishimoto, N.; Honda, Y.; Matsumoto, N. The utility of human dedifferentiated fat cells in bone tissue engineering in vitro. Cytotechnology 2013, 67, 75–84. [Google Scholar] [CrossRef] [PubMed]
- Mereles, D.; Hunstein, W. Epigallocatechin-3-gallate (EGCG) for clinical trials: More pitfalls than promises? Int. J. Mol. Sci. 2011, 12, 5592–5603. [Google Scholar] [CrossRef] [PubMed]
- Chung, J.H.; Han, J.H.; Hwang, E.J.; Seo, J.Y.; Cho, K.H.; Kim, K.H.; Youn, J.I.; Eun, H.C. Dual mechanisms of green tea extract (EGCG)-induced cell survival in human epidermal keratinocytes. FASEB J. 2003, 17, 1913–1915. [Google Scholar] [PubMed]
- Park, G.; Yoon, B.S.; Moon, J.H.; Kim, B.; Jun, E.K.; Oh, S.; Kim, H.; Song, H.J.; Noh, J.Y.; Oh, C.; et al. Green tea polyphenol epigallocatechin-3-gallate suppresses collagen production and proliferation in keloid fibroblasts via inhibition of the STAT3-signaling pathway. J. Investig. Dermatol. 2008, 128, 2429–2441. [Google Scholar] [CrossRef] [PubMed]
- Takai, S.; Matsushima-Nishiwaki, R.; Adachi, S.; Natsume, H.; Minamitani, C.; Mizutani, J.; Otsuka, T.; Tokuda, H.; Kozawa, O. (−)-Epigallocatechin gallate reduces platelet-derived growth factor-BB-stimulated interleukin-6 synthesis in osteoblasts: Suppression of SAPK/JNK. Med. Inflamm. 2008, 2008, 291808. [Google Scholar] [CrossRef] [PubMed]
- Wang, Y.; Ren, X.; Deng, C.; Yang, L.; Yan, E.; Guo, T.; Li, Y.; Xu, M.X. Mechanism of the inhibition of the STAT3 signaling pathway by EGCG. Oncol. Rep. 2013, 30, 2691–2696. [Google Scholar] [PubMed]
- Masuda, M.; Suzui, M.; Lim, J.T.; Deguchi, A.; Soh, J.W.; Weinstein, I.B. Epigallocatechin-3-gallate decreases VEGF production in head and neck and breast carcinoma cells by inhibiting EGFR-related pathways of signal transduction. J. Exp. Ther. Oncol. 2002, 2, 350–359. [Google Scholar] [CrossRef] [PubMed]
- Kim, H.; Sakamoto, K. (−)-Epigallocatechin gallate suppresses adipocyte differentiation through the MEK/ERK and PI3K/Akt pathways. Cell Biol. Int. 2012, 36, 147–153. [Google Scholar] [CrossRef] [PubMed]
- Jin, P.; Wu, H.; Xu, G.; Zheng, L.; Zhao, J. Epigallocatechin-3-gallate (EGCG) as a pro-osteogenic agent to enhance osteogenic differentiation of mesenchymal stem cells from human bone marrow: An in vitro study. Cell Tissue Res. 2014, 356, 381–390. [Google Scholar] [CrossRef] [PubMed]
- Vali, B.; Rao, L.G.; El-Sohemy, A. Epigallocatechin-3-gallate increases the formation of mineralized bone nodules by human osteoblast-like cells. J. Nutr. Biochem. 2007, 18, 341–347. [Google Scholar] [CrossRef] [PubMed]
- Ikeda, I. Multifunctional effects of green tea catechins on prevention of the metabolic syndrome. Asia Pac. J. Clin. Nutr. 2008, 17 (Suppl. S1), 273–274. [Google Scholar] [PubMed]
- Venkateswara, B.; Sirisha, K.; Chava, V. Green tea extract for periodontal health. J. Indian Soc. Periodontol. 2011, 15, 18–22. [Google Scholar] [CrossRef] [PubMed]
- Maeda, K.; Kuzuya, M.; Cheng, X.W.; Asai, T.; Kanda, S.; Tamaya-Mori, N.; Sasaki, T.; Shibata, T.; Iguchi, A. Green tea catechins inhibit the cultured smooth muscle cell invasion through the basement barrier. Atherosclerosis 2003, 166, 23–30. [Google Scholar] [CrossRef]
- Rodriguez, R.; Kondo, H.; Nyan, M.; Hao, J.; Miyahara, T.; Ohya, K.; Kasugai, S. Implantation of green tea catechin α-tricalcium phosphate combination enhances bone repair in rat skull defects. J. Biomed. Mater. Res. B Appl. Biomater. 2011, 98, 263–271. [Google Scholar] [CrossRef] [PubMed]
- Shen, B.; Wei, A.; Tao, H.; Diwan, A.D.; Ma, D.D. BMP-2 enhances TGF-β3-mediated chondrogenic differentiation of human bone marrow multipotent mesenchymal stromal cells in alginate bead culture. Tissue Eng. Part A 2009, 15, 1311–1320. [Google Scholar] [CrossRef] [PubMed]
- Honda, Y.; Tanaka, T.; Tokuda, T.; Kashiwagi, T.; Kaida, K.; Hieda, A.; Umezaki, Y.; Hashimoto, Y.; Imai, K.; Matsumoto, N.; et al. Local controlled release of polyphenol conjugated with gelatin facilitates bone formation. Int. J. Mol. Sci. 2015, 16, 14143–14157. [Google Scholar] [CrossRef] [PubMed]
- Shen, C.L.; Yeh, J.K.; Cao, J.J.; Wang, J.S. Green tea and bone metabolism. Nutr. Res. 2009, 29, 437–456. [Google Scholar] [CrossRef] [PubMed]
- Kanzaki, H.; Shinohara, F.; Itohiya-Kasuya, K.; Ishikawa, M.; Nakamura, Y. Nrf2 Activation attenuates both orthodontic tooth movement and relapse. J. Dent. Res. 2015, 94, 787–794. [Google Scholar] [CrossRef] [PubMed]
- Chen, C.H.; Ho, M.L.; Chang, J.K.; Hung, S.H.; Wang, G.J. Green tea catechin enhances osteogenesis in a bone marrow mesenchymal stem cell line. Osteoporos. Int. 2005, 16, 2039–2045. [Google Scholar] [CrossRef] [PubMed]
- Wei, Y.J.; Tsai, K.S.; Lin, L.C.; Lee, Y.T.; Chi, C.W.; Chang, M.C.; Tsai, T.H.; Hung, S.C. Catechin stimulates osteogenesis by enhancing PP2A activity in human mesenchymal stem cells. Osteoporos. Int. 2011, 22, 1469–1479. [Google Scholar] [CrossRef] [PubMed]
- Kamon, M.; Zhao, R.; Sakamoto, K. Green tea polyphenol (−)-epigallocatechin gallate suppressed the differentiation of murine osteoblastic MC3T3-E1 cells. Cell Biol. Int. 2009, 34, 109–116. [Google Scholar] [PubMed]
- Strohbach, C.; Strong, D.; Rundle, C. Gene Therapy Applications for Fracture Repair. In Gene Therapy Applications; Kang, C., Ed.; INTECH: Rijeka, Croatia, 2011; pp. 201–226. [Google Scholar]
- Golub, E.; Boesze-Battaglia, K. The role of alkaline phosphatase in mineralization. Curr. Opin. Orthop. 2007, 18, 444–448. [Google Scholar] [CrossRef]
- Mikami, Y.; Asano, M.; Honda, M.J.; Takagi, M. Bone morphogenetic protein 2 and dexamethasone synergistically increase alkaline phosphatase levels through JAK/STAT signaling in C3H10T1/2 cells. J. Cell. Physiol. 2010, 223, 123–133. [Google Scholar] [CrossRef] [PubMed]
- Harmey, D.; Hessle, L.; Narisawa, S.; Johnson, K.A.; Terkeltaub, R.; Millan, J.L. Concerted regulation of inorganic pyrophosphate and osteopontin by Akp2, Enpp1, and Ank: An integrated model of the pathogenesis of mineralization disorders. Am. J. Pathol. 2004, 164, 1199–1209. [Google Scholar] [CrossRef]
- Peruzzi, B.; Cappariello, A.; del Fattore, A.; Rucci, N.; de Benedetti, F.; Teti, A. c-Src and IL-6 inhibit osteoblast differentiation and integrate IGFBP5 signalling. Nat. Commun. 2012, 3, 630. [Google Scholar] [CrossRef] [PubMed]
- Chipoy, C.; Berreur, M.; Couillaud, S.; Pradal, G.; Vallette, F.; Colombeix, C.; Redini, F.; Heymann, D.; Blanchard, F. Downregulation of osteoblast markers and induction of the glial fibrillary acidic protein by oncostatin M in osteosarcoma cells require PKCδ and STAT3. J. Bone Miner. Res. 2004, 19, 1850–1861. [Google Scholar] [CrossRef] [PubMed]
- Nicolaidou, V.; Wong, M.M.; Redpath, A.N.; Ersek, A.; Baban, D.F.; Williams, L.M.; Cope, A.P.; Horwood, N.J. Monocytes induce STAT3 activation in human mesenchymal stem cells to promote osteoblast formation. PLoS ONE 2012, 7, e39871. [Google Scholar] [CrossRef] [PubMed]
- Langenbach, F.; Handschel, J. Effects of dexamethasone, ascorbic acid and β-glycerophosphate on the osteogenic differentiation of stem cells in vitro. Stem Cell Res. Ther. 2013, 4, 117. [Google Scholar] [CrossRef] [PubMed]
- Zuk, P.A.; Zhu, M.; Mizuno, H.; Huang, J.; Futrell, J.W.; Katz, A.J.; Benhaim, P.; Lorenz, H.P.; Hedrick, M.H. Multilineage cells from human adipose tissue: Implications for cell-based therapies. Tissue Eng. 2001, 7, 211–228. [Google Scholar] [CrossRef] [PubMed]
- Hattori, H.; Masuoka, K.; Sato, M.; Ishihara, M.; Asazuma, T.; Takase, B.; Kikuchi, M.; Nemoto, K. Bone formation using human adipose tissue-derived stromal cells and a biodegradable scaffold. J. Biomed. Mater. Res. B Appl. Biomater. 2006, 76, 230–239. [Google Scholar] [CrossRef] [PubMed]
- Song, I.H.; Caplan, A.I.; Dennis, J.E. In vitro dexamethasone pretreatment enhances bone formation of human mesenchymal stem cells in vivo. J. Orthop. Res. 2009, 27, 916–921. [Google Scholar] [CrossRef] [PubMed]
- Honda, Y.; Ding, X.; Mussano, F.; Wiberg, A.; Ho, C.M.; Nishimura, I. Guiding the osteogenic fate of mouse and human mesenchymal stem cells through feedback system control. Sci. Rep. 2013, 3, 3420. [Google Scholar] [CrossRef] [PubMed]
- Bertolo, A.; Schlaefli, P.; Malonzo-marty, C.; Baur, M.; Potzel, T.; Steffen, F.; Stoyanov, J. Comparative characterization of canine and human mesenchymal stem cells derived from bone marrow. Int. J. Stem Cell Res. Ther. 2015, 2, 1–6. [Google Scholar]
- Hamidouche, Z.; Hay, E.; Vaudin, P.; Charbord, P.; Schule, R.; Marie, P.J.; Fromigue, O. FHL2 mediates dexamethasone-induced mesenchymal cell differentiation into osteoblasts by activating Wnt/β-catenin signaling-dependent Runx2 expression. FASEB J. 2008, 22, 3813–3822. [Google Scholar] [CrossRef] [PubMed]
- Fey, D.; Croucher, D.R.; Kolch, W.; Kholodenko, B.N. Crosstalk and signaling switches in mitogen-activated protein kinase cascades. Front. Physiol. 2012, 3, 355. [Google Scholar] [CrossRef] [PubMed]
- Manning, B.D.; Cantley, L.C. AKT/PKB signaling: Navigating downstream. Cell 2007, 129, 1261–1274. [Google Scholar] [CrossRef] [PubMed]
- Arzate-Mejia, R.G.; Valle-Garcia, D.; Recillas-Targa, F. Signaling epigenetics: Novel insights on cell signaling and epigenetic regulation. IUBMB Life 2011, 63, 881–895. [Google Scholar] [CrossRef] [PubMed]
- Nauth, A.; Schemitsch, E.H. Stem cells for the repair and regeneration of bone. Indian J. Orthop. 2012, 46, 19–21. [Google Scholar] [PubMed]
- Kikuta, S.; Tanaka, N.; Kazama, T.; Kazama, M.; Kano, K.; Ryu, J.; Tokuhashi, Y.; Matsumoto, T. Osteogenic effects of dedifferentiated fat cell transplantation in rabbit models of bone defect and ovariectomy-induced osteoporosis. Tissue Eng. Part A 2013, 19, 1792–1802. [Google Scholar] [CrossRef] [PubMed]
© 2015 by the authors; licensee MDPI, Basel, Switzerland. This article is an open access article distributed under the terms and conditions of the Creative Commons by Attribution (CC-BY) license (http://creativecommons.org/licenses/by/4.0/).
Share and Cite
Kaida, K.; Honda, Y.; Hashimoto, Y.; Tanaka, M.; Baba, S. Application of Green Tea Catechin for Inducing the Osteogenic Differentiation of Human Dedifferentiated Fat Cells in Vitro. Int. J. Mol. Sci. 2015, 16, 27988-28000. https://doi.org/10.3390/ijms161226081
Kaida K, Honda Y, Hashimoto Y, Tanaka M, Baba S. Application of Green Tea Catechin for Inducing the Osteogenic Differentiation of Human Dedifferentiated Fat Cells in Vitro. International Journal of Molecular Sciences. 2015; 16(12):27988-28000. https://doi.org/10.3390/ijms161226081
Chicago/Turabian StyleKaida, Koji, Yoshitomo Honda, Yoshiya Hashimoto, Masahiro Tanaka, and Shunsuke Baba. 2015. "Application of Green Tea Catechin for Inducing the Osteogenic Differentiation of Human Dedifferentiated Fat Cells in Vitro" International Journal of Molecular Sciences 16, no. 12: 27988-28000. https://doi.org/10.3390/ijms161226081