Article

Differentially-Expressed Genes Associated with Faster Growth of the Pacific Abalone, Haliotis discus hannai

1
Department of Fishery Biology, PuKyong National University, Busan 608-737, Korea
2
Department of Microbiology, PuKyong National University, Busan 608-737, Korea
3
Department of Marine and Fisheries Resources, Mokpo National University, Muan 534-729, Korea
*
Authors to whom correspondence should be addressed.
These authors contributed equally to this work.
Int. J. Mol. Sci. 2015, 16(11), 27520-27534; https://doi.org/10.3390/ijms161126042
Submission received: 17 September 2015 / Revised: 9 November 2015 / Accepted: 10 November 2015 / Published: 18 November 2015
(This article belongs to the Special Issue Fish Molecular Biology)

Abstract

:
The Pacific abalone Haliotis discus hannai is used for commercial aquaculture in Korea. We examined the transcriptome of Pacific abalone Haliotis discus hannai siblings using NGS technology to identify genes associated with high growth rates. Pacific abalones grown for 200 days post-fertilization were divided into small-, medium-, and large-size groups with mean weights of 0.26 ± 0.09 g, 1.43 ± 0.405 g, and 5.24 ± 1.09 g, respectively. RNA isolated from the soft tissues of each group was subjected to RNA sequencing. Approximately 1%–3% of the transcripts were differentially expressed in abalones, depending on the growth rate. RT-PCR was carried out on thirty four genes selected to confirm the relative differences in expression detected by RNA sequencing. Six differentially-expressed genes were identified as associated with faster growth of the Pacific abalone. These include five up-regulated genes (including one specific to females) encoding transcripts homologous to incilarin A, perlucin, transforming growth factor-beta-induced protein immunoglobulin-heavy chain 3 (ig-h3), vitelline envelope zona pellucida domain 4, and defensin, and one down-regulated gene encoding tomoregulin in large abalones. Most of the transcripts were expressed predominantly in the hepatopancreas. The genes identified in this study will lead to development of markers for identification of high-growth-rate abalones and female abalones.

Graphical Abstract

1. Introduction

Abalone is regarded as a commercially-important marine gastropod with a high nutritional value [1]. Among the six abalone species (Haliotis (H.) discus hannai, H. discus discus, H. madaka, H. gigantea, H. diversicolor supertexta, and H. diversicolor) widely distributed in Korea, the Pacific abalone, Haliotis discus hannai, is the major species used in the aquaculture industry. Farmed abalone production in Korea has increased rapidly from 20 tons in 2000 to 9000 tons in 2012, and accounts for 20% of global abalone production [2,3]. However, the Korean abalone aquaculture industry has in recent years experienced a decline in productivity, possibly due to deterioration of aquaculture environments, including overcrowded facilities, and genetic degradation, such as inbreeding depression. Optimization of the culture conditions and increasing the nutritional value of abalone feed have been suggested as methods of improving productivity [4,5].
Selection of abalone species with higher growth rates is critical to reduce the time and cost involved in reaching a marketable size in the aquaculture industry. Much effort has focused on developing a fast-growing strain by selective breeding [6] and heterosis [7]. Identification of target abalone strains with higher growth rates and desirable phenotypic traits has been facilitated by molecular tracking technologies, including quantitative trait loci analysis and molecular-marker-assisted selection [8,9,10,11]. Analysis of differentially-expressed genes (DEGs) associated with the growth of marine invertebrates and molluscans led to identification of insulin-related peptide, extracellular matrix, neuropeptides, nacre protein, and immune-related proteins in Crassostrea gigas [12] and Lymnaea stagnalis [13], and immune-related genes in Pinctada fucata [14]. Despite these issues with abalone aquaculture, many aspects on the genetic and physiological mechanisms associated with a high growth rate in Pacific abalone remain unclear.
Recent developments in next-generation sequencing (NGS) technologies have enabled low-cost, high-throughput sequencing, which is important for research and clinical purposes [15]. High-throughput sequencing of genomes facilitates not only the discovery of genes associated with disease, but also diagnosis of pathological conditions based on rapid identification of disease-causing mutations. Recently, NGS has been used to study changes in transcriptomes according to physiological conditions or cell type in marine organisms such as zebrafish [16], salmon louse [17], and Haliotis midae [18]. In this study, we explored the transcriptome of Pacific abalone, Haliotis discus hannai siblings using NGS technology to identify the genes associated with differential growth performance. To this end, abalones of various sizes collected following growth under identical conditions were divided into large, medium, and small groups and subjected to RNAseq analysis [19]. Differentially-expressed genes were identified by comparison of the transcriptomes of the three groups and were subjected to functional annotation analysis. A proportion of the differentially-expressed genes were verified by RT-PCR.

2. Results and Discussion

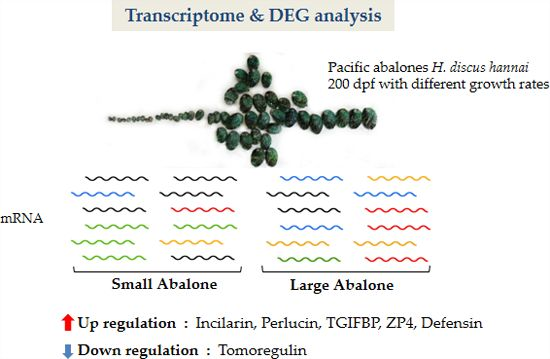
2.1. Differential Growth in Pacific Abalones

Pacific abalones, H. discus hannai, grown for 200 days post-fertilization (dpf) under the same condition in two independent facilities, National Fisheries Research and Development Institute (NFRDI) and Marine-Fisheries and Development Institute (MFDI) as described in Materials, were subjected to transcriptome analysis. We focused our analysis on abalone spats of approximately 200 dpf, as they have distinct tissue morphologies compared to 100 dpf spats and a faster growth rate compared to 300 dpf spats, as inferred from weight increases. Therefore, 200 dpf abalones were chosen for further analysis. Eighty abalones of various sizes collected from NFRDI were measured to determine weight, shell width, length, and height, and then divide into three groups by sizes. Table 1 shows the sizes of ten abalones selected from the small-, medium-, and large-size groups subjected to RNAseq analysis. Up to a 20-fold difference in weight, together with a three-fold difference in shell length, width, and height were observed between the small- and large-size groups depending on the lineage. Another batch of Pacific abalones grown at different facility (MFDI) for 200 dpf was collected to verify the results using RT-PCR. Abalones were divided into two groups by size: small and large. Weight, shell width, length, and height ranged from 0.37 ± 0.87 g, 8.25 ± 2.02 mm, 10.98 ± 3.46 mm, and 2.63 ± 0.80 mm, respectively, in the small group (n = 19), to 3.79 ± 0.9 g, 22.82 ± 1.74 mm, 32.70 ± 3.41 mm, and 9.37 ± 0.94 mm, respectively, in the large group (n = 10). Abalones randomly selected from each group were subjected to RNA isolation followed by RT-PCR amplification. In addition, abalones older than one year with fully developed gonad phenotypes obtained from a regional market were used to examine gender-specific expression.
Table 1. Growth traits of Pacific abalones used for RNAseq transcriptome analysis. The sizes of 80 abalone spats 200 days post-fertilization were measured. The values (mean ± standard deviation) represent those from 10 abalones selected from small, medium, and large sized individuals for RNAseq analysis.
GroupsShell Length (mm)Shell Width (mm)Shell Height (mm)Weight (g)
Small (n = 10)13.53 ± 1.349.54 ± 1.112.87 ± 0.410.26 ± 0.09
Medium (n = 10)24.12 ± 2.4916.35 ± 1.454.95 ± 0.461.43 ± 0.40
Large (n = 10)36.15 ± 2.2124.99 ± 1.438.86 ± 1.195.24 ± 1.09
Mean ± SD (n = 80)24.63 ± 8.1717.09 ± 5.585.54 ± 2.262.10 ± 1.81

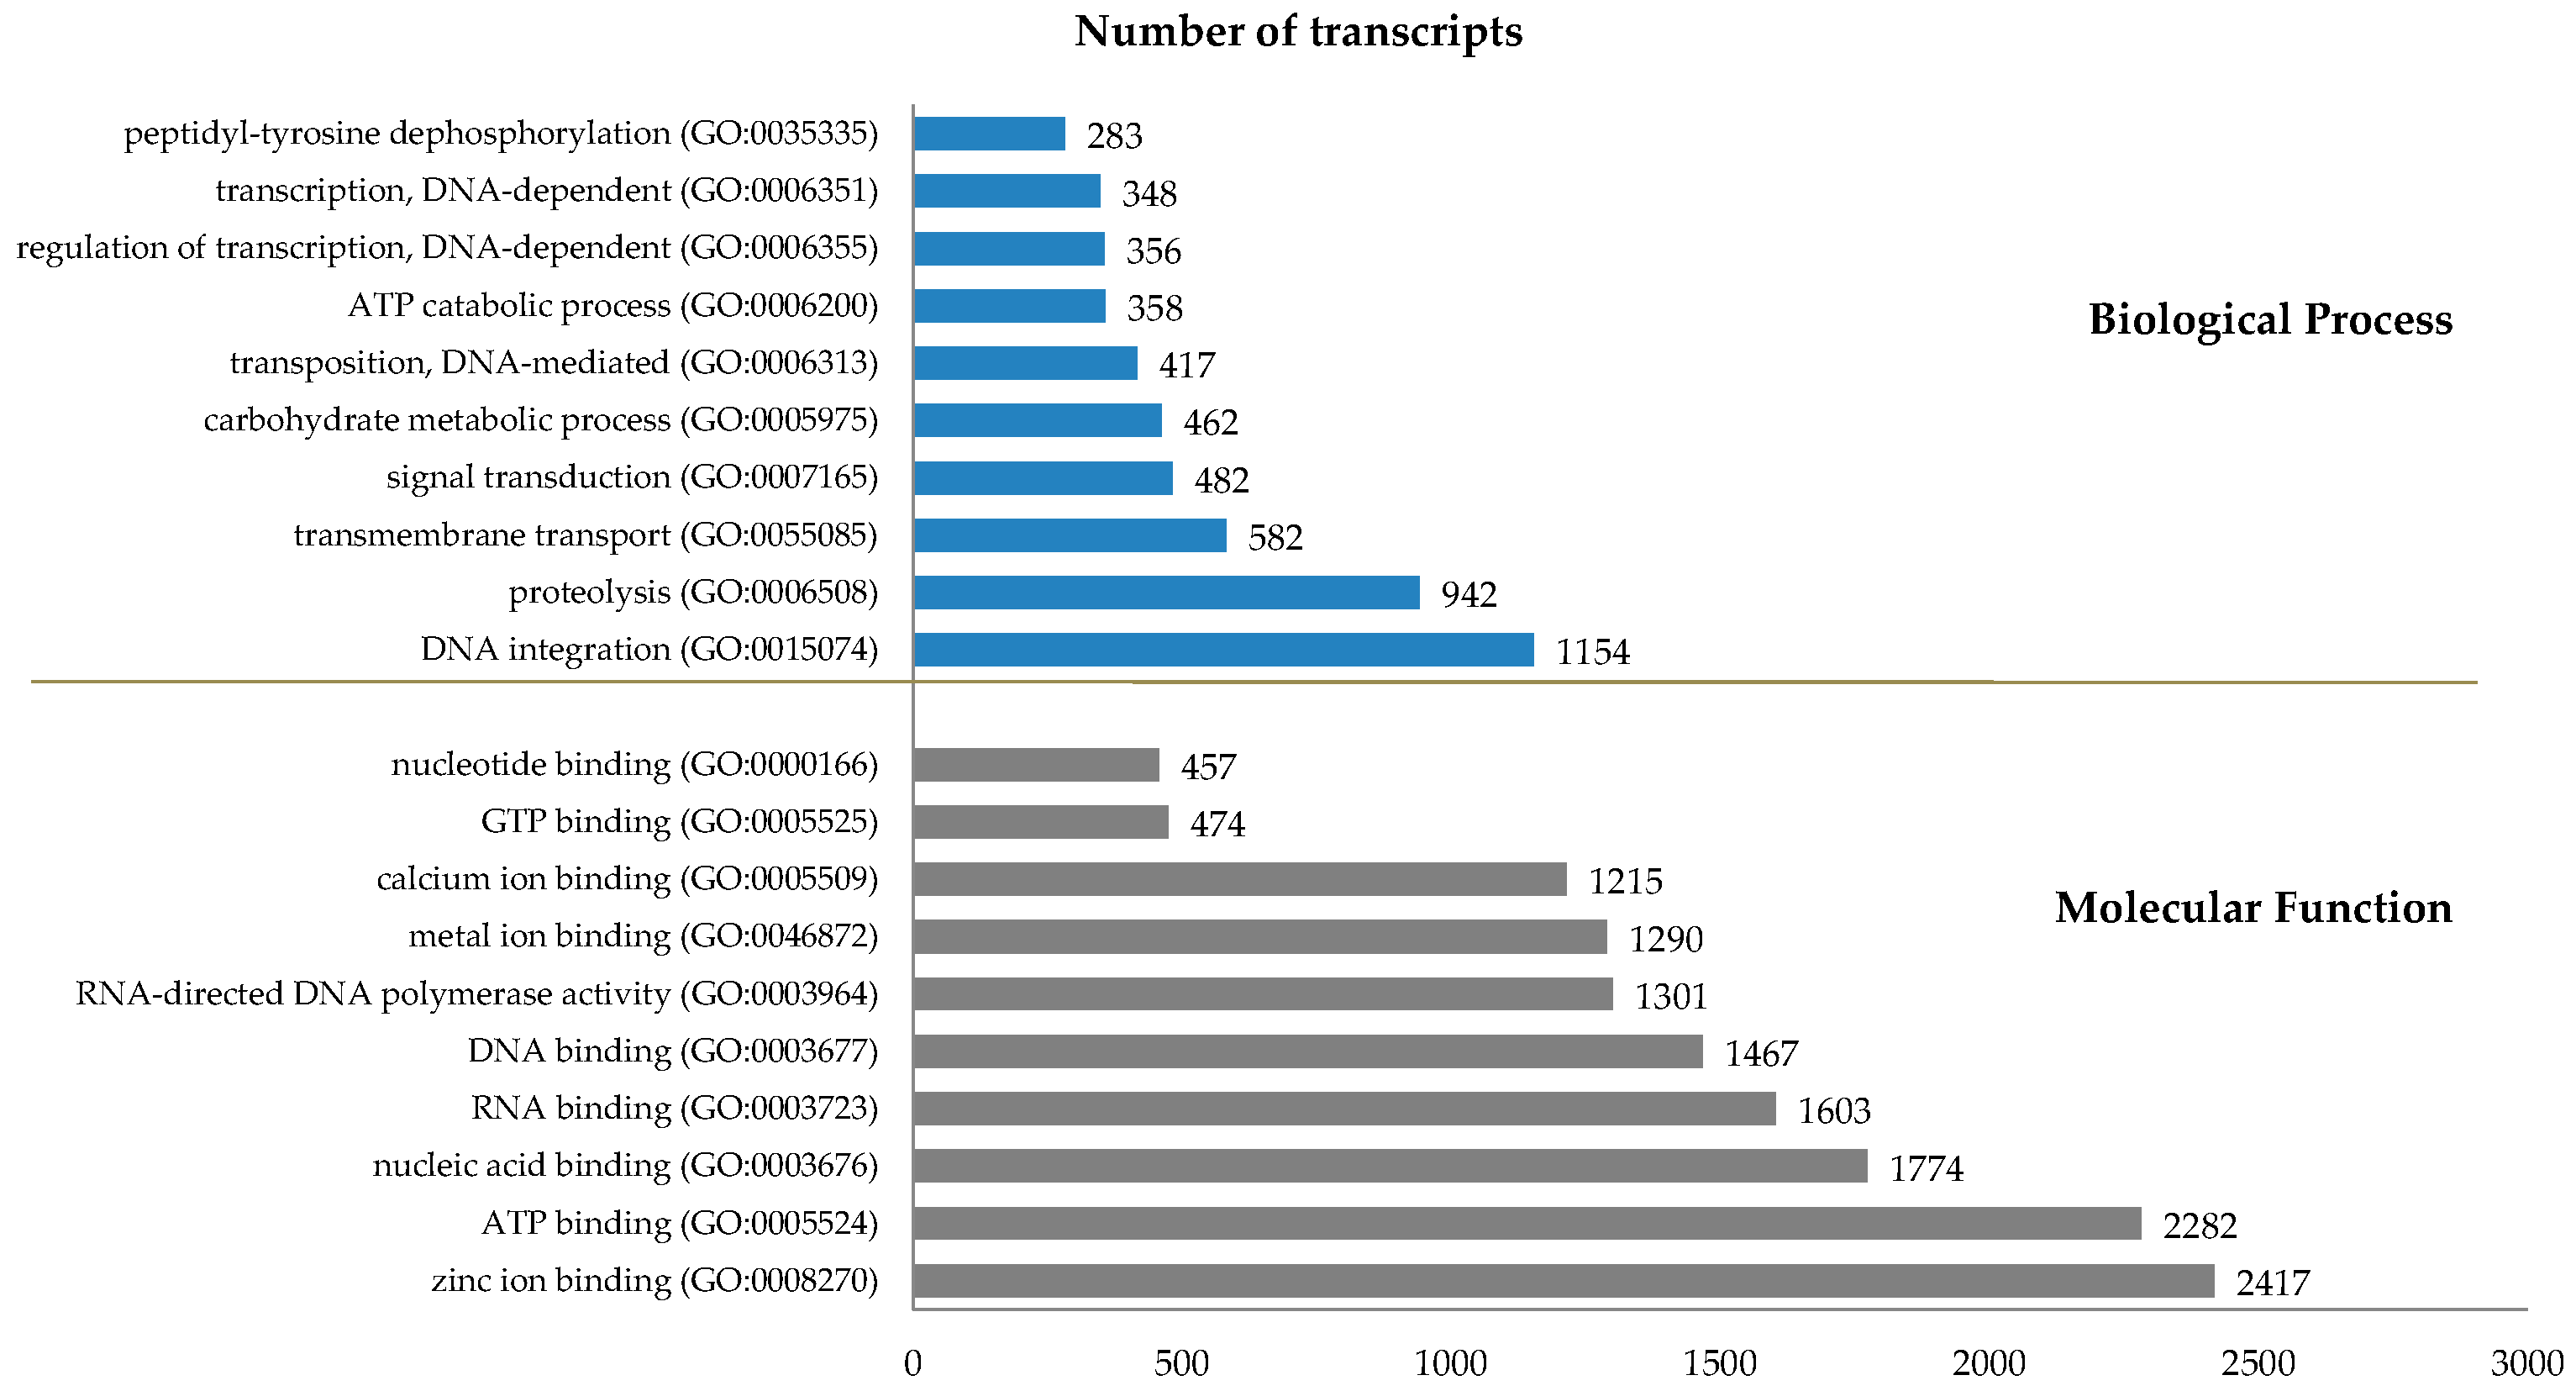
2.2. Transcriptome Analysis

To identify the genes associated with differential growth, RNA was isolated from soft tissues of abalone and subjected to gel electrophoresis (data not shown). RNAseq analysis was carried out using a mixture of RNAs from 10 abalones per group to reduce the problems associated with deviation stemming from a single organism. Transcript levels were quantified by calculating reads per kilobase of exon per million mapped reads (RPKM) values with a 0.3 RPKM threshold value for differential expression [20]. A total of 117,537 reference contigs (average sequence length, 804.5 bp) was obtained through de novo assembly together with BLASTx analysis. Of the 28,981 (24.7%) best-hit BLASTx transcripts, GO assignment revealed 17,872 (61.7%) transcripts with molecular functions (MF), the top 10 of which were (in order of magnitude): zinc ion binding (16.9%), ATP binding (16.0%), and nucleic-acid binding (12%: Figure 1). The total of 12,647 (43.6%) transcripts in the biological process (BP) category comprised predominantly those involved in DNA integration (21.4%) and proteolysis (17.5%).
Figure 1. GO (Gene ontology) classification of the reference genes identified by transcriptome analysis of Pacific abalones. The top 10 GO terms and their proportions in the molecular function and biological process categories are shown.
Ijms 16 26042 g001
Differentially-expressed transcripts were determined by comparison of the RPKM values within fold change (FC) of genes among the size groups (Table 2). The number of transcripts showing more than twofold (false discovery rate, FDR ≤ 0.05) changes in expression was 9225 to 21,655, depending on the groups included in the comparison. A total of 971 transcripts showed >10-fold differences in expression between the large- and small-size groups, of which 543 transcripts were up-regulated and 428 down-regulated in the large-size group. Gene set enrichment analysis indicated that the transcript down-regulated to the greatest extent in large-size abalones belonged to the carnitine biosynthesis category (GO:0045329). Transcripts involved in G1/S-specific transcription in the mitotic cell cycle (GO:0000083), amylopectin biosynthesis (GO:0010021), Cul5-RING ubiquitin ligase complex (GO:0031466), and regulation of nitrogen utilization (GO:0006808) showed the greatest degrees of up-regulation in the large group. Transcripts that showed consistent changes in their patterns of expression in similar comparisons; e.g., large vs. medium and large vs. small, were selected for further analysis.
Table 2. Genes showing differential expression between small and large abalones. Differentially-expressed transcripts were determined from comparisons of the RPKM values of genes in large vs. medium, large vs. small, and medium vs. small Pacific abalones. Numbers were obtained using two-, four-, and 10-fold change (FC) cut-off values, and the FDR threshold is indicated.
Comparison (Total: RPKM ≥ 0.3)FC ≥ 2, FDR ≤ 0.05FC ≥ 4, FDR ≤ 0.01FC ≥ 10, FDR ≤ 0.001
UpDownTotalUpDownTotalUpDownTotal
Large vs. Medium22,68043834842922513019082209190141331
Large vs. Small24,41410,957465015,607285915454404543428971
Medium vs. Small22,33816,406524921,6554216190761238125141326

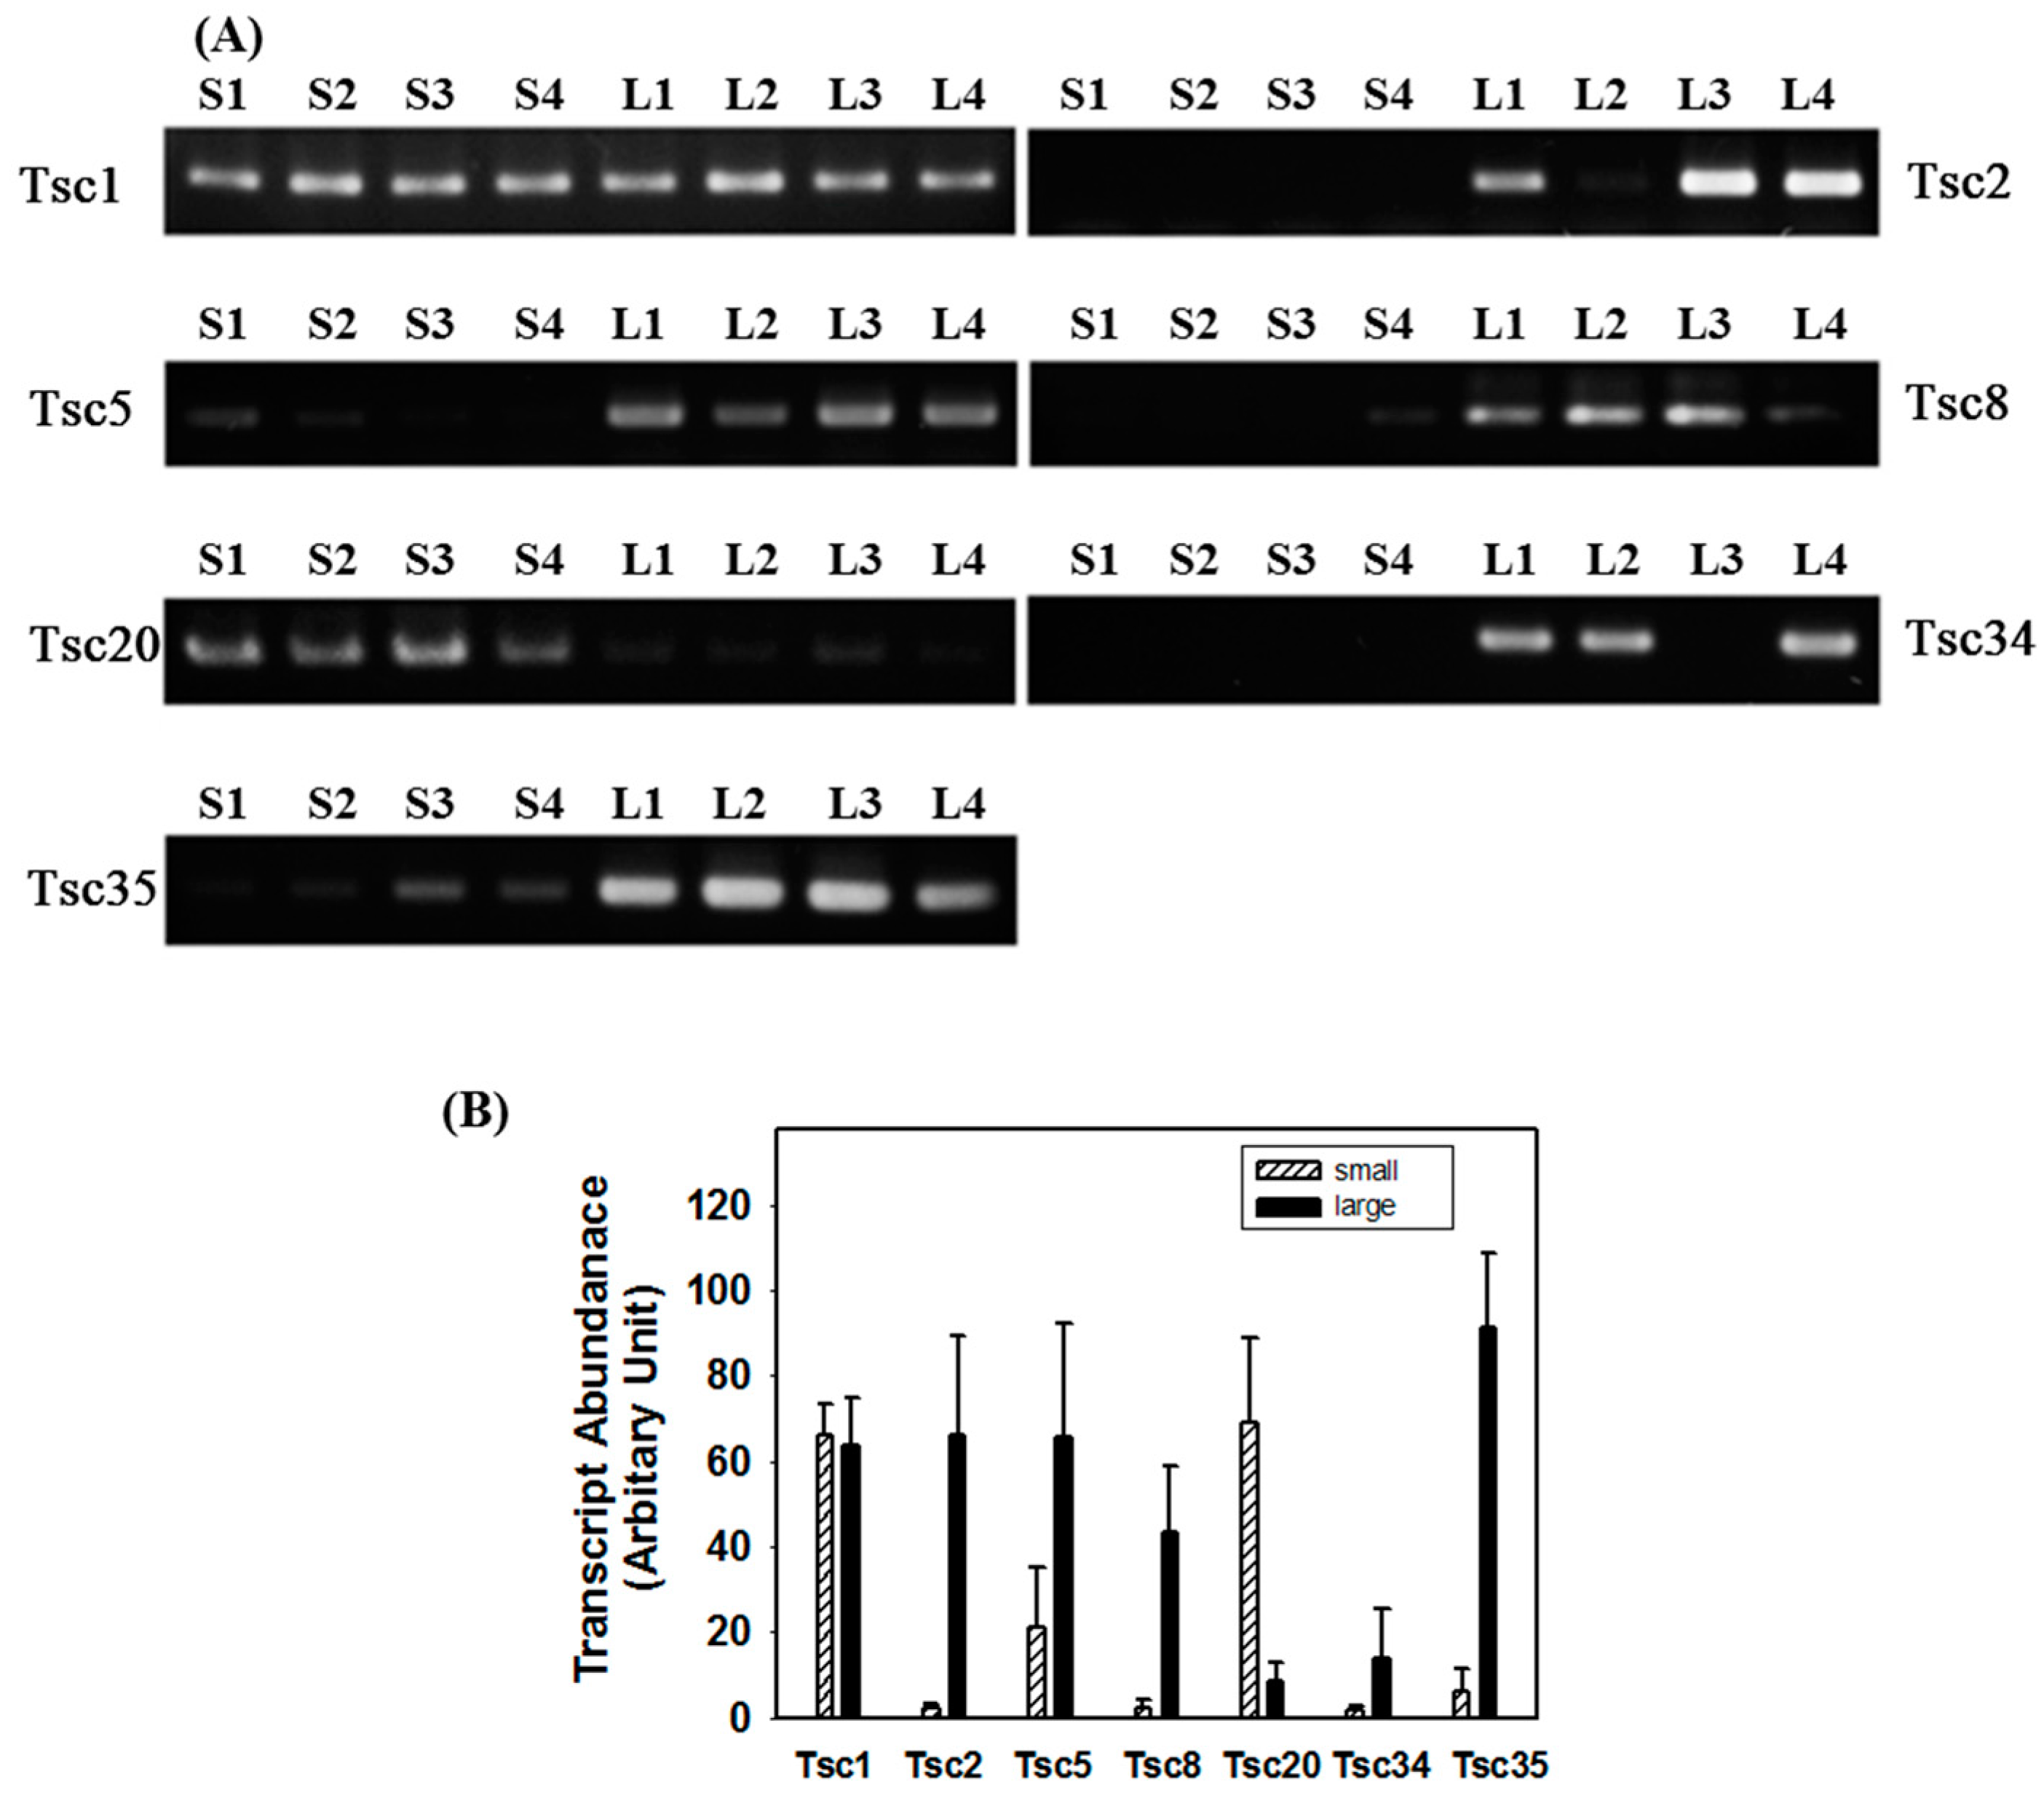
2.3. Reverse Transcription-PCR (RT-PCR) Analysis

RT-PCR was carried out to confirm the differences in expression detected by RNAseq analysis. The ribosomal protein L3 (Tsc1) transcript was selected from those expressed at a constant level in all three groups (0.8–1.2 FC) as an internal control for normalization of expression levels. Preliminary sets of PCR experiments were carried out with various numbers of PCR cycles to find the condition where the amounts of the products were proportional to the templates and cycles. PCR products were resolved and detected under the gel electrophoresis condition suitable for densitometric analysis. Target genes selected were those showing (i) a consistent and higher level of expression in comparisons of the large vs. medium, medium vs. small, and large vs. small groups; (ii) a size of >300 bp to enable design of primers that result in amplification of ≥250 bp fragments to facilitate detection; and preferably (iii) an association with genes potentially involved in growth-related phenotypes. Based on the above criteria, 34 genes showing consistent expression profile in all comparisons, preferably with available functional annotation information, were selected (Table 3). Among these 34 genes, 27 were up-regulated and seven down-regulated in the large-size group; these were designated Tsc2 to Tsc35. PCR primers corresponding to the sequences obtained from RNAseq analysis were designed using the OligoAnalyzer software (ver. 3.1; IDT Technologies, Coralville, IA, USA).
Differential-expression of the selected transcripts was confirmed first using cDNA templates prepared from the RNA used for DEG analysis. To further verify the result, duplicate sets of RT-PCRs were performed using templates independently prepared from four abalones each in the small- and large-size groups from a separate batch of Pacific abalones (Figure 2). Densitometric analysis of PCR products indicated that, of the 34 transcripts (Tsc2–Tsc35) tested, six showed consistent expression profiles by both RT-PCR and RNAseq analysis. These included transcripts encoding a gene similar to incilarin A (Tsc2), perlucin (Tsc5), transforming growth factor-β-induced protein immunoglobulin-heavy chain 3 (ig-h3:Tsc8), tomoregulin-2 (Tsc20), vitelline envelope zona pellucida domain 4 (Tsc34), and defensin (Tsc35). The average (95% Confidence Interval) transcript levels calculated using at least eight individual samples from the small and large groups, respectively, were 2.30 (1.49, 3.21) and 65.95 (42.31, 89.59) for Tsc2, 21.13 (6.96, 35.40) and 65.62 (38.98, 92.26) for Tsc5, 2.19 (0.36, 4.02) and 43.35 (27.69, 59.01) for Tsc8, 68.92 (49.09, 88.78) and 8.41 (3.98, 12.84) for Tsc20, 1.65 (0.52, 2.78) and 13.77 (1.85, 25.69) for Tsc34, and 5.95 (0.48, 11.42) and 91.25 (73.59, 108.91) for Tsc35. Thus, Tsc20 was down-regulated, while the other five were up-regulated, in the large abalone group. The mean differences in the levels of all transcripts tested between the small and large groups were statistically significant (Mann-Whitney U statistic, p < 0.05) even with the small (n = 8~12) sample sizes and different variations. The absence of Tsc34 in some abalones might be due to discrepancies in its expression according to sex (see below).
Table 3. Genes tested for differential expression by Reverse Transcription-PCR (RT-PCR). Transcript levels identified by RNAseq analysis of large, medium, and small size abalones were shown for RPKM values. The Tsc1 housekeeping gene, which encodes ribosomal protein L3, was included as a control. Nucleotide sequences of primers used for RT-PCR were indicated. E value refers to the number of random hits one can expect by chance for the query sequence upon searching a database.
Gene IDRPKME Value*DescriptionbpPrimer 5′–3′
LargeMediumSmall
Tsc11294.331227.591392.610Ribosomal protein L3 (D1M828)1401F: 5′-TGTCACCATCCTTGAGGCAC
R: 5′-CAGGAACAGGCTTCTCCAGG
Tsc210.034.080.885.00 × 10−16Incilarin A (B6RB57)709F: 5′-GGCGGCTACCTGGTTGAAAT
R: 5′-CCCACGATGTCTGGTCCATC
Tsc30.70.190.042.00 × 10−18Multiple epidermal growth factor-like domains 6451F: 5′-GTACTGCCAGCTGGGTTCAT
R: 5′-CACCCGCCATTACAGCCAT
Tsc40.080.9902.00 × 10−23Multiple epidermal growth factor-like domains 11488F: 5′-CGGGTGGTTTGGAGAAGAGT
R: 5′-AGGCATGATCCACAATGCGA
Tsc519.2611.712.747.00 × 10−52Perlucin (P82596)375F: 5′-CCTCTTGGGTTTATGCAGCAC
R: 5′-CGGACTGTCTCATTTCCAGAC
Tsc68.596.111.865.00 × 10−15EGF-like domain containing protein1222F: 5′-CACGGACATCACTGCAATAAGC
R: 5′-GACATGGCTCATGCGTCTCA
Tsc74.081.550.952.00 × 10−21Multiple epidermal growth factor-like domains 10529F: 5′-GCAAGCACTGCAACCAAACT
R: 5′-TGCAACTTCTCTCCAGGCAG
Tsc833.6823.47.373.00 × 10−8Transforming growth factor-β-induced protein ig-h3 (K1PUI7)399F: 5′-GTACGCATGGTCACCTACCC
R: 5′-TCGTAGCAGGGGTATGTTGTTA
Tsc92.271.140.434.00 × 10−18EGF-like domain containing protein745F: 5′-CTGACTGCAAGAGAGGCTGG
R: 5′-CTTGACATCCCCCTGGACAC
Tsc100.540.420.161.00 × 10−38Insulin-like growth factor-binding protein1123F: 5′-AGAGGTTCCTCCTGCCATCA
R: 5′-GCTTGTAGAGGCACCAGTGT
Tsc112.715.290.152.00 × 10−51Peroxidasin-like protein938F: 5′-ACAGTCTCGATCTGATGGCTT
R: 5′-CCAGAATCTGTCGCCCACTT
Tsc1237.2724.877.637.00 × 10−11C-type lectin 4430F: 5′-CCTCGGGCTCTGCGACTC
R: 5′-ACGCCAGTCACCCTCAGTTG
Tsc1319.4221.524.742.00 × 10−30Choline transporter-like protein 1289F: 5′-CGTGGCAGCGATTAACTGTG
R: 5′-GCTCATGTAGTAAGGCCGCT
Tsc148.149.341.865.00 × 10−79Fibroblast growth factor receptor 21807F: 5′-TCTCTGCGTCGCCATTCTTT
R: 5′-CAGTTGGACCAGCGGAGAAT
Tsc152683.362020.81979.781.00 × 10−36Dermatopontin 3604F: 5′-TCCCTACTGCGTTTCTGCTG
R: 5′-CTACCTTGCAGGGAGCAACA
Tsc1649.817.7416.353.00 × 10−16Perlucin A2 protein658F: 5′-TCCACTGGGATTTGTGGAACA
R: 5′-GTTGGCCCCTTCTCCAGTTG
Tsc1736.3146.589.192.00 × 10−16CD63 antigen1413F: 5′-TGGATTCAGCAAACCCGGAA
R: 5′-CAGGAAGCTTTGGGGTCGAA
Tsc18329.2276.28216.622.00 × 10−144Cathepsin L2 cysteine protease; EC1090F: 5′-GTCGACTGGAGAACCAAGGG
R: 5′-GACAGAGATGGGACCAACGG
Tsc19212.38144.811636.370.00000007Calcium binding protein 1457F: 5′-GGTGATAACCGTCTGACCGA
R: 5′-GGTGACAAATTCGCTTCGGG
Tsc2045.4625.82374.981.00 × 10−23Tomoregulin-2 (K1Q9X6)722F: 5′-ACTGTGACCATGAGCGTGAG
R: 5′-CAGCTACGTGGAGATCACGG
Tsc215.082.92157.671.00 × 10−10Fasciclin domain-containing protein617F: 5′-TCCAAGACCAGCACCCAATC
R: 5′-GGTCTGACAGGGAACTTGGG
Tsc220.971.1162.30.0000006Fasciclin domain-containing protein525F: 5′-CAGGGCTCAACACCCAACAT
R: 5′-TAGTTGATGTCGGCAGCCTT
Tsc231.771.2312.552.00 × 10−79Cyanophycinase1804F: 5′-GGAGCTCAGGAGTCGTTGAC
R: 5′-CGTTGCGCAAGCTGTAGTAG
Tsc244.597.1431.981.00 × 10−35Cathepsin L1062F: 5′-ACTGACACGGAGGAGATCCA
R: 5′-TCCAGTCGACTTTTGTGGGG
Tsc251.371.877.241.00 × 10−61EGF-like domain-containing protein 12194F: 5′-GGAGTGCAACGGAGAGAACA
R: 5′-TCTGATGTGTTGGCAGCGAT
Tsc26314.26479.5724.624.00 × 10−18uncharacterized protein; Flags: Fragment306F: 5′-ATGACTGCCAGGTTTCTCCC
R: 5′-CCCAGCAAGCATGTACAAGTG
Tsc27255.69183.924.211.00 × 10−16Uncharacterized protein1000F: 5′-ACTGTCTCTACAACAGCGCC
R: 5′-GCCTGACTCGAAGATGCAGA
Tsc28188.0395.6516.943.00 × 10−42Uncharacterized protein611F: 5′-ACAACTGCTCTGCTCCAACA
R: 5′-GGTGAGTCTTCCCTTCCCAC
Tsc29156.32133.958.053.00 × 10−35Uncharacterized protein423F: 5′-CAGAGCATCTGAGGGAGTGC
R: 5′-TGCACTGACCCGAATACACC
Tsc3014.715.872.590Dual oxidase4918F: 5′-CACTTTGATTCCGTCGGGGA
R: 5′-CAGCCATGGGTTGATGTCCT
Tsc3110.2912.0524.00 × 10−61Homeobox protein engrailed1804F: 5′-TGGGTTTTCTGCACTCGCTA
R: 5′-TGGAACCGGTGCTCTTCTTC
Tsc328.1711.220.832.00 × 10−167Putative ammonium transporter 11512F: 5′-GGACGATTCCACCCGGATAC
R: 5′-AAAGGAGATGGCGGCAAAGA
Tsc3372.452.736.982.00 × 10−65Annulin1013F: 5′-GAAACTGGGGCCACGAAGTA
R: 5′-CCATGCTTTGACTCCGACCT
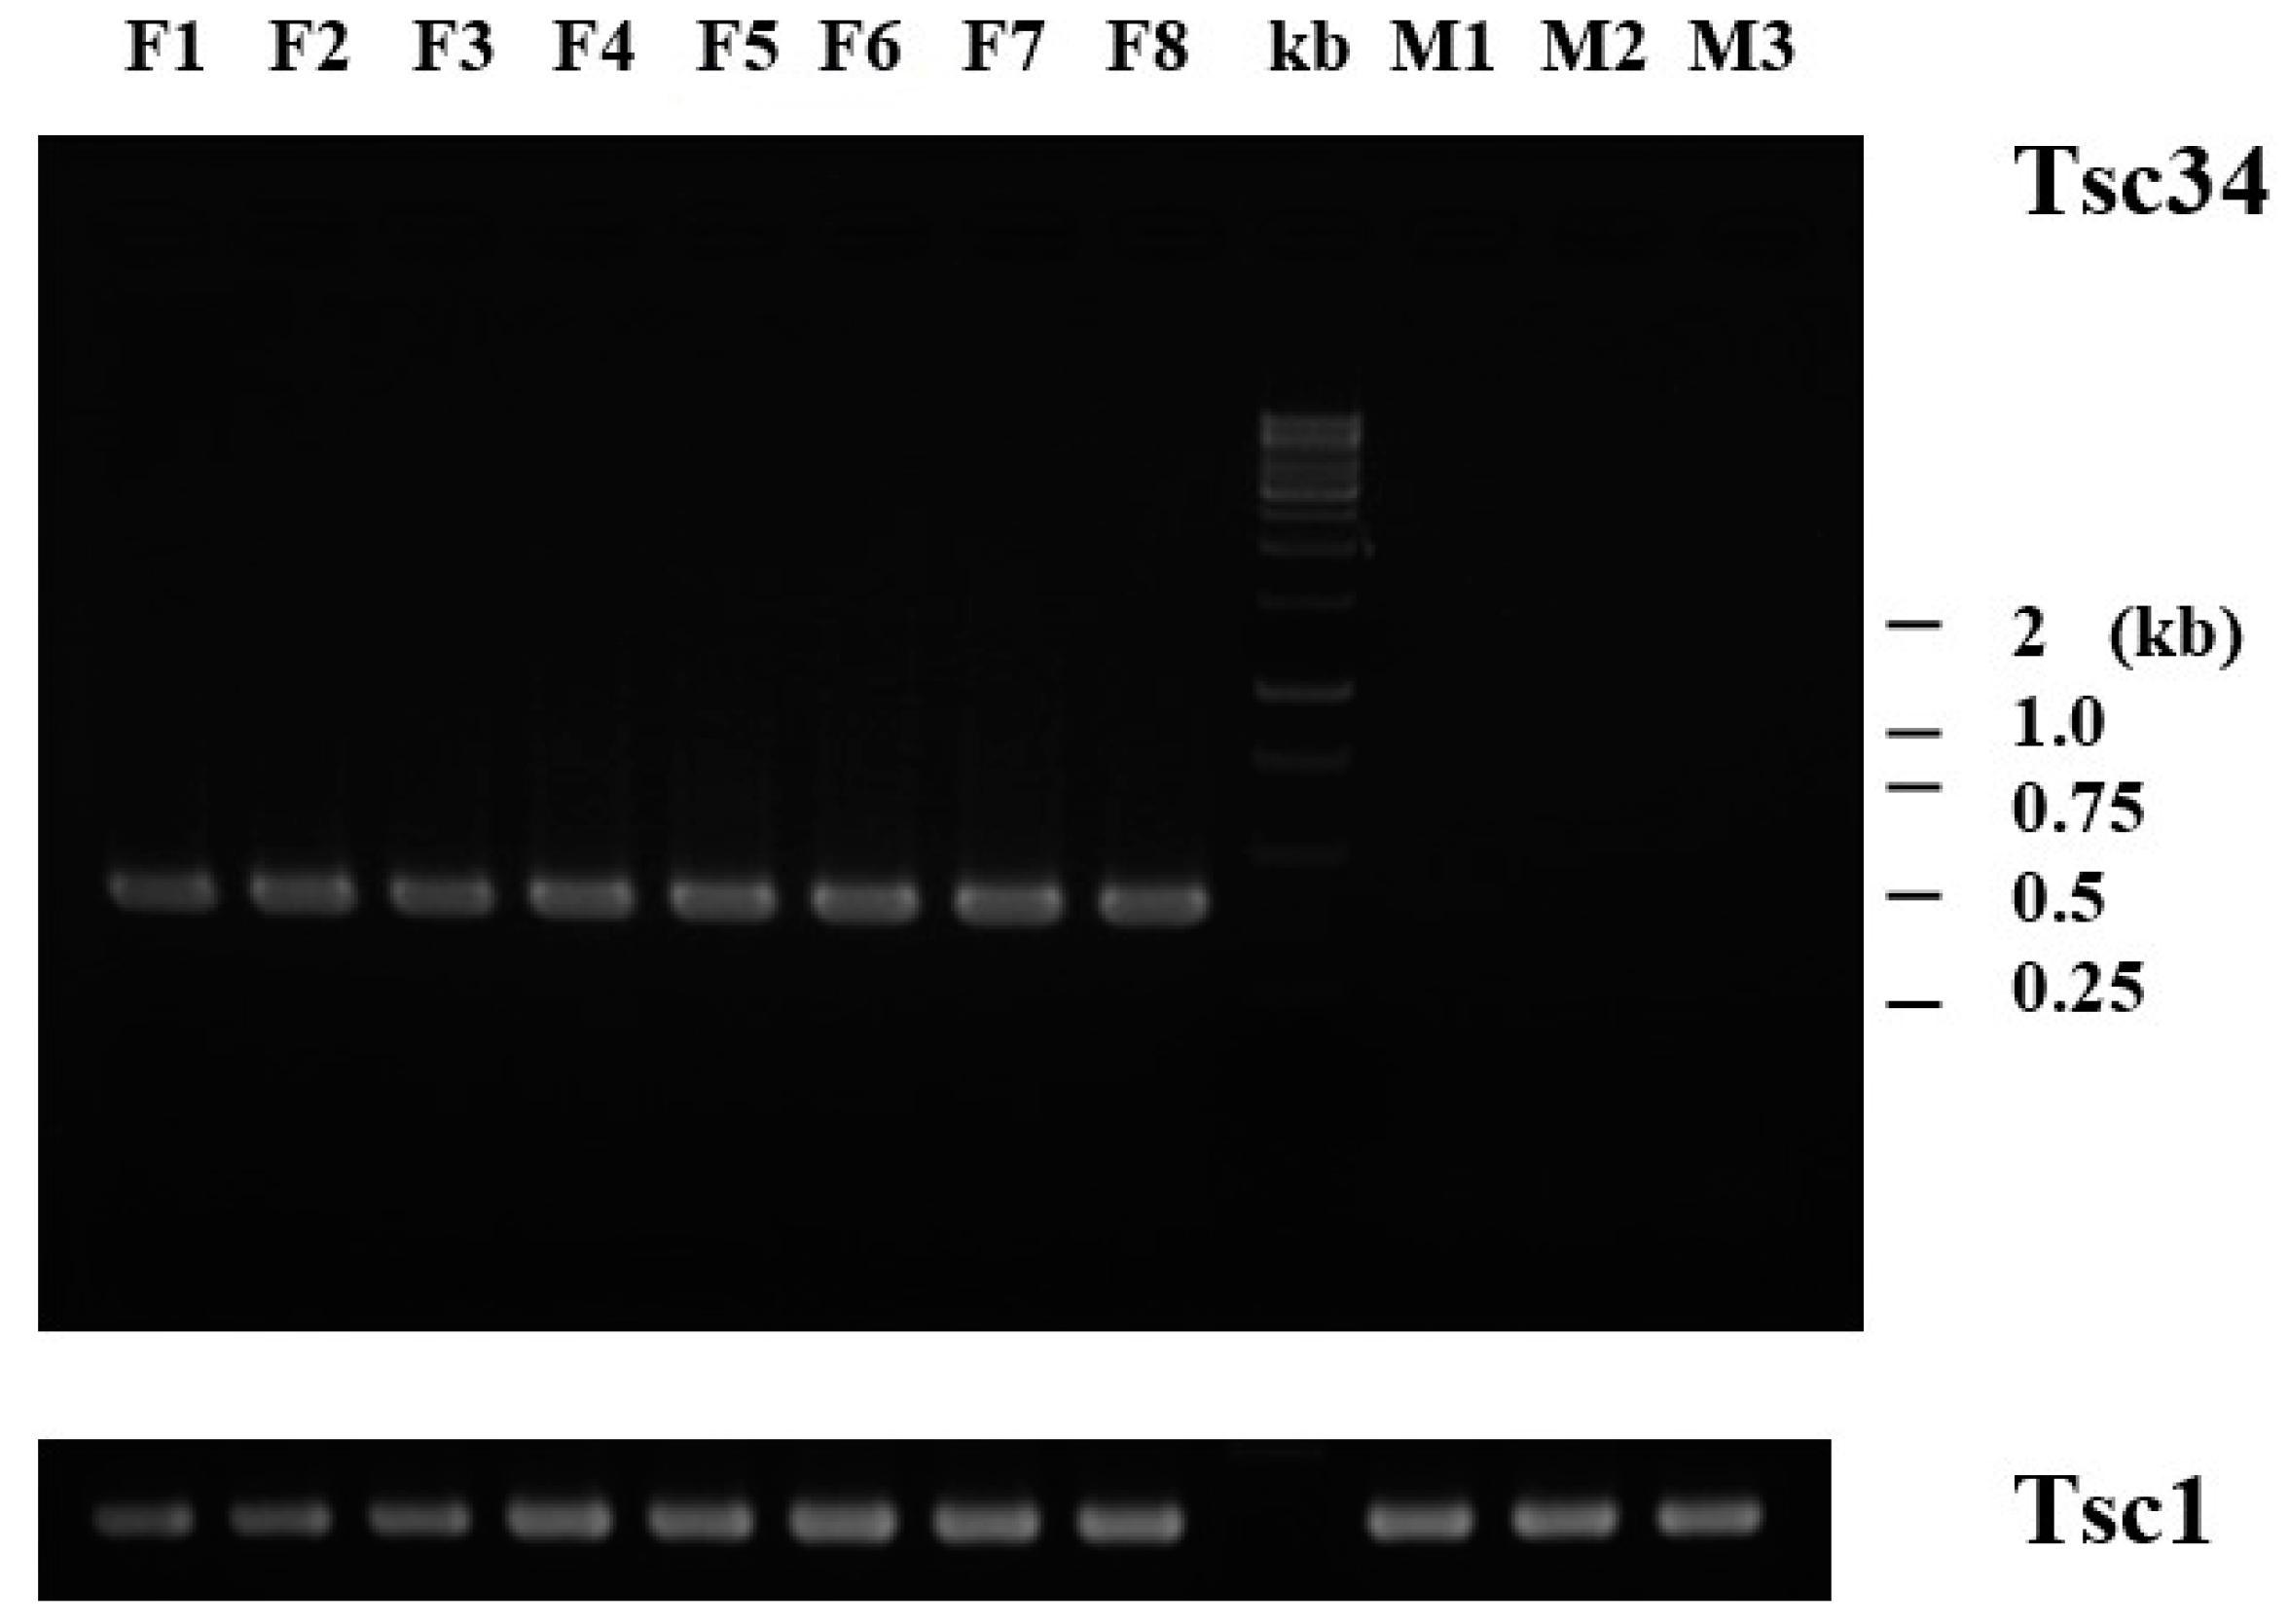
Tsc342.280.600Vitelline envelope zona pellucida domain 4 (A0MCN4)990F: 5′-ATCAGCTGCTACTTCCAGCC
R: 5′-ACGGATCCCCATTCACGATG
Tsc35155.2389.8333.461.00 × 10−32Defensin (D3UAH2)614F: 5′-CTGCTTCTGCTGTGTTTGGT
R: 5′-CGACAGACACAGACGCCATT
Figure 2. Transcript levels in small and large Pacific abalones. (A) RNA was isolated from four abalones in the small (S1–S4) and large (L1–L4) groups and cDNA was synthesized. PCR was carried out using primers specific for ribosomal protein L3 (Tsc1), and differentially-expressed candidates encoding transcripts similar to incilarin A (Tsc2), perlucin (Tsc5), transforming growth factor-β-induced protein ig-h3 (Tsc8), tomoregulin-2 (Tsc20), vitelline envelope zona pellucida domain 4 (Tsc34), and defensin (Tsc35). PCR products were resolved by 2% agarose gel electrophoresis followed by ethidium bromide staining; and (B) transcript levels in small (shaded) and large (filled) abalones. Values are expressed as the means with 95% confidence intervals (n ≥ 8).
Ijms 16 26042 g002

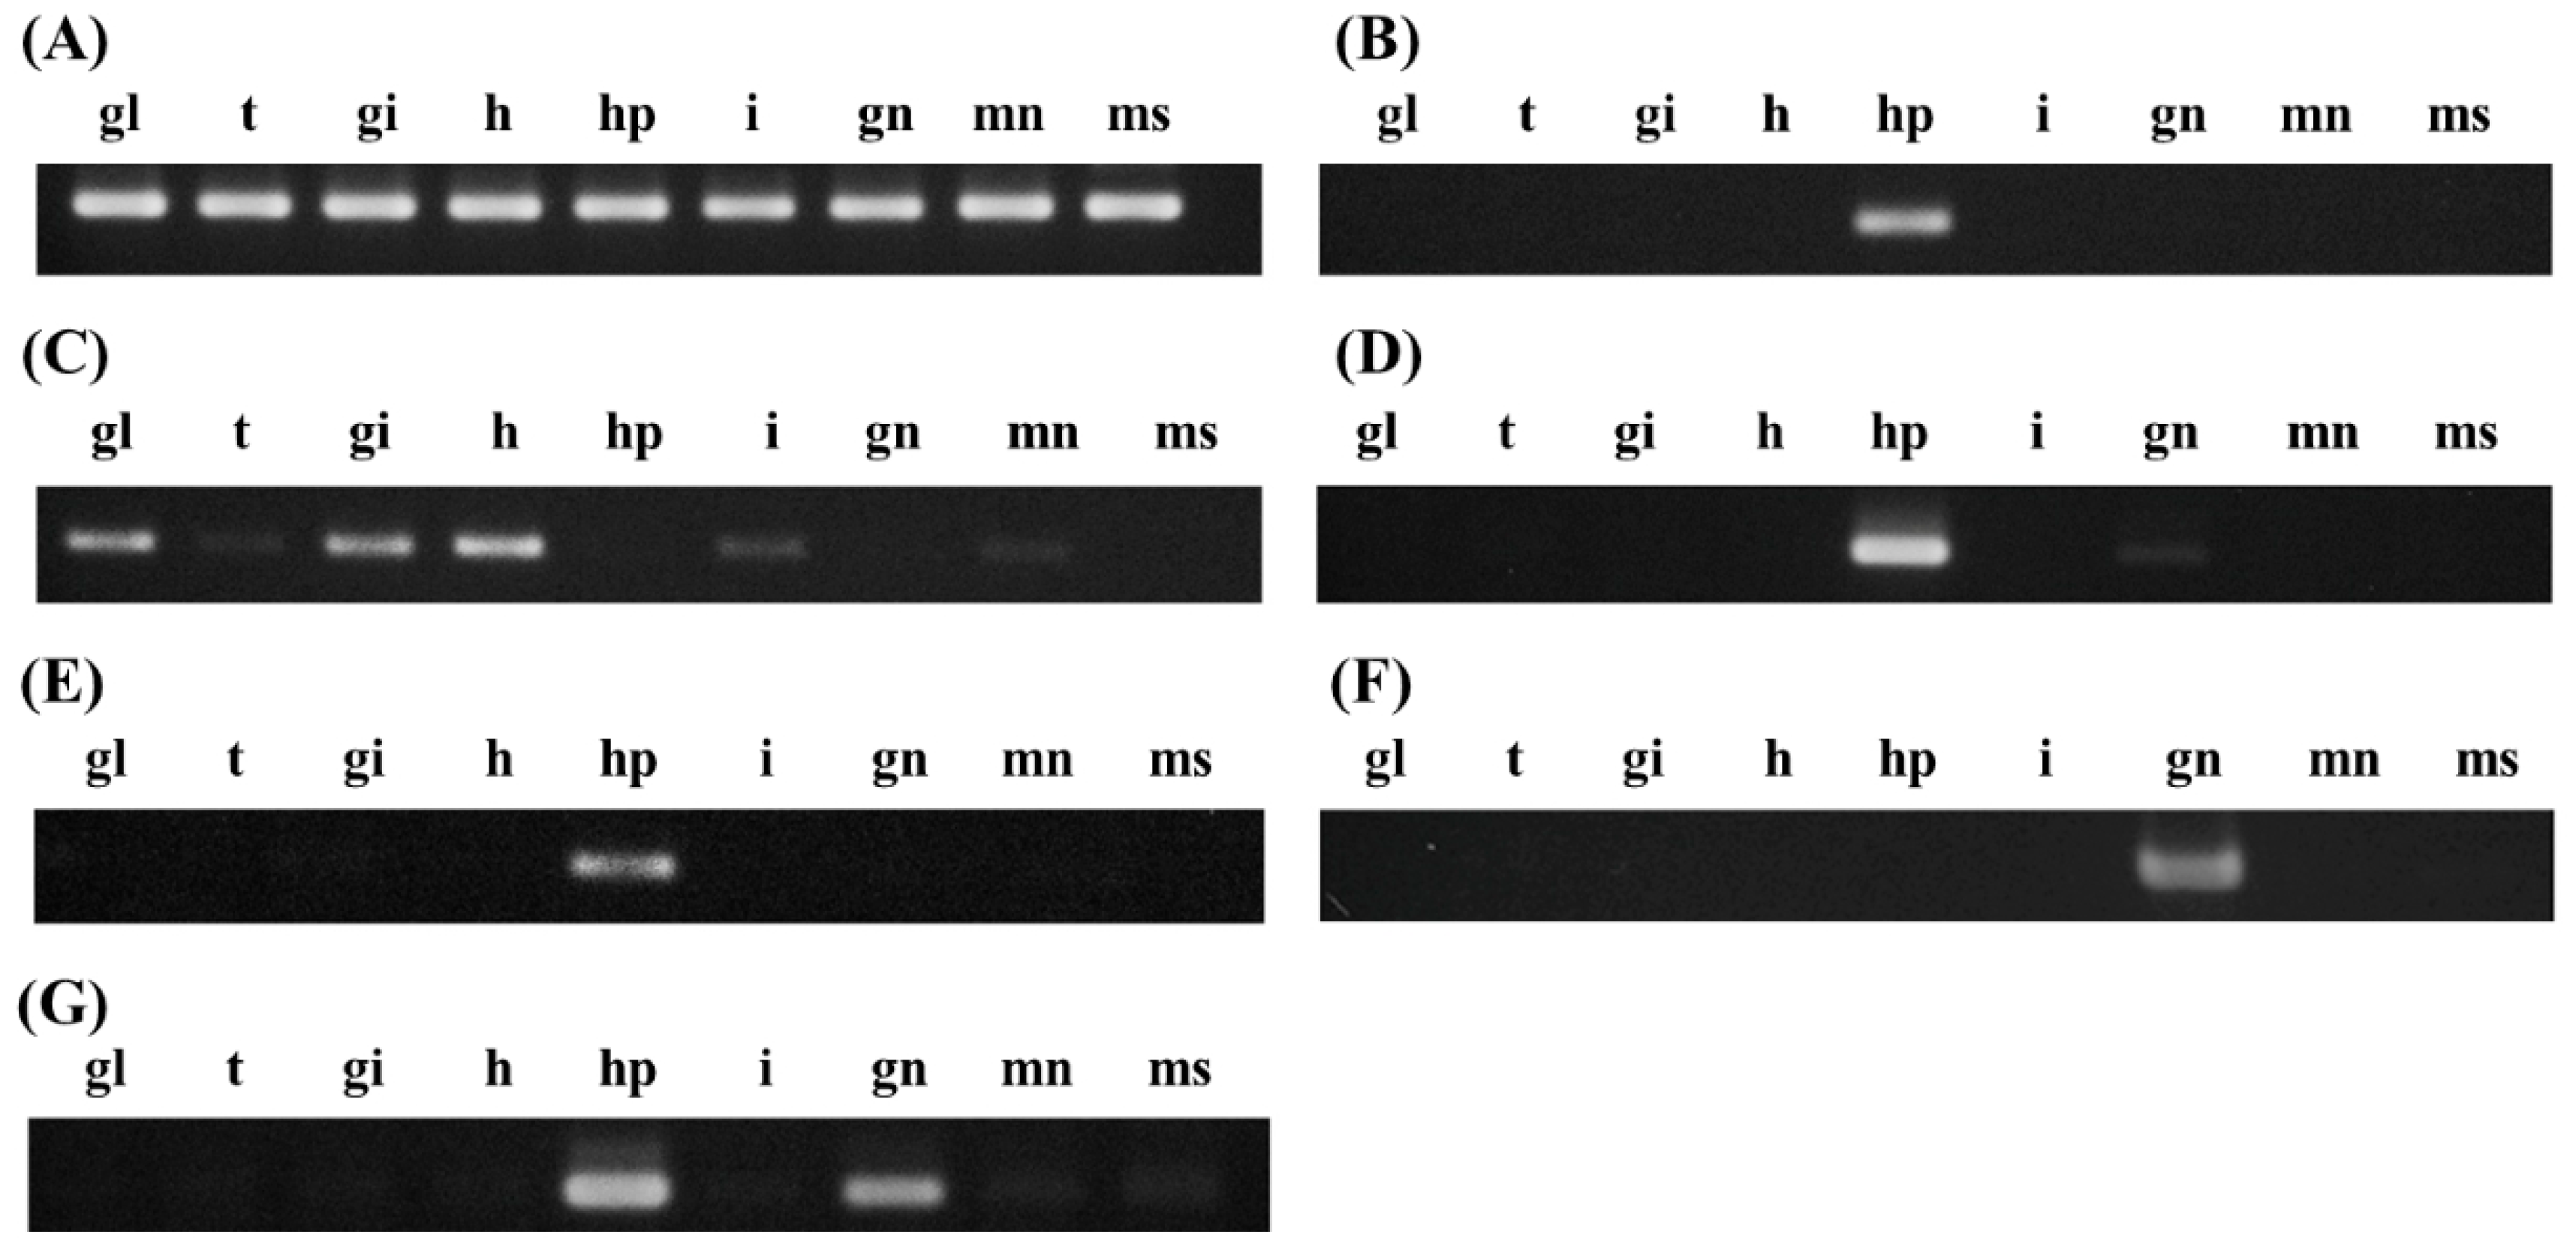
2.4. Tissue-Specific Expression

To examine tissue-specific expression profiles, the ganglion, tentacle, gill, heart, hepatopancreas, intestine, gonad, mantle, and muscle were dissected from adult H. discus hannai. RNA isolated from each tissue was used for cDNA synthesis using oligo-dT primers, as described above (Figure 3). While the Tsc2, Tsc8, and Tsc20 transcripts were expressed mainly in the hepatopancreas, Tsc35 was expressed at high levels in the hepatopancreas and gonad. Tsc5 was expressed mainly in the ganglion, gill, and heart and at a low level in the tentacle, intestine, and mantle. The predominant expression in the hepatopancreas suggests involvement of this organ in production or secretion of growth-related peptides and induction of somatic growth by stimulating various tissues. In particular, Tsc34 expression was detected only in gonads (Figure 3F) and differed according to its gender (Figure 4, see below). The latter finding is consistent with a previous report of ZP4 expression in growing oocytes [21,22]. To verify female-specific expression, gonads were isolated from sexually matured abalones, which were readily identifiable by eye and microscopy. RT-PCR amplification of cDNA templates prepared from at least three male and eight female abalones indicated that Tsc34 was expressed in female, but not in male, gonads (Figure 4). This female-specific expression profile of Tsc34 may explain the absence of its expression in some large male abalones (L3 in Figure 2), as no distinction between sexes was made, which resulted in a mixed population analyzed in the experiment. Absence of Tsc34 in small abalones might result from an immature development of gonads in a small size group of 200 dpf abalones.
Figure 3. Tissue-specific distribution of transcripts whose differential expression was associated with the growth of Pacific abalone. RT-PCR was carried out using primers specific for ribosomal protein L3 (Tsc1, A); and differentially-expressed candidate genes encoding transcripts similar to incilarin A (Tsc2, B); perlucin (Tsc5, C); transforming growth factor-β-induced protein ig-h3 (Tsc8, D); tomoregulin-2 (Tsc20, E); vitelline envelope zona pellucida domain 4 (Tsc34, F); and defensin (Tsc35, G). Total RNAs isolated from ganglion (gl), tentacle (t), gill (gi), heart (h), hepatopancreas (hp), intestine (i), gonad (gn), mantle (mn), and muscle (ms) were used for cDNA synthesis, followed by PCR amplification.
Ijms 16 26042 g003
Figure 4. Female-specific expression of Tsc34, which encodes vitelline envelope zona pellucida domain 4. Total RNAs were isolated from gonads of fully grown abalones that exhibited eight female (F1–F8) and three male (M1–M3) gonads. RT-PCR was carried out using cDNA templates and primers specific for ribosomal protein L3 (Tsc1), and vitelline envelope zona pellucida domain 4 (Tsc34). Sizes of molecular weight (kb) markers are indicated.
Ijms 16 26042 g004

2.5. Functional Implications

Tsc2 showed 11.4-fold (RNAseq) to 30-fold (RT-PCR) higher expression in the large compared to the small groups (Table 3). Sequence analysis of Tsc2 indicated similarity to incilarin A (UniProt ID: B6RB57) and C-type lectin (CTLs) (UniProt ID: G8XSQ0). Carbohydrate recognition domains in CTLs facilitate pathogen recognition by specifically binding to cell-wall carbohydrates in a Ca2+-dependent manner [23]. Recombinant CTLs cloned from the family Haliotidae showed a high binding affinity to Gram-negative bacterial pathogens [24,25]. Invertebrates rely mainly on innate immunity as they lack a complete adaptive immune system; therefore, CTLs in molluscans play important roles in recognition of invading pathogens [26]. CTLs from shrimp were reported to be expressed mostly in the hepatopancreas following bacterial challenge, suggesting that pathogen infection triggers production of hepatopancreas-specific CTLs for host defense [27,28,29,30,31,32]. A recent study of pearl oyster demonstrated a directly proportional relationship between lectin gene expression and oyster growth using RNAseq and qRT-PCR [14]. Therefore, Tsc2 may contribute to abalone growth by a mechanism similar to that of lectin and may also play a role in Ca-mediated cellular processes.
Tsc5 expression was 4–7-fold (RNAseq analysis) and 3-fold (RT-PCR) higher in the larger size group depending on the analysis. The sequence of Tsc5 showed marked similarity to that of Haliotis laevigata perlucin (UniProt ID: P82596), which plays a vital role in shell formation by accelerating CaCO3 precipitation and biomineralization [33]. Perlucin contains a Gln-Pro-Asp (QPD) sequence, i.e., a conserved carbohydrate-binding motif, in the carbohydrate recognition domain [34,35]. Tsc5 was expressed mainly in the ganglion, gill, and heart, and at a low level in the tentacle, intestine, and mantle. Enzymes involved in calcium-mediated biomineralization processes have been reported to be expressed at high levels in the gill, mantle, and hemolymph of Pinctada margaritifera [36]. In the freshwater pearl mussel Hyriopsis cumingi, perlucin was expressed primarily in the mantle, adductor, gill, and hemocytes, which are the main compartments participating in calcium metabolism and shell formation [37]. This result is consistent with the notion that growth is strongly dependent on the levels of calcium ions, as these are important for shell formation in mollusks. Therefore, Tsc5 may play a vital role in abalone growth by accelerating the calcium-dependent processes involved in shell formation and growth.
The expression of Tsc8, which encodes a transcript similar to the transforming growth factor-beta-induced protein (TGFBIP) ig-h3, was up to 4.6-fold (RNAseq analysis) in large abalones. Similar tendencies of up-regulation (~20-fold) was also shown in RT-PCR analysis. TGFBIP is an extracellular matrix protein that binds to collagens and is involved in cell adhesion and endochondrial bone formation in cartilage to cancers. It is also an extracellular component of developing ligaments, aorta, lung and kidney, mature cornea, skin, bladder, blood, and bone of animals. TGFBIp expression was detected primarily in the corneal epithelial cells. The association of Tsc8 with the stroma during development and wound healing suggests its possible involvement in animal growth.
Tsc20 encodes a gene similar to that encoding tomoregulin-2, a transmembrane protein expressed predominantly in the brain of mammals. Expression analysis showed up to 14.5-fold (RNAseq) and 8.2-fold (RT-PCR) down regulation of Tsc20 in large abalone. The presence of modules involved in binding to TGF-β-related growth factor, an EGF-like domain, and a cytoplasmic domain containing a potential G-protein–activating motif in tomoregulin suggest its involvement in cellular signaling cascades that lead to growth promotion. The protein appears to promote survival of hippocampal and mesencephalic neurons in primary culture [38]. It has also been suggested as being involved in tissue growth and repair in the central nervous system, and its expression was up-regulated under conditions that promoted the reinitiation of primary dendrites on mature cortical neurons [39] during androgen-independent growth of prostate cancer [40]. These findings suggest a role for Tsc20 in the growth of abalone.
Tsc34 encodes a gene similar to vitelline envelope zona pellucida domain 4 of the California red abalone (Haliotis rufescens) (UniProt ID: A0MCN4), which is a major component of the extracellular coating of abalone eggs [41]. Our RNAseq analysis showed marked Tsc34 expression in large-size abalones, whereas no expression was detected in small-size abalones. This expression pattern was confirmed by the RT-PCR results. The proportion of Tsc34-expressing individuals was higher in the large-size group than the small-size group, and it was found to be expressed specifically in females. Therefore, Tsc34 may represent not only a useful marker for evaluation of abalone growth rates and sex determination but also enables determination of differences in growth rates between male and female abalones.
The sequence of Tsc35 showed similarity to that of defensin (UniProt ID: D3UAH2), and harbored six conserved cysteine domains [42,43]. The expression of Tsc35 was up-regulated ranging from 4.6-fold to 15-fold in RNAseq and RT-PCR analyses, respectively, in large-size abalones. The innate immune system of invertebrates is vital for defense against pathogen invasion because of their lack of adaptive immunity. Defensins consisting of 3–6 kDa cationic peptides are classified as small antimicrobial proteins (AMPs), and are important for host defense [44,45]. Defensin was expressed in the hepatopancreas and gonads; its expression in the hepatopancreas is similar to a previous report [46]. Therefore, Tsc35 together with Tsc2 may increase the growth rate of abalones by enhancing their immunity.

3. Experimental Section

3.1. Materials

Pacific abalones, H. discus hannai, were collected from the Genetics and Breeding Research Center of the National Fisheries Research and Development Institute (NFRDI, Geoje, Korea) and from the Abalone Research Institute of Jeolla Namdo Marine-Fisheries and Development Institute (MFDI, Wando, Korea). Rearing of abalones was carried out as described [47]. For gender-specific experiments, abalones older than one year with fully sexually matured gonads were obtained from a regional NamChun Mart (Busan, Korea). Total RNA isolation kits and reagents, including RiboEX™ and Hybrid-R™ columns, were obtained from GeneAll (Seoul, Korea). RNASeq and transcriptome analyses were carried out by Insilicogen Inc. (Suwon, Korea). RNase-free DNaseI was obtained from Roche (Indianapolis, IN, USA). 5XHiQ-PCR reaction mixture and oligonucleotide primers were obtained from GenoTech Corp (Daejeon, Korea), and RNase inhibitor and Moloney Murine Leukemia Virus Reverse Transcriptase (M-MLV) cDNA synthesis kits were obtained from Enzynomics (Daejeon, Korea).

3.2. RNA Isolation

Pacific abalones H. discus hannai were grown to 200 dpf under the facilities at NFRDI and MFDI as described above. Total of 80 abalones were collected from the batch of abalone grown under the same growth condition and, upon size measurements, divided into three groups according to size. Soft tissues were isolated from representative abalones randomly selected from each group and immediately frozen in liquid nitrogen and stored at −80 °C. For RNA isolation, soft tissue (~0.1 g) from each organism was homogenized in 1 mL of RiboEX™ (GeneAll) in a glass homogenizer vessel. Upon addition of 200 μL chloroform followed by centrifugation at 12,000× g at 4 °C for 5 min, 500 μL of the aqueous phase was mixed with the same volume of isopropanol. Following centrifugation at 12,000× g for 5 min, the pellet was washed with 75% ethanol, dried, and then treated with RNase-free DNase I for 20 min at 37 °C [48]. RNA was purified using a Hybrid-R™ column (GeneAll) according to the protocol provided by the manufacturer. RNA quality was assessed by agarose gel electrophoresis and a Micro-volume Nucleic Acid Spectrophotometer (ASP-2680, ver. 4.1, ACTGene Inc., Piscataway, NJ, USA).

3.3. Transcriptome Library Construction and Analysis of Differentially-Expressed Genes

RNAseq analysis was carried out according to the manufacturer’s protocol (Insilicogen Inc.). The procedure involves poly A+ RNA isolation using the Truseq RNA Sample Prep Kit (Illumina, San Diego, CA, USA), cDNA synthesis using random primers, Truseq adaptor addition to phosphorylated cDNA, and sequencing analysis by Illumina HiSeq 2000 (Illumina, San Diego, CA, USA). De novo transcript assembly of raw sequences was performed using the CLC Assembly Cell Package (ver. 4.2.0; CLCBio, Arhaus, Denmark) and CLC_mapper (CLC Assembly Cell). Sequence annotation and mapping were conducted using BLASTx based on the information in the UniProt Metazoa database with a threshold E-value of 1.00 × 10⁻⁵, followed by functional annotation of reference contigs and differentially-expressed genes using the Gene Ontology and Kyoto Encyclopedia of Genes and Genomes databases. Transcript levels were quantified using the reads per kilobase per million reads (RPKM) method [19], with a threshold criterion for differential expression of >0.3 RPKM [16]. Fold changes in expression and p-values (Audic and Clavarie’s method) were calculated by comparison of RPKM values. Based on the false-discovery rate (FDR) value obtained using the Benjamini-Hochberg method [49], differentially expressed genes with fold-change values >2 (FDR ≤ 0.05), >4 (FDR ≤ 0.01), and >10 (FDR ≤ 0.001) were enumerated.

3.4. RT-PCR

RNA was extracted from soft tissues of abalones (n ≥ 8) using TRI Reagent (Sigma, St. Louis, MO, USA) followed by the Hybrid-R™ Kit (GeneAll), as described above. First-strand cDNA was synthesized in a 20 μL reaction containing 1 μg total RNA and 0.5 μM dT15 using a 1 × M-MLV cDNA synthesis kit, and 20 units of RNase Inhibitor (Enzynomics). PCR was carried out in 20 μL reactions containing cDNA templates and 1 μM target-specific primers in HiQ-PCR Mix (GenoTech Corp.). PCR conditions consisted of an initial denaturation at 95 °C for 3 min, followed by 30 cycles of denaturation at 95 °C for 30 s, annealing for 30 s at the optimum temperature for each primer pair, and extension at 72 °C for 30 s (Bio-Rad Thermal Cycler T1000, Hercules, CA, USA), and a final extension for 5 min at 72 °C. As an internal positive control, ribosomal protein L3 was amplified in 28 cycles consisting of denaturation at 95 °C for 30 s, annealing at 55 °C for 30 s, and extension at 72 °C for 30 s. To evaluate the tissue-specific expression of the selected genes, the ganglion, tentacle, gill, heart, hepatopancreas, intestine, gonad, mantle, and muscle were dissected from adult Haliotis discus hannai. RNA isolated was used for cDNA synthesis using oligo-dT primers followed by RT-PCR, as described above.

3.5. Transcript Analysis and Statistics

PCR products were resolved by 2% agarose gel electrophoresis followed by staining with ethidium bromide. Amplified products were quantified using a Gel Doc System/Station (Bio-Rad) with background subtraction. Data are shown as means ± SD. Mann-Whitney U statistic was used to compare differences between the small and large groups using a probability of p < 0.05 as the criterion for statistical significance. Data analysis including Mann-Whitney statistic was carried out by using Statistical Package for the Social Science (SPSS) software (ver. 21; IBM SPSS Inc., Armonk, NY, USA) and SigmaPlot (Systat Software, SanJose, CA, USA). The confidence interval was calculated based on sample size, sample observed mean, and standard deviation.

4. Conclusions

A transcriptome analysis of the Pacific abalone, H. discus hannai, was performed with the aim of identifying genes associated with high growth rates, followed by molecular function, and biological process analyses. Based on transcriptome and RT-PCR analyses, a total of six differentially-expressed genes associated with high growth rates was identified in this study. The genes encoding incilarin A, perlucin, transforming growth factor-beta-induced protein ig-h3, tomoregulin-2, vitelline envelope zona pellucida domain 4, and defensin were up-regulated, while that encoding tomoregulin was down-regulated, in abalones of large size. This study provides information that will increase our understanding of the mechanisms associated with the growth of Pacific abalone and will facilitate development of molecular markers for a high-growth-rate Pacific abalone strain for the aquaculture industry.

Acknowledgments

We would like to express our thanks to DoYeon Rho, Bok-Ki Choi for their technical help and Prof. Maeng-Seok Noh, Dept of Statistics, PuKyong National University, for his help on statistical analysis. We would like to express our thanks to Chul-Ji Park (National Fisheries Research and Development Institute for providing abalone samples for analysis. This work was supported by PuKyong National University Research Fund (PK-2012-CD20120560). Mi-Jin Choi, Gun-Do Kim, and Han Kyu Lim were supported by Golden Seed Project funded by Ministry of Ocean and Fisheries, Korea.

Author Contributions

Mi-Jin Choi carried out experiments and drafted the manuscript. Gun-Do Kim contributed to design the experiment and data analysis. Jong-Myoung Kim and Han Kyu Lim contributed to experimental design, sample preparation, data analysis, and manuscript preparation. All authors read and approved the final manuscript.

Conflicts of Interest

The authors declare no conflict of interest.

References

  1. Gordon, H.R.; Cook, P.A. World abalone fisheries and aquaculture update: Supply and market dynamics. J. Shellfish Res. 2004, 23, 935–939. [Google Scholar]
  2. Park, C.J.; Kim, S.Y. Abalone aquaculture in Korea. J. Shellfish Res. 2013, 32, 17–19. [Google Scholar] [CrossRef]
  3. Ock, Y.S. The research on the development procedure and current problems of the Korean abalone industry. J. Fish. Bus. Adm. 2013, 44, 15–28. [Google Scholar] [CrossRef]
  4. Lopez, L.M.; Tyler, P.; Viana, M.T. The effect of temperature and artificial diets on growth rates of juvenile Haliotis tuberculata (Linnaeus, 1758). J. Shellfish Res. 1998, 17, 657–662. [Google Scholar]
  5. Nelson, M.M.; Leighton, D.L.; Phleger, C.F.; Nichols, P.D. Comparison of growth and lipid composition in the green abalone, Haliotis fulgens, provided specific macroalgal diets. Comp. Biochem. Physiol. B 2002, 131, 695–712. [Google Scholar] [CrossRef]
  6. Symonds, J.E.; Moss, G.; Jopson, N.B.; Roberts, R.; Birss, J.; Heath, P.; Walker, S.P.; Anderson, R.M.; McEwan, K.M.; Amer, P.R. Family-based selective breeding of New Zealand abalone, Haliotis iris: Challenges and opportunities. Proc. N. Z. Soc. Anim. 2012, 72, 216–221. [Google Scholar]
  7. You, W.W.; Ke, C.H.; Luo, X.; Wang, D.X. Growth and survival of three small abalone Haliotis diversicolor populations and their reciprocal crosses. Aquac. Res. 2009, 40, 1474–1480. [Google Scholar] [CrossRef]
  8. Lucas, T.; Macbeth, M.; Degnan, S.M.; Knibb, W.; Degnan, B.M. Heritability estimates for growth in the tropical abalone Haliotis asinina using microsatellites to assign parentage. Aquaculture 2006, 259, 146–152. [Google Scholar] [CrossRef]
  9. Baranski, M.; Rourke, M.; Loughnan, S.; Hayes, B.; Austin, C.; Robinson, N. Detection of QTL for growth rate in the blacklip abalone (Haliotis rubra Leach) using selective DNA pooling. Anim. Genet. 2008, 39, 606–614. [Google Scholar] [CrossRef] [PubMed]
  10. Liu, X.; Liu, X.; Zhang, G. Identification of quantitative trait loci for growth-related traits in the Pacific abalone Haliotis discus hannai Ino. Aquac. Res. 2007, 38, 789–797. [Google Scholar] [CrossRef]
  11. Chen, H.L.; Yang, H.S.; Huang, R.; Tsai, H.-J. Transfer of a foreign gene to Japanese abalone (Haliotis diversicolor supertexta) by direct testis-injection. Aquaculture 2006, 253, 249–258. [Google Scholar] [CrossRef]
  12. Hamano, K.; Awaji, M.; Usuki, H. cDNA structure of an insulin-related peptide in the Pacific oyster and seasonal changes in the gene expression. J. Endocrinol. 2005, 187, 55–67. [Google Scholar] [CrossRef] [PubMed]
  13. Geraerts, W.P.M.; Smit, A.B.; Li, K.W.; Hordijk, P.L. The Light Green Cells of Lymnaea: A neuroendocrine model system for stimulus-induced expression of multiple peptide genes in a single cell type. Experientia 1992, 48, 464–473. [Google Scholar] [CrossRef] [PubMed]
  14. Shi, Y.; He, M. Differential gene expression identified by RNA-Seq and qPCR in two sizes of pearl oyster (Pinctada fucata). Gene 2014, 538, 313–322. [Google Scholar] [CrossRef] [PubMed]
  15. Grada, A.; Weinbrecht, K. Next-generation sequencing: Methodology and application. J. Investig. Dermatol. 2013, 133, e11. [Google Scholar] [CrossRef] [PubMed]
  16. Hegedus, Z.; Zakrzewska, A.; Agoston, V.C.; Ordas, A.; Rácz, P.; Mink, M.; Spaink, H.P.; Meijer, A.H. Deep sequencing of the zebrafish transcriptome response to mycobacterium infection. Mol. Immunol. 2009, 46, 2918–2930. [Google Scholar] [CrossRef] [PubMed]
  17. Gallardo-Escarate, C.; Valenzuela-Munoz, V.; Nunez-Acuna, G. RNA-Seq analysis using de novo transcriptome assembly as a reference for the Salmon Louse Caligus rogercresseyi. PLoS ONE 2014, 9, e92239. [Google Scholar] [CrossRef] [PubMed]
  18. Van der Merwe, M.; Franchini, P.; Roodt-Wilding, R. Differential growth-related gene expression in abalone. Mar. Biotechnol. 2011, 13, 1125–1139. [Google Scholar] [CrossRef] [PubMed]
  19. Mortazavi, A.; Williams, B.A.; McCue, K.; Schaeffer, L.; Wold, B. Mapping and quantifying mammalian transcriptomes by RNA-Seq. Nat. Methods 2008, 7, 621–628. [Google Scholar] [CrossRef] [PubMed]
  20. Ramskold, D.; Wang, E.T.; Burge, C.B.; Sandberg, R. An abundance of ubiquitously expressed genes revealed by tissue transcriptome sequence data. PLoS Comp. Biol. 2009, 5, e1000598. [Google Scholar] [CrossRef] [PubMed]
  21. Lira, S.A.; Kinloch, R.A.; Mortillo, S.; Wassarman, P.M. An upstream region of the mouse ZP3 gene directs expression of firefly luciferase specifically to growing oocytes in transgenic mice. Proc. Natl. Acad. Sci. USA 1990, 87, 7215–7219. [Google Scholar] [CrossRef] [PubMed]
  22. Akatsuka, K.; Yoshida-Komiya, H.; Tulsiani, D.R.P.; Orgebin-Crist, M.-C.; Hiroi, M.; Araki, Y. Rat zona pellucida glycoproteins: Molecular cloning and characterization of the three major components. Mol. Reprod. Dev. 1998, 51, 454–467. [Google Scholar] [CrossRef]
  23. Drickamer, K. C-type lectin-like domains. Curr. Opin. Struct. Biol. 1999, 9, 585–590. [Google Scholar] [CrossRef]
  24. Wang, N.; Whang, I.; Lee, J. A novel C-type lectin from abalone, Haliotis discus discus, agglutinates Vibrio alginolyticus. Dev. Comp. Immunol. 2008, 32, 1034–1040. [Google Scholar] [CrossRef] [PubMed]
  25. Zhang, J.; Qiu, R.; Hu, Y.H. HdhCTL1 is a novel C-type lectin of abalone Haliotis discus hannai that agglutinates Gram-negative bacterial pathogens. Fish Shellfish Immunol. 2014, 41, 466–472. [Google Scholar] [CrossRef] [PubMed]
  26. Wang, L.; Wang, L.; Huang, M.; Zhang, H.; Song, L. The immune role of C-type lectins in molluscs. Invertebr. Surv. J. 2011, 8, 241–246. [Google Scholar]
  27. Sun, Y.-D.; Fu, L.-D.; Jia, Y.-P.; Du, X.-J.; Wang, Q.; Wang, Y.-H.; Zhao, X.-F.; Yu, X.-Q.; Wang, J.-X. A hepatopancreas-specific C-type lectin from the Chinese shrimp Fenneropenaeus chinensis exhibits antimicrobial activity. Mol. Immunol. 2008, 45, 348–361. [Google Scholar] [CrossRef] [PubMed]
  28. Ma, T.H.; Benzie, J.A.H.; He, J.-G.; Chan, S.-M. PmLT, a C-type lectin specific to hepatopancreas is involved in the innate defense of the shrimp Penaeus monodon. J. Invertebr. Pathol. 2008, 99, 332–341. [Google Scholar] [PubMed]
  29. Zhao, Z.-Y.; Yin, Z.-X.; Xu, X.-P.; Weng, S.-P.; Rao, X.-Y.; dai, Z.-X.; Luo, Y.-W.; Yang, G.; Li, Z.-S.; Guan, H.-J.; et al. A novel C-type lectin from the shrimp Litopenaeus vannamei possesses anti-White Spot Syndrome Virus activity. J. Virol. 2009, 83, 347–356. [Google Scholar] [CrossRef] [PubMed]
  30. Zhang, X.-W.; Xu, W.-T.; Wang, X.-W.; Mu, Y.; Zhao, X.-F.; Yu, X.-Q.; Wang, J.-X. A novel C-type lectin with two CRD domains from Chinese shrimp Fenneropenaeus chinensis functions as a pattern recognition protein. Mol. Immunol. 2009, 46, 1626–1637. [Google Scholar] [CrossRef] [PubMed]
  31. Wang, X.-W.; Xu, W.-T.; Zhang, X.-W.; Zhao, X.-F.; Yu, X.-Q.; Wang, J.-X. A C-type lectin is involved in the innate immune response of Chinese white shrimp. Fish Shellfish Immunol. 2009, 27, 556–562. [Google Scholar] [CrossRef] [PubMed]
  32. Xu, W.-T.; Wang, X.-W.; Zhang, X.-W.; Zhao, X.-F.; Yu, X.-Q.; Wang, J.-X. A new C-type lectin (FcLec5) from the Chinese white shrimp Fenneropenaeus chinensis. Amino Acids 2010, 39, 1227–1239. [Google Scholar] [CrossRef] [PubMed]
  33. Weiss, I.M.; Kaufmann, S.; Mann, K.; Fritz, M. Purification and characterization of perlucin and perlustrin, two new proteins from the shell of the mollusc Haliotis laevigata. Biochem. Biophys. Res. Commun. 2000, 267, 17–21. [Google Scholar] [CrossRef] [PubMed]
  34. Weis, W.I.; Drickamer, K. Structural basis of lectin-carbohydrate recognition. Annu. Rev. Biochem. 1996, 65, 441–473. [Google Scholar] [CrossRef] [PubMed]
  35. Mann, K.; Weiss, I.M.; André, S.; Gabius, H.-J.; Fritz, M. The amino-acid sequence of the abalone (Haliotis laevigata) nacre protein perlucin. Detection of a functional C-type lectin domain with galactose/mannose specificity. Eur. J. Biochem. 2000, 267, 5257–5264. [Google Scholar] [CrossRef] [PubMed]
  36. Gardner, L.D.; Mills, D.; Wiegand, A.; Leavesley, D.; Elizur, A. Spatial analysis of biomineralization associated gene expression from the mantle organ of the pearl oyster Pinctada maxima. BMC Genom. 2011, 12, 455. [Google Scholar] [CrossRef] [PubMed] [Green Version]
  37. Lin, J.-Y.; Ma, K.-Y.; Bai, Z.-Y.; Li, J.-L. Molecular cloning and characterization of perlucin from the freshwater pearl mussel, Hyriopsis cumingii. Gene 2013, 526, 210–216. [Google Scholar] [CrossRef] [PubMed]
  38. Horie, M.; Mitsumoto, Y.; Kyushiki, H.; Kanemoto, N.; Watanabe, A.; Taniguchi, Y.; Nishino, N.; Okamoto, T.; Kondo, M.; Mori, T.; et al. Identification and characterization of TMEFF2, a novel survival factor for hippocampal and mesencephalic neurons. Genomics 2000, 67, 146–152. [Google Scholar] [CrossRef] [PubMed]
  39. Siegel, D.A.; Huang, M.K.; Becker, S.F. Ectopic dendrite initiation: CNS pathogenesis as a model of CNS development. Int. J. Dev. Neurosci. 2002, 20, 373–389. [Google Scholar] [CrossRef]
  40. Mohler, J.L.; Morris, T.L.; Ford, O.H., III; Alvey, R.F.; Sakamoto, C.; Gregory, C.W. Identification of differentially expressed genes associated with androgen-independent growth of prostate cancer. Prostate 2002, 51, 247–255. [Google Scholar] [CrossRef] [PubMed]
  41. Aagaard, J.E.; Yi, X.; MacCoss, M.J.; Swanson, W.J. Rapidly evolving zona pellucida domain proteins are a major component of the vitelline envelope of abalone eggs. Proc. Natl. Acad. Sci. USA 2006, 103, 17302–17307. [Google Scholar] [CrossRef] [PubMed]
  42. Froy, O.; Gurevitz, M. Arthropod and mollusk defensins—Evolution by exon-shuffling. Trends Genet. 2003, 19, 684–687. [Google Scholar] [CrossRef] [PubMed]
  43. De Zoysa, M.; Whang, I.; Lee, Y.; Lee, S.; Lee, J.-S.; Lee, J. Defensin from disk abalone Haliotis discus discus: Molecular cloning, sequence characterization and immune response against bacterial infection. Fish Shellfish Immunol. 2010, 28, 261–266. [Google Scholar] [CrossRef] [PubMed]
  44. Bals, R.; Goldman, M.J.; Wilson, J.M. Mouse beta-defensin 1 is a salt-sensitive antimicrobial peptide present in epithelia of the lung and urogenital tract. Infect. Immun. 1998, 66, 1225–1232. [Google Scholar] [PubMed]
  45. Selsted, M.E.; Ouellette, A.J. Mammalian defensins in the antimicrobial immune response. Nat. Immunol. 2005, 6, 551–557. [Google Scholar] [CrossRef] [PubMed]
  46. Hong, X.; Sun, X.; Zheng, M.; Qu, L.; Zan, J.; Zhang, J. Characterization of defensin gene from abalone (Haliotis discus hannai) and its deduced protein. Chin. J. Oceanol. Limnol. 2008, 26, 375–379. [Google Scholar] [CrossRef]
  47. Park, C.-J.; Lee, J.H.; Noh, J.K.; Kim, H.C.; Park, J.W.; Hwang, I.J.; Kim, S.Y. Growth of pacific abalone, Haliotis discus hannai, using selection breeding technique. Korean J. Malacol. 2012, 28, 343–347. [Google Scholar] [CrossRef]
  48. Noh, G.E.; Lim, H.K.; Kim, J.-M. Characterization of genes encoding prolactin and prolactin receptors in starry flounder Platichthys stellatus and their expression upon acclimation to freshwater. Fish Physiol. Biochem. 2013, 39, 263–275. [Google Scholar] [CrossRef] [PubMed]
  49. Benjamini, Y.; Hochberg, Y. Controlling the false discovery rate: A practical and powerful approach to multiple testing. J. R. Stat. Soc. B 1995, 57, 289–300. [Google Scholar]

