2.1. The Silkworm M3 Mutant Larvae Exhibits an Enhancement of JH Biosynthesis in the Second Instar
The silkworm
M3 strain is a dominant trimolting mutant. Compared with the WT larvae, which initiated metamorphosis in the fifth instar after four rounds of larval molting, the
M3 larvae underwent a precocious metamorphosis in the fourth instar, and the entire larval duration was shortened by approximately six days (
Figure 1A). Importantly, beginning with the second instar, the developmental progression of the
M3 and WT larvae revealed an obvious difference. The initiation of the second molting in the
M3 larvae occurred approximately 24 h later than in the WT larvae, and the duration of the third and the fourth instars in the
M3 larvae was also prolonged (
Figure 1A). Consequently, the body size and body weight of the
M3 larvae were greater than those of the WT larvae during the former four instars. Morphologically, at the 11
th day after hatching, the WT larvae had grown into the third larval molting, whereas the
M3 larvae remained at day two of the third larval instar (
Figure 1A), but their body size was bigger than that of the WT larvae (
Figure 1B). Statistically, the body weight of the
M3 larvae at the end of the fourth instar was almost equal to that of the WT larvae in the late fifth instar (
Figure 1C). Because an appropriate body weight is critical for initiating metamorphosis [
14,
15], we propose that the early attainment of the critical weight in the
M3 larvae may result in its precocious metamorphosis.
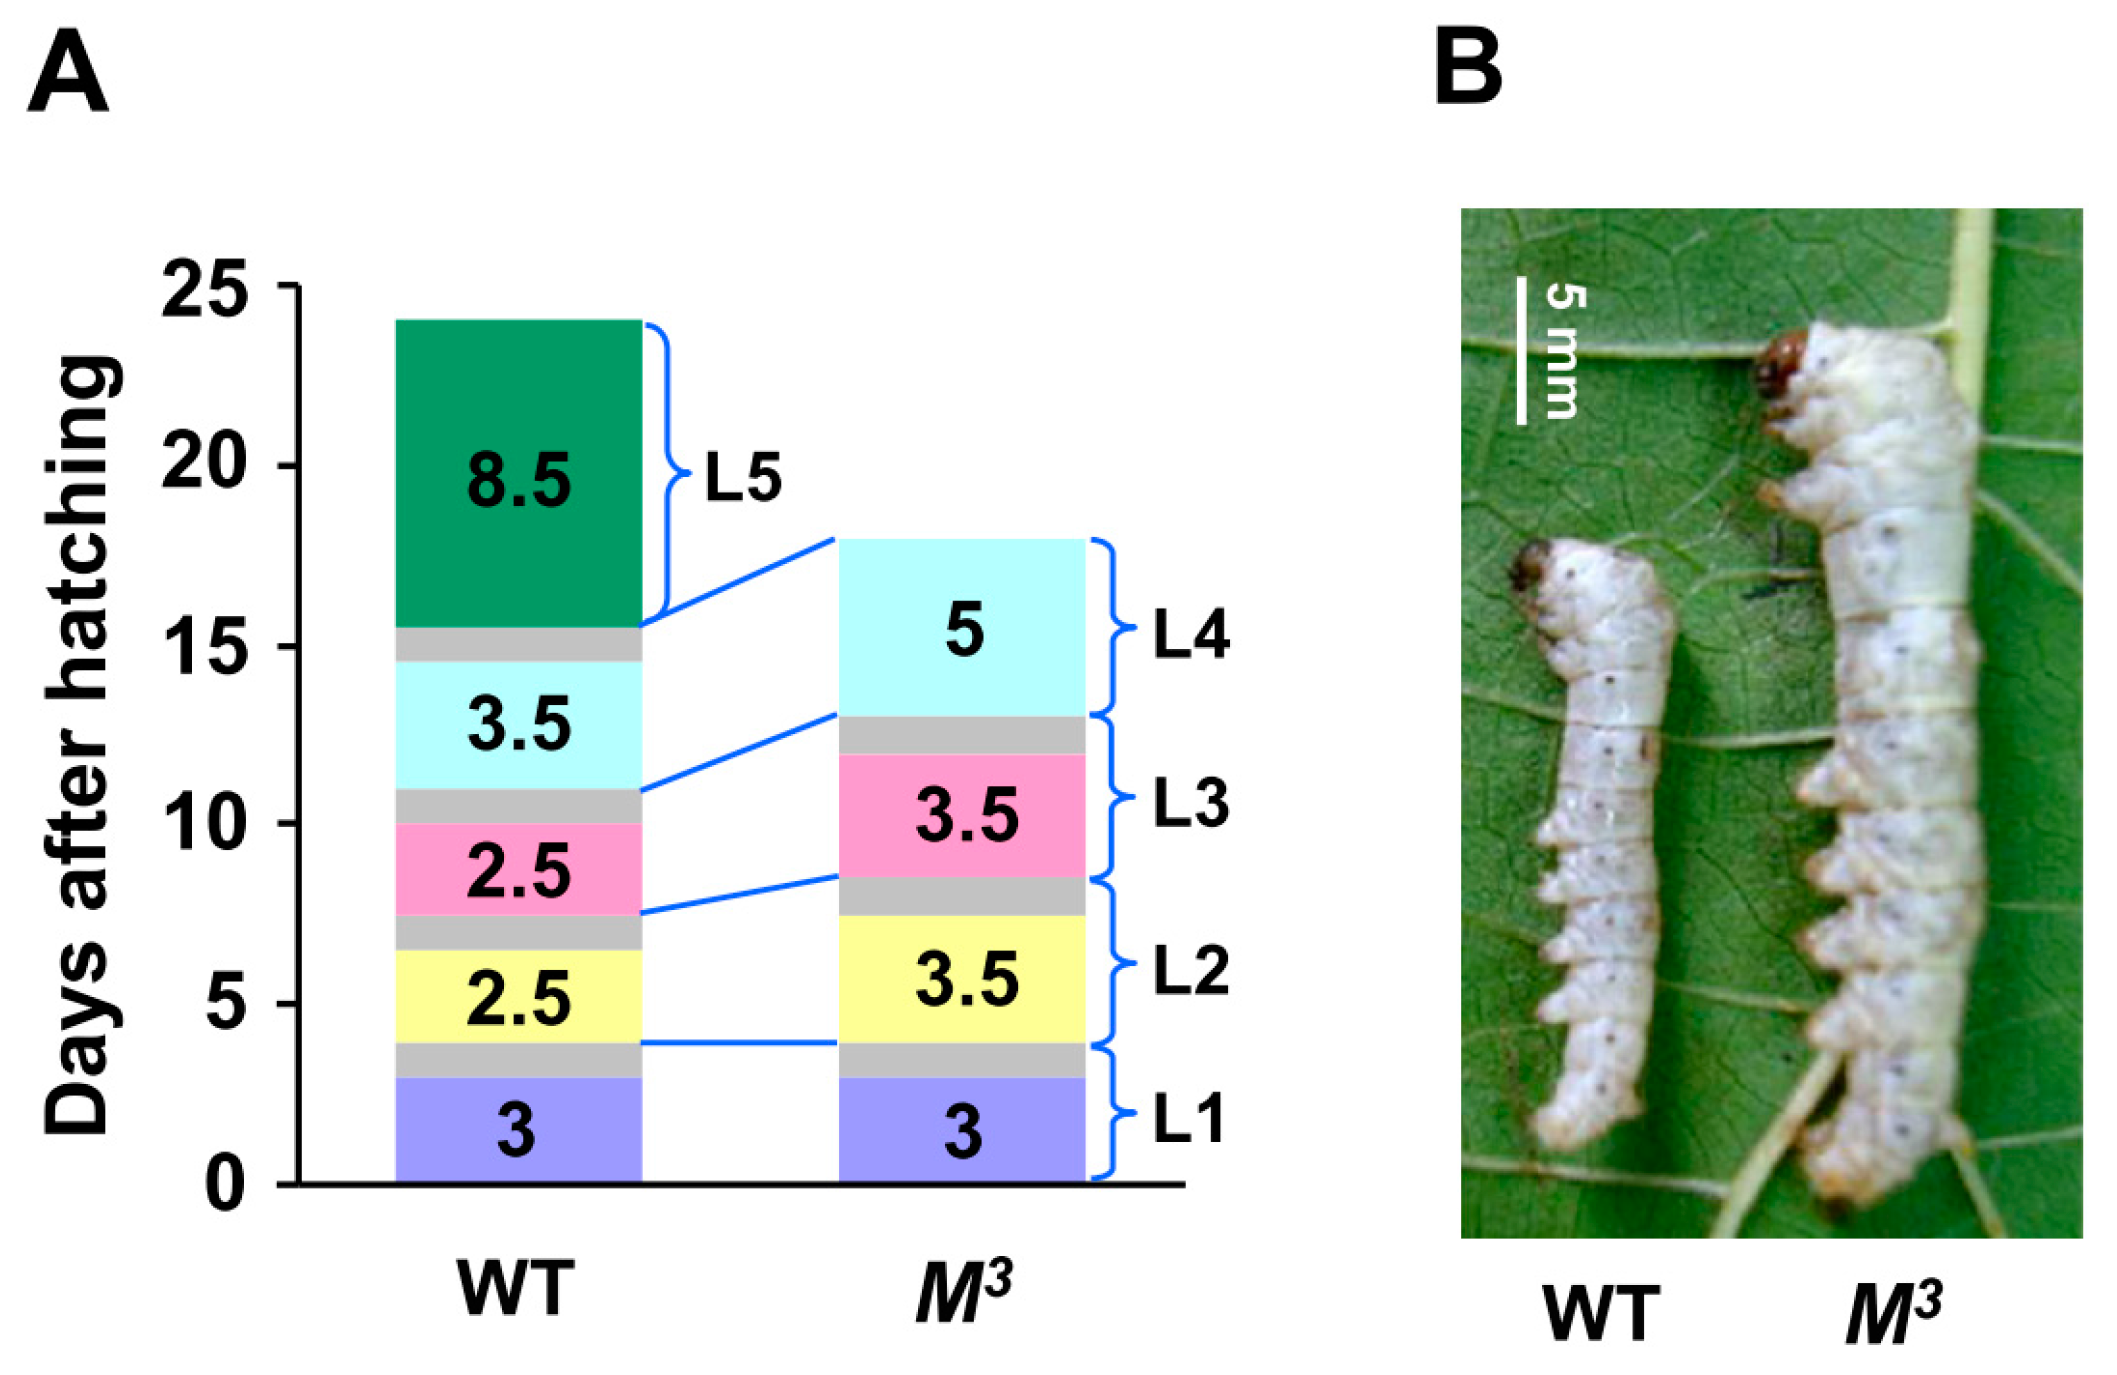
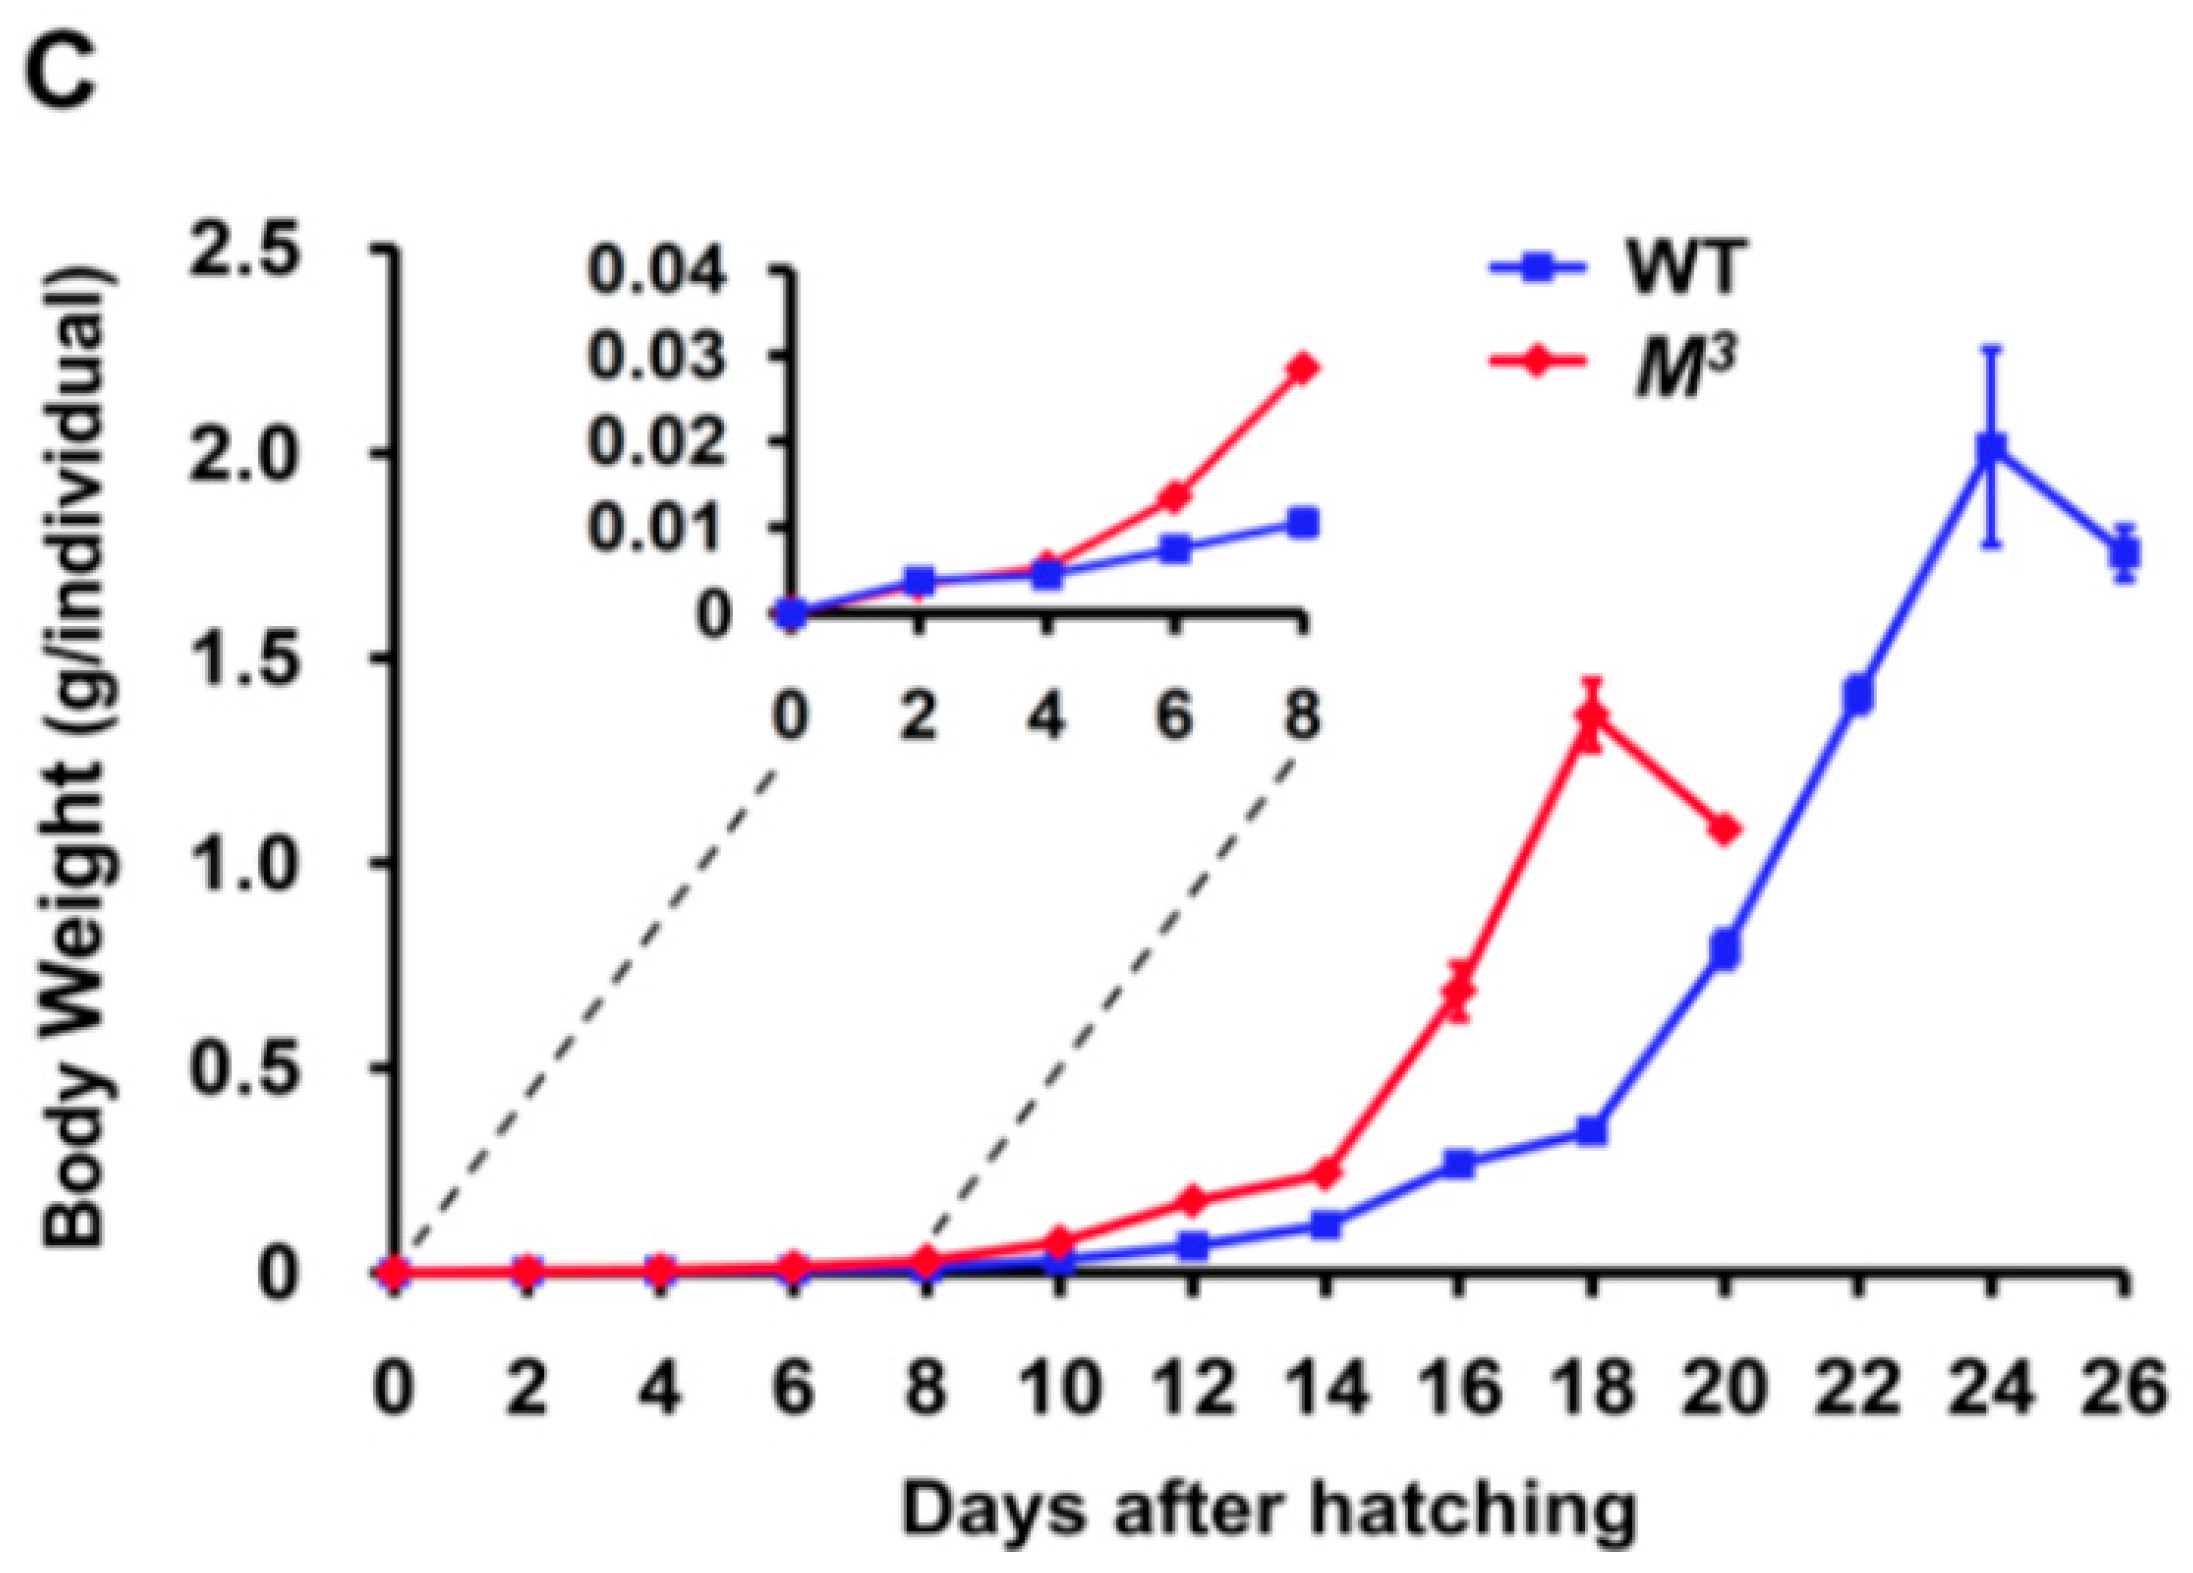
Figure 1.
Developmental phenotypes of the M3 mutant. (A) Precocious larval-pupal metamorphosis in the M3 mutant. The M3 larvae undergo only three molts. The feeding duration of the second and third instars is greater than that of the same instars in the WT larvae, and the entire larval period of the M3 mutant is six days shorter than that of WT. The gray areas denote the process of larval molting. L, larval instar; L1 to L5 respectively represents the first to the fifth larval instar; (B) Morphology of the M3 and WT larvae on the 11th day after hatching. The WT larvae have progressed into the third larval molting, but the M3 larvae remain at day two of the third larval instar, and their body size is bigger than that of the WT larvae; (C) Comparison of the body weights of the M3 and WT larvae. We randomly chose a certain number of both M3 and WT individuals every 48 h from the first day they were hatched and got the average body weight. Beginning with the second instar, the body weight of the M3 larvae increased faster than that of the WT larvae. Because of the lack of a larval instar, the final body weight of the M3 larvae was less than that of the WT larvae. The error bars represent the mean ± S.E. (n = 3).
![Ijms 16 25945 g001a]()
![Ijms 16 25945 g001b]()
Given that larval molting and metamorphosis in insects are controlled by JH and ecdysone [
7], we speculated that the precocious metamorphosis in the
M3 mutant was likely caused by a disruption of the biosynthesis or signaling of either JH or ecdysone. To test this hypothesis, we first compared the changes in the JH titers during the development of the
M3 and WT larvae. Gas chromatography-mass spectrometry (GC-MS) analysis revealed that the JH titers gradually decreased from the second to the last instar in both the
M3 and WT larvae, and it was high at the beginning of each instar, and then decreased to a low level (
Figure 2A,B). Intriguingly, we found that the absolute concentration of JH titer in the
M3 larvae was greater than that in the WT larvae in the second instar (
Figure 2A). In addition, a quantitative RT-PCR (qRT-PCR) assay demonstrated that in the integument, which is a target tissue of JH action, the expression of the
Krüppel homolog 1 (
Kr-h1) gene, which is transcriptionally regulated by JH and then involved in JH signaling [
16], was markedly higher in the
M3 larvae than in the WT larvae in the second instar (
Figure 2C). Moreover, the
Kr-h1 expression also decreased to very low levels in both the
M3 and WT larvae in the last instar (
Figure 2C). These expression profiles of
Kr-h1 in the integument are consistent with the typical developmental changes in the JH titers in both the
M3 and WT larvae (
Figure 2A,B), indicating that the phenotype of the
M3 mutant may be caused by the enhancement of JH biosynthesis in the second instar.
We further examined the biosynthesis and signaling of ecdysone in both the
M3 and WT larvae. Radioimmunoassay (RIA) data revealed that the developmental changes in the ecdysone titers were similar for the
M3 and WT larvae from the second instar to the final instar, and dramatically increased at the beginning of wandering (
Figure S1A,B). In addition, the expression of the ecdysone receptor (
EcR) gene involved in ecdysone signaling was increased to similar levels before each molting and at the beginning of wandering in the
M3 and WT larvae (
Figure S1C). Furthermore, the
EcR expression level exhibited no difference in the second instar between the
M3 and WT larvae (
Figure S1C), thereby suggesting that the ecdysone pathway is not closely linked to the
M3 mutant.
Figure 2.
JH concentration and developmental expression of the Kr-h1 gene in the M3 and WT larvae. (A) JH concentration in the whole bodies of the M3 and WT larvae during early instars. GC-MS analysis indicated that the JH titer in the whole body of the M3 mutant larvae was higher than that of the WT larvae in the second instar; (B) JH concentration in the hemolymph of the M3 and WT larvae during late instars. GC-MS analysis indicated that the JH titer in the hemolymph of either the M3 mutant or WT larvae were similarly decreased to low levels at the final instar; (C) Kr-h1 expression in the integument of the M3 and WT larvae. qRT-PCR analysis indicated that the expression level of the JH-responsive gene Kr-h1 was higher in the M3 larvae than in the WT larvae in the second instar, and Kr-h1 was expressed at very low levels in the final instar of both the M3 and WT larvae. L, larval instar; L2 to L5 respectively represents the second to the fifth larval instar; D, day; D0, initial day; D1 to D6 respectively represents the first to the sixth day of a larval instar; M, molting; W, wandering. The error bars represent the mean ± S.E. (n = 3).
![Ijms 16 25945 g002]()
2.2. JH Analogue Treatment Postpones Larval Molting and Induces Trimolting Phenotype
Because the enhancement of JH biosynthesis at the beginning of the second larval instar is closely linked to the silkworm
M3 mutant, we tested whether the treatment of JH analogue (JHA) methoprene on the newly molted second instar larvae of WT with four molts will result in developmental changes that are similar to the
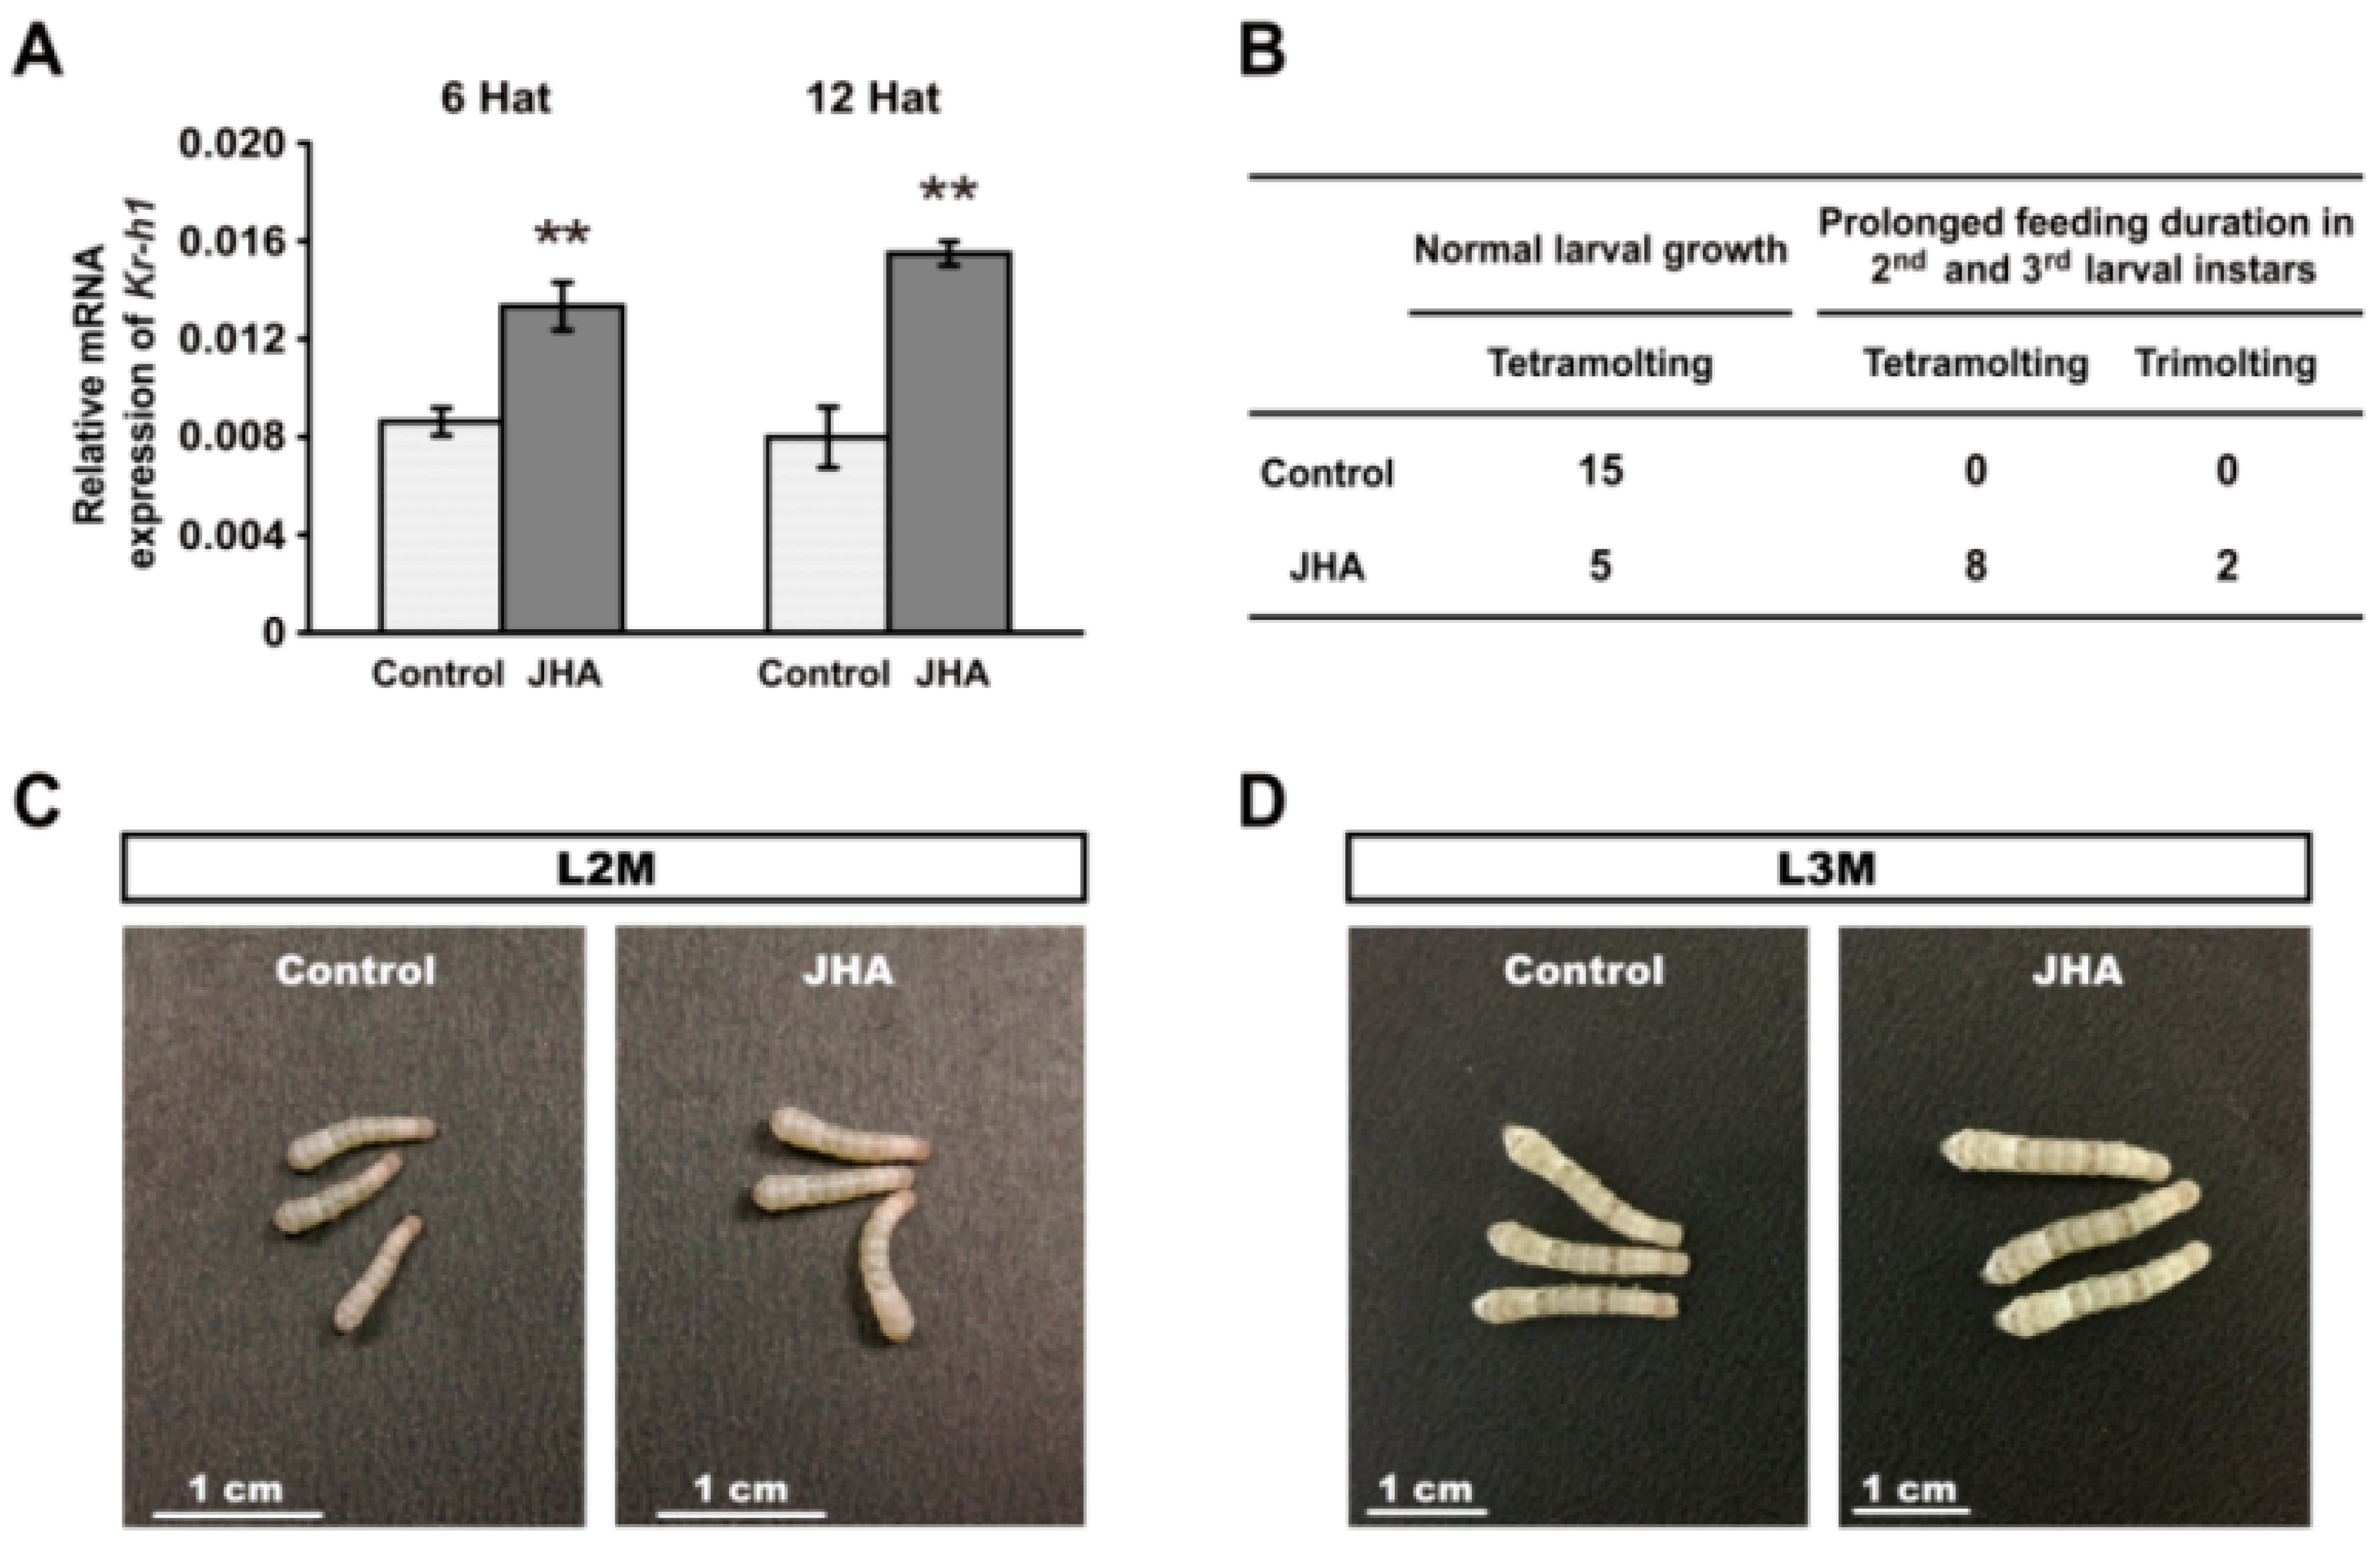
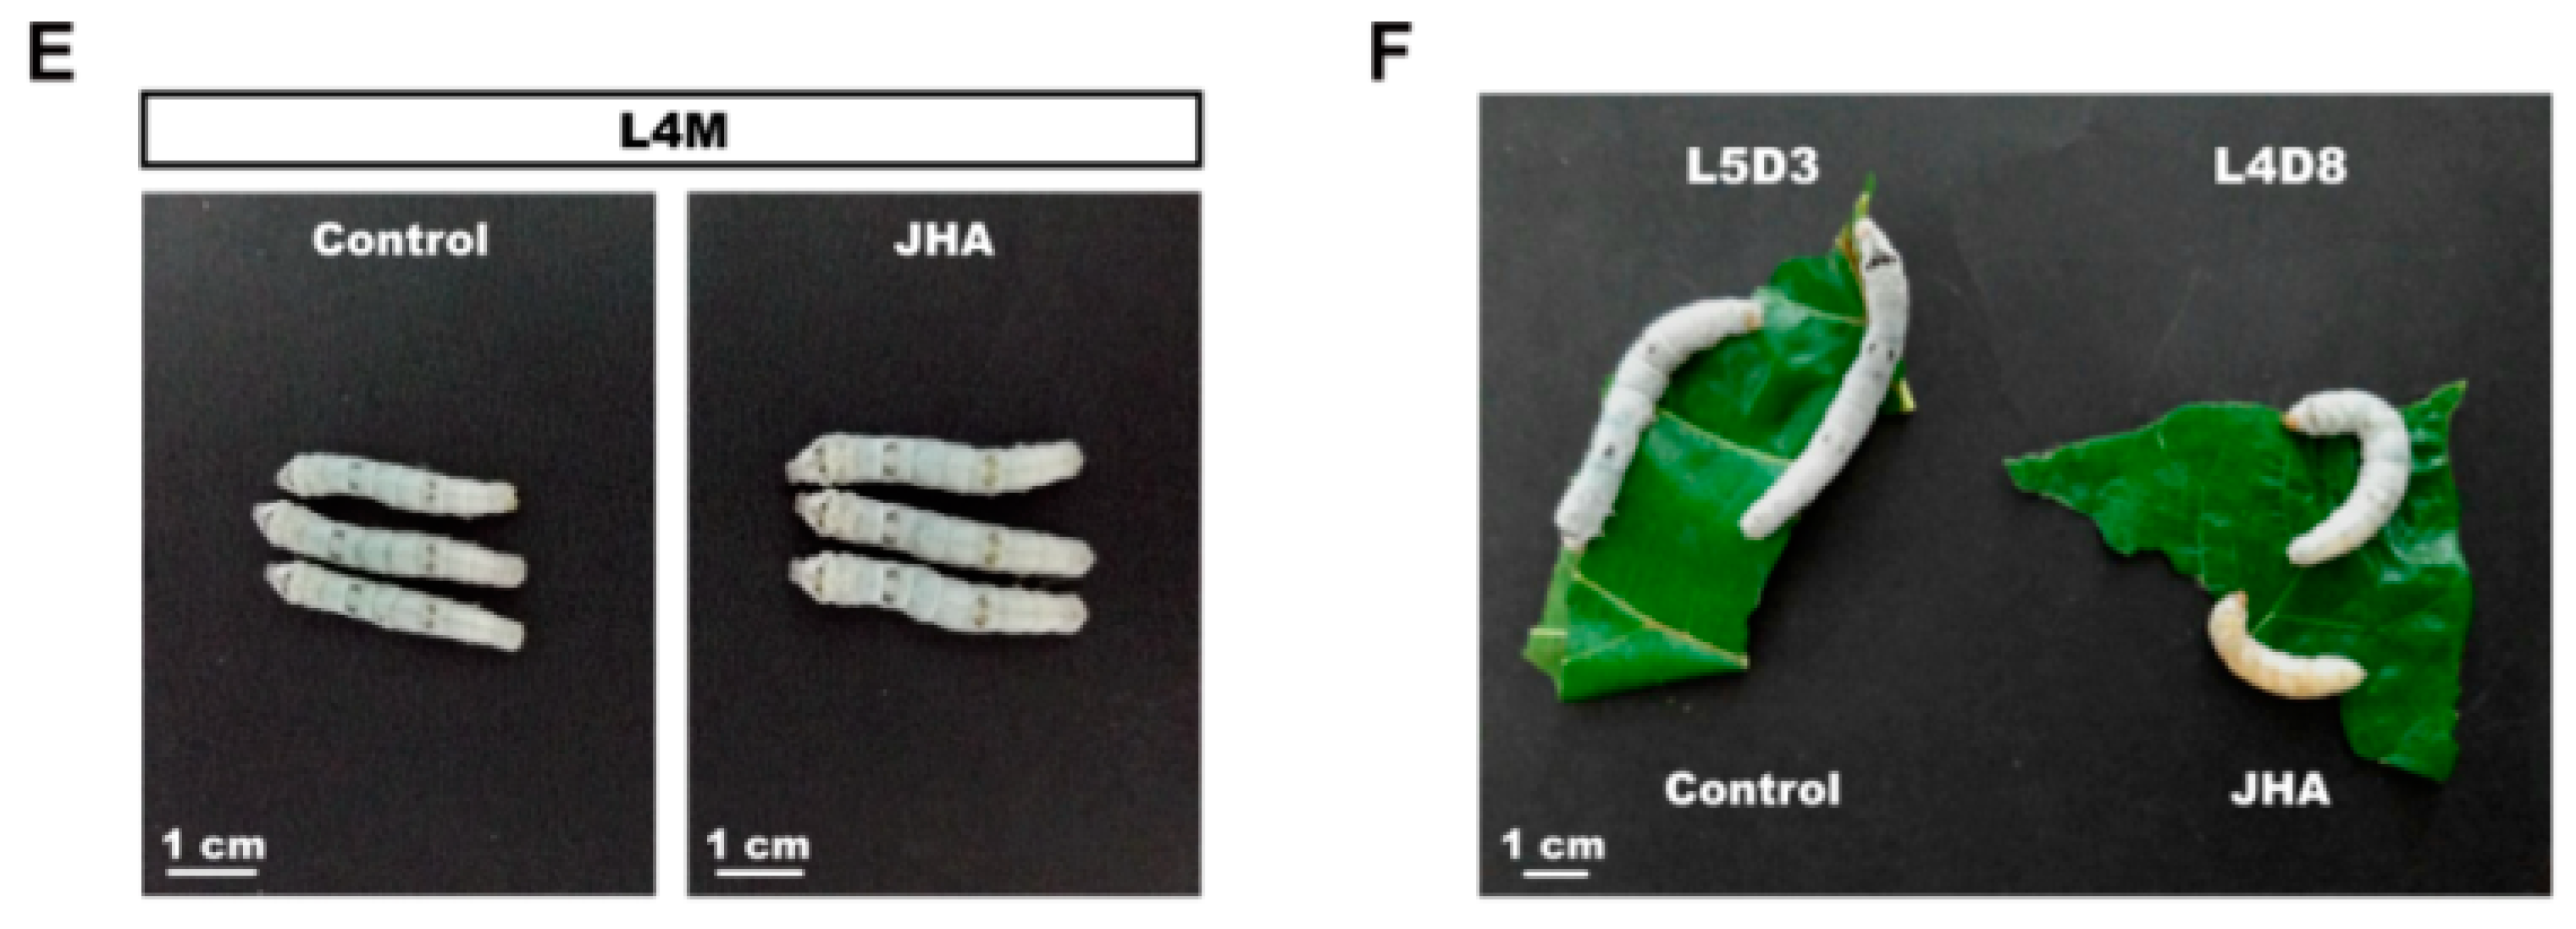
M3 mutant. qRT-PCR analysis showed that the expression of the JH-responsive gene
Kr-h1was significantly increased in the integument at 6 h and 12 h after JHA treatment (
Figure 3A). As expected, we observed that, compared with the control larvae, the feeding duration of either the second or the third larval instar of 10 individuals of 15 silkworm larvae with JHA treatment were prolonged for about 12 h, and their body size was also increased before larval molting (
Figure 3B–E). Intriguingly, two JHA treated larvae only underwent three larval molts and initiated wandering at the eighth day after the third larval molting when the control larvae were in the middle of the fifth instar (
Figure 3B,F), confirming that JHA application at the beginning of the newly molted second instar larvae could induce trimolting. Therefore, these results strongly supported that the trimolting phenotype of the
M3 mutant may be caused by the elevation of JH titer at the beginning of the second instar.
Figure 3.
Change of larval growth and molting by JHA application at the beginning of the second instar. (A) The expression of Kr-h1 was increased at 6 h and 12 h after JHA treatment. The error bars represent the mean ± S.E. (n = 3). The significance of the difference between data sets was calculated using two-tailed Student’s t-test. ** p < 0.01, compared with the control. Hat, hours after treatment; (B) The effects of JHA application on larval growth and development; (C–E) Morphology of the JHA-treated and control larvae at the second , third, and fourth larval molting. The body size of the JHA-treated larvae is bigger than that of the control larvae; (F) Morphology of the JHA-application-induced trimolting larvae and the control tetramolting larvae at the same development point in their final instars. When control larvae develop to day three of the fifth instar, the JHA-treated larvae have initiated wandering although they remain at day eight of the fourth instar. L, larval instar; L2 to L5 respectively represents the second to the fifth larval instar; D, day; D3, the third day of a larval instar; D8, the eighth day of a larval instar; M, molting.
![Ijms 16 25945 g003a]()
![Ijms 16 25945 g003b]()
2.3. Positional Cloning Maps Scr Gene at the M3 Locus
To identify the genes located at the
M3 locus, we conducted positional cloning using 1307 trimolting individuals from the progeny of 37 pairs of backcross 1 (BC1) by crossing WT females and F1 heterozygote males obtained from the crossing of the
M3 mutant and WT strains. Using single nucleotide polymorphism (SNP) markers from both a previous report [
17] and our newly developed silkworm genetic variation map [
18], as listed in
Table S1, we mapped the
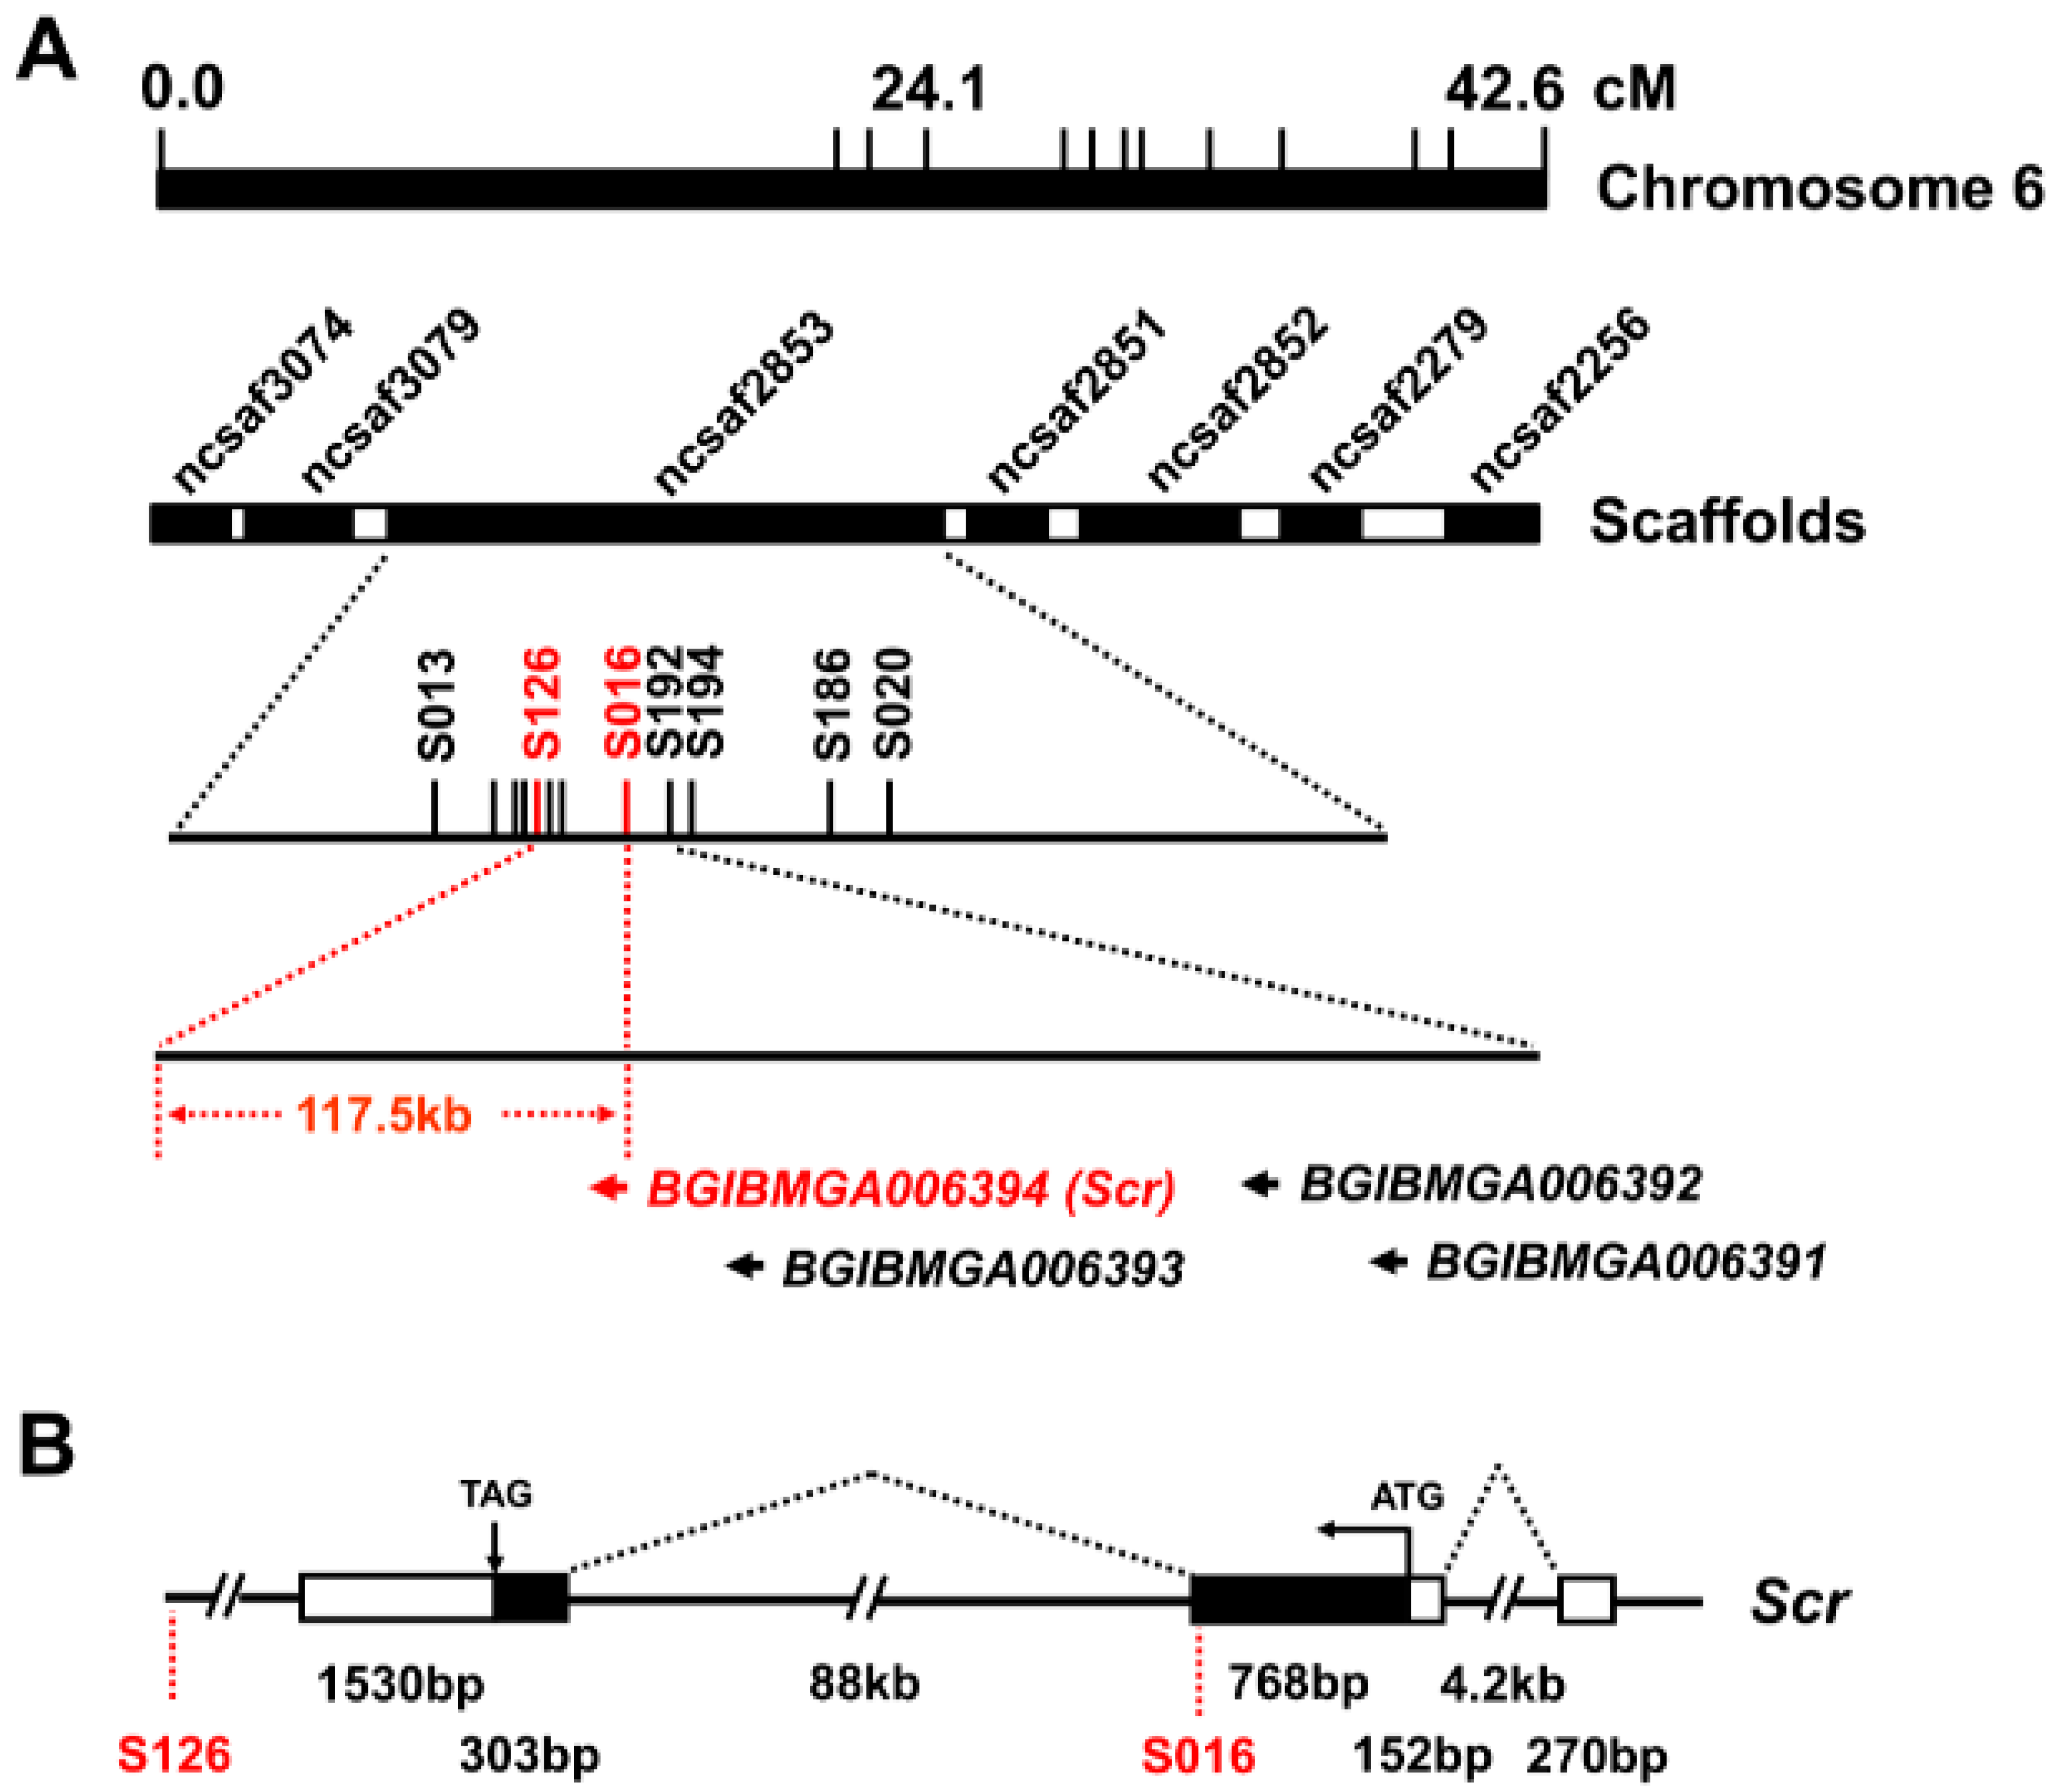
M3 locus within the 117.5 kb genomic region between the SNP markers S126 and S016 on the Bm_nscaf2853 of chromosome 6 (
Figure 4A). This region contained only the downstream sequence of the second exon of the predicted gene,
BGIBMGA006394 (
BMgn006394/
Gene03398 in the KAIKObase) (
Figure 4B), which encodes the Sex combs reduced (Scr) protein that belongs to the homeodomain transcription factor family.
We compared the sequences of the
Scr gene from the
M3 mutant and WT strains. First, a coding sequence (CDS) analysis indicated that, except for a mutation of the SNP marker S016 that resulted in a change from Ser at position 224 to Asn, no other sequence differences between the
M3 and WT strains were identified in CDS regions of the
Scr genes (
Figure S2A,B). Next, an examination of the 3′ untranslated regions (UTRs) indicated that, although some sequence variations existed in the 3′ UTR of the
Scr genes from
M3 and WT strains, these variations were also present in other trimolting silkworm strains (
Figure S2C), thereby indicating that these variations could not contribute to the
M3 mutant. Finally, given that intron 2 of the
Scr gene is located in the
M3 linked region and is 88 kb in length (
Figure 4B), we further determined whether sequence variations existed in intron 2 of the
Scr genes between the
M3 and WT strains. Using 39 pairs of specific primers that covered the genomic regions of intron 2 (
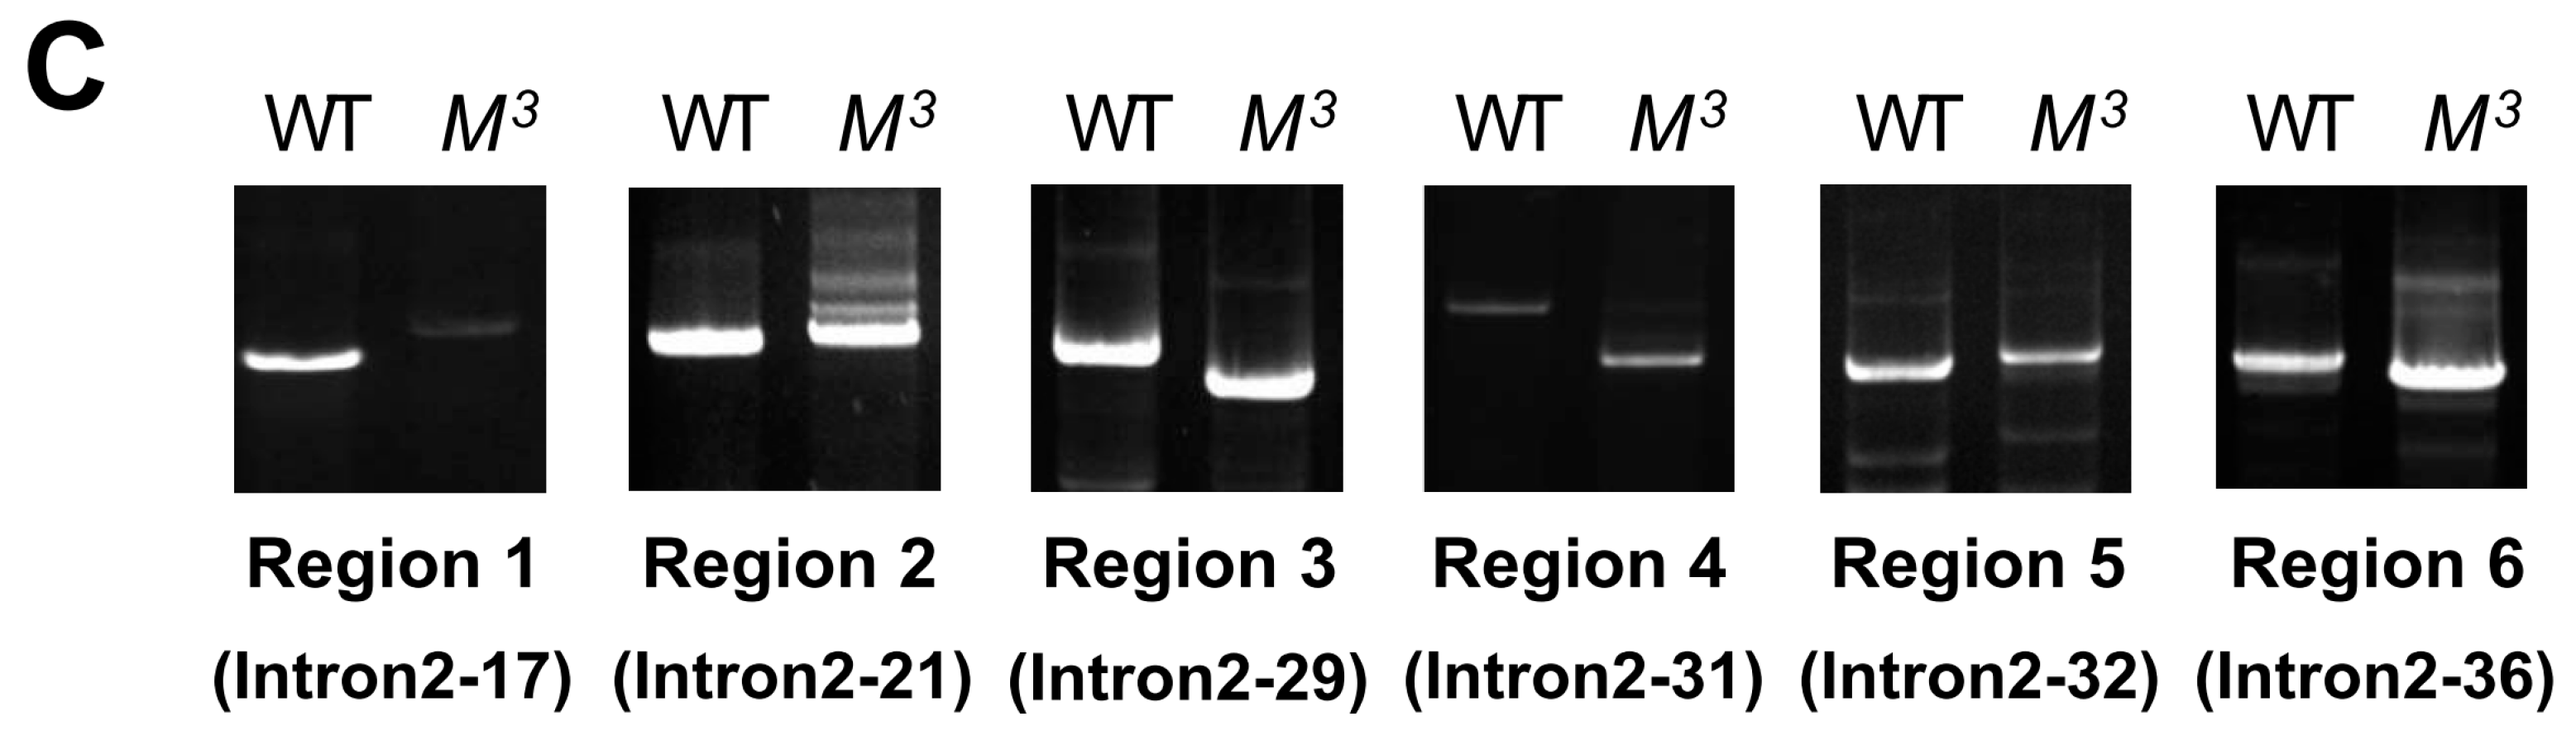
Table S1), we obtained different genomic regions of intron 2 via genomic PCR experiments. Electrophoresis and sequencing of the PCR products revealed that at least six regions exhibited a sequence variation of greater than 100 bp in length (
Figure 4C and
Table S2). By searching the National Center for Biotechnology Information (NCBI) database using the Basic Local Alignment Search Tool for nucleotide sequences (BLASTn), we observed that the insertions in both regions 1 and 5 and the deletion in region 3 were homologous to a retrotransposon, the mariner-like transposable element 1 of
Bombyx mandarina (Bm1), thereby suggesting that the variations in intron 2 may contribute to the roles of the
Scr gene in the
M3 mutant.
Figure 4.
Positional cloning of the M3 locus. (A) Positional mapping of the silkworm M3 locus on chromosome 6. Using SNP markers on chromosome 6 and 1307 BC1 trimolting individuals, the region linked to the M3 locus could be narrowed down to the 117.5 kb genomic region between SNP markers S126 and S016 on the scaffold of nscaf2853. Only one predicted gene, BGIBMGA006394, was located in this region, and this gene is annotated as Scr; (B) Schematic structure of the Scr gene. By searching the silkworm genome databases SilkDB and KAIKObase, the full-length cDNA sequence of the candidate Scr gene was determined to be comprised of three exons and two introns, and the second intron and the third exon are located in the genomic region that is linked to the M3 locus. The black boxes, white boxes, and dotted diagonal lines indicate coding sequences, UTRs, and introns, respectively; (C) Genomic differences in intron 2 of the Scr gene between the M3 and WT strains. Genomic PCR analysis confirmed that six regions in intron 2 of the Scr gene exhibited sequence variations of greater than 100 bp in length between the M3 and WT strains. The names of the primers used for amplifying these regions are presented in parentheses.
![Ijms 16 25945 g004a]()
![Ijms 16 25945 g004b]()
2.4. Scr Gene is Highly Expressed in Br-CC-CA during Early Larval Stages
Insect larval molting is precisely regulated by JH and ecdysone. To explore the potential crosstalk between Scr and the biosynthesis of either JH or ecdysone, we profiled the temporal expression of the
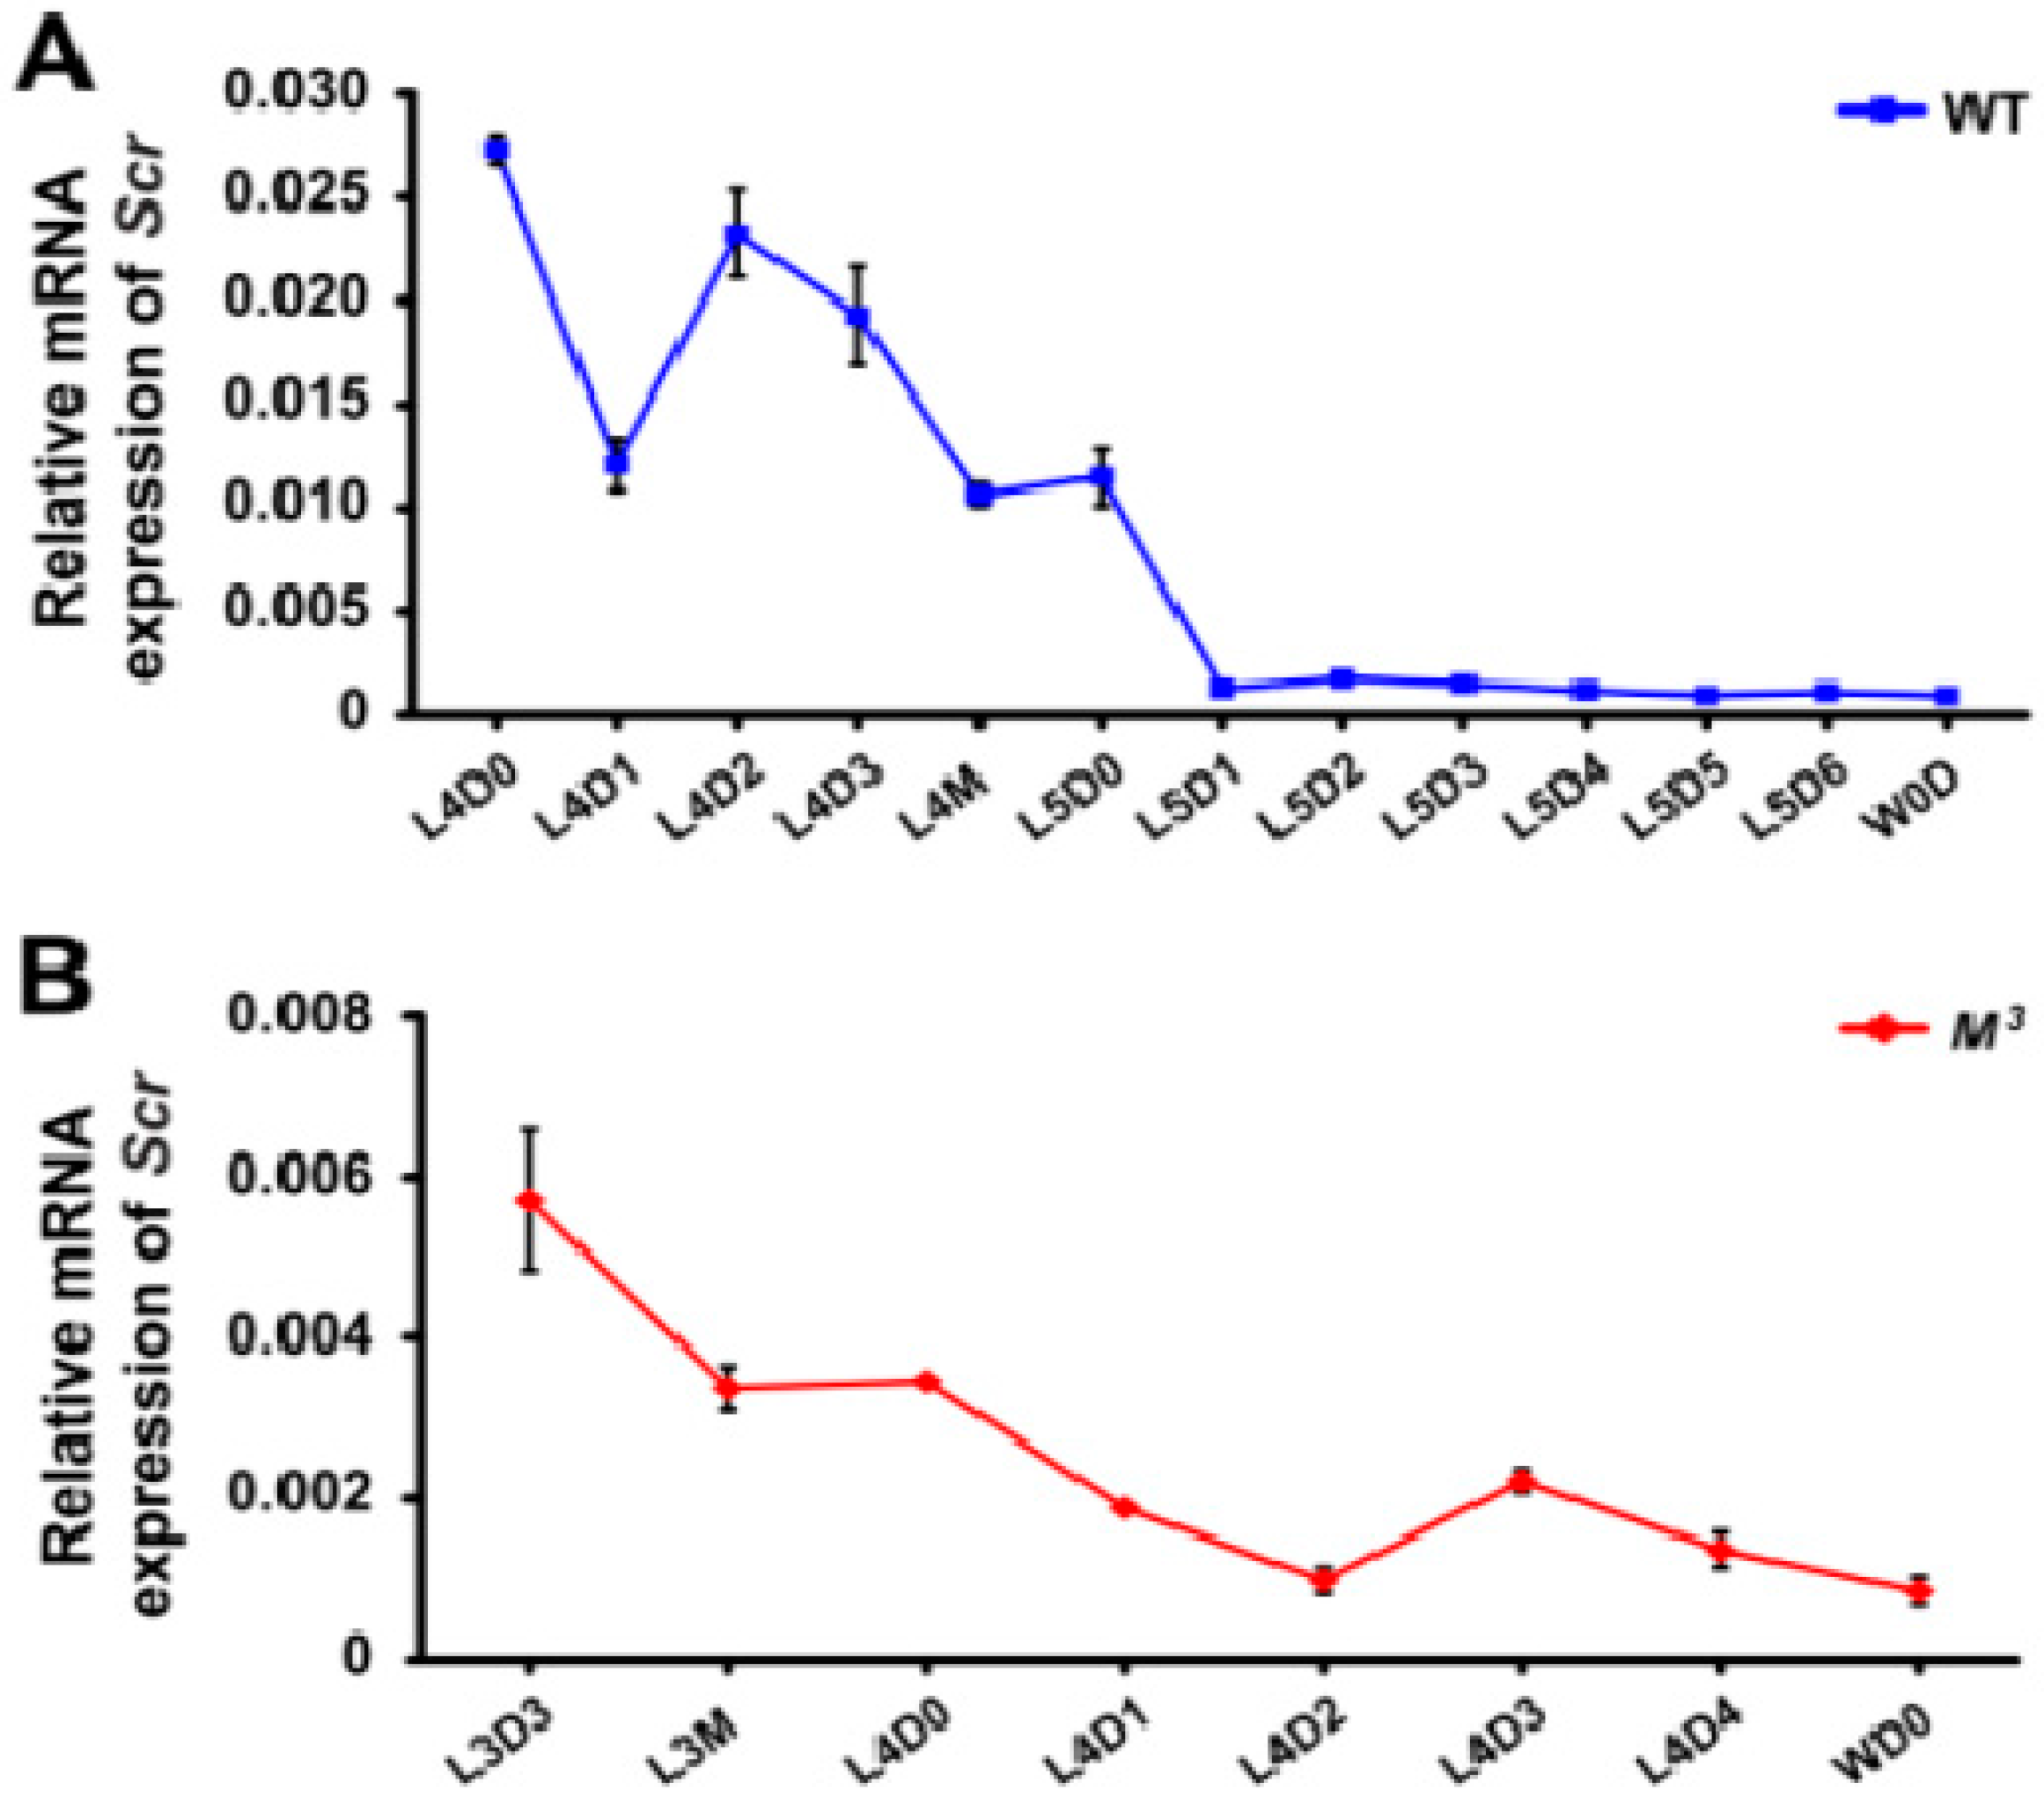
Scr gene in both the brain-corpora cardiaca-corpora allata (Br-CC-CA) complex, which controls the synthesis of JH, and the PG, where ecdysone is synthesized. qRT-PCR examination indicated that in the Br-CC-CA complex of the WT larvae during the last two instars,
Scr expression was high during the early feeding stages of the fourth instar, subsequently decreased before the fourth molting, and became very low in the final instar (
Figure 5A). This changing tendency of
Scr expression was similar to that observed during the final two instars of the
M3 mutant (
Figure 5B), and was positively correlated with the changes in the JH titer (
Figure 2B). In addition, because it was somewhat difficult to isolate the Br-CC-CA complex at the early larval stages from the second to third larval instars, we further analyzed the developmental expressions of the
Scr gene in areas of the head that mainly contain the Br-CC-CA complex. Our results demonstrated that
Scr expression in the head was high at the beginning of each larval instar and decreased before larval molting in both the
M3 and WT strains (
Figure 5C), which exhibited a positive correlation with the JH titer change (
Figure 2A,B). Notably,
Scr expression was higher in the
M3 strain than that in the WT strain during the early feeding stage of the second instar (
Figure 5C), which is consistent with the greater concentration of JH titer and the higher expression level of
Kr-h1 in the
M3 mutant (
Figure 2A,C). These data indicate that the
Scr gene might be involved in JH biosynthesis.
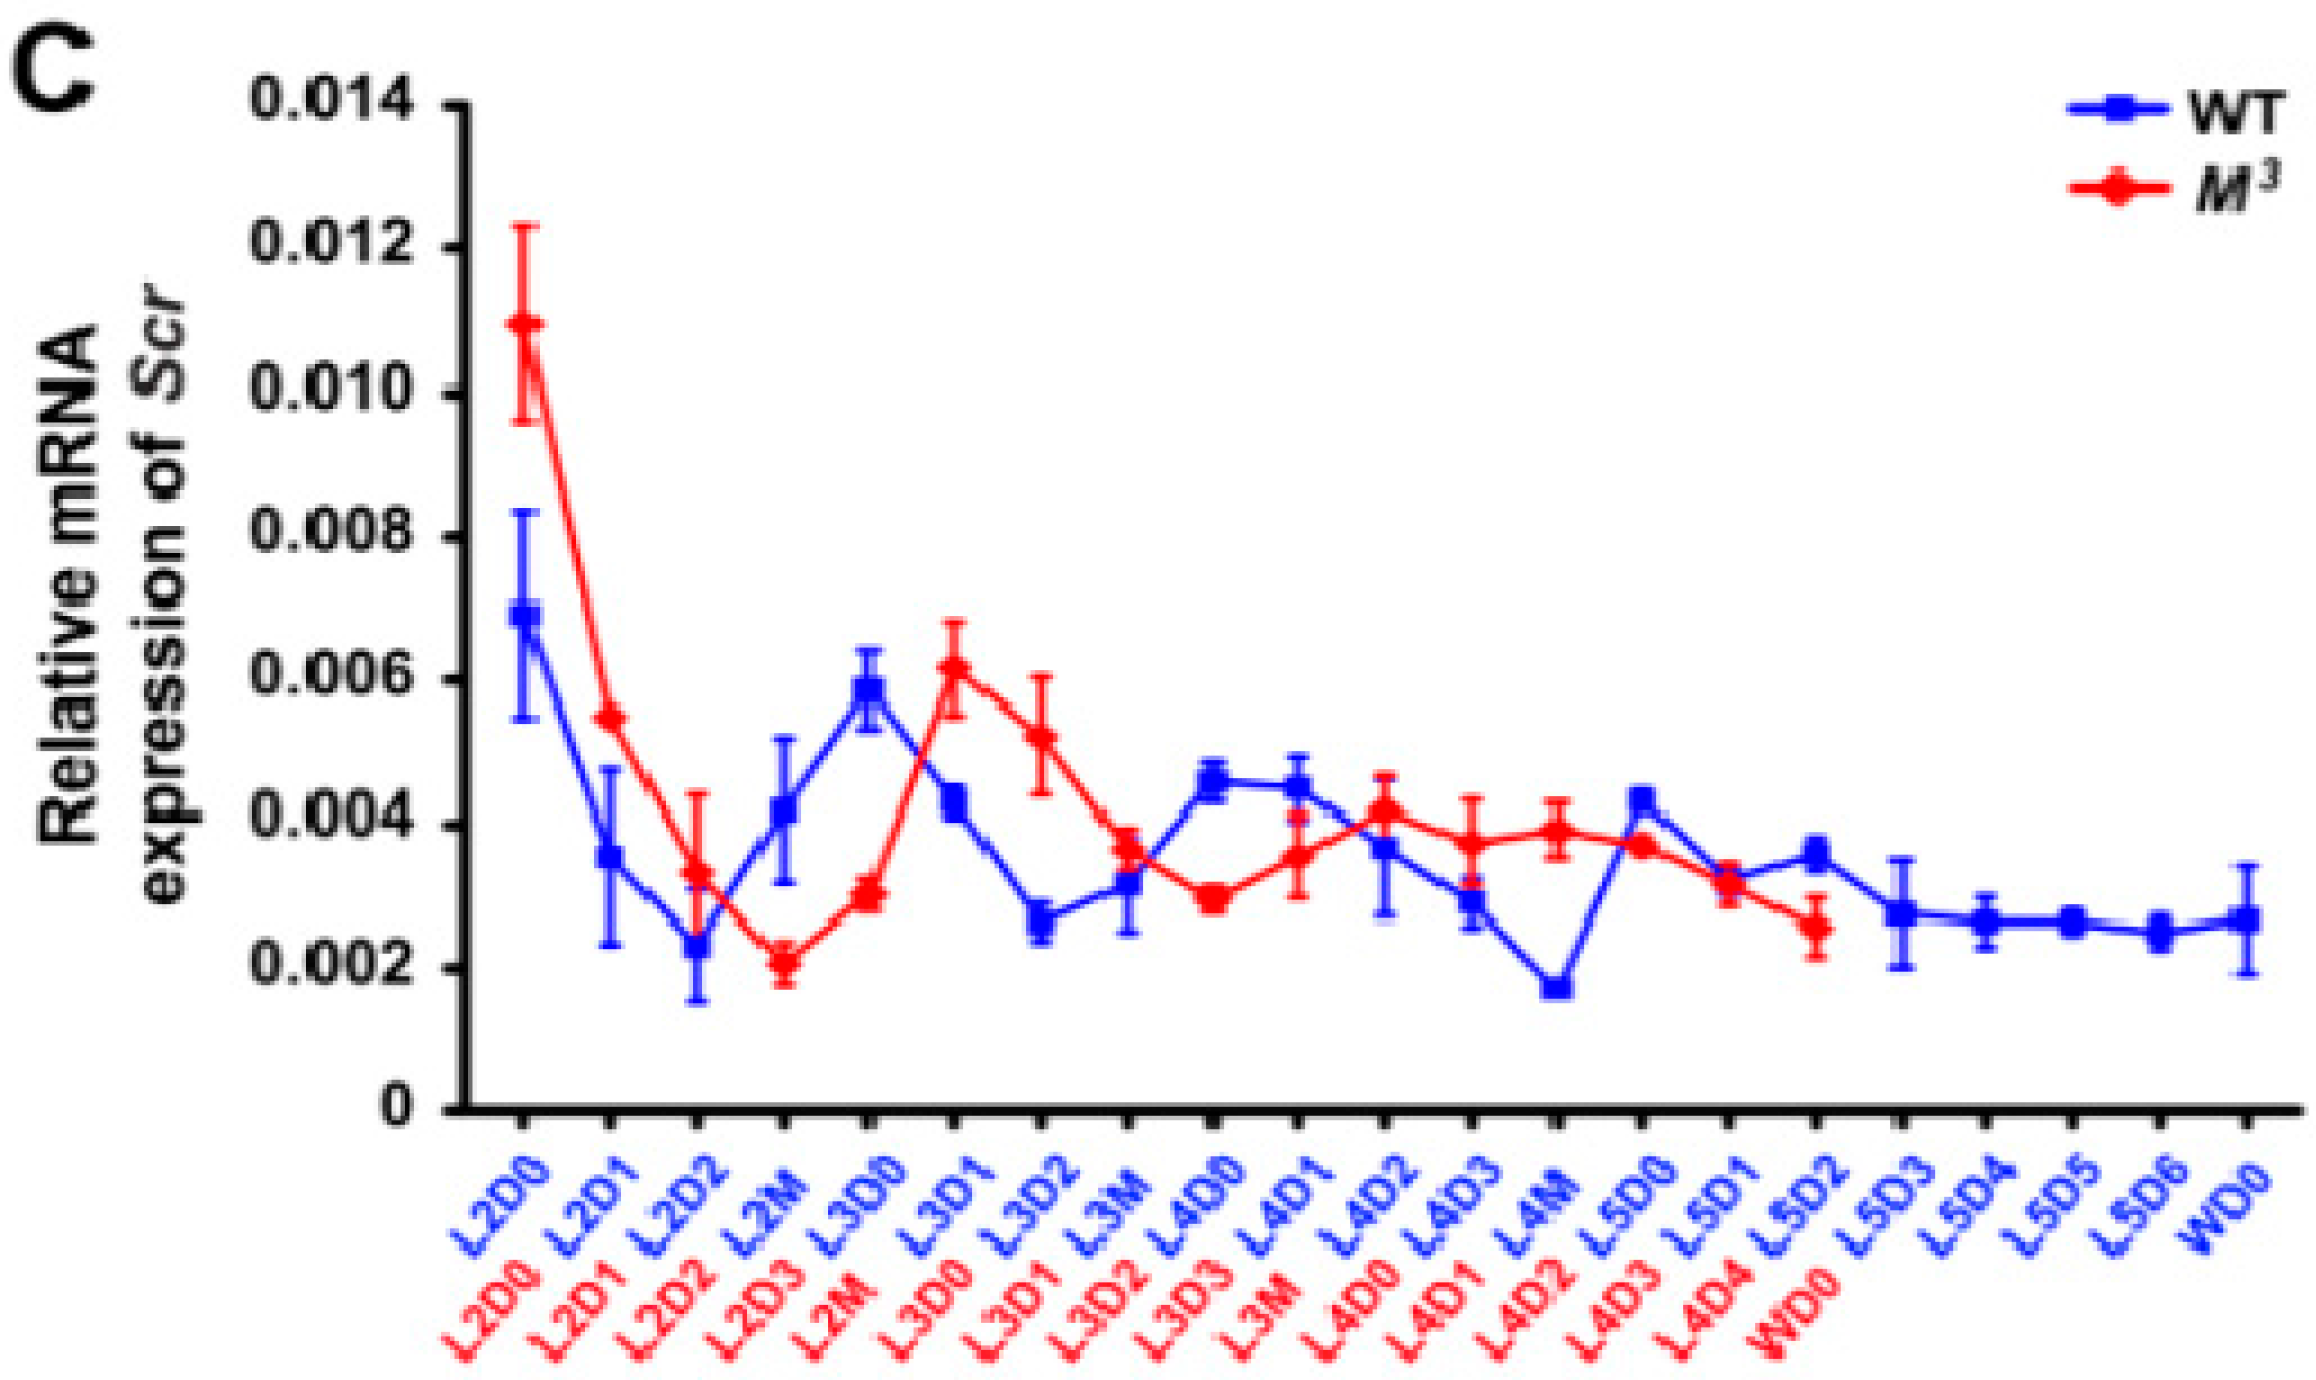
Figure 5.
Developmental expression of the Scr gene in the M3 and WT larvae. (A,B) qRT-PCR analysis of Scr expression in the Br-CC-CA complex. The results indicated that Scr was highly expressed in the Br-CC-CA complex in the early stages of either the fourth instar of WT larvae or the third instar of M3 larvae, and that it was dramatically decreased in the final instar. This expression of the Scr gene exhibited a close correlation with the JH titer changes during the same stages; (C) qRT-PCR analysis of Scr expression in the areas of the head that mainly contain the Br-CC-CA complex. The results confirmed that the Scr expression levels in the head were higher in the M3 larvae than in the WT larvae during the early feeding stage of the second instar, and these levels exhibited a positive correlation with the difference in the JH titers between the M3 and WT larvae. L, larval instar; L2 to L5 respectively represents the second to the fifth larval instar; D, day; D0, initial day; D1 to D6 respectively represents the first to the sixth day of a larval instar; M, molting; W, wandering. The error bars represent the mean ± S.E. (n = 3).
![Ijms 16 25945 g005a]()
![Ijms 16 25945 g005b]()
We further investigated the developmental expression of the
Scr gene in the PG. As shown in
Figure S3, although
Scr was highly expressed in the PG during the final molting in both the
M3 and WT larvae, its expression was very low during the final instar and before the larval-pupal metamorphosis, which does not correspond to the dramatic elevation of the ecdysone titer at the beginning of wandering (
Figure S1B). Taken together, our results suggest that the
Scr gene is involved in JH biosynthesis but does not contribute to ecdysone biosynthesis.
2.5. Scr Protein Regulates the Transcription of Genes Involved in JH Biosynthesis
To investigate whether the Scr protein is involved in regulating the transcription of genes that control JH biosynthesis, we transfected the
Scr overexpression vector 1180-
hr3-
A4/
Flag-
Scr or the
enhanced green fluorescent protein (
EGFP) overexpression vector 1180-
hr3-
A4/
EGFP, which was used as a negative control, into the silkworm embryo-derived (BmE) cells. Western blotting showed that the Scr protein was successfully overexpressed (
Figure S4). Previous studies have reported that insect JH biosynthesis involves multiple enzymatic steps and is modulated by several neuropeptides [
7,
19,
20,
21]. A qRT-PCR analysis indicated that the transcription of the gene that encodes the neuropeptide allatotropin as a stimulator of CA activity and the genes that encode key enzymes involved in JH biosynthesis, such as
HMGS,
HMGR,
MevK,
MevPPD,
FPPS2, and
JHAMT, could be markedly increased after
Scr overexpression (
Figure 6). In contrast, the transcription of the genes involved in ecdysone biosynthesis, including
PTTH,
PTSP,
Phantom, and
Shadow, was not altered following
Scr overexpression (
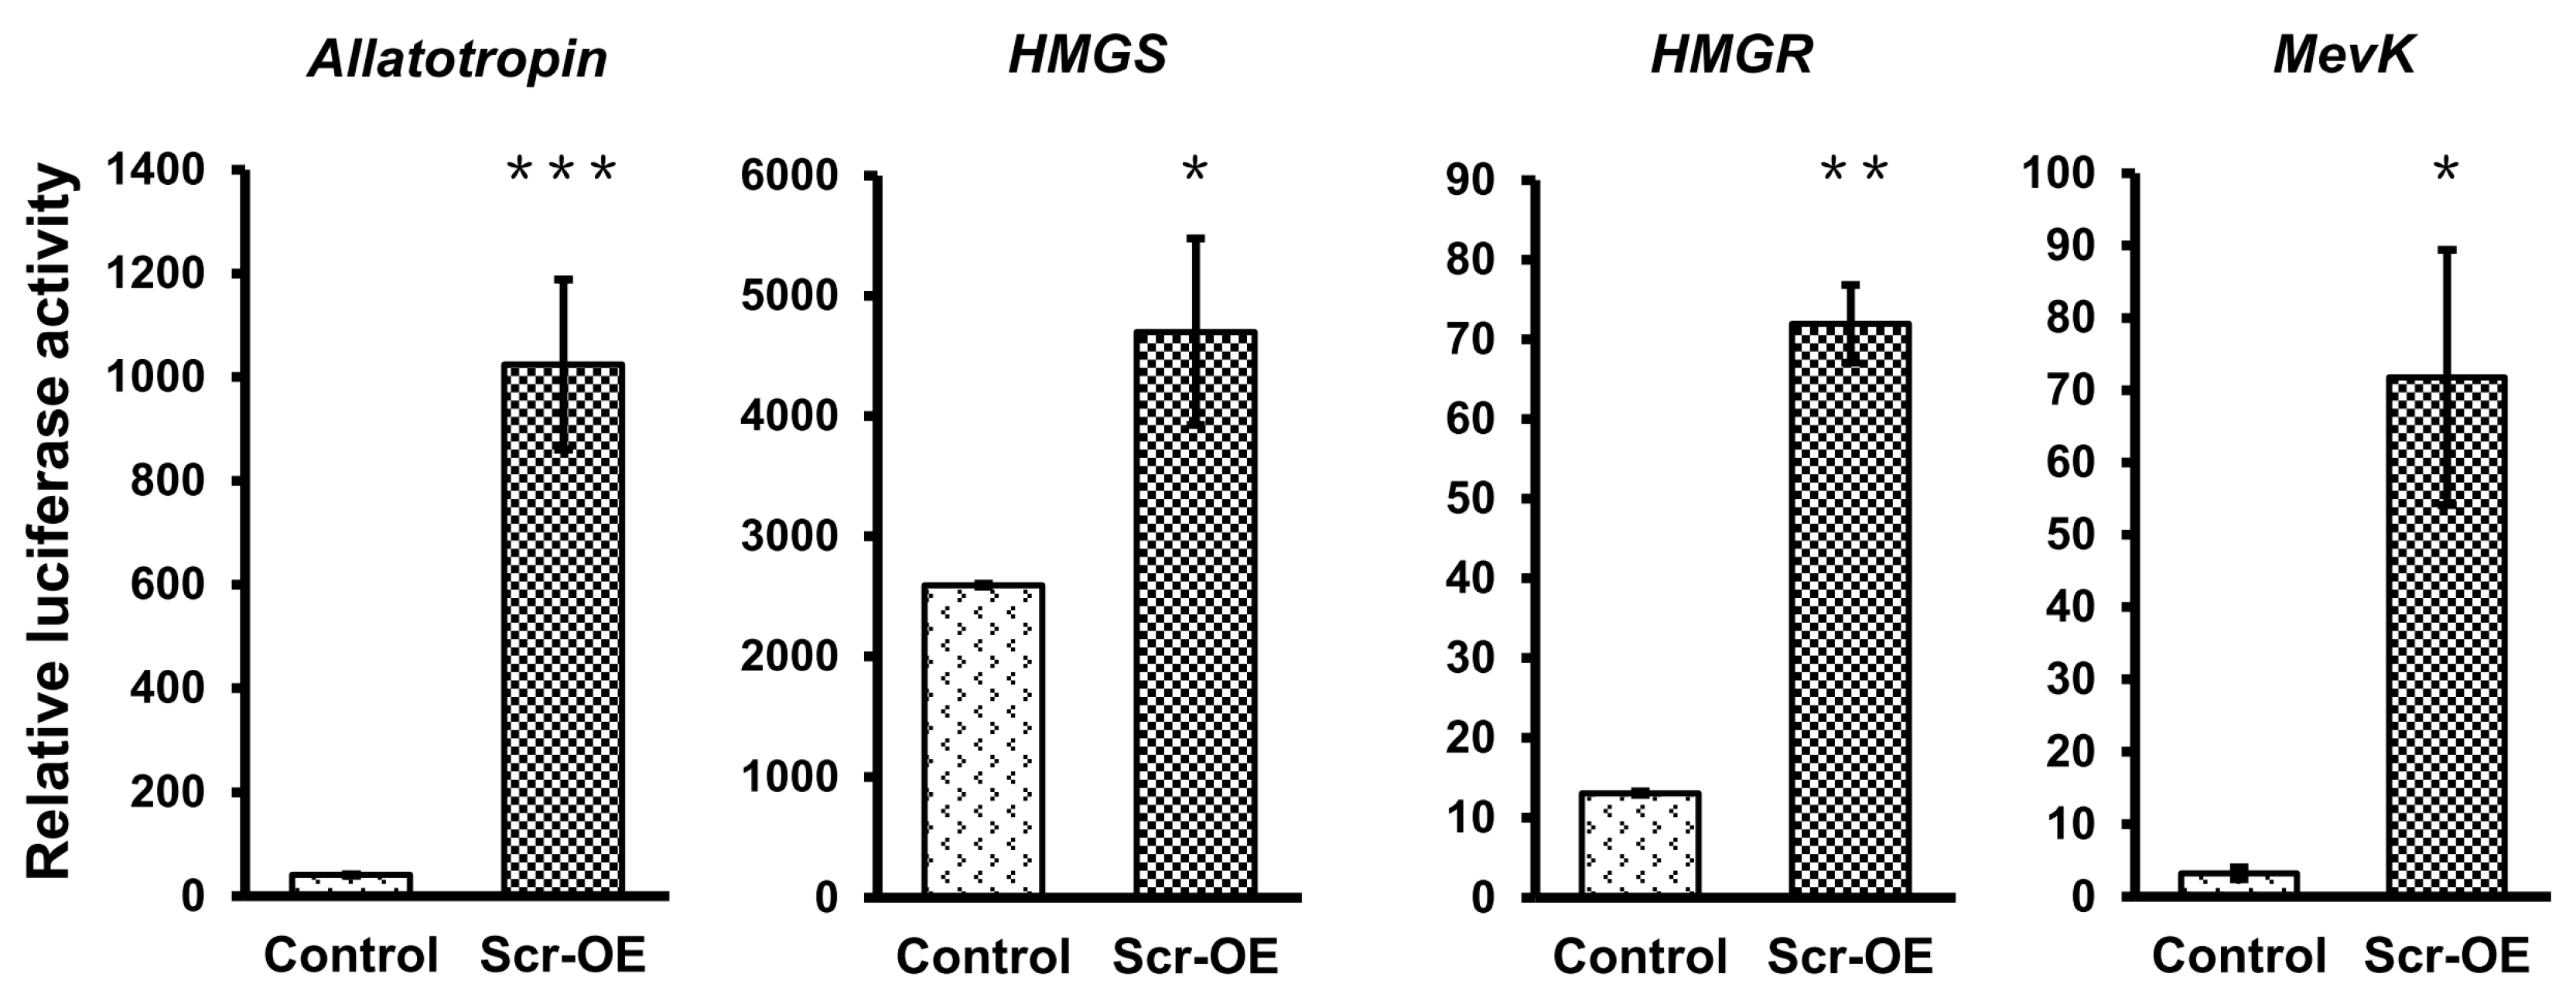
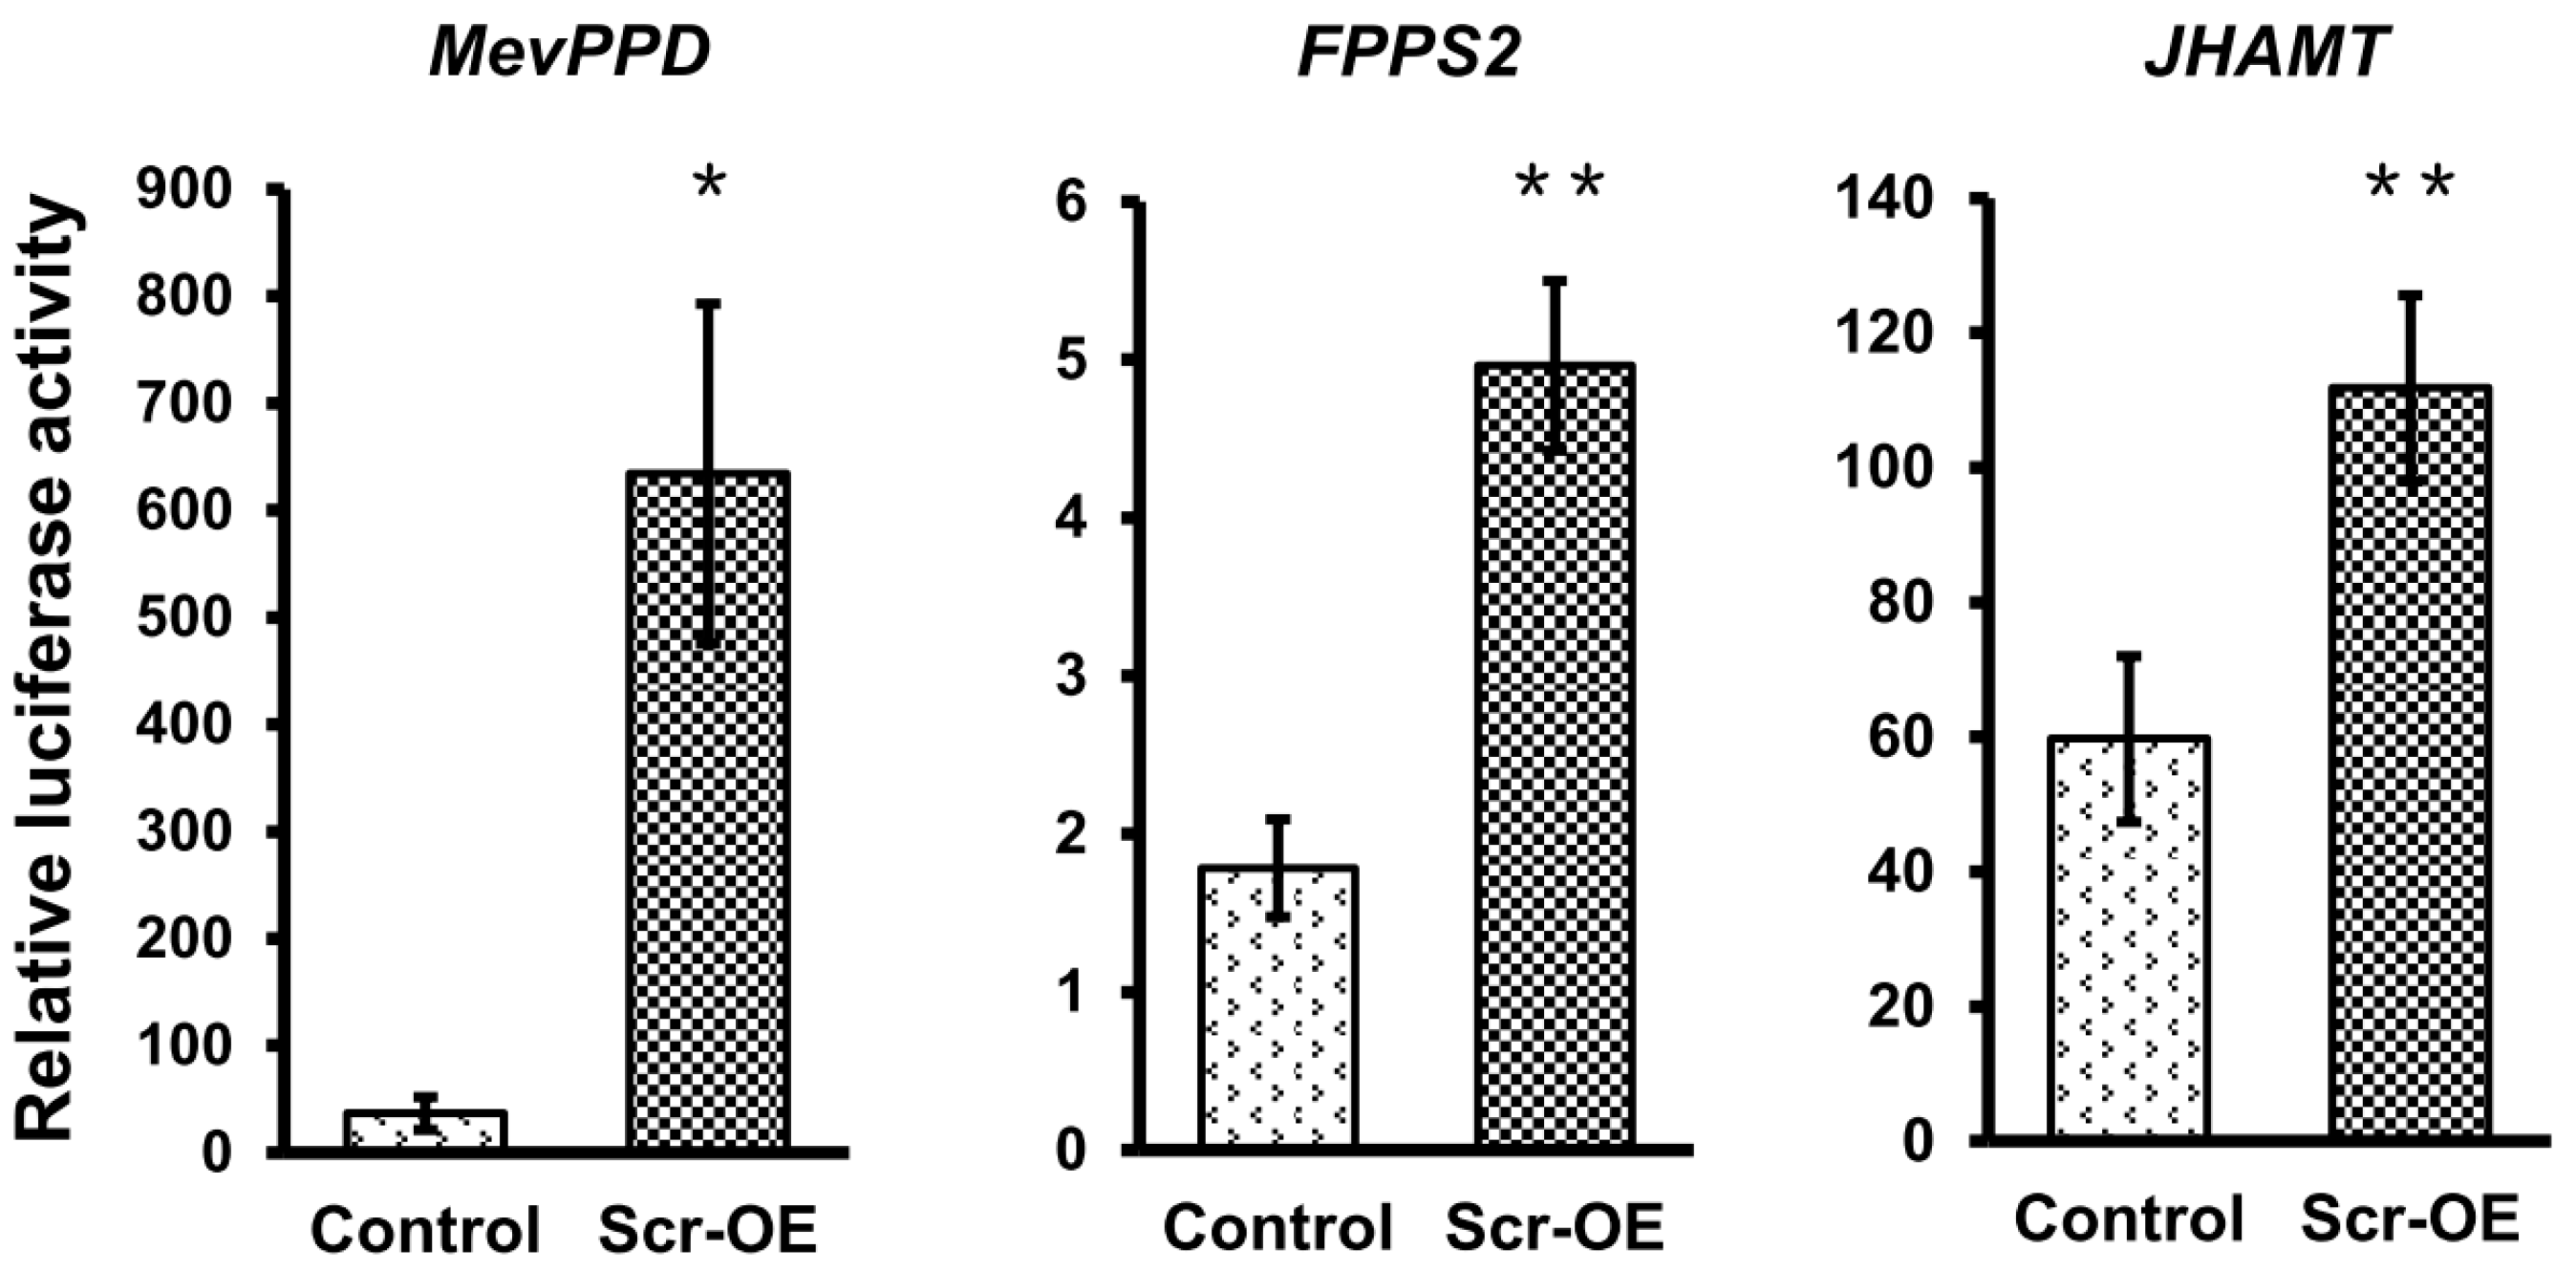
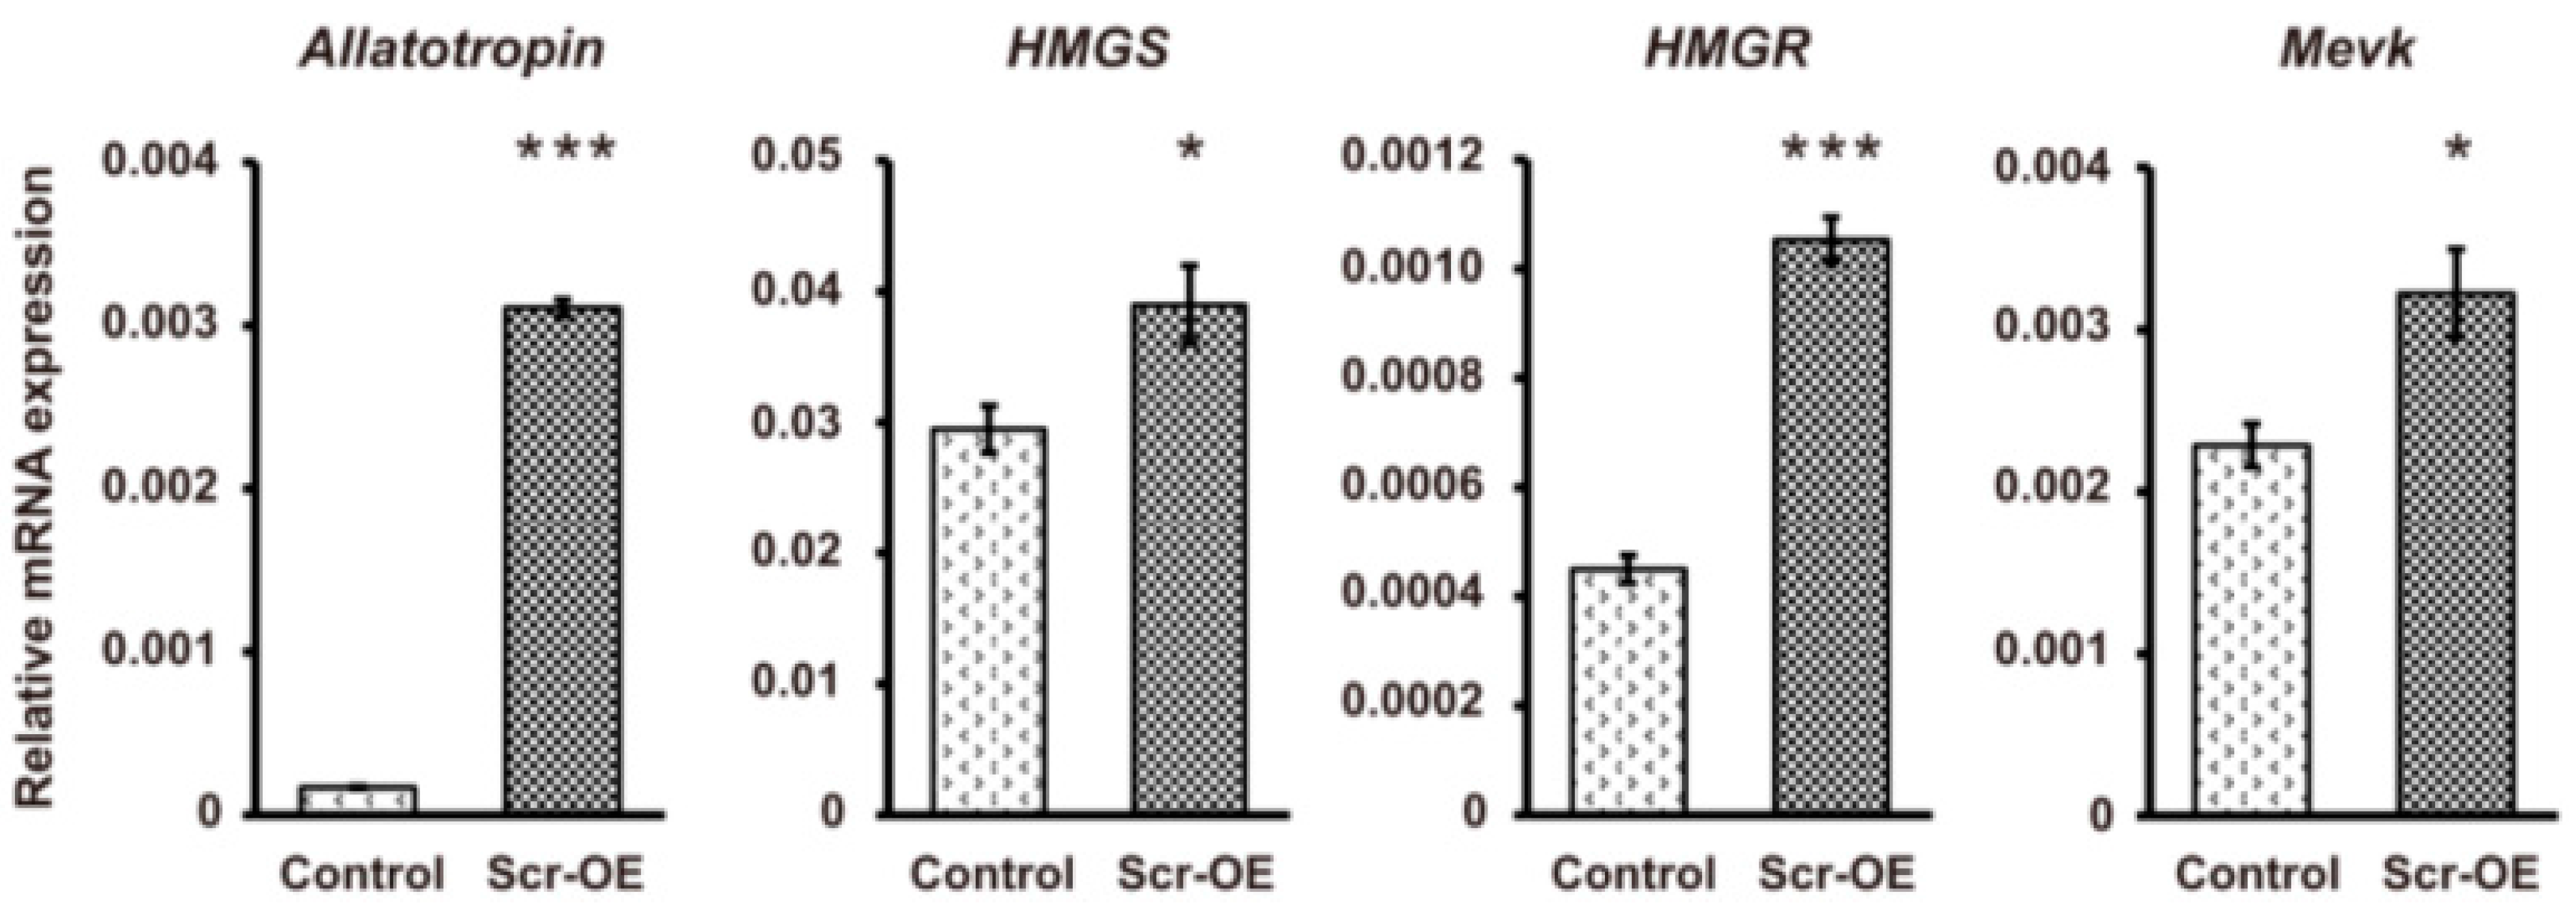
Figure S5). These results further suggest that Scr plays important roles in regulating the transcription of genes that control JH biosynthesis, but is not involved in the transcriptional regulation of ecdysone biosynthesis-related genes.
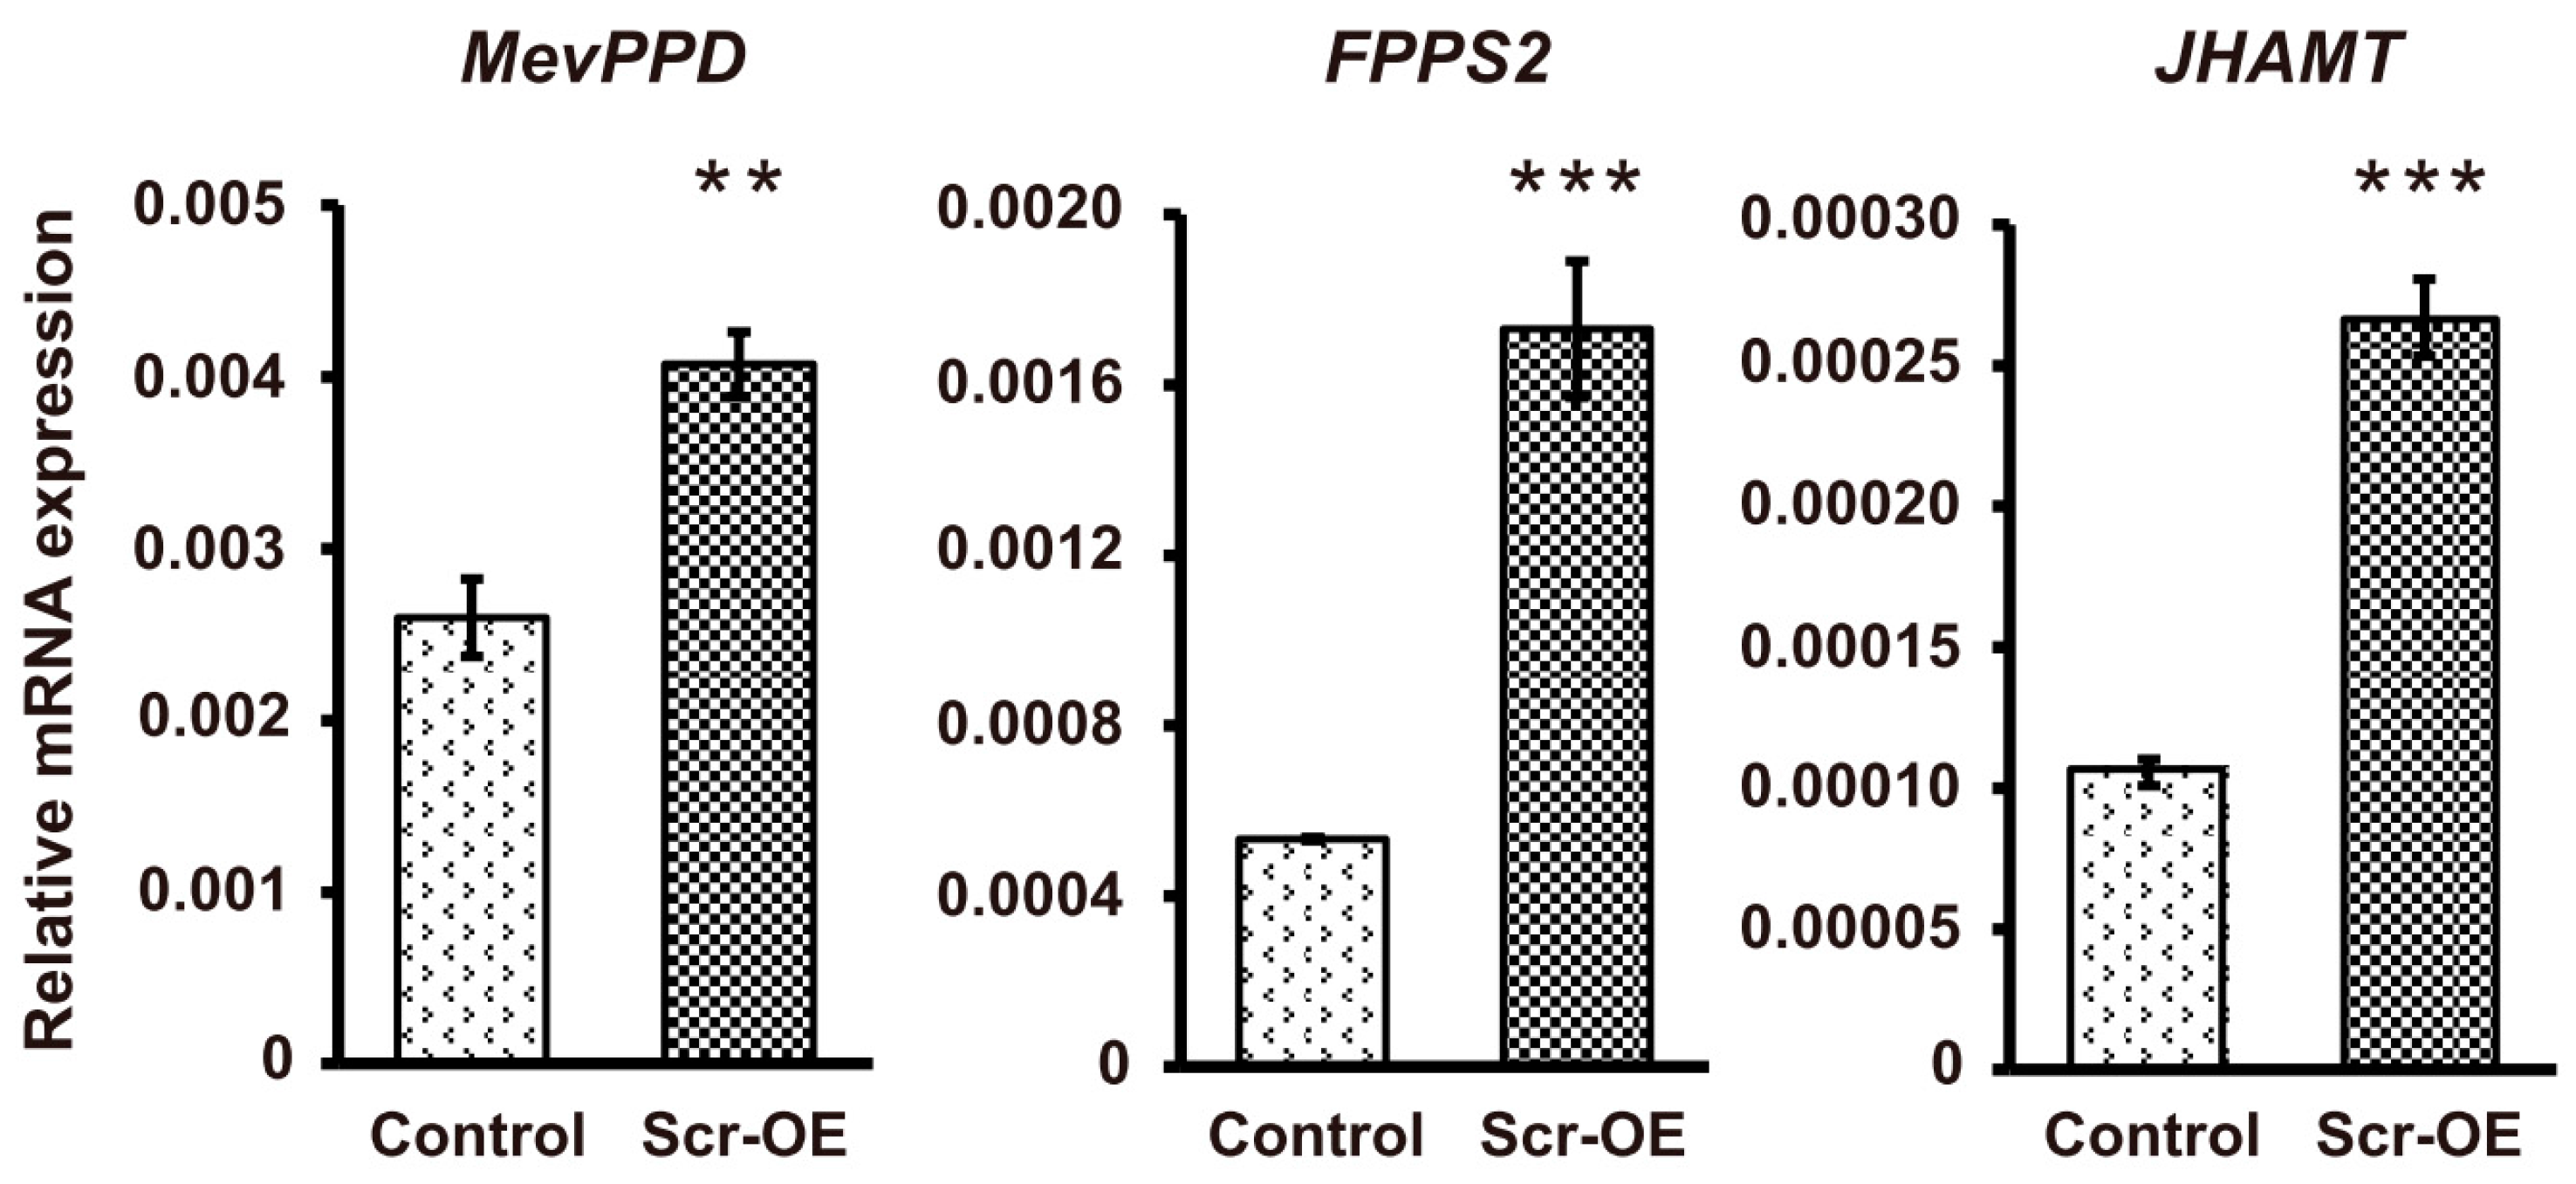
Figure 6.
The effects of Scr overexpression on the transcription of genes involved in JH biosynthesis. The vector used to overexpress the silkworm Scr gene was transfected into BmE cells. The EGFP-overexpressing vector was used as a control. The cells were collected 72 h after transfection for qRT-PCR analysis. Among the genes involved in JH biosynthesis, the transcription of the Allatotropin gene and the genes that encode key enzymes, including HMGS, HMGR, MevK, MevPPD, FPPS2, and JHAMT, were significantly induced after Scr overexpression. OE, overexpression. The error bars represent the mean ± S.E. (n = 3). The significance of the difference between data sets was calculated using two-tailed Student’s t-test. * p < 0.05; ** p < 0.01; *** p < 0.001, compared with the control.
To further confirm whether the transcription of these JH biosynthesis-related genes can be regulated by Scr, we used the online MatInspector program (
http://www.genomatix.de/) and predicted several potential
cis-regulatory elements (CREs) for homeodomain transcription factors on the promoter regions that are approximate 2 kb in length upstream of the ATG start codons of these selected genes (
Figure S6). According to this result, we next designed the promoter-specific primers listed in
Table S1 to clone these promoter sequences into the pGL3-basic vector and then respectively co-transfected each of the recombinant pGL3 vectors with the
Scr overexpression vector or the
EGFP overexpression vector into BmE cells. The luciferase reporter assay indicated that
Scr overexpression significantly increased the activities of the promoters of these JH biosynthesis-related genes (
Figure 7). These results strongly support the notion that the Scr protein regulates the transcription of genes in the JH biosynthesis pathway of the silkworm.
Figure 7.
The effects of Scr overexpression on the activities of the promoters of genes involved in JH biosynthesis. Luciferase reporter analysis in BmE cells indicated that the activities of the promoters of seven genes whose transcription was induced after Scr overexpression, including Allatotropin, HMGS, HMGR, MevK, MevPPD, FPPS2, and JHAMT, were also up-regulated by Scr overexpression. OE, overexpression. The error bars represent the mean ± S.E. (n = 3). The significance of the difference between data sets was calculated using two-tailed Student’s t-test. * p < 0.05; ** p < 0.01; *** p < 0.001, compared with the control.
2.6. Scr Protein Directly Binds to the Promoters of Genes Involved in JH Biosynthesis
We further determined whether the Scr protein can directly bind to the promoter regions of genes involved in JH biosynthesis. The three JH biosynthesis-related genes (
Allatotropin,
FPPS2, and
JHAMT) whose transcription was most significantly induced by
Scr overexpression were selected for further analysis. To identify the authentic CREs for the Scr protein on the promoters of these JH biosynthesis-related genes, a series of luciferase reporter constructs driven by 5′ flanking truncated promoters upstream of the ATG start codon of each gene were generated. Further analysis in BmE cells indicated that every truncated promoter of both
Allatotropin and
JHAMT significantly increased the transactivation of luciferase expression following
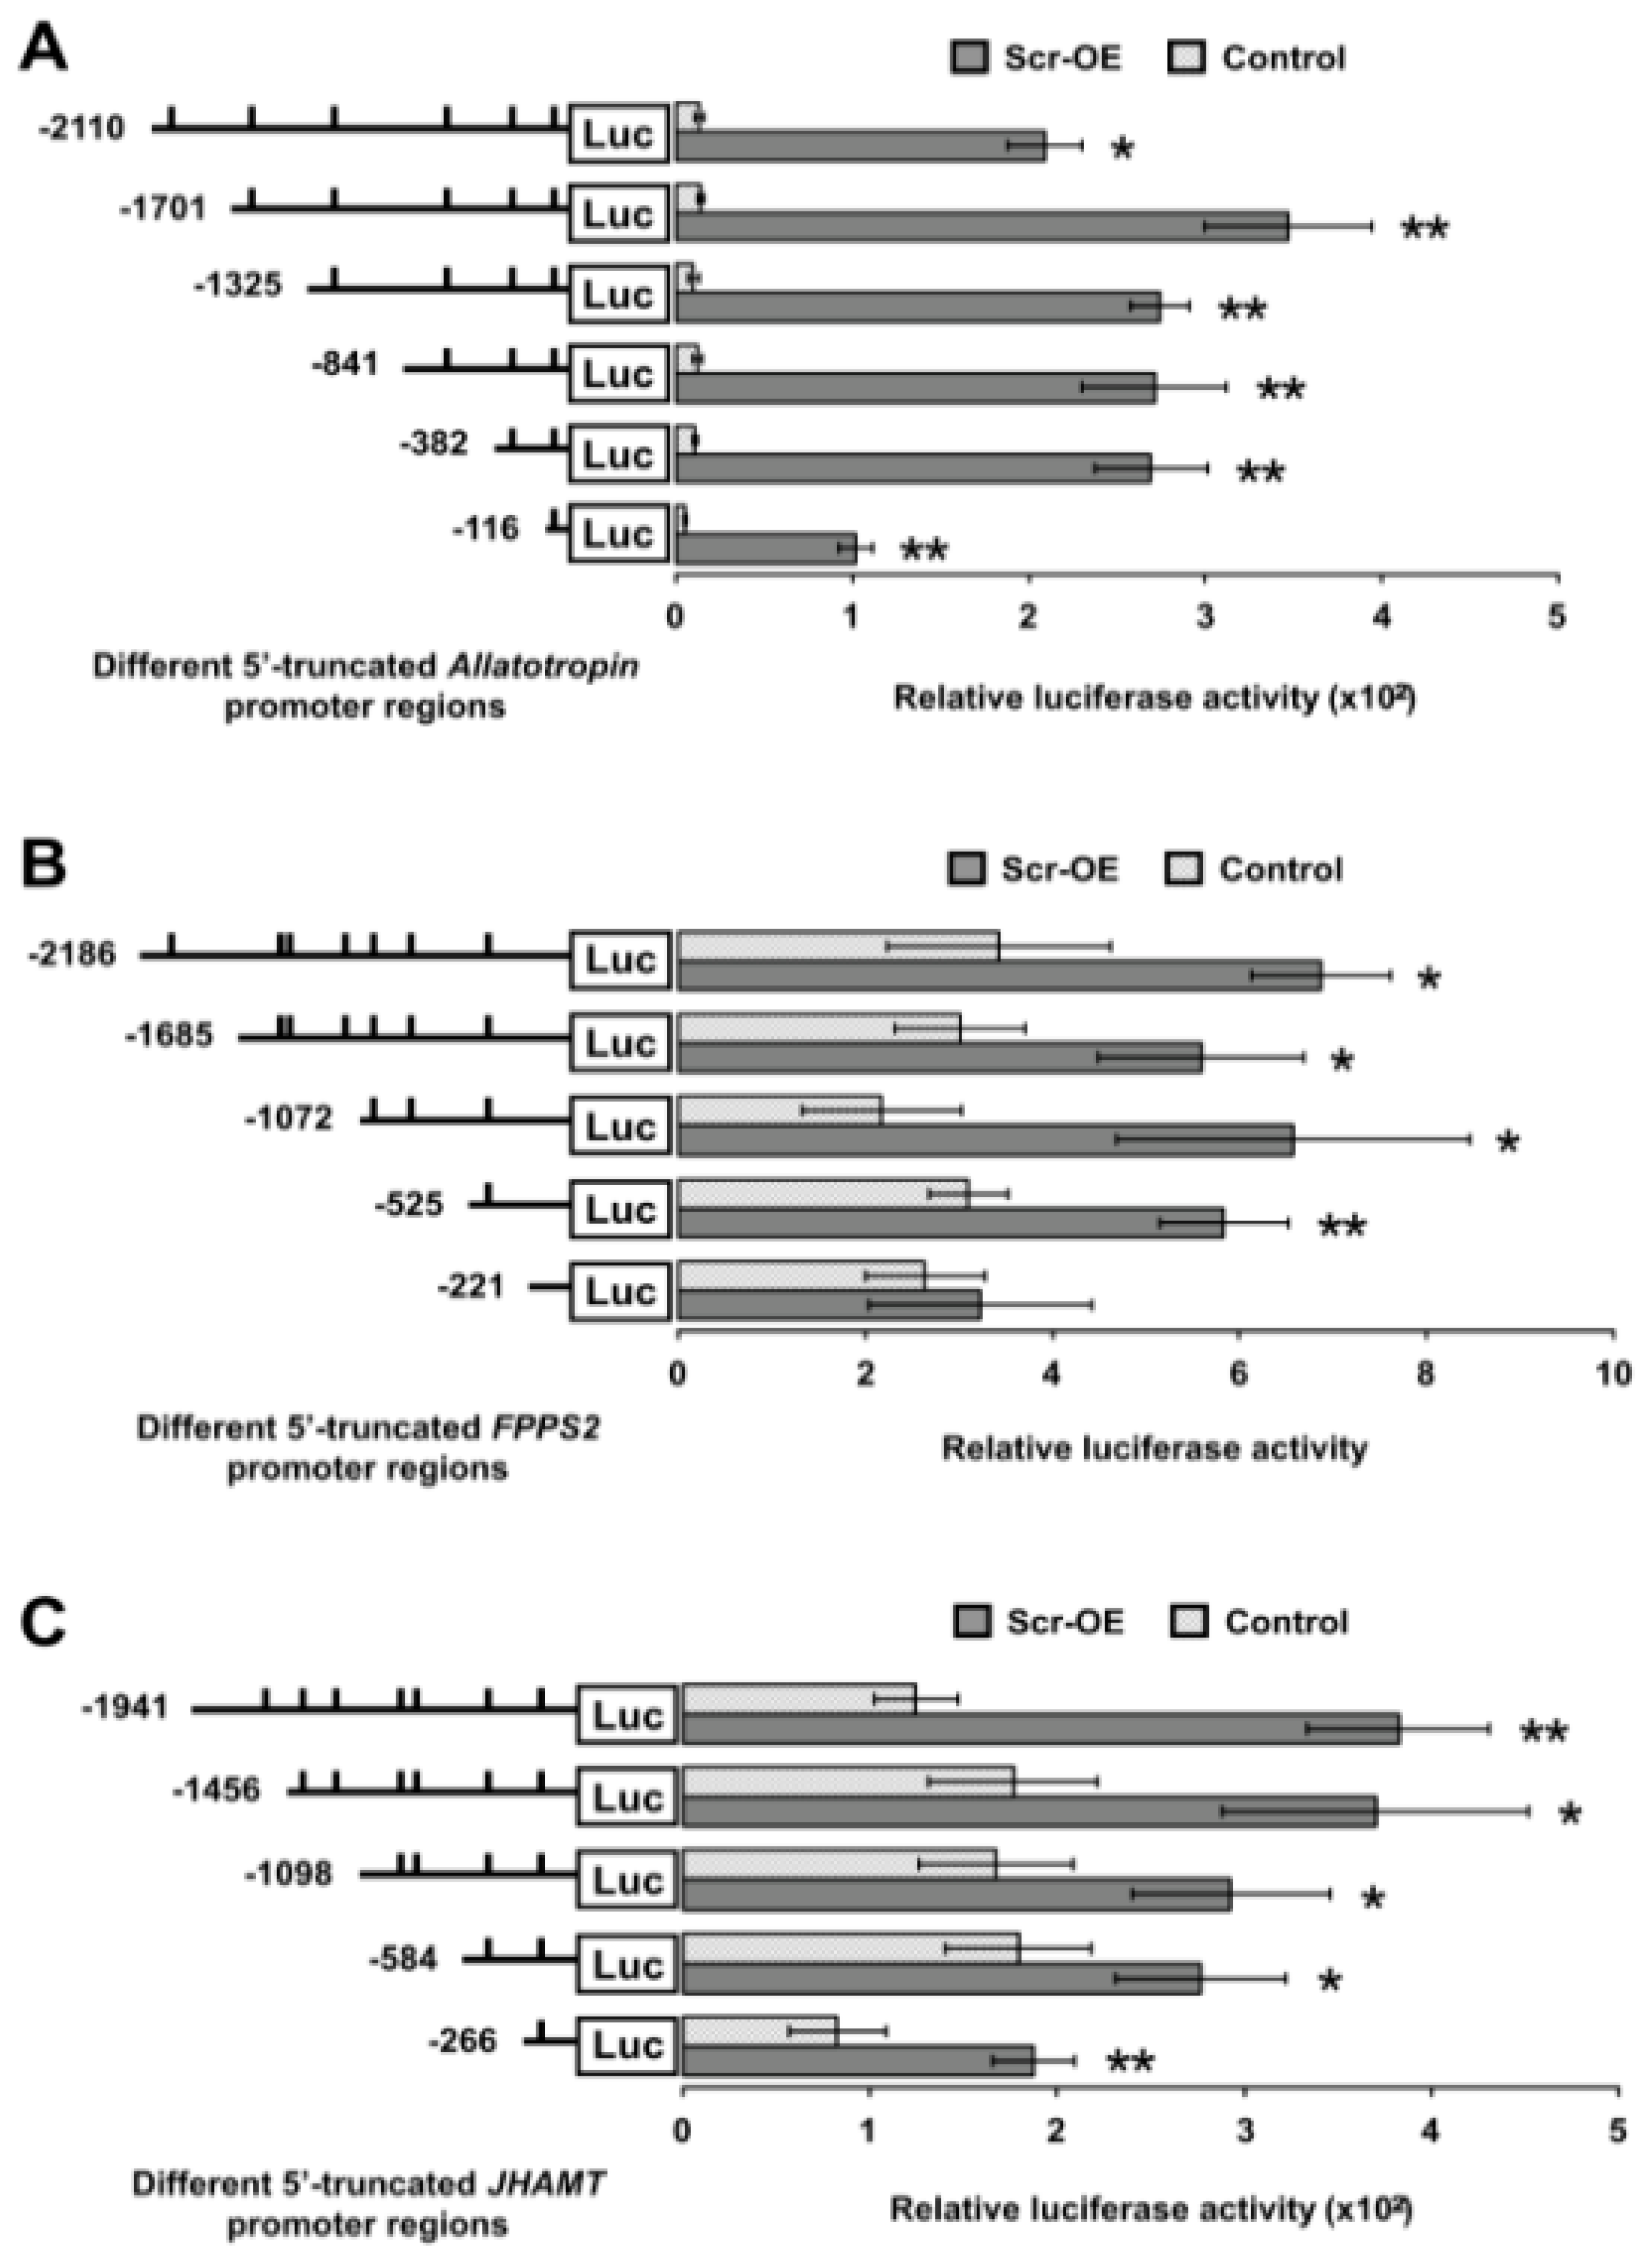
Scr overexpression, thereby suggesting that the potential CREs for the Scr protein in the promoter of these two genes might be located within the shortest promoter region (
Figure 8A,C). In addition, for the
FPPS2 gene, the truncated promoter regions that included fragments that extended beyond position −525 significantly increased luciferase expression after
Scr overexpression, but the truncations shorter than position −221 did not respond to
Scr overexpression (
Figure 8B), thereby indicating that the potential CREs for the Scr protein in the
FPPS2 promoter might be located in the region from position −525 to −221 (
Figure 8B).
Figure 8.
Truncation analysis of Scr-mediated activities of the promoters of genes involved in JH biosynthesis. (A) The effects of Scr overexpression on the luciferase expression driven by several 5′-truncated promoters of the Allatotropin gene. Luciferase reporter analysis in BmE cells indicated that every truncated promoter of Allatotropin significantly increased the luciferase expression after Scr overexpression; (B) The effects of Scr overexpression on the luciferase expression driven by several 5′-truncated promoters of the FPPS2 gene. Luciferase reporter analysis in BmE cells indicated that the four longer truncated promoters of FPPS2 significantly increased the luciferase expression after Scr overexpression, whereas the increase was not significant when the luciferase expression was driven by the shortest truncated promoter; (C) The effects of Scr overexpression on the luciferase expression driven by several 5′-truncated promoters of the JHAMT gene. The luciferase reporter analysis in BmE cells indicated that every truncated promoter of JHAMT significantly increased the luciferase expression after Scr overexpression. The predicted CREs for homeodomain transcription factors are indicated by short lines. Luc, luciferase; OE, overexpression. The error bars represent the mean ± S.E. (n = 3). The significance of the difference between data sets was calculated using two-tailed Student’s t-test. * p < 0.05; ** p < 0.01, compared with the control.
![Ijms 16 25945 g008]()
To confirm whether Scr can bind directly to the CREs on promoter regions of the three JH biosynthesis-related genes, we performed an electrophoretic mobility shift assay (EMSA) using the recombinant His-SUMO-Scr protein and 5′-Cy3-labeled oligonucleotide probes that contained the potential CRE for the Scr protein in the promoter of each gene (
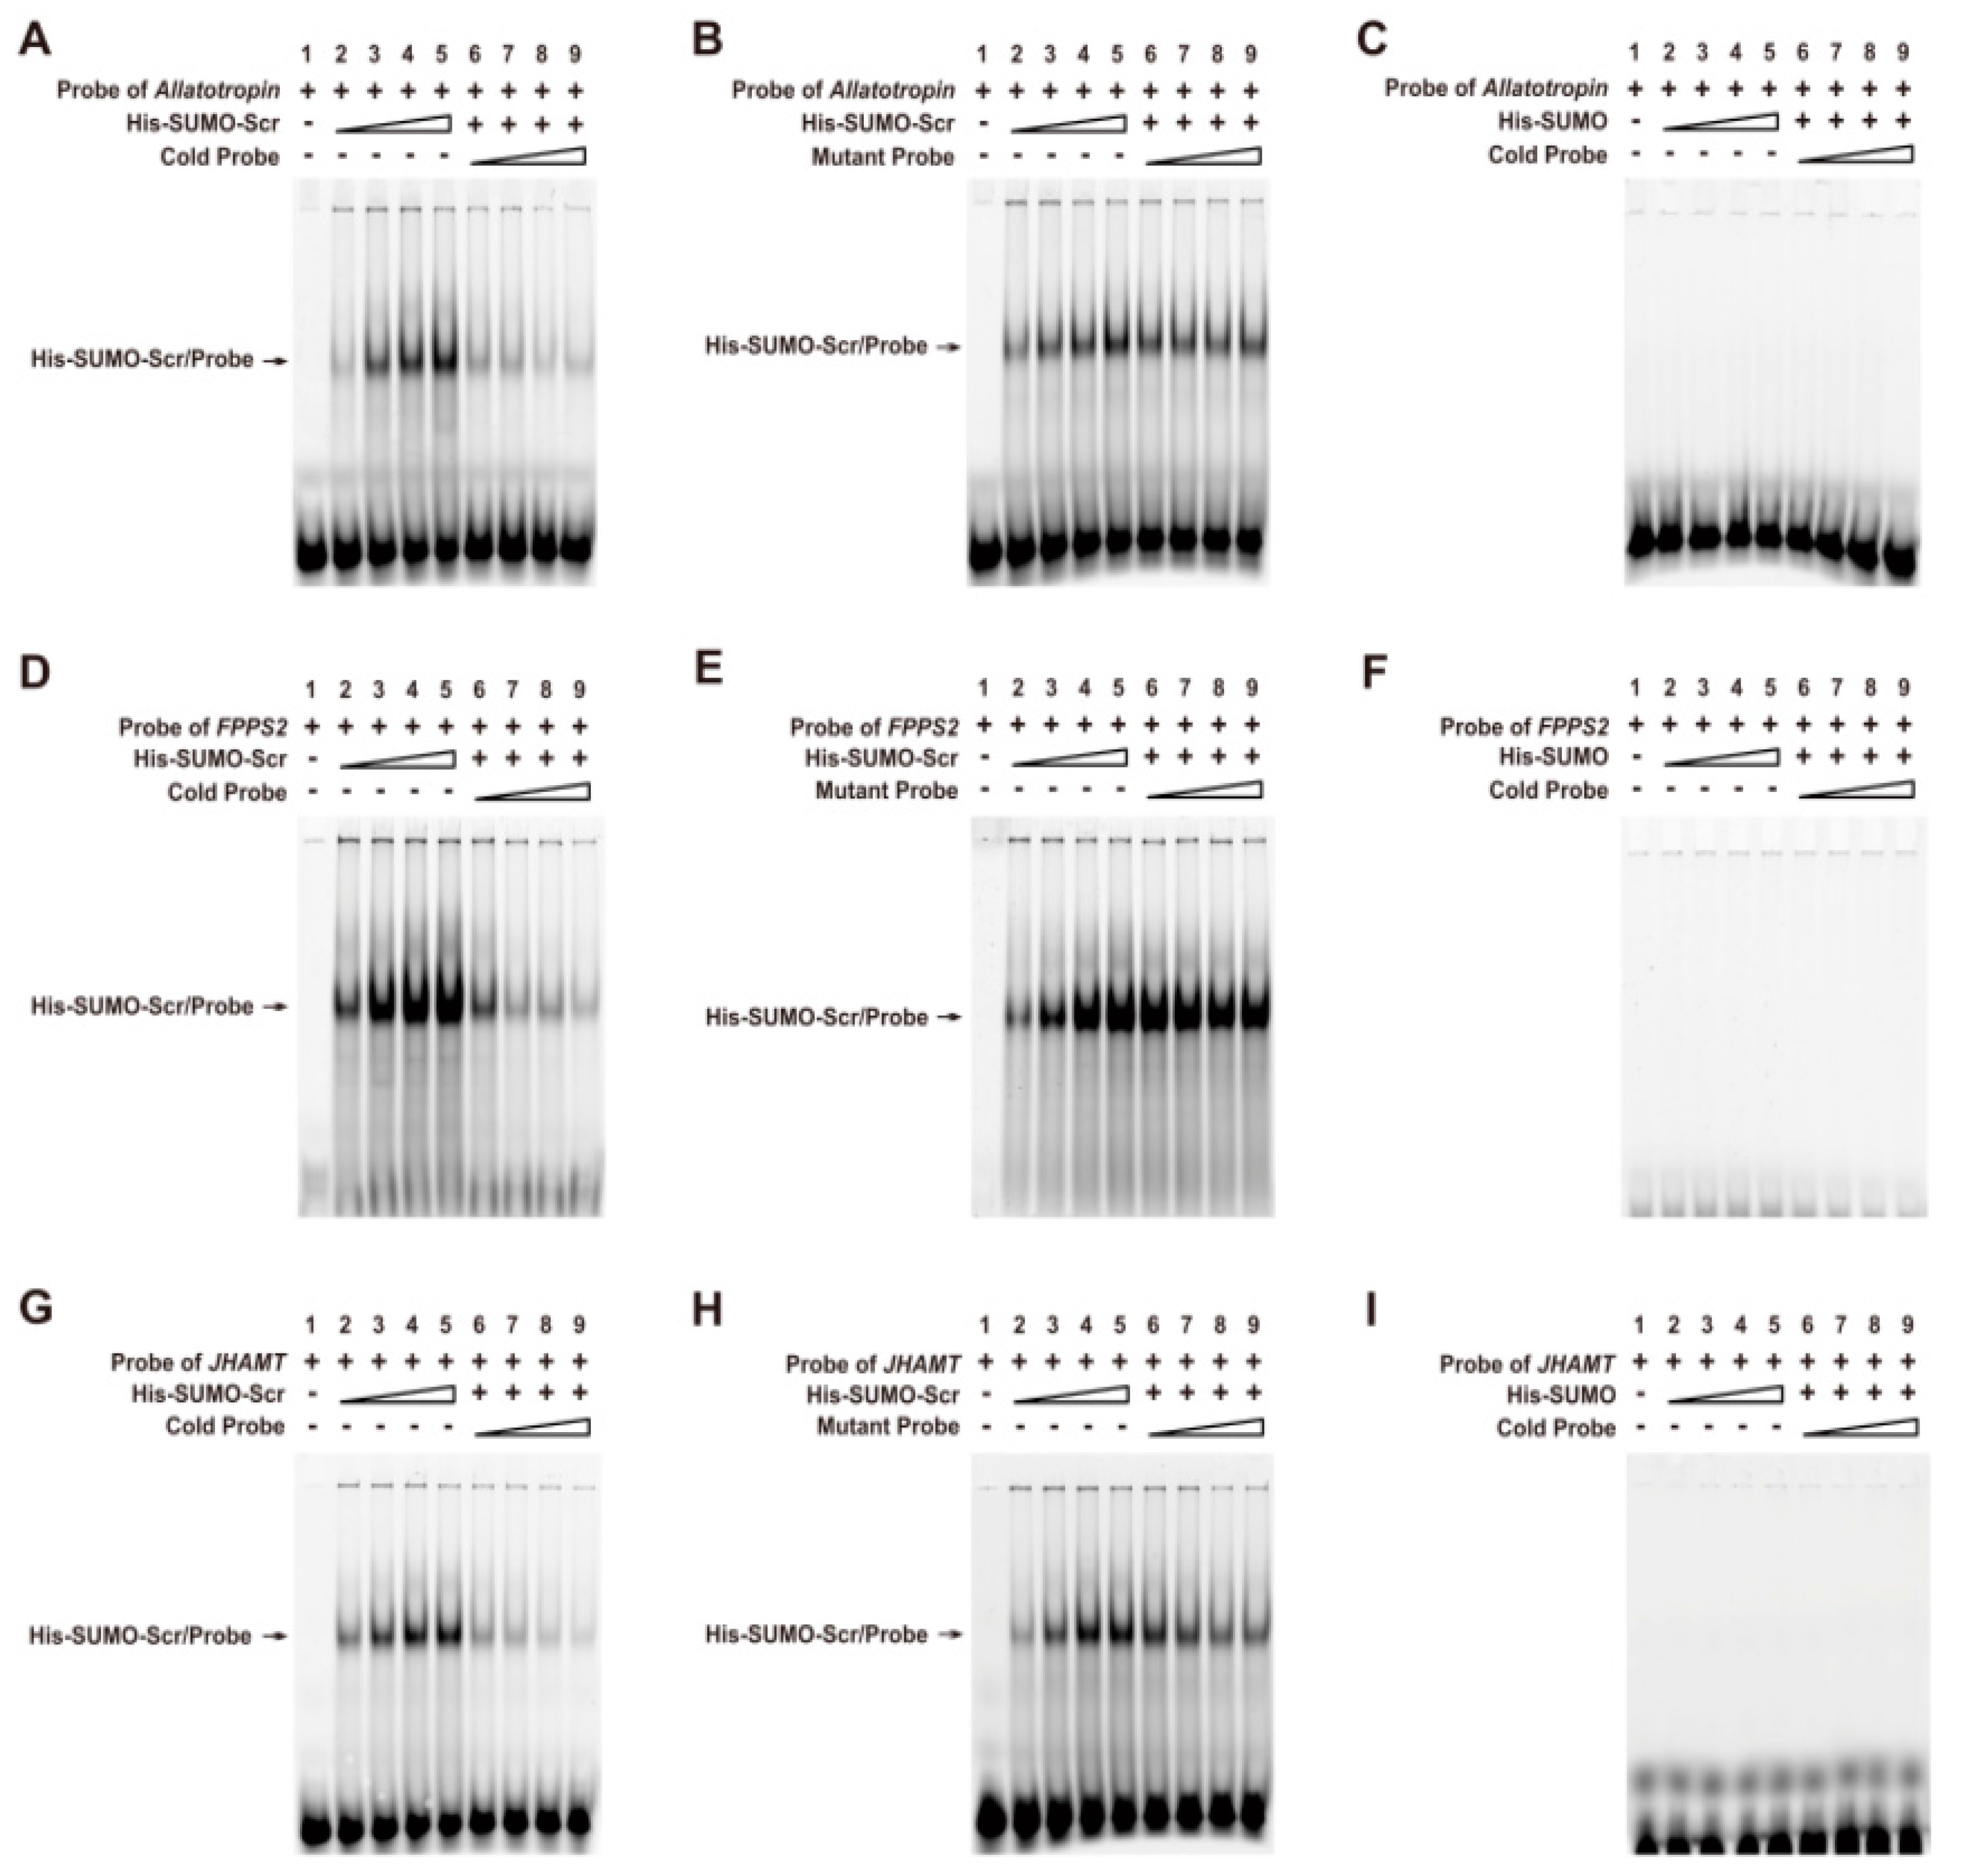
Table S3). As expected, the His-SUMO-Scr protein could bind directly to all three of the labeled probes in a dose-dependent manner, and this binding could be competitively suppressed by the unlabeled cold probes (
Figure 9A,D,G). However, the unlabeled mutant probes could not competitively suppress this binding (
Figure 9B,E,H). Moreover, the His-SUMO tag alone could not bind to the labeled probes (
Figure 9C,F,I). These findings demonstrate that Scr regulates the transcription of genes involved in JH biosynthesis of the silkworm by directly binding to the CREs on their promoters.
Figure 9.
Direct binding of the Scr protein to the CREs in the promoters of genes involved in JH biosynthesis. (A,D,G) A series of EMSAs indicated that recombinant His-SUMO-Scr bound in a dose-dependent manner to the labeled probes in the promoters of Allatotropin, FPPS2, and JHAMT, and the binding could be competitively suppressed by the respective unlabeled probe; (B,E,H) The unlabeled mutant probes could not suppress the binding of the recombinant His-UMO-Scr to the labeled probes; (C,F,I) The His-SUMO tag alone could not bind to the labeled probes. The stepped shapes mean the increasing does of the recombinant proteins, the cold probes or the mutant probes respectively.


 and
and 