Article

GHRH, PRP-PACAP and GHRHR Target Sequencing via an Ion Torrent Personal Genome Machine Reveals an Association with Growth in Orange-Spotted Grouper (Epinephelus coioides)

1
State Key Laboratory of Biocontrol, Institute of Aquatic Economic Animals, and the Guangdong Province Key Laboratory for Aquatic Economic Animals, Sun Yat-Sen University, Guangzhou 510275, China
2
Guangdong Provincial Key Lab of Molecular Breeding in Marine Economic Animals, BGI, Shenzhen 518083, China
*
Author to whom correspondence should be addressed.
Int. J. Mol. Sci. 2015, 16(11), 26137-26150; https://doi.org/10.3390/ijms161125940
Submission received: 27 August 2015 / Revised: 20 October 2015 / Accepted: 20 October 2015 / Published: 2 November 2015
(This article belongs to the Special Issue Fish Molecular Biology)

Abstract

:
Growth hormone-releasing hormone (GHRH) and the receptor, GHRHR, constitute important components of the hypothalamus-pituitary growth axis and act on the downstream growth hormone (GH). PACAP-related peptide/pituitary adenylate cyclase activating polypeptide (PRP-PACAP) is a paralog of GHRH. These genes all play key roles in development and growth patterns. To improve the quality of cultured fish strains, natural genetic variation must be examined and understood. A mixed linear model has been widely used in association mapping, taking the population structures and pairwise kinship patterns into consideration. In this study, a mass cross population of orange-spotted grouper (Epinephelus coioides) was examined. These candidate genes were found to harbor low nucleotide diversity (θw from 0.00154 to 0.00388) and linkage disequilibrium levels (delay of 50% within 2 kbp). Association mapping was employed, and two single-nucleotide polymorphisms (KR269823.1:g.475A>C and KR269823.1:g.2143T>C) were found to be associated with growth (false discovery rate Q < 0.05), explaining 9.0%–17.0% of the phenotypic variance. The association of KR269823.1:g.2143T>C was also found via haplotype-based association (p < 0.05). The identified associations offer new insights into gene functions, and the associated single-nucleotide polymorphisms (SNPs) may be used for breeding purposes.

1. Introduction

Orange-spotted grouper (Epinephelus coioides) belongs to the Serranidae family and is broadly found in tropical and subtropical open oceans and seas [1]. It serves as the top predator in calm, shallow waters. In Southeast Asia, it also represents one of the most popular forms of seafood and has considerable economic value. The orange-spotted grouper has been treated as a model species used in the determination of genetic and physiological features of grouper. Their robustness in overcrowded conditions, rapid growth at high temperatures and insufficient supplies of wild caught fish render it one of the most important aquaculture species [2]. Although artificial propagation procedures have been applied in this species, fry in aquaculture production are mainly captured from the wild. The unreliable quality of fry collected from highly diversified environments might contain high genetic diversity and could not meet the demand in practice. The pressure for reliable stocks calls for the development of high quality breeds. No effective breeding program that improves the genetic quality of this species currently exists, though sporadic reports have been published on the issue. You et al. [3] constructed the first high-density genetic linkage map, and Wei et al. [4] and Huang et al. [5] examined the association between the Leptin gene and growth patterns.
Generally speaking, linkage mapping based on families has been used as a standard approach for the genetic improvement of aquaculture species [6]. However, this species is a protogynous hermaphrodite with a relatively long reproduction cycle, which hinders the establishment of families, and the species is also characterized by a short culture history and by a relatively small commercial breeding population. Thus, association mapping serves as an alternative way to locate genes underlying growth and development patterns [7]. Association mapping methods are preferable in that no segregating population needs to be constructed and mapping resolutions used can be higher relative to those used in family-based linkage mapping. Mixed linear model (MLM) approaches have been introduced as improved means of simultaneously accounting for population structures and unequal relatedness between individuals relative to general linear models, which were used by Wei et al. [4] and Huang et al. [5]. MLM-based methods have been widely employed to study human diseases [8] and plant and animal breeding patterns [9,10], typically through genome-wide association studies (GWAS) aided by highly effective genotype technologies. Meanwhile, approaches focusing on candidate genes have also been widely applied, mainly in consideration of cost and resolution levels [11,12]. Association mapping can make use of crossovers in history, and the linkage disequilibrium (LD) levels determine mapping resolutions and costs to a certain extent. Typically, LD delays with selfing species distance are long, and haplotype blocks can be larger (e.g., Arabidopsis thaliana [13]). Thus, association mapping in such species requires the use of fewer markers to cover an entire genome or target region. For outcrossing species (e.g., the orange-spotted grouper), LD levels may be low, and resolution levels may be higher. Thus, more intensive markers are needed to dissect genomic sequence functions. Though widely used in human disease dissection and for plant genetic improvements, MLM-based association mapping has been less frequently applied to the study of marine fish. Recently, this method has been used to map disease resistance traits in rainbow trout [14] and to map growth in Asian seabass [15].
Marker-assisted selection (MAS) methods always focus on genes that control important phenotypes in the agricultural sector. The growth hormone-releasing hormone (GHRH), PACAP-related peptide/pituitary adenylate cyclase activating polypeptide (PRP-PACAP), and GHRH receptor (GHRHR) genes have been widely studied in the field of physiology (including in the orange-spotted grouper [16]) and are supposed to control growth hormone (GH) release. The ancestral PRP-PACAP gene duplicates into two copies and independently mutates into GHRH and PRP-PACAP, and two copies of PRP-PACAP are produced via actinopterygian-specific genome duplication [17]. The primary function of mammalian GHRH is to stimulate GH synthesis and secretion from the pituitary by binding to its receptor, GHRHR [16]. PRP and PACAP are encoded within the same precursor protein, PRP is reported to regulate reproduction [18] and PACAP is involved in circadian rhythms, learning and memory processes, and in neurite outgrowth, cell differentiation, and proliferation [19]. Mutations in GHRH [20], GHRHR [21], and PRP-PACAP [22] genes have been reported to influence growth patterns, and reports have largely focused on domestic animals.
In recent decades, sequencing technologies have altered research methods. Several markers have been used to dissect genomes, including those of restriction fragment length polymorphism (AFLP), random amplified polymorphic DNA (RAPD), simple sequence repeat (SSR), and single-nucleotide polymorphism (SNP). Since 2005, next-generation sequencing approaches have accelerated research on genomic sequences. SNPs markers have grown popular owing to the advantages of high-density in genome and to their ease of development with the assistance of robust high-throughput sequencing tools. Ion Torrent Personal Genome Machine (PGM) is one of these high-throughput sequencing platforms and was released at the end of 2010 [23]. With no requirements for fluorescence and camera scanning, it is more efficient, cheaper, and smaller in size [24]. It is notable that its limited throughput renders the platform suitable for use in small genomic or target sequencing, and its three differently priced sequencing-chip reagents render it more flexible, though PGM is less accurate when determining homopolymers [25]. Since its release, the platform has been widely used for medical diagnoses of target [26] and bacteria genome sequencing [27].
Based on limited research previously conducted on orange-spotted grouper population and genetic attributes, the GHRH, GHRHR and PRP-PACAP genes were used to examine nucleotide diversity and LD levels at the gene scale. MLM-based association mapping was performed to dissect growth traits in individuals of a mass cross breeding population. This basic study on these four genes will provide information on population characteristics while promoting the selection breeding of this species.

2. Results

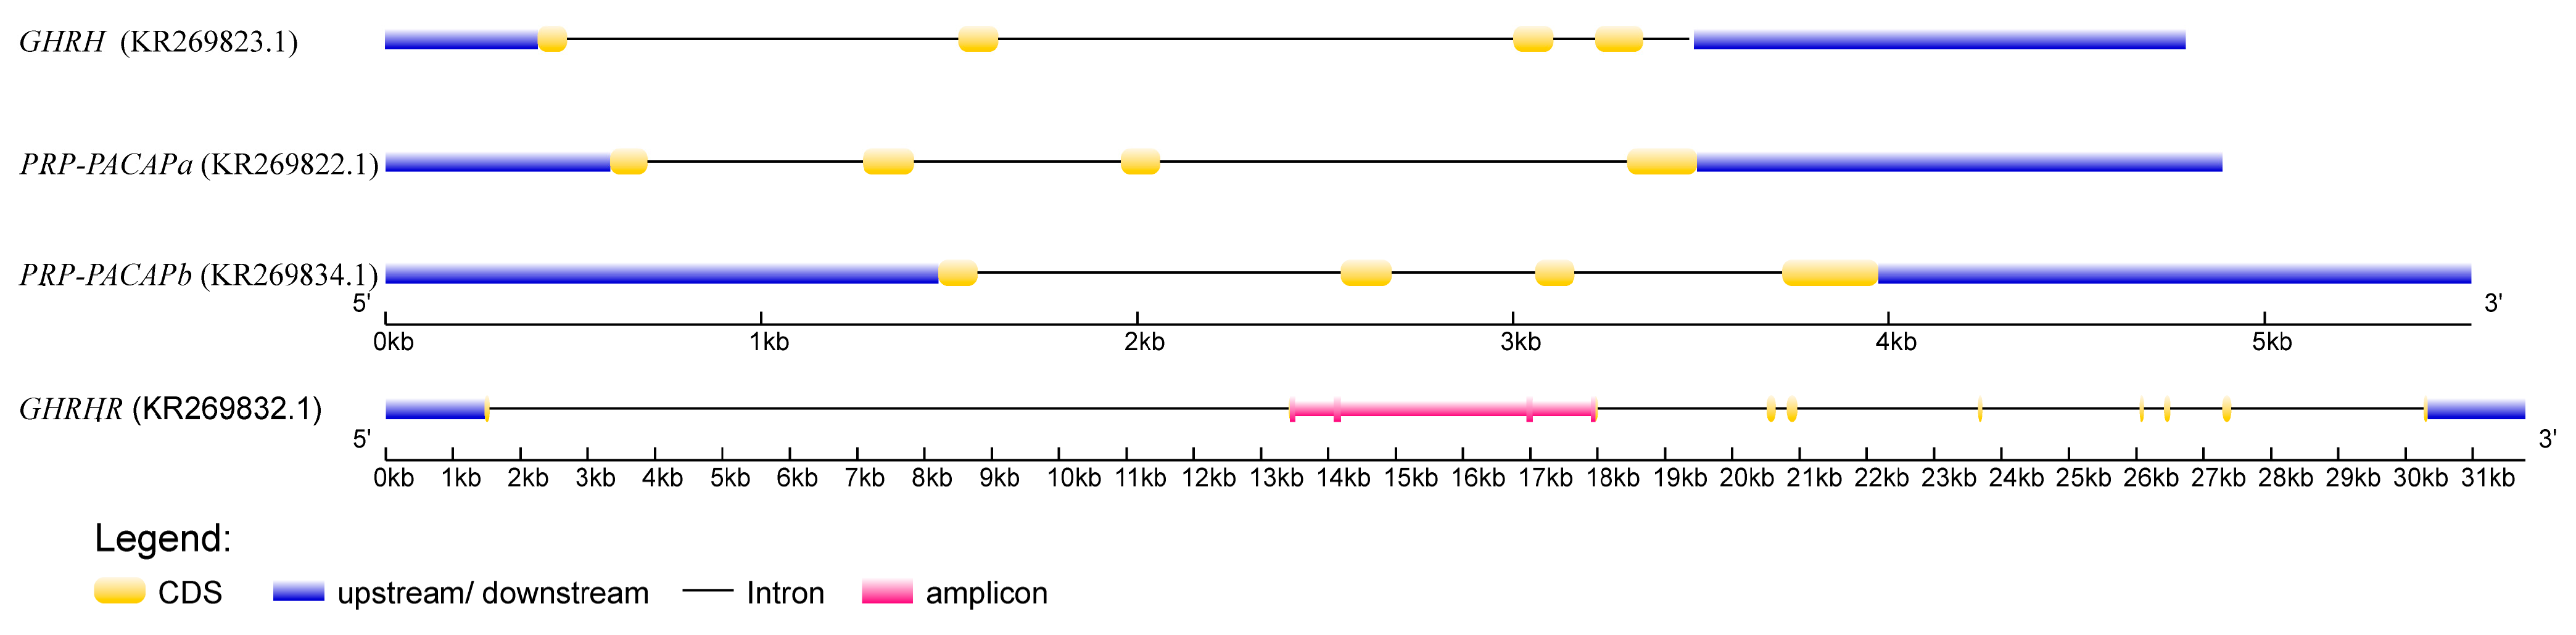
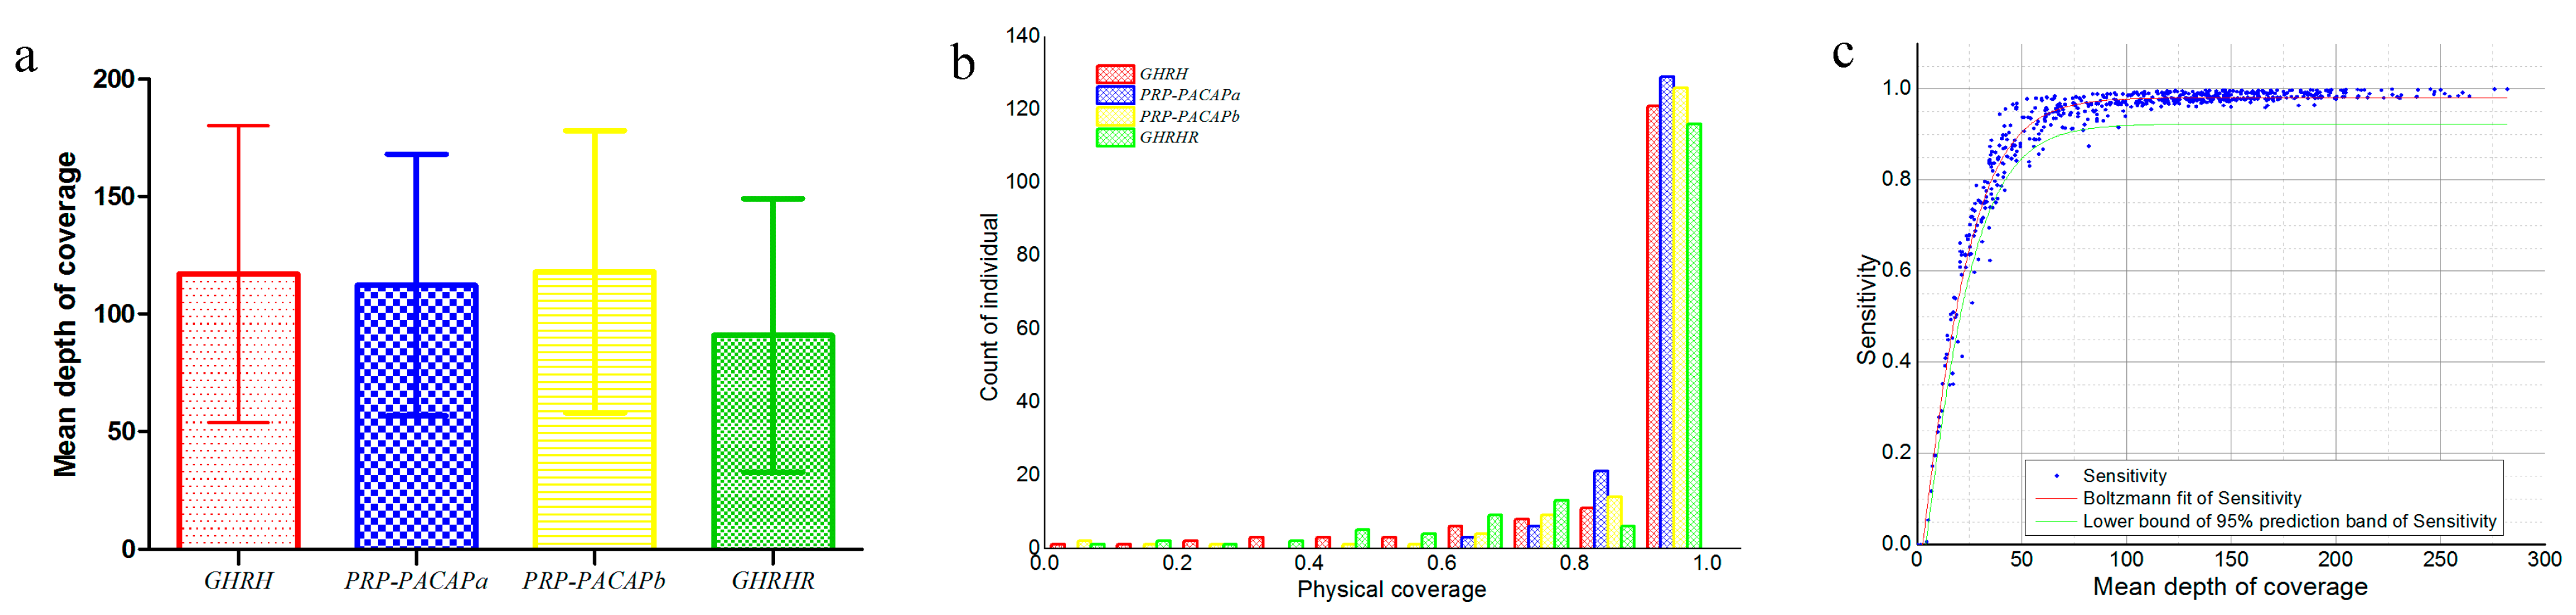
2.1. The Phenotype and Genotype

The morphometric characteristics of 159 individuals were examined in this study. The maximum value was roughly two to three times that of the minimum value for each trait. Among the 12 traits examined, eight traits were normally distributed (p-value > 0.05) among the sampled individuals with four exceptions: caudal peduncle depth (CPD), snout length (SNL), eyeball diameter (ED) and interorbital distance (ID). The eleven recorded traits were significantly positive correlated (p-value < 0.01). Condition factor (K) showed highly significant negative correlations (p-value < 0.01) with total length (TL) and standard length (SL), and was significant negative correlated (p-value < 0.05) with head length (HL), caudal peduncle length (CPL), and interorbital distance (ID).
The structure of four targeted fragments is illustrated in Figure 1. The GHRH gene was found to include five coding regions, and genes PRP-PACAPa and PRP-PACAPb were both found to include four coding regions. The GHRHR includes 13 coding regions. In this study, each of the three fragments (KR269823.1, KR269822.1, and KR269834.1) included all of the coding regions (GHRH, PRP-PACAPa and PRP-PACAPb, respectively). Meanwhile, the KR269832.1 fragment just contains regions of the GHRHR gene’s second to fifth exons. The effective lengths of the amplicons were recorded at 4756, 4852, 5550 and 4280 bp, respectively, and GC contexts were recorded at 36.88%, 41.53%, 40.70% and 40.70%, respectively. The amplicons were subjected to sequencing on the PGM platform. The average read length was found to be 208 bp without excessively short reads (length < 50 bp). Coverage depth and physical coverage (sensitivity) levels were used to assess sequencing performance levels, and sites with depths of at least 10-fold were deemed effective sites in calculating physical coverage levels. In summary, mean coverage depth and sensitivity levels were found to be 110 ± 60-fold and 0.90 ± 0.16 (mean ± SD), respectively. Average coverage depths for each fragment are listed in Figure 2a. In total, 85.8% amplicons achieved sensitivity levels of at least 80% (Figure 2b). The two individual and fragment factors significantly influenced mean coverage depth and sensitivity levels of each amplicon (Table 1). Clearly, more variance was introduced from the fragment than from the individual. The mean variance of the mean coverage depth from the fragment was found to be 2.61 times that from the individual, and the mean variance of sensitivity from the fragment was recorded at 2.21 times of that from the individual.
Figure 1. Illustration of the structure of the candidate genes. Fragments of the growth hormone-releasing hormone (GHRH) and PACAP-related peptide/pituitary adenylate cyclase activating polypeptide a (PRP-PACAPa) and b (PRP-PACAPb) genes included entire genes, and fragment from the GHRH receptor (GHRHR) gene is denoted by a pink line. Sequences of these four fragments were submitted to NCBI, and accession numbers were KR269823.1, KR269822.1, KR269834.1 and KR269832.1, respectively.
Ijms 16 25940 g001
Figure 2. (a) Summary of coverage depths of the four fragments (mean ± SD); (b) Summary of amplicon physical coverage (sensitivity) levels. The effective site was considered when the coverage depth was less than 10-fold; and (c) Plot of the relationship between mean coverage depth and sensitivity levels. The regression curve was fit with the Boltzmann function, and the lower boundary of the 95% prediction band of sensitivity is shown. Data were collected from all of the amplicons.
Ijms 16 25940 g002
Table 1. Two-way analysis of variance on individual and fragment effects on mean coverage depths and sensitivity levels for each amplicon.
SourceSum of SquaresDegrees of FreedomMean SquareFp-Value
Mean coverage depth
Individual1,543,2301589767.286.7861371.8 × 10−59
Fragment76,483325,494.4417.713096.5 × 10−11
Error682,2274741439.30
Total2,301,941635
Sensitivity
Individual7.79331580.04932.7940091.0 × 10−17
Fragment0.327730.10926.1875254.0 × 10−4
Error8.36794740.0177
Total16.4889635
The relationship between sensitivity and the mean coverage depth was fitted to a non-linear regression model. A correlation coefficient (r2) of 0.94 was found, denoting that the relationship is well depicted by the model and that the estimated function may be used to predict the range of sensitivity (Figure 2c). Regression parameters x0 and dx were estimated as 19.342 ± 0.244 and 11.631 ± 0.238 (mean ± SE), respectively. When the mean coverage depth exceeds 50-fold, sensitivity levels should be larger than 0.80, and when the mean coverage depth exceeds 100-fold, the sensitivity should increase to 0.90.
The SNPs were determined individually. In total, 338 SNPs were found in the four fragments at a frequency of 17 SNPs per kilo base pair. Of these SNPs, 17 were found in coding regions, with 13 being non-synonymous sites (Table 2).
Table 2. Nucleotide polymorphisms in the PRP-PACAPa, PRP-PACAPb, GHRH and GHRHR genes.
RegionNumber (bp)Number of Polymorphic SitesNucleotide DiversityTajima’s D cFu’s FsdN/dS d
πθwFspStatp
GHRH (KR269823.1)Synonymous101.6620.001650.00310−0.59938
Silent b4431.661120.003620.00399−0.27736
Non-synonymous324.3450.002100.00243−0.24643
Total gene a47561170.003520.00388−0.28353−126.8560.0000.2500.803
PRP-PACAPa (KR269822.1)Synonymous127.0000.000000.00000NA
Silent b4457.00810.003180.002870.00267
Non-synonymous395.0010.000060.000400.00267
Total gene a4852820.002920.002670.00267−134.5140.0001.0290.305
PRP-PACAPb (KR269834.1)Synonymous134.8200.000000.00000NA
Silent b5084.82530.001070.00164−1.01201
Non-synonymous465.1810.000160.00034−0.50730
Total gene a5550540.000990.00154−1.02345−73.2750.0000.0001.000
GHRHR (KR269832.1)Synonymous82.1920.002660.00384−0.39137
Silent b4009.19790.002850.00311−0.24244
Non-synonymous265.8160.003110.00356−0.24054
Total gene a4280850.002870.00313−0.25251−46.1970.0000.2020.840
a The total number of fragment sites was assessed; b Silent substitutions were considered in coding and noncoding regions; c All Tajima’s D values were not significant (p > 0.10); d The ratio of the rates of non-synonymous and synonymous substitution.

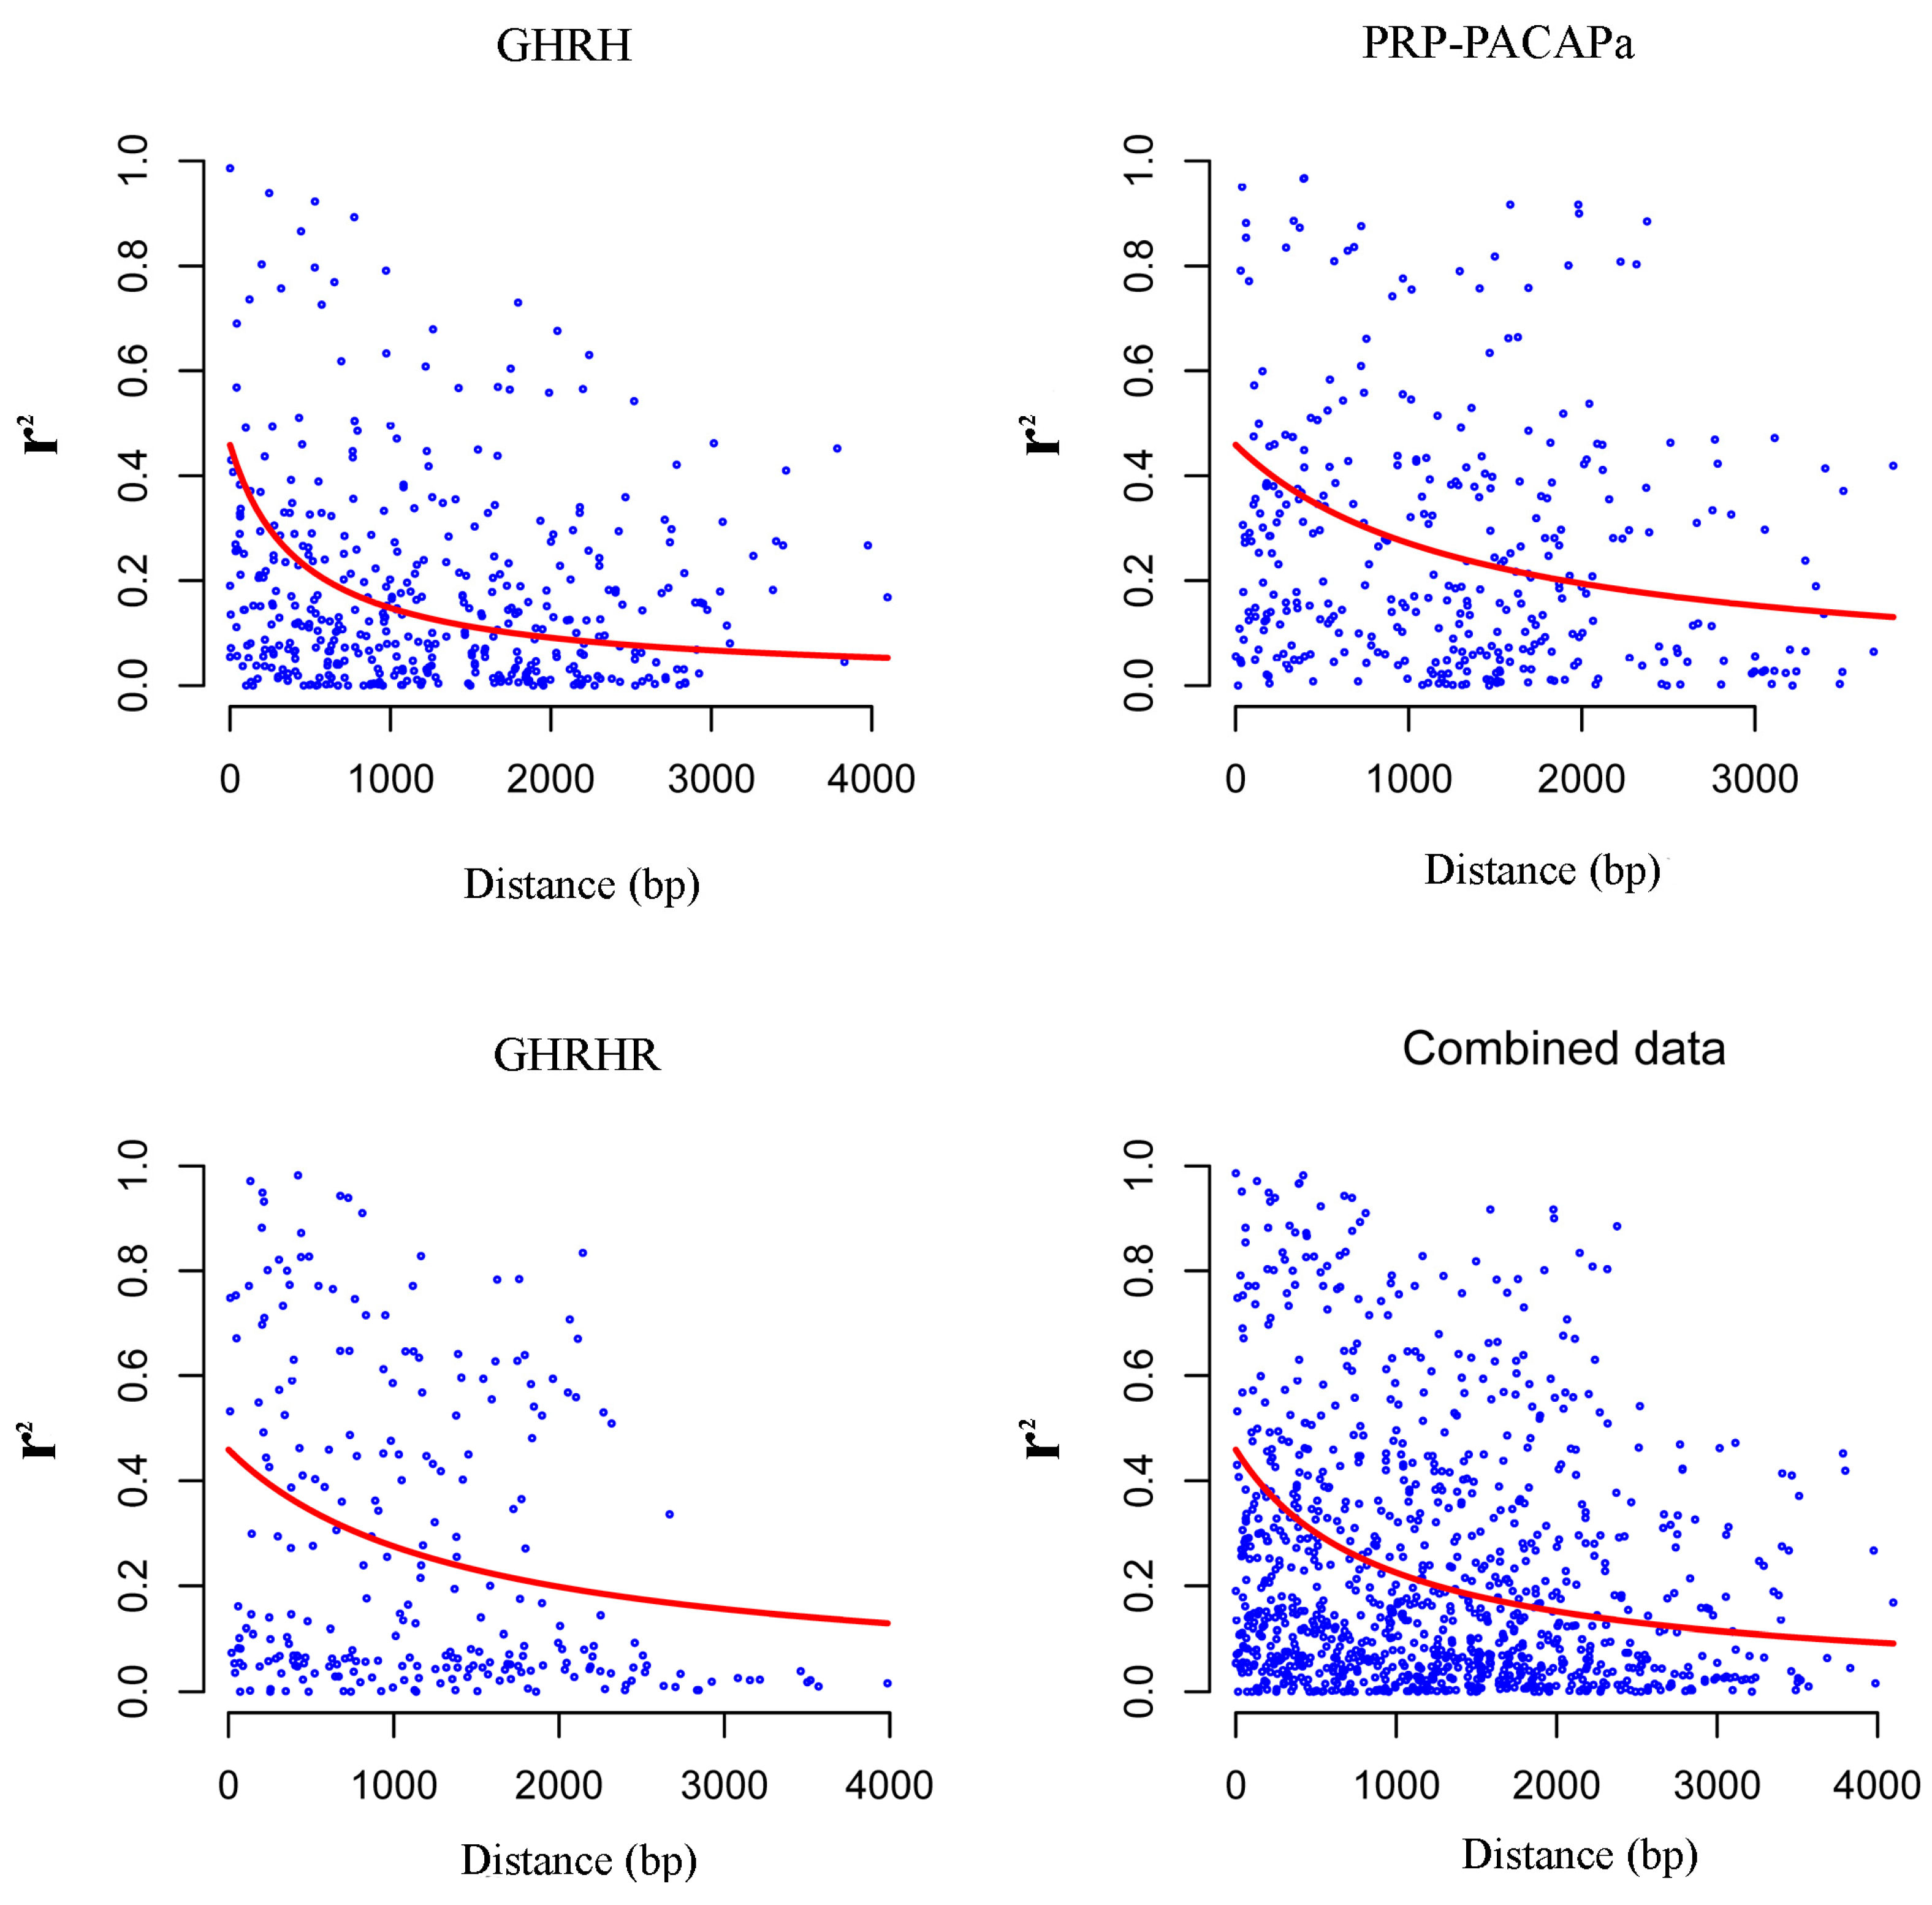
2.2. Nucleotide Diversity and Linkage Disequilibrium

Nucleotide diversity levels (θw) in the four fragments were found to be relatively low, ranging from 0.00154 to 0.00388. The diversity of non-synonymous nucleotide substitutions (θw) was found to be comparable to that of synonymous nucleotide substitutions in the four fragments. Although Tajima’s D value was found to be negative with the exception of PRP-PACAPa, none of the values were found to be significant. Z-tests showed an absence of selective pressure on the four fragments. Fu’s Fs statistic showed significant signals in all four fragments, revealing a pattern of haplotype diversity that deviated from the expectation under neutral conditions.
LD was preferably estimated using high-frequency polymorphisms, and so we restricted the analysis to SNPs with minor allele frequency (MAF) values of at least 10%. Twenty-seven, one, 30 and 23 SNPs remained for PRP-PACAPa, PRP-PACAPb, GHRH and GHRHR, respectively, and the PRP-PACAPb fragment was excluded. Average values of r2 for the three GHRH, PRP-PACAPa and GHRHR fragments were recorded at 0.175, 0.258, and 0.272, respectively. Delay curves were plotted for the three fragments and for the combined data (Figure 3). “Half-length” values of LD for GHRH, PRP-PACAPa, and GHRHR and the combined data were recorded at 460, 1465, 1527 and 963 bp, respectively.
Figure 3. Illustration of the delay in LD for fragments of GHRH, PRP-PACAPa, GHRHR and for the combined data. r2 points with distance are shown, and delay trends are fit to a mutation-recombination drift model.
Ijms 16 25940 g003

2.3. The Relationship between Growth Hormone-Releasing Hormone (GHRH), PACAP-Related Peptide/Pituitary Adenylate Cyclase Activating Polypeptide (PRP-PACAP), Growth Hormone-Releasing Hormone (GHRHR) and Growth Traits

Following extraction, the number of common SNPs was found to be 128. The change in estimated data log probability levels (Ln P(D))) between successive K values was largest when the number of subpopulations (K) was two. Moreover, once the presumed subpopulation quantity reached a value of two, Ln P(D) reached a plateau and increased slightly. Thus the presumed number of subpopulations was set to two. An association was performed, and two markers (KR269823.1:g.475A>C and KR269823.1:g.2143T>C) in the GHRH gene were found to be significantly associated with growth traits (Table 3). The KR269823.1:g.475A>C marker was found in the third position of the first exon’s 24th genetic codon, and the mutation did not cause amino acid changes. This marker was associated with the following five traits: standard length (SL), max body depth (MBD), body weight (BWT), caudal peduncle depth (CPD), and total length (TL), accounting for 16.1%, 12.4%, 17.0%, 9.8% and 13.3% of the total variation, respectively. The KR269823.1:g.2143T>C marker was found in the second intron and was found to be associated with two traits (SL and BWT), which were found to account for 9.2% and 9.0% of the total variation, respectively. Both markers were found to be associated with SL and BWT. Modes of gene action were quantified using the ratio of dominance (d) to additive (a) effects (Table 3). Two marker–trait associations were found to be consistent with partially to fully dominant effects (0.50 < |d/a| < 1.25). The remaining five associations were found to be consistent with additive effects (|d/a| ≤ 0.5).
A haplotype-based association analysis was employed to confirm associations between the identified SNPs in the mixed linear model. A block containing the KR269823.1:g.2143T>C marker and three SNPs (KR269823.1:g.2160A>G, KR269823.1:g.2179C>T and KR269823.1:g.2256G>A) in the GHRH gene was found to be associated with BL (p = 0.0389) and BWT (p = 0.0294) (Table 4). Three common haplotypes (frequency of >1%) were contained in the block. Proportions of phenotypic variation explained by these haplotypes were recorded at 8.96% and 12.34%, respectively.
Table 3. Summary of molecular markers identified via association mapping.
MarkerGeneMutation TypeLocationSiteMAFTraitpQR2 (%)2a 1d 2d/a 1,2
KR269823.1:g.475A>CGHRHSynonymousExon1+720.24SL1.41 × 10−60.000216.13.4989−0.8404−0.4804
MBD3.73 × 10−50.004812.40.8379−0.2173−0.5186
BWT6.10 × 10−70.000117.054.7356−12.8061−0.4679
CPD3.65 × 10−40.04679.80.2052−0.0199−0.1938
TL1.76 × 10−50.002313.33.8517−0.9712−0.5043
KR269823.1:g.2143T>CGHRHUntranslatedIntron2+17400.14SL6.34 × 10−40.04069.21.6475−0.1210−0.1469
BWT7.44 × 10−40.04769.017.93223.59770.4013
The p value, the significance level for the association (with a significance level of p ≤ 0.05), the Q value, a correction for multiple testing (false discovery rate FDR(Q) ≤ 0.05), the R2 value, the percentage of the phenotypic variance explained; MAF, minor allele frequency; SL, standard length; MBD, max body depth; CPD, caudal peduncle depth; TL, total length; 1 2a = |GBB − Gbb|, where Gij is the trait mean of the ijth genotypic class; 2 d = GBb − 0.5 (GBB + Gbb), where Gij is the trait mean of the ijth genotypic class.
Table 4. Haplotypes significantly associated with growth patterns. Around the detected two associated markers, a block was found to be associated with SL and BWT via a haplotype-based method. The KR269823.1:g.2143T>C marker is denoted as SNP15. The block contained the other three SNPs in the downstream of the gene (KR269823.1:g.2160A>G, KR269823.1:g.2179C>T and KR269823.1:g.2256G>A), which are denoted as SNP16, SNP17 and SNP18, respectively. The block covered 114 bp.
MarkerTraitp ValueR2HaplotypeFrequency
KR269823.1:g.2143T>CSL0.03898.96%SNPs15–18
BWT0.029412.34%T_A_C_G0.780
T_G_T_A0.070
C_A_C_G0.128
R2, percentage of the phenotypic variance explained; SL, standard length; BWT, body weight.

3. Discussion

3.1. Target Sequencing

New sequencing methods allow us to process hundreds and thousands of DNA sequences at low costs for each base. However, it is still not feasible to sequence numerous genomes in their entirety due to cost, time constraints, and infrastructure and data storage requirements, especially for non-model genomes. Conversely, linkage and linkage disequilibrium mapping finally focus on sequences of hundreds of thousands to several million base pairs in length, and follow-up fine mapping aims to focus on limited functional genes. Therefore, candidate gene strategies serve as an alternative means for obtaining related markers in non-model species (e.g., the orange-spotted grouper).
PCR-based capturing methods are highly sensitive, consistent and require limited equipment [28]. In this study, four fragments were selected to assess the performance of LR-PCR enrichment approach when applied to the Ion torrent PGM platform. Variance inequality levels in individuals and fragments may reflect the inaccuracy in the process of library preparation and sequencing. The maximum sequencing output for a single individual was found to be 11.2 times that of the minimum one, and this may be attributed to various levels of barcode performance [29], differences between sequencing patches, the amount of DNA loaded for each individual for sequencing and contamination levels. Variance within each fragment is considered mainly attributable to NanoDrop spectrophotometer inconsistencies [30], and variance within each individual is mainly attributed to differing contamination levels, considering more accurate measurement methods employed in standard library construction and sequencing. Overall, the sensitivity of the single amplicon was almost fully determined by the mean coverage depth, and that of numerous amplicons was mainly influenced by variance in the amount of data based on different fragments and less by the specific individuals.

3.2. Nucleotide Diversity and Linkage Disequilibrium

Nucleotide variation serves as the basis of selective breeding, and in this study, nucleotide diversity levels were examined for the four candidate fragments. Nucleotide diversity (π) levels ranged from 0.00099 to 0.00352, and non-synonymous site mutations were far less common than those in the silent site. As reported, the diversity of cultured stock would decrease compared with wild stock [31]. Samples examined in the study were full-sib or half-sib with a limited number of parents, thus constituting a typical model of inbreeding. Thus, the nucleotide diversity of the wild population should be larger than the estimated value in this study. Though the neutral test results based on Tajima’s D were not found to be significant, D values were found to be negative in three of four fragments, indicating existence of more low frequency haplotypes. In addition, a neutral state was confirmed through a Z-test, and negative values may be attributable to demographic history characteristics, e.g., population expansion. Rather, the number of samples was clearly larger than the number of parents, and the population significantly expanded as a result. However, Fu’s Fs method is particularly sensitive to demographic effects [32], and Fu’s Fs statistic for the four fragments was found to be negative and significant. Therefore, we may infer that the negative Tajima’s D value found is mainly attributable to population growth. LD extension levels declined rapidly, and the half-length became less than 2000 bp. We must note that the LD level was up-biased. The population structure was detected using a Bayesian algorithm. Together, population structure and inbreeding features would inflate LD levels [33]. Thus, a rough estimate was used to provide an indication for the survey of the whole genome level of LD.

3.3. Association Mapping of Growth

The mixed linear model has been used for association mapping, which makes it more robust in breeding and the random population. A common concern regarding association mapping pertains to the fact that population structures may trigger false-positive results if not correctly controlled. To control for this risk, population structures must be taken into consideration. However, if a functional allele is correlated with a population structure, population structure control may generate a false negative, particularly for a small sample [34]. Thus, mixed linear models and haplotype-based association mapping methods were employed to detect associations. Although two SNPs (KR269823.1:g.475A>C and KR269823.1:g.2143T>C) in GHRH were found to be significantly associated with growth, the haplotype-based association mapping results repeated this association in only one SNP site (KR269823.1:g.2143T>C) located in the second intron. A possible explanation would be existence of regulatory element on the position [35]. Actually, even though the association methods had identified a SNP significantly, the number of individuals used was rather small and the pedigree was also not clear. All these factors can influence the reliability of the result. So the relation between the SNP and the phenotypes should be confirmed in other independent experiments.

4. Experimental Section

4.1. The Sample and Phenotype Records

An exhaustive description of the sample has already been presented [4]. In brief, 12 females and 29 males from the first generation of wild orange-spotted grouper captured from the South China Sea near Hainan Island were selected to produce a mass cross population. On 10 December 2010, approximately one month after hatching, over 15,000 fry were collected to rear in the same net cage in the fishery area of Haitang Bay in Sanya, Hainan Island. The experimental stock was fed according to management practices of the fishery. On 8 August 2011, the fish were randomly collected, and growth traits were recorded carefully following methods described in Fishbase [36]. Collected data included body weights (BWT), max body depths (MBD), total lengths (TL), standard lengths (SL), head lengths (HL), body widths (BW), caudal peduncle lengths (CPL), caudal peduncle depths (CPD), snout lengths (SNL), eyeball diameters (ED), and interorbital distances (ID). Condition factor (K) was calculated using the following formula: K = 100 × BWT/SL3. Tissues were cut from the caudal fin of each individual and were preserved in 95% ethanol at −20 °C immediately thereafter. Analysis of variance (ANOVA), normal distribution fit, and correlation tests on phenotypic traits was performed using the IBM SPSS Statistics program (Version 19, IBM SPSS, Chicago, IL, USA). Total DNA were extracted according to a modified proteinase K/phenol extraction protocol [37]. DNA quality and quantity were determined using 1% agarose gels and a UV spectrophotometer (Nanodrop2000/2000c, Thermo Scientific, Pittsburgh, PA, USA).

4.2. Candidate Gene Sequencing and SNP Determination

GHRH, PRP-PACAPa, PRP-PACAPb and GHRHR (ID: KR269823.1, KR269822.1, KR269834.1 and KR269832.1, respectively) genes were selected as candidate genes. DNA sequences were retrieved from the genomic sequence of the orange-spotted grouper (unpublished). mRNA sequences were collected from the NCBI database but not for the PRP-PACAPa gene. The mRNA of PRP-PACAPa was predicted in the genomic sequence program of the species and was confirmed through the translated protein. Primer pairs were designed using the Primer Premier 5.0 software program (Premier Biosoft International, Palo Alto, CA, USA) (Table 5). Four pairs of primers were used to amplify DNA from each individual. PCR amplifications were conducted in a final volume of 50 μL containing 10 μL of 5× PrimeSTAR GXL PCR Buffer (Mg2+Plus), 4 μL of dNTPs (2.5 mM each), 2 μL of each primer (10 μM), 1 μL of PrimeSTAR GXL DNA Polymerase (1.25 U/μL, TaKaRa, Dalian, China) and 1 μL of genomic DNA (100–500 ng/μL). PCR reactions were performed in an ABI 2720 thermal cycler (Applied Biosystem, Foster City, CA, USA) under the following thermal cycling conditions: denaturation at 95 °C for 3 min; 10 cycles of amplification for 10 s at 98 °C, for 15 s at 63 to 53 °C (with temperatures decreasing by 1 °C for each circle) and for 6.5 min at 68 °C; 25 cycles of amplification for 10 s at 98 °C, 15 s at 53 °C, and 6.5 min at 68 °C with a final extension at 68 °C for 10 min. Production levels were confirmed using 1% agarose gels, and bands of the predicted size were cut and purified using a Universal DNA Purification Kit (Tiangen Biotech (Beijing, China) Co., Ltd.). The quality of purified amplicons was determined using a UV spectrophotometer (Nanodrop2000/2000c, Thermo scientific). Then, amplicons from the same individual were mixed in equimolar amounts. The enriched target sequences of each individual were sequenced on an Ion Torrent Personal Genome Machine platform at Invitrogen Life Technologies. The single-end library of 200 bp was barcoded and constructed according to requisite instructions. The library was sequenced on PGM using chip 318. Raw sequencing read filtering and trimming tasks were performed using Torrent Suit 3.6 with cut-off values and minimum lengths of reads set to Phred quality 18 and 50 bp levels, respectively. Clean read mapping was performed using BWA version 0.7.5 against DNA sequences of the four fragments.
The sensitivity and mean coverage depth of each amplicon varied greatly. Sources of variance from individuals and fragments were examined via a two-way ANOVA. Furthermore, the relationship between sensitivity levels (S) and mean coverage depths (x) was fitted to a non-linear regression model based on empirical uses of the Boltzmann function in OriginPro software version 9.0 (OriginLab, Northampton, MA, USA). The Boltzmann function was determined as:
S = 1 1 + e ( x x 0 ) / d x + 1
where initial and final sensitivity values are fixed at zero and one, where x0 is the mean coverage depth at which sensitivity levels reach average values between initial and final sensitivity levels and dx is a parameter that describes the shape of the curve between upper and lower asymptotes [38].
Table 5. Primers of the four genes (four fragments).
IDGeneForward 5′ to 3′Reverse 5′ to 3′Amplicon Length 3GenBank Accession Number or Predicted (mRNA)
KR269823.1GHRH 1TGTGGGAGTGACTGGGAGCGAGACACGCACAATACCAG4756GU966634.1
KR269822.1PRP-PACAPa 1GATGCACTCCAATGGGACGAGTCGTCTGCACAGATG4852predicted
KR269834.1PRP-PACAPb 1GACTGCTCCTTCTTGGTTAATTTGTCTCCTGCTCTTCCT5550AY869693.1
KR269832.1GHRHR 2GCTTTGTCGAGCCTGCACCCAACACAGCAACAACCAGC4280GU966635.1
1 The amplicon includes the entire CDS; 2 The amplicon includes part of the gene; 3 The number excludes the length of the two primers at the end of the amplicon.
SNPs for each individual were determined using Samtools version 0.1.19. High-quality SNPs were identified using the following criteria: (1) base quality levels should be greater than or equal to 20 (Phred scale); (2) map quality levels (MAQ) should be greater than or equal to 20 (Phred scale); (3) SNP coverage level should be greater than or equal to 10-fold; (4) SNP quality levels should be greater than or equal to 20; (5) a mutation with a ratio of variant coverage (variant/total) from 10% to 90% should be defined as a heterozygous variant; and (6) INDEL (insertion and deletion) should not be included. Physical coverage (sensitivity) is defined as the percentage of the segment length with a depth of at least 10-fold.

4.3. Nucleotide Diversity and Linkage Disequilibrium

The missing genotypes and haplotypes were inferred using PHASE 2.1.1 [39] for each fragment. Varying recombination rates were applied, and burn-in and iteration quantities were set to 100 and 100, respectively. The haplotype probability threshold was set to 0. Nucleotide diversity levels were estimated as π [40] and θw [41] using DnaSP software version 5.10 [42]. π was defined as the average number of nucleotide differences per site between two sequences, and θw was defined as the average number of segregating sites per site. Allele frequency spectra were estimated as Tajima’s D. Fu’s Fs were used to detect deviations from neutrality [43]. The number of nonsynonymous substitutions per nonsynonymous site (dN) and the number of synonymous substitutions per synonymous site (dS) were computed using the Nei–Gojobori method [44]. The null hypothesis “H0:dN = dS” was tested using a Z-test available through the MEGA program version 6.0 [45].
Linkage disequilibrium (LD) patterns between each pair of detected SNPs in the same fragments were assessed using the Haploview 4.2 program [46]. Squared allele-frequency correlations (r2) were estimated between sites at an MAF value of greater than 0.1. r2 Decay with distance was evaluated via nonlinear regression. The expected value of r2 under a mutation-recombination drift model was determined as:
E ( r 2 ) = [ 10 + C ( 2 + C ) ( 11 + C ) ] [ 1 + ( 1 + C ) ( 12 + 12 C + C 2 ) n ( 2 + C ) ( 11 + C ) ]
where n is the sample size and where C = 4Nc. The nonlinear model contains a single coefficient that is the least-squares estimate for C for each bp distance between sites [47]. The “half-length” of LD, as a measure of how far significant LD reaches, was defined as the distance at which mean r2 levels dropped by 50%.

4.4. Associations between the Single-Nucleotide Polymorphisms (SNPs) and Phenotype

The detected SNPs were extracted using the following criterion: (1) MAF > 0.05; (2) the ratio of missing data <20%. Structure association mapping was performed using a mixed linear model (MLM) available through the TASSEL software program version 5.1.0 [48]. Pairwise kinship coefficients and population structures were estimated from 252 random SNPs of restriction-site associated DNA sequencing (unpublished). Each random SNP was located on different scaffolds. Pairwise kinship coefficients were estimated using the SPAGeDi software program version 1.3a [49]. The population structure was inferred using the Structure software program version 2.2 [50]. The presumed number of subpopulations (K) was set to between one and 12. Twenty independent runs for each K value were performed using the admixture ancestry model and correlated allele frequency model. For each run, the initial burn-in period was set to 750,000 and was followed by 500,000 MCMC iterations. The most likely K value was denoted by ΔK, which showed the change in estimated data log probability levels (Ln P(D)) between successive K values [51]. Polymorphisms with Q values of <0.05 were deemed significantly related sites after SNPs were filtered based on the false discovery ratio [52]. The percentage of phenotypic variation (R2) explained by each SNP was estimated using the following formula: R2 = SSt/SST × 100%, where SSt is the variance explained by the marker and where SST is the total variance. The gene action model was qualified using the ratio of dominance (d) to additive (a) effects [53].
The SNPs around significantly associated sites were combined to determine the block associated with growth. A haplotype-based association analysis was performed via haplotype trend regression (HTR) [54]. Haplotype frequencies were estimated using the expectation maximization (EM) algorithm. An overlapping sliding window used in the four markers approach was employed to test the association, and the significance level was based on a 1000 permutation test.

5. Conclusions

In this study, the effects of PRP-PACAPa, PRP-PACAPb, GHRH and GHRHR polymorphisms on phenotype in the important orange-spotted grouper (Epinephelus coioides) marine food species were examined. An SNP (KR269823.1:g.2143T>C) located in the second intron of GHRH was found to be significantly related to growth patterns and may be used for breeding purposes. These genes were found to harbor relatively low nucleotide diversity levels and low LD levels in the population.

Acknowledgments

This research was supported by the Special Fund for the National Natural Science Foundation of China (31370047), by the Special Fund for Agro-scientific Research in the Public Interest (201403008 and 201403011), by the Guangdong Provincial “Yang Fan” Program (201312H10), and by the Special Project on the Integration of Industry, Education and Research of Guangdong Province (2013B090800017).

Author Contributions

Liang Guo and Junhong Xia performed the majority of the experiments and wrote the paper. Zining Meng designed the research. Sen Yang and Mingming Li contributed technical assistance and preparation of the manuscript. Xinxin You gave assistance in the experiments and analysis. Haoran Lin contributed insightful discussions and provided reagents.

Conflicts of Interest

The authors declare no conflict of interest.

References

  1. Heemstra, P.C.; Randall, J.E. FAO Species Catalogue vol. 16 Groupers of the World (Family Serranidae, Subfamily Epinephelinae): An Annotated and Illustrated Catalogue of the Grouper, Rockcod, Hind, Coral Grouper, and Lyretail Species Known to Date; Food and Agriculture Organization of the United Nations: Rome, Italy, 1993. [Google Scholar]
  2. Pierre, S.; Gaillard, S.; Prevot-D’Alvise, N.; Aubert, J.; Rostaing-Capaillon, O.; Leung-Tack, D.; Grillasca, J. Grouper aquaculture: Asian success and Mediterranean trials. Aquat. Conserv. 2008, 18, 297–308. [Google Scholar] [CrossRef]
  3. You, X.; Shu, L.; Li, S.; Chen, J.; Luo, J.; Lu, J.; Mu, Q.; Bai, J.; Xia, Q.; Chen, Q.; et al. Construction of high-density genetic linkage maps for orange-spotted grouper Epinephelus coioides using multiplexed shotgun genotyping. BMC Genet. 2013, 14, 113. [Google Scholar] [CrossRef] [PubMed]
  4. Wei, Y.; Huang, H.; Meng, Z.; Zhang, Y.; Luo, J.; Chen, G.; Lin, H. Single Nucleotide polymorphisms in the Leptin-a gene and associations with growth traits in the orange-spotted grouper (Epinephelus coioides). Int. J. Mol. Sci. 2013, 14, 8625–8637. [Google Scholar] [CrossRef] [PubMed]
  5. Huang, H.; Wei, Y.; Meng, Z.; Zhang, Y.; Liu, X.; Guo, L.; Luo, J.; Chen, G.; Lin, H. Polymorphisms of Leptin-b gene associated with growth traits in orange-spotted grouper (Epinephelus coioides). Int. J. Mol. Sci. 2014, 15, 11996–12006. [Google Scholar] [CrossRef] [PubMed]
  6. Gjedrem, T.; Robinson, N.; Rye, M. The importance of selective breeding in aquaculture to meet future demands for animal protein: A review. Aquaculture 2012, 350, 117–129. [Google Scholar] [CrossRef]
  7. Yu, J.M.; Pressoir, G.; Briggs, W.H.; Bi, I.V.; Yamasaki, M.; Doebley, J.F.; McMullen, M.D.; Gaut, B.S.; Nielsen, D.M.; Holland, J.B.; et al. A unified mixed-model method for association mapping that accounts for multiple levels of relatedness. Nat. Genet. 2006, 38, 203–208. [Google Scholar] [CrossRef] [PubMed]
  8. Hindorff, L.A.; MacArthur, J.; Morales, J.; Junkins, H.A.; Hall, P.N.; Klemm, A.K.; Manolio, T.A. A Catalog of Published Genome-Wide Association Studies. Available online: http://www.genome.gov/gwastudies (accessed on 17 March 2015).
  9. Wang, J.; Wang, H.; Chi, R.; Guo, J.; Wu, Y. Progresses in research of genome-wide association studies in livestock and poultry. Sci. Agric. Sin. 2013, 46, 819–829. [Google Scholar]
  10. Zhu, C.; Gore, M.; Buckler, E.S.; Yu, J. Status and prospects of association mapping in plants. Plant Genome 2008, 1, 5–20. [Google Scholar] [CrossRef]
  11. Caniato, F.F.; Hamblin, M.T.; Guimaraes, C.T.; Zhang, Z.; Schaffert, R.E.; Kochian, L.V.; Magalhaes, J.V. Association mapping provides insights into the origin and the fine structure of the sorghum aluminum tolerance locus, AltSB. PLoS ONE 2014, 9, e87438. [Google Scholar] [CrossRef] [PubMed]
  12. Thavamanikumar, S.; Tibbits, J.; McManus, L.; Ades, P.; Stackpole, D.; Hadjigol, S.; Vaillancourt, R.; Zhu, P.; Bossinger, G. Candidate gene-based association mapping of growth and wood quality traits in Eucalyptus globulus Labill. BMC Proc. 2011, 5, O15. [Google Scholar] [CrossRef]
  13. Nordborg, M.; Borevitz, J.O.; Bergelson, J.; Berry, C.C.; Chory, J.; Hagenblad, J.; Kreitman, M.; Maloof, J.N.; Noyes, T.; Oefner, P.J.; et al. The extent of linkage disequilibrium in Arabidopsis thaliana. Nat. Genet. 2002, 30, 190–193. [Google Scholar] [CrossRef] [PubMed]
  14. Campbell, N.R.; LaPatra, S.E.; Overturf, K.; Towner, R.; Narum, S.R. Association mapping of disease resistance traits in rainbow trout using restriction site associated DNA sequencing. G3 (Bethesda) 2014, 4, 2473–2481. [Google Scholar] [CrossRef] [PubMed]
  15. Xia, J.H.; Lin, G.; He, X.; Liu, P.; Liu, F.; Sun, F.; Tu, R.; Yue, G.H. Whole genome scanning and association mapping identified a significant association between growth and a SNP in the IFABP-a gene of the Asian seabass. BMC Genom. 2013, 14, 295. [Google Scholar] [CrossRef] [PubMed]
  16. Qian, Y.; Yan, A.; Lin, H.; Li, W. Molecular characterization of the GHRH/GHRHR and its effect on GH synthesis and release in orange-spotted grouper (Epinephelus coioides). Comp. Biochem. Physiol. B Biochem. Mol. Biol. 2012, 163, 229–237. [Google Scholar] [CrossRef] [PubMed]
  17. Lee, L.; Siu, F.; Tam, J.; Lau, I.; Wong, A.; Lin, M.; Vaudry, H.; Chow, B. Discovery of growth hormone-releasing hormones and receptors in nonmammalian vertebrates. Proc. Natl. Acad. Sci. USA 2007, 104, 2133–2138. [Google Scholar] [CrossRef] [PubMed] [Green Version]
  18. Tam, J.K.V.; Lee, L.T.O.; Cheng, C.H.K.; Chow, B.K.C. Discovery of a new reproductive hormone in teleosts: Pituitary adenylate cyclase-activating polypeptide-related peptide (PRP). Gen. Comp. Endocrinol. 2011, 173, 405–410. [Google Scholar] [CrossRef] [PubMed]
  19. Alexandre, D.; Alonzeau, J.; Bill, B.R.; Ekker, S.C.; Waschek, J.A. Expression analysis of PAC1-R and PACAP genes in zebrafish embryos. J. Mol. Neurosci. 2011, 43, 94–100. [Google Scholar] [CrossRef] [PubMed]
  20. Dybus, A.; Kmiec, M.; Sobek, Z.; Pietrzyk, W.; Wisniewski, B. Associations between polymorphisms of growth hormone releasing hormone (GHRH) and pituitary transcription factor 1 (PIT1) genes and production traits of Limousine cattle. Arch. Tierz. 2003, 46, 527–534. [Google Scholar]
  21. Liu, Y.; Lan, X.; Qu, Y.; Li, Z.; Chen, Z.; Lei, C.; Fang, X.; Chen, H. Effects of genetic variability of the dairy goat growth hormone releasing hormone receptor (GHRHR) gene on growth traits. Mol. Biol. Rep. 2011, 38, 539–544. [Google Scholar] [CrossRef] [PubMed]
  22. Tao, W.J.; Boulding, E.G. Associations between single nucleotide polymorphisms in candidate genes and growth rate in Arctic charr (Salvelinus alpinus L.). Heredity (Edinb) 2003, 91, 60–69. [Google Scholar] [CrossRef] [PubMed]
  23. Rothberg, J.M.; Hinz, W.; Rearick, T.M.; Schultz, J.; Mileski, W.; Davey, M.; Leamon, J.H.; Johnson, K.; Milgrew, M.J.; Edwards, M.; et al. An integrated semiconductor device enabling non-optical genome sequencing. Nature 2011, 475, 348–352. [Google Scholar] [CrossRef] [PubMed]
  24. Liu, L.; Li, Y.; Li, S.; Hu, N.; He, Y.; Pong, R.; Lin, D.; Lu, L.; Law, M. Comparison of next-generation sequencing systems. J. Biomed. Biotechnol. 2012, 2012, 1–11. [Google Scholar] [CrossRef] [PubMed]
  25. Nielsen, R.; Paul, J.S.; Albrechtsen, A.; Song, Y.S. Genotype and SNP calling from next-generation sequencing data. Nat. Rev. Genet. 2011, 12, 443–451. [Google Scholar] [CrossRef] [PubMed]
  26. Costa, J.L.; Sousa, S.; Justino, A.; Kay, T.; Fernandes, S.; Cirnes, L.; Schmitt, F.; Machado, J.C. Nonoptical massive parallel DNA sequencing of BRCA1 and BRCA2 genes in a diagnostic setting. Hum. Mutat. 2013, 34, 629–635. [Google Scholar] [CrossRef] [PubMed]
  27. Adlakha, N.; Ritturaj Kushwaha, H.; Rajagopal, R.; Yazdani, S.S. Draft genome sequence of the Paenibacillus sp. strain ICGEB2008 (MTCC 5639) isolated from the gut of Helicoverpa armigera. Genome Announc. 2013, 1, e12–e26. [Google Scholar]
  28. Mamanova, L.; Coffey, A.J.; Scott, C.E.; Kozarewa, I.; Turner, E.H.; Kumar, A.; Howard, E.; Shendure, J.; Turner, D.J. Target-enrichment strategies for next-generation sequencing. Nat. Methods 2010, 7, 111–118. [Google Scholar] [CrossRef] [PubMed]
  29. Craig, D.W.; Pearson, J.V.; Szelinger, S.; Sekar, A.; Redman, M.; Corneveaux, J.J.; Pawlowski, T.L.; Laub, T.; Nunn, G.; Stephan, D.A.; et al. Identification of genetic variants using bar-coded multiplexed sequencing. Nat. Methods 2008, 5, 887–893. [Google Scholar] [CrossRef] [PubMed]
  30. O’Neill, M.; McPartlin, J.; Arthure, K.; Riedel, S.; McMillan, N.D. Comparison of the TLDA with the Nanodrop and the reference Qubit system. J. Phys. Conf. Ser. 2011. [Google Scholar] [CrossRef]
  31. Wang, L.; Meng, Z.; Liu, X.; Zhang, Y.; Lin, H. Genetic diversity and differentiation of the orange-spotted grouper (Epinephelus coioides) between and within cultured stocks and wild populations inferred from microsatellite DNA analysis. Int. J. Mol. Sci. 2011, 12, 4378–4394. [Google Scholar] [CrossRef] [PubMed]
  32. Wu, D.D.; Jin, W.; Hao, X.D.; Tang, N.L.; Zhang, Y.P. Evidence for positive selection on the Osteogenin (BMP3) gene in human populations. PLoS ONE 2010, 5, e10959. [Google Scholar] [CrossRef] [PubMed]
  33. Templeton, A.R. Population Genetics and Microevolutionary Theory; Wiley-Liss: Hoboken, NJ, USA, 2006; p. 705. [Google Scholar]
  34. Yu, J.; Buckler, E.S. Genetic association mapping and genome organization of maize. Curr. Opin. Biotechnol. 2006, 17, 155–160. [Google Scholar] [CrossRef] [PubMed]
  35. O’Hara, B.; de la Rosa, D.A.; Rajendran, V.M. Multiple mineralocorticoid response elements localized in different introns regulate intermediate conductance K+ (KCNN4) channel expression in the rat distal colon. PLoS ONE 2014, 9, e98695. [Google Scholar] [CrossRef] [PubMed]
  36. Froese, R.; Pauly, D. FishBase, version (08/2015); FishBase: Paris, France, 2015; Available online: http://www.fishbase.org/Identification/Morphometrics/centimeters/Index.php (accessed on 24 October 2015).
  37. Green, M.R.; Sambrook, J. Molecular Cloning: A Laboratory Manua; Cold Spring Horbor laboratory Press: New York, NY, USA, 2001. [Google Scholar]
  38. Patricia Arrieta, M.; Parres, F.; Lopez, J.; Jimenez, A. Development of a novel pyrolysis-gas chromatography/mass spectrometry method for the analysis of poly(lactic acid) thermal degradation products. J. Anal. Appl. Pyrol. 2013, 101, 150–155. [Google Scholar] [CrossRef]
  39. Stephens, M.; Smith, N.J.; Donnelly, P. A new statistical method for haplotype reconstruction from population data. Am. J. Hum. Genet. 2001, 68, 978–989. [Google Scholar] [CrossRef] [PubMed]
  40. Nei, M. Molecular Evolutionary Genetics; Columbia University Press: New York, NY, USA, 1987. [Google Scholar]
  41. Watterson, G.A. On the number of segregating sites in genetical models without recombination. Theor. Popul. Biol. 1975, 7, 256–276. [Google Scholar] [CrossRef]
  42. Librado, P.; Rozas, J. DnaSP v5: A software for comprehensive analysis of DNA polymorphism data. Bioinformatics 2009, 25, 1451–1452. [Google Scholar] [CrossRef] [PubMed]
  43. Fu, Y. Statistical tests of neutrality of mutations against population growth, hitchhiking and background selection. Genetics 1997, 147, 915–925. [Google Scholar] [PubMed]
  44. Nei, M.; Gojobori, T. Simple methods for estimating the numbers of synonymous and nonsynonymous nucleotide substitutions. Mol. Biol. Evol. 1986, 3, 418–426. [Google Scholar] [PubMed]
  45. Tamura, K.; Stecher, G.; Peterson, D.; Filipski, A.; Kumar, S. MEGA6: Molecular evolutionary genetics analysis version 6.0. Mol. Biol. Evol. 2013, 30, 2725–2729. [Google Scholar] [CrossRef] [PubMed]
  46. Barrett, J.C.; Fry, B.; Maller, J.; Daly, M.J. Haploview: analysis and visualization of LD and haplotype maps. Bioinformatics 2005, 21, 263–265. [Google Scholar] [CrossRef] [PubMed]
  47. Remington, D.L.; Thornsberry, J.M.; Matsuoka, Y.; Wilson, L.M.; Whitt, S.R.; Doeblay, J.; Kresovich, S.; Goodman, M.M.; Buckler, E.S. Structure of linkage disequilibrium and phenotypic associations in the maize genome. Proc. Natl. Acad. Sci. USA 2001, 98, 11479–11484. [Google Scholar] [CrossRef] [PubMed]
  48. Bradbury, P.J.; Zhang, Z.; Kroon, D.E.; Casstevens, T.M.; Ramdoss, Y.; Buckler, E.S. TASSEL: software for association mapping of complex traits in diverse samples. Bioinformatics 2007, 23, 2633–2635. [Google Scholar] [CrossRef] [PubMed]
  49. Hardy, O.J.; Vekemans, X. SPAGeDi: A versatile computer program to analyse spatial genetic structure at the individual or population levels. Mol. Ecol. Notes 2002, 2, 618–620. [Google Scholar] [CrossRef]
  50. Pritchard, J.K.; Stephens, M.; Donnelly, P. Inference of population structure using multilocus genotype data. Genetics 2000, 155, 945–959. [Google Scholar] [PubMed]
  51. Evanno, G.; Regnaut, S.; Goudet, J. Detecting the number of clusters of individuals using the software STRUCTURE: A simulation study. Mol. Ecol. 2005, 14, 2611–2620. [Google Scholar] [CrossRef] [PubMed]
  52. Storey, J.D.; Tibshirani, R. Statistical significance for genomewide studies. Proc. Natl. Acad. Sci. USA 2003, 100, 9440–9445. [Google Scholar] [CrossRef] [PubMed]
  53. Tian, J.; Chang, M.; Du, Q.; Xu, B.; Zhang, D. Single-nucleotide polymorphisms in PtoCesA7 and their association with growth and wood properties in Populus tomentosa. Mol. Genet. Genom. 2014, 289, 439–455. [Google Scholar] [CrossRef] [PubMed]
  54. Zaykin, D.V.; Westfall, P.H.; Young, S.S.; Karnoub, M.A.; Wagner, M.J.; Ehm, M.G. Testing association of statistically inferred haplotypes with discrete and continuous traits in samples of unrelated individuals. Hum. Hered. 2002, 53, 79–91. [Google Scholar] [CrossRef] [PubMed]

