Quantitative Analysis of Tau-Microtubule Interaction Using FRET

Abstract
:
1. Introduction
2. Results and Discussion
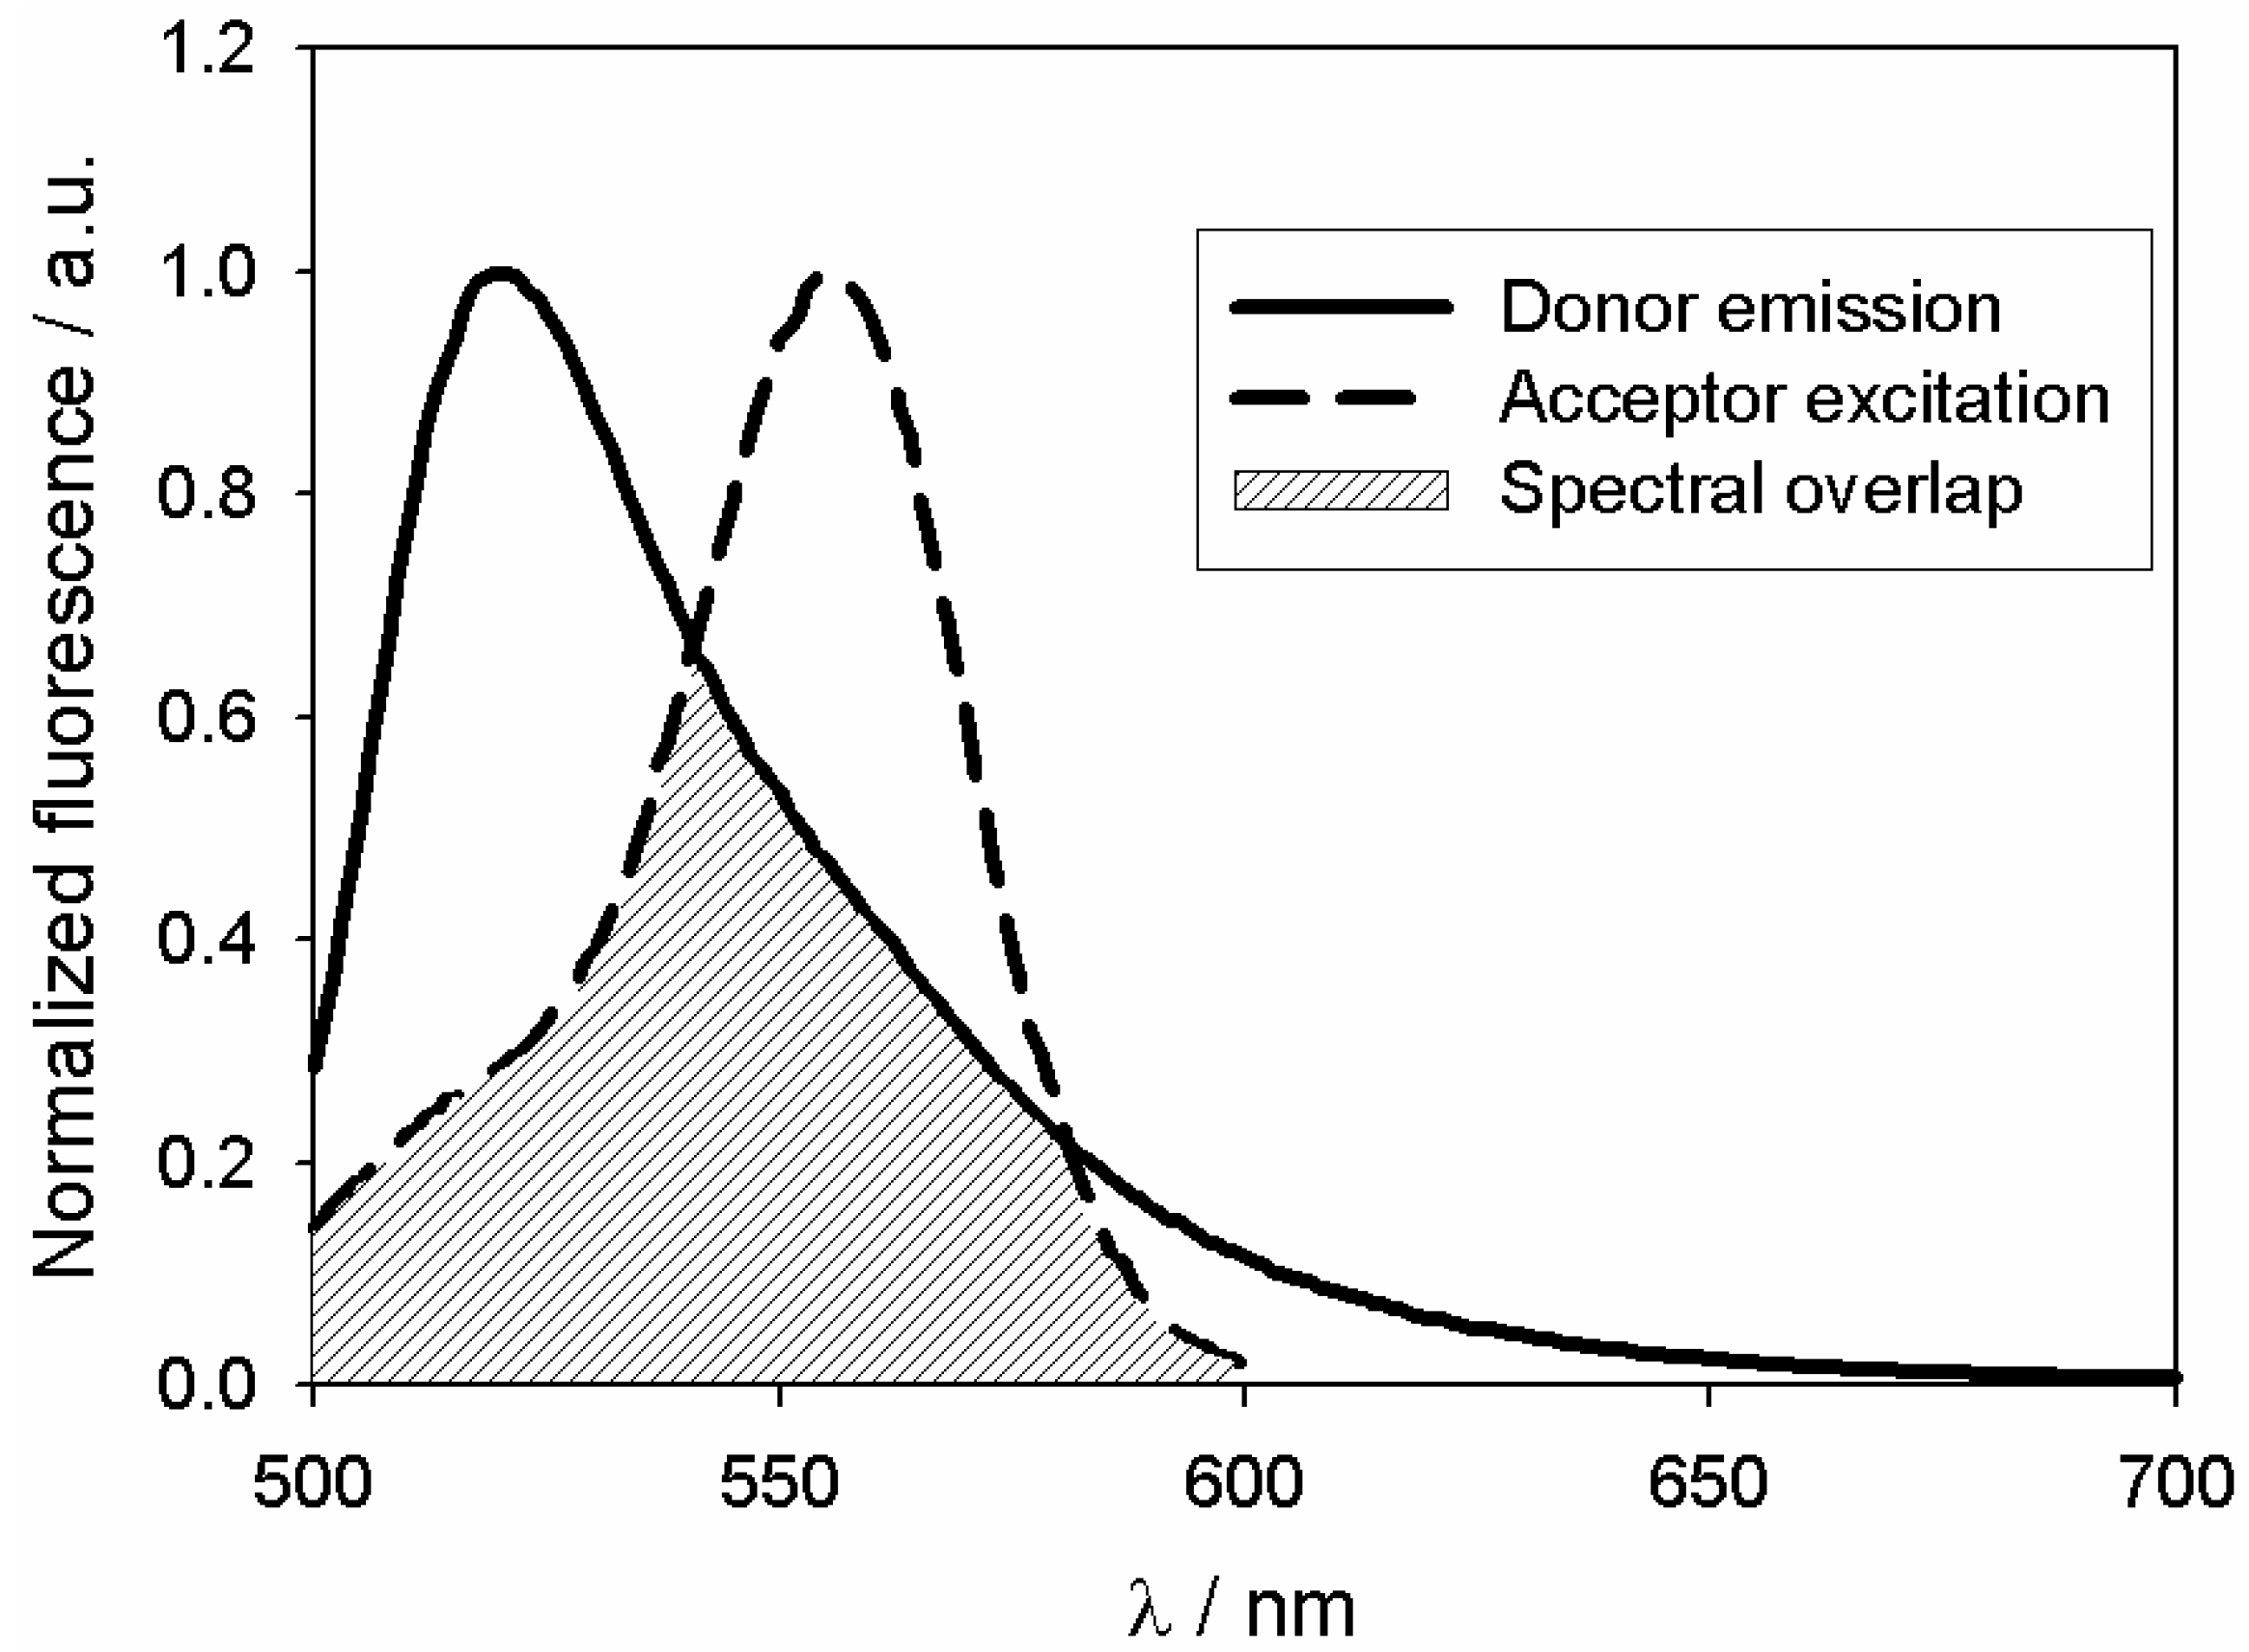
Fluorescence Resonance Energy Transfer (FRET)


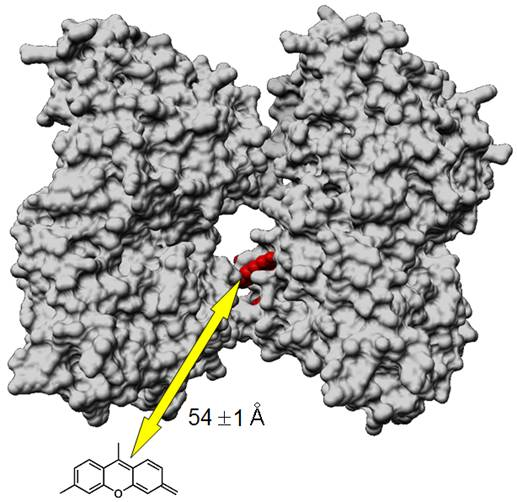
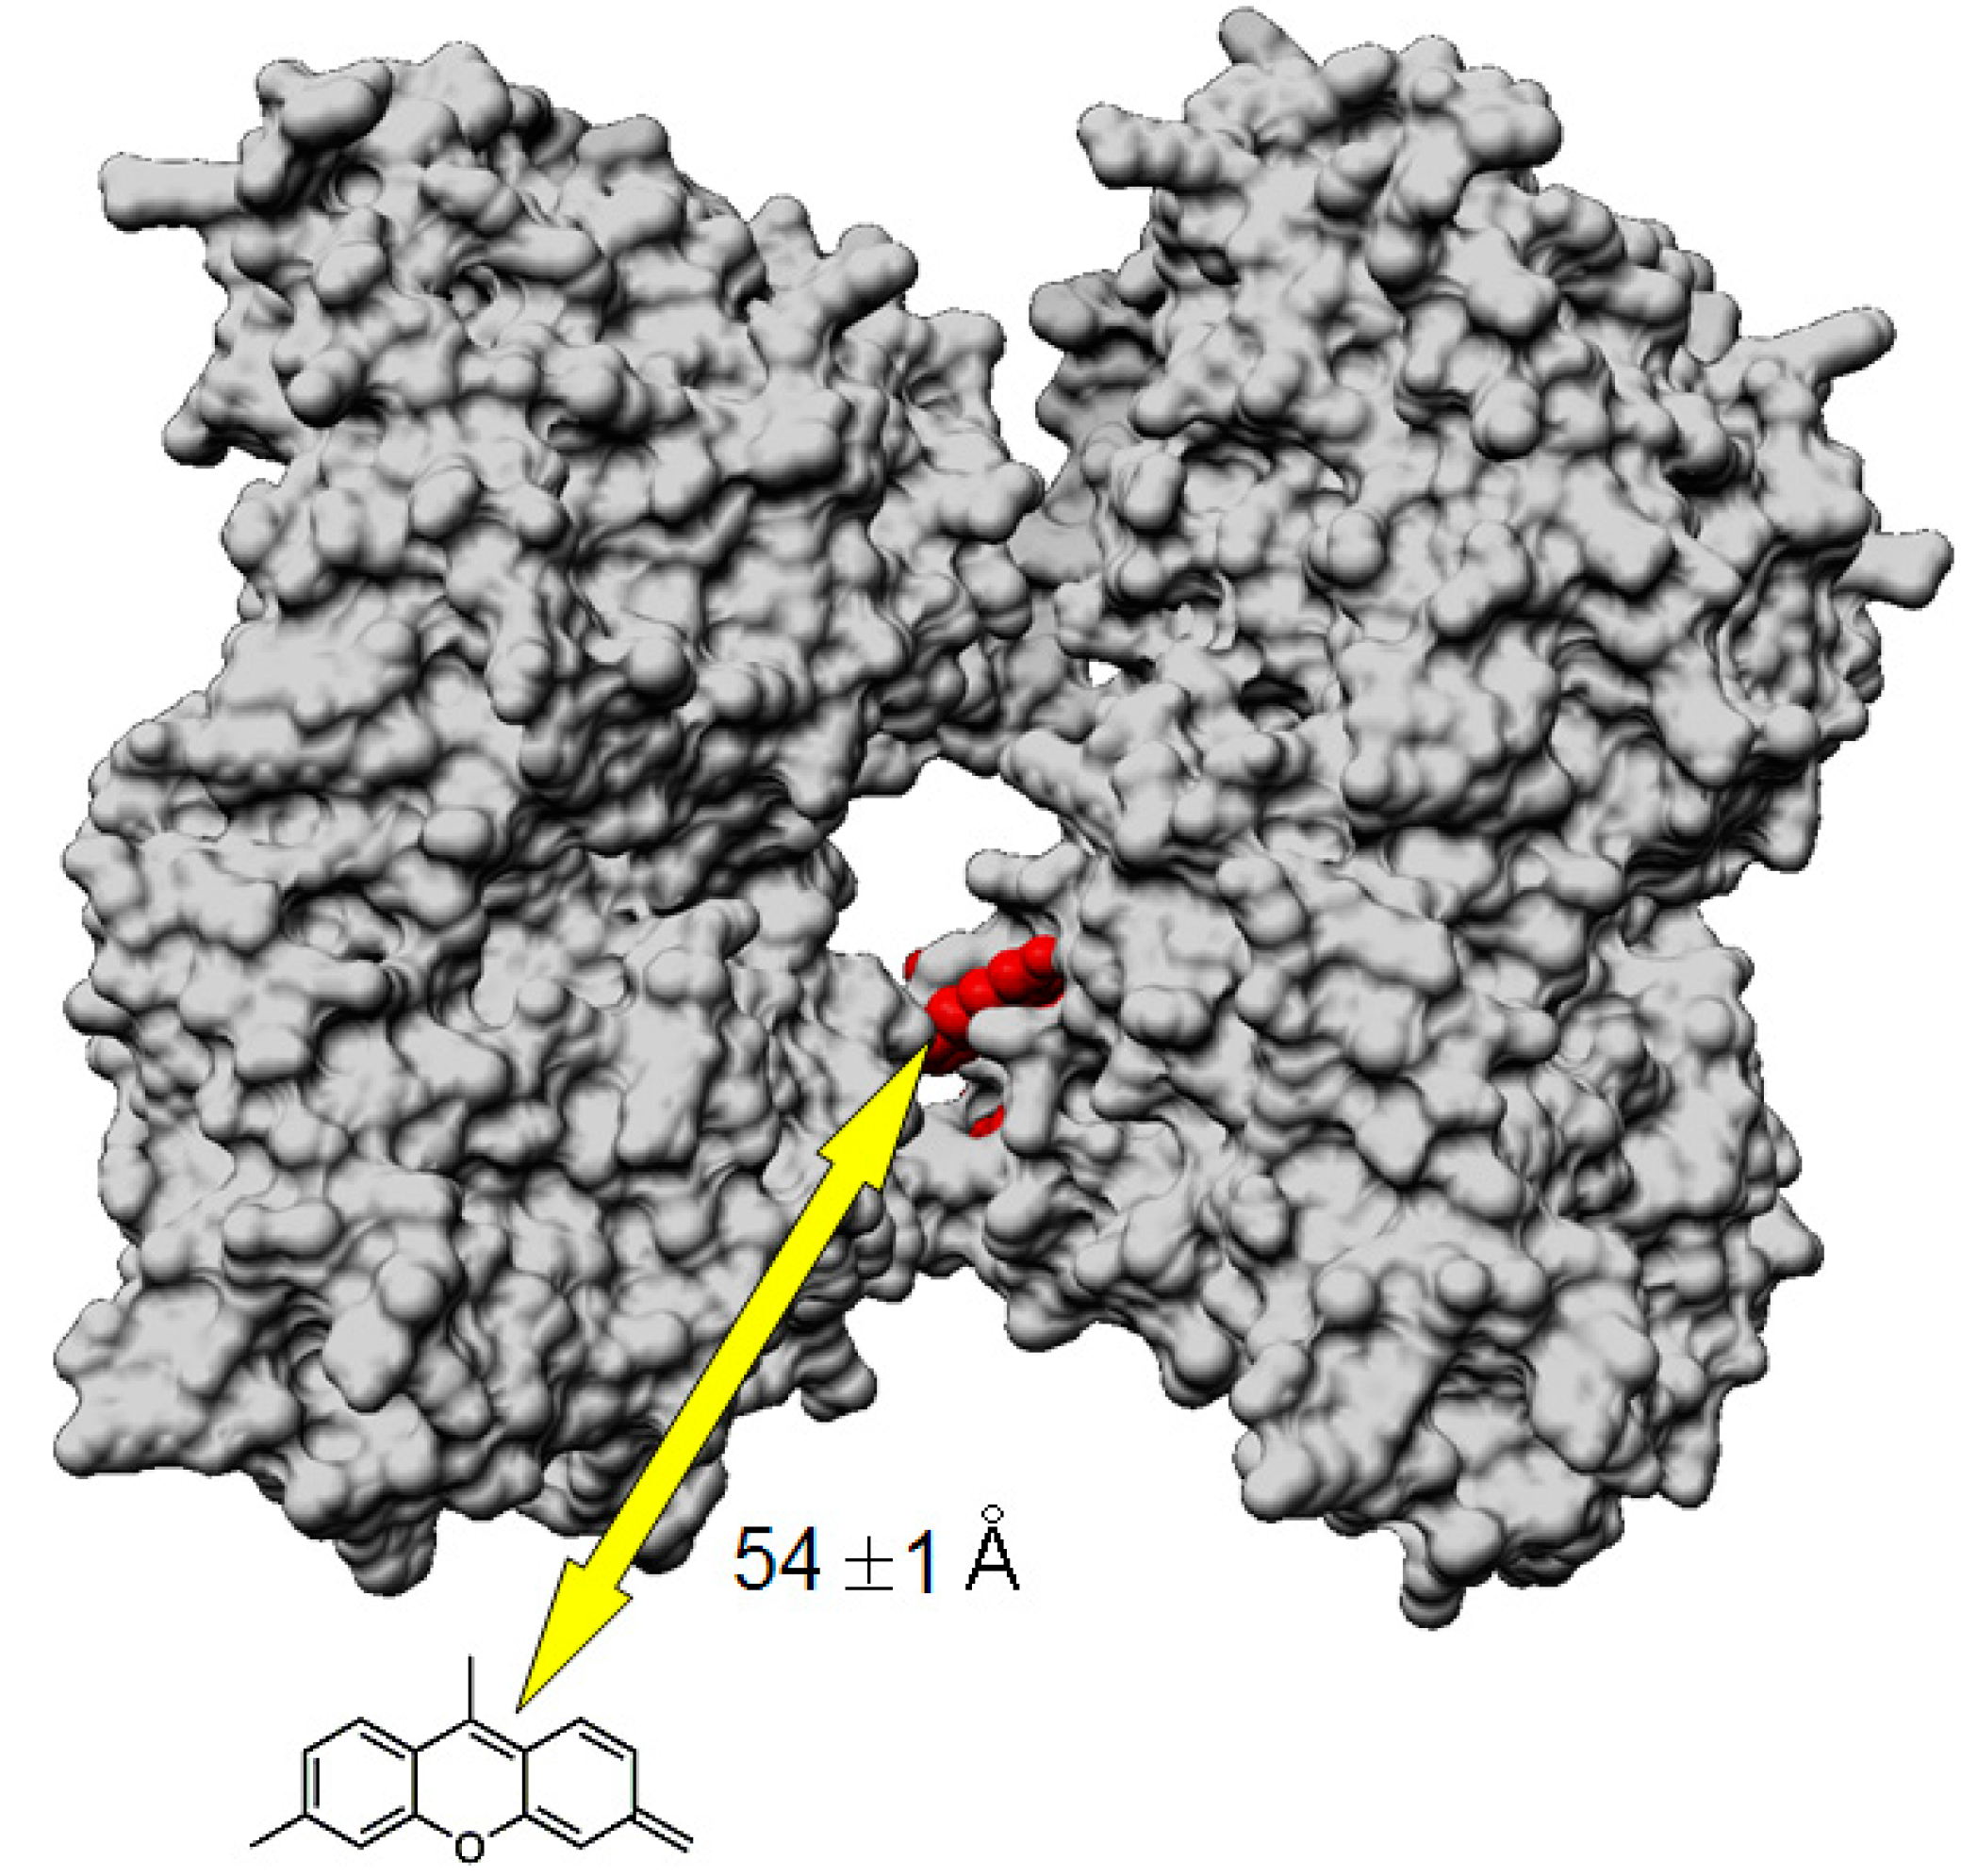
| Donor | Acceptor | E [%] | R0 [Å] | r [Å] |
|---|---|---|---|---|
| MT-(Flutax-2) a | Tau-rhodamine b | 47 ± 3 | 52.9 ± 0.1 | 54 ± 1 |

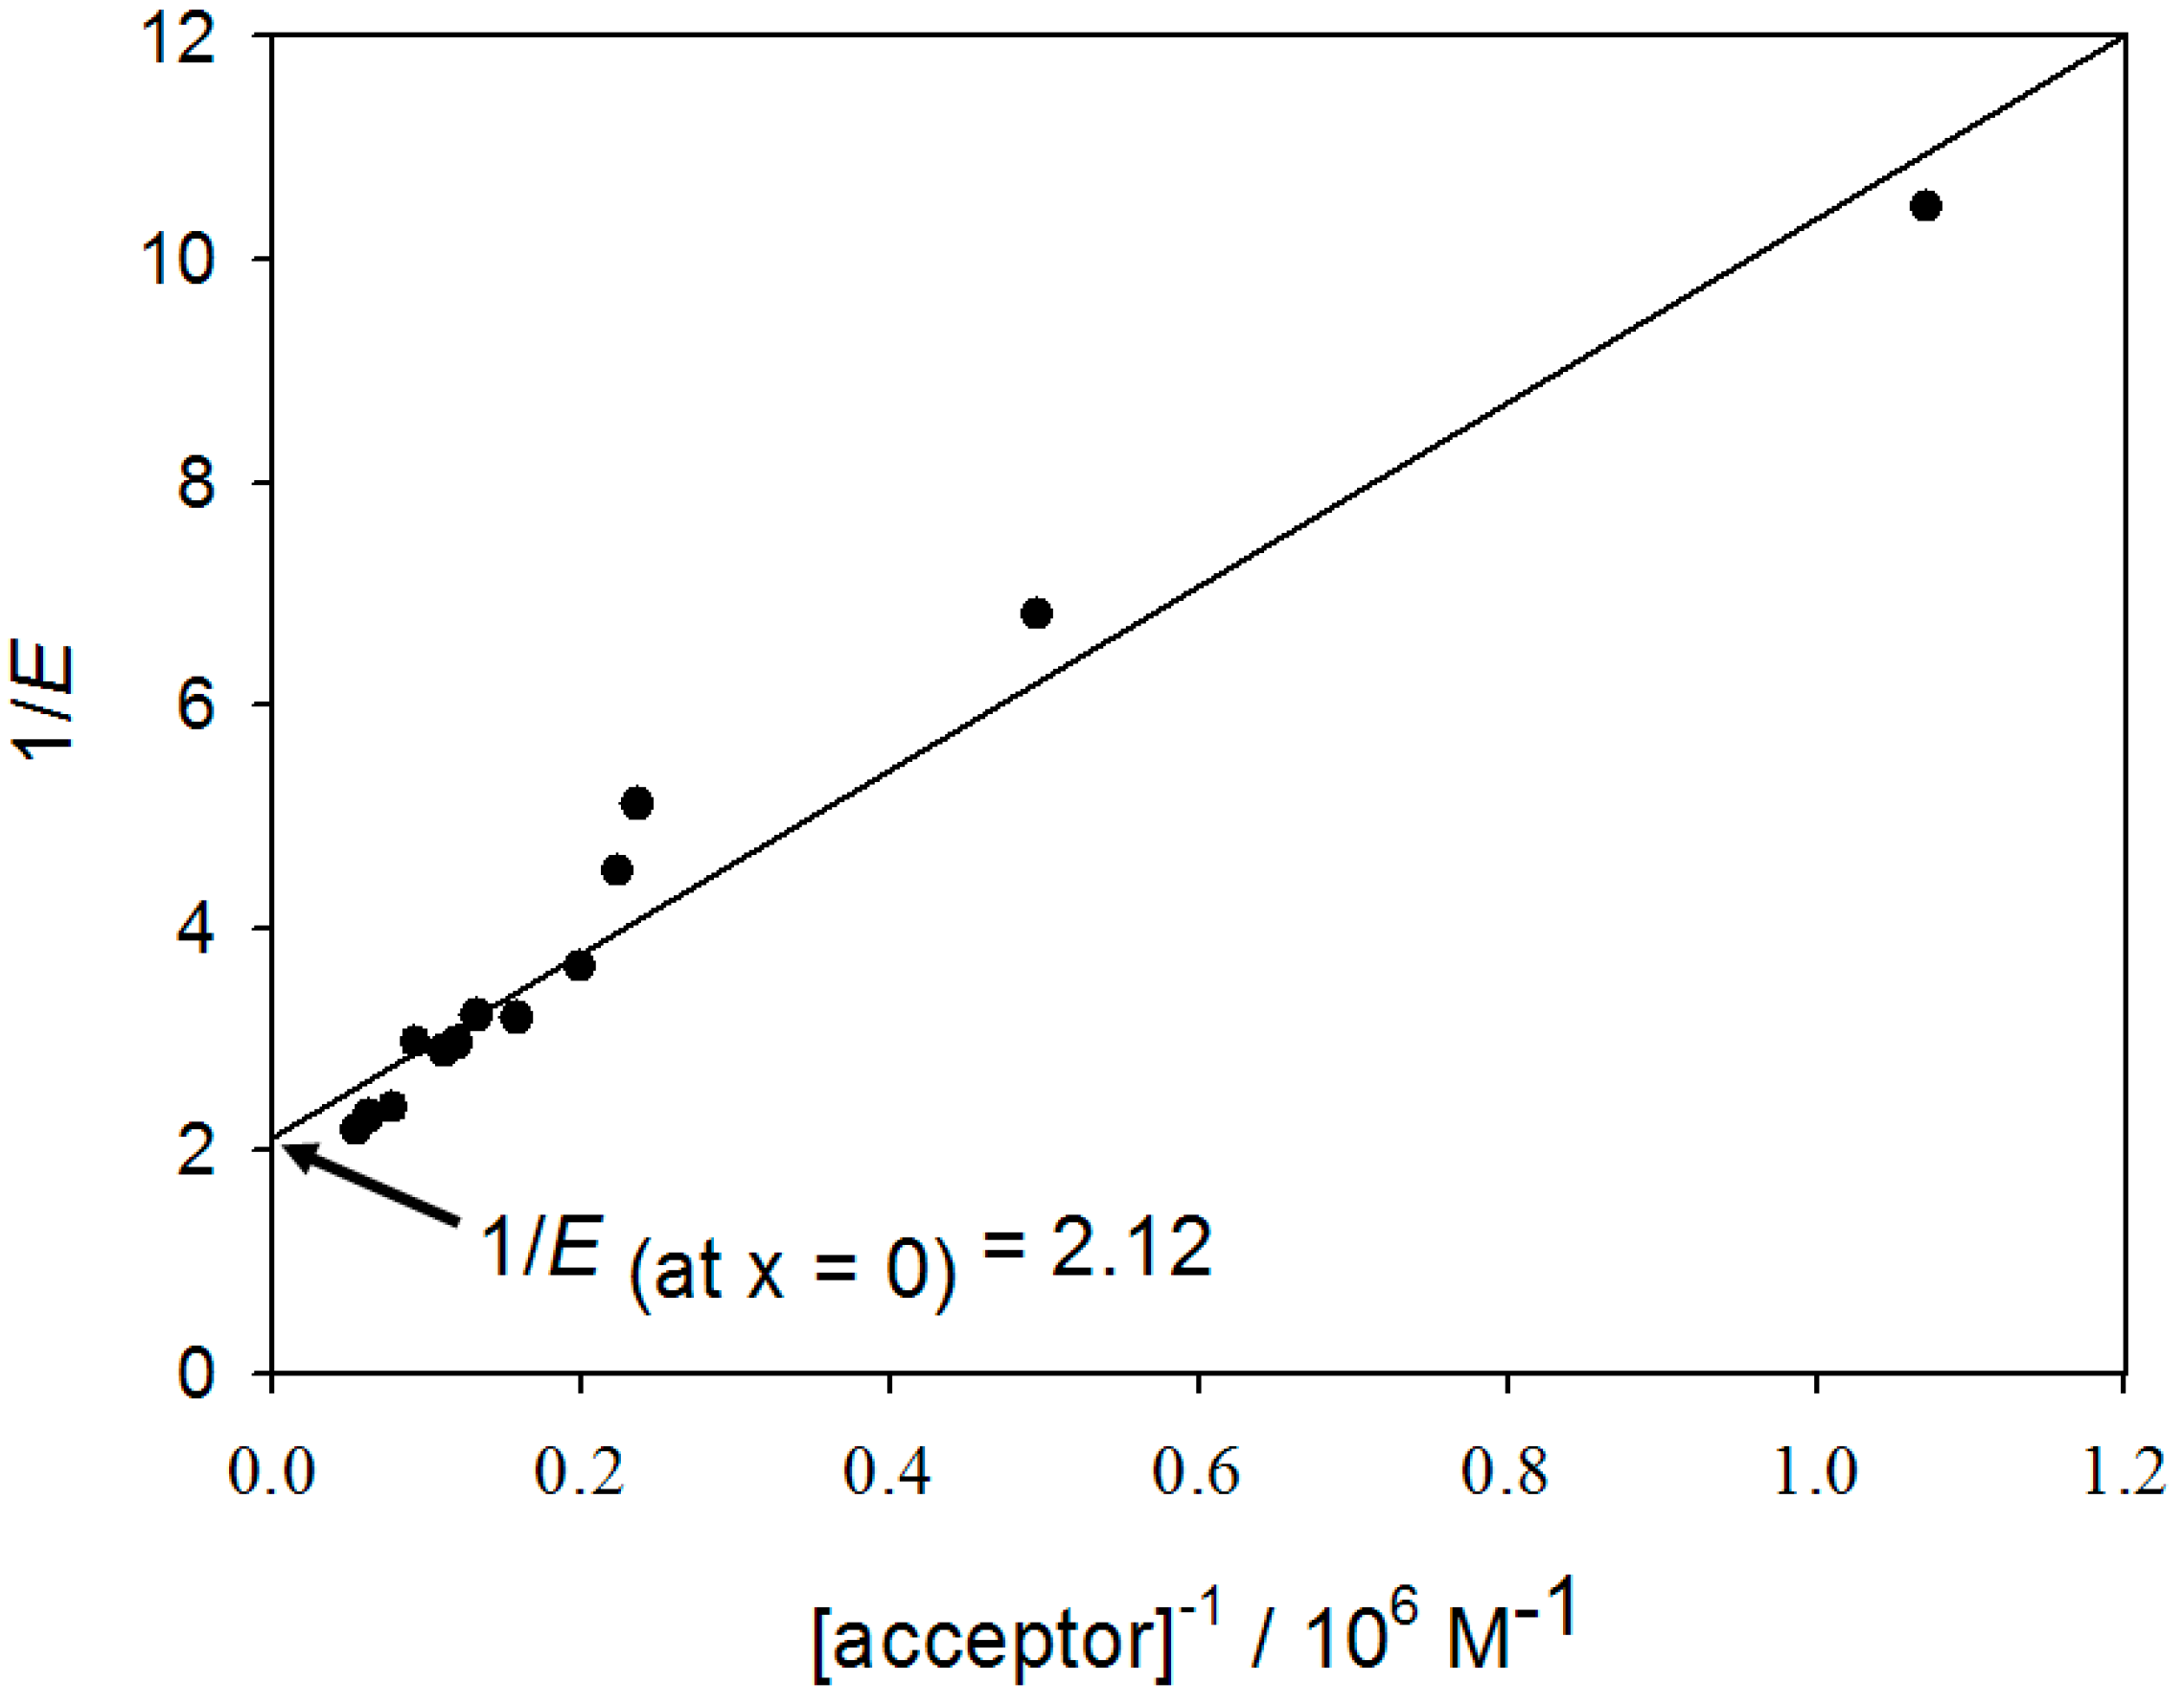
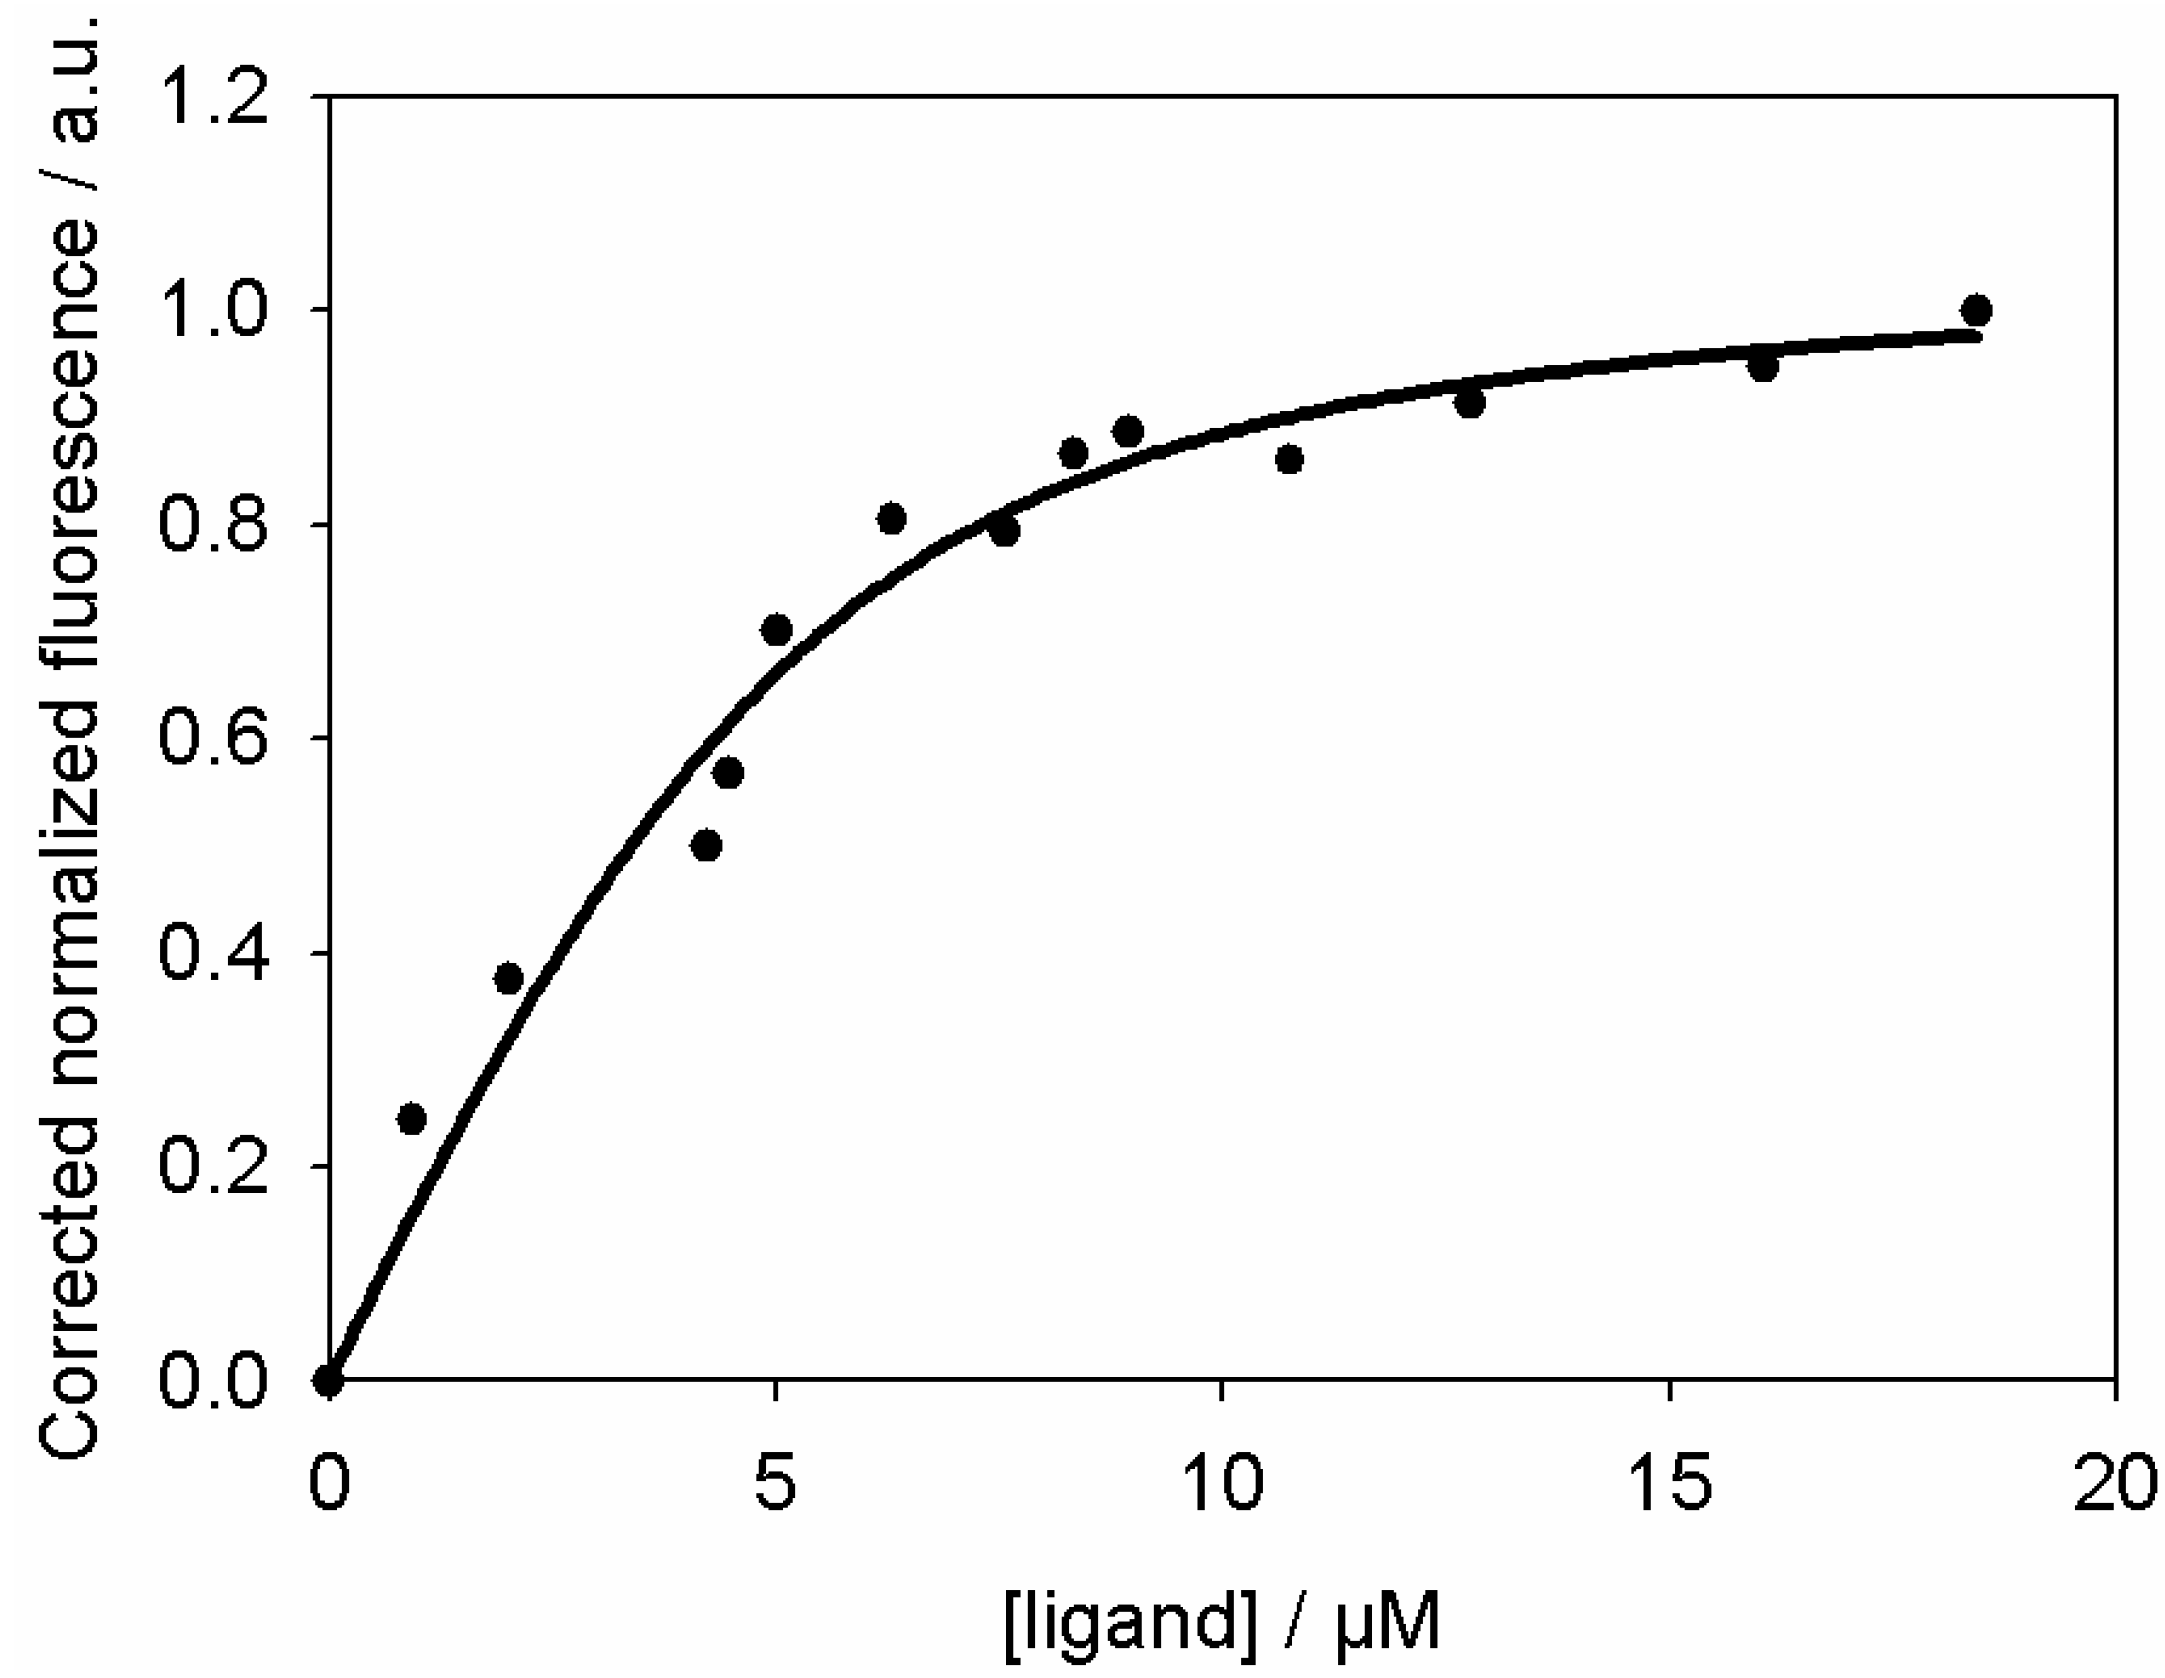
3. Determination of the Binding Parameters

4. Experimental Section
4.1. Materials
4.2. Tau Purification and Labeling
4.3. Tubulin Purification and Microtubule Assembly
4.4. C-Terminal Cleavage of Tubulin
4.5. Mass Spectrometry Experiments
4.6. Sedimentation Velocity Experiments
4.7. Cosedimentation Assay and Polyacrylamide Gel Electrophoresis
4.8. Electron Microscopy
4.9. Fluorescence Resonance Energy Transfer (FRET)


4.10. Determination of the Binding Parameters

5. Conclusions
Acknowledgments
Author Contributions
Conflicts of Interest
References
- Weingarten, M.D.; Lockwood, A.H.; Hwo, S.Y.; Kirschner, M.W. Separation of tubulin from microtubule-associated proteins on phosphocellulose. Accompanying alterations in concentrations of buffer components. Proc. Natl. Acad. Sci. USA 1975, 72, 1858–1862. [Google Scholar] [CrossRef]
- Cleveland, D.W.; Hwo, S.Y.; Kirschner, M.W. Purification of tau, a microtubule-associated protein that induces assembly of microtubules from purified tubulin. J. Mol. Biol. 1977, 116, 207–225. [Google Scholar] [CrossRef] [PubMed]
- Connolly, J.A.; Kalnins, V.I.; Cleveland, D.W.; Kirschner, M.W. Intracellular localization of the high molecular weight microtubule accessory protein by indirect immunofluorescence. J. Cell Biol. 1978, 76, 781–786. [Google Scholar] [CrossRef] [PubMed]
- Johnson, G.V.; Jenkins, S.M. Tau protein in normal and Alzheimer's disease brain. J. Alzheimers Dis. 1999, 1, 307–328. [Google Scholar] [PubMed]
- Goedert, M.; Spillantini, M.G.; Jakes, R.; Crowther, R.A.; Vanmechelen, E.; Probst, A.; Götz, J.; Bürki, K.; Cohen, P. Molecular dissection of the paired helical filament. Neurobiol. Aging 1995, 16, 325–334. [Google Scholar] [CrossRef] [PubMed]
- Buee, L.; Bussiere, T.; Buee-Scherrer, V.; Delacourte, A.; Hof, P.R. Tau protein isoforms, phosphorylation and role in neurodegenerative disorders. Brain Res. Rev. 2000, 33, 95–130. [Google Scholar] [CrossRef] [PubMed]
- Samsonov, A.; Yu, J.Z.; Rasenick, M.; Popov, S.V. Tau interaction with microtubules in vivo. J. Cell. Sci. 2004, 117, 6129–6141. [Google Scholar] [CrossRef] [PubMed]
- Ackmann, M.; Wiech, H.; Mandelkow, E. Nonsaturable binding indicates clustering of tau on the microtubule surface in a paired helical filament-like conformation. J. Biol. Chem. 2000, 275, 30335–30343. [Google Scholar] [CrossRef] [PubMed]
- Gustke, N.; Trinczek, B.; Biernat, J.; Mandelkow, E.M.; Mandelkow, E. Domains of tau protein and interactions with microtubules. Biochemistry 1994, 33, 9511–9522. [Google Scholar] [CrossRef] [PubMed]
- Hong, M.; Zhukareva, V.; Vogelsberg-Ragaglia, V.; Wszolek, Z.; Reed, L.; Miller, B.I.; Geschwind, D.H.; Bird, T.D.; McKeel, D.; Goate, A.; et al. Mutation-specific functional impairments in distinct tau isoforms of hereditary FTDP-17. Science 1998, 282, 1914–1917. [Google Scholar] [CrossRef] [PubMed]
- Sillen, A.; Barbier, P.; Landrieu, I.; Lefebvre, S.; Wieruszeski, J.M.; Leroy, A.; Peyrot, V.; Lippens, G. NMR investigation of the interaction between the neuronal protein tau and the microtubules. Biochemistry 2007, 46, 3055–3064. [Google Scholar] [CrossRef] [PubMed]
- Makrides, V.; Massie, M.R.; Feinstein, S.C.; Lew, J. Evidence for two distinct binding sites for tau on microtubules. Proc. Natl. Acad. Sci. USA 2004, 101, 6746–6751. [Google Scholar] [CrossRef] [PubMed]
- Han, Y.; Malak, H.; Chaudhary, A.G.; Chordia, M.D.; Kingston, D.G.I.; Bane, S. Distances between the paclitaxel, colchicine, and exchangeable GTP binding sites on tubulin. Biochemistry 1998, 37, 6636–6644. [Google Scholar] [CrossRef] [PubMed]
- Förster, T. 10th Spiers Memorial Lecture. Transfer mechanisms of electronic excitation. Discuss. Faraday Soc. 1959, 27, 7–17. [Google Scholar]
- Lakowicz, J.R. Principles of Fluorescence Spectroscopy, 2nd ed.; Kuwer Academic/Plenum Publishers: New York, NY, USA, 1999. [Google Scholar]
- Thomas, D.D.; Carlsen, W.F.; Stryer, L. Fluorescence energy transfer in the rapid-diffusion limit. Proc. Natl. Acad. Sci. USA 1978, 75, 5746–5750. [Google Scholar] [CrossRef] [PubMed]
- Selvin, P.R. The renaissance of fluorescence resonance energy transfer. Nat. Struct. Biol. 2000, 7, 730–734. [Google Scholar] [CrossRef] [PubMed]
- Kenworthy, A.K. Imaging protein-protein interactions using fluorescence resonance energy transfer microscopy. Methods 2001, 24, 289–296. [Google Scholar] [CrossRef] [PubMed]
- Dictenberg, J.B.; Zimmerman, W.; Sparks, C.A.; Young, A.; Vidair, C.; Zheng, Y.X.; Carrington, W.; Fay, F.S.; Doxsey, S.J. Pericentrin and gamma-tubulin form a protein complex and are organized into a novel lattice at the centrosome. J. Cell. Biol. 1998, 141, 163–174. [Google Scholar] [CrossRef] [PubMed]
- Kam, Z.; Volberg, T.; Geiger, B. Mapping of adherens junction components using microscopic resonance energy transfer imaging. J. Cell. Sci. 1995, 108, 1051–1062. [Google Scholar] [PubMed]
- Diaz, J.F.; Strobe, R.; Engelborghs, Y.; Souto, A.A.; Andreu, J.M. Molecular recognition of taxol by microtubules. Kinetics and thermodynamics of binding of fluorescent taxol derivatives to an exposed site. J. Biol. Chem. 2000, 275, 26265–26276. [Google Scholar]
- Mukrasch, M.D.; von Bergen, M.; Biernat, J.; Fischer, D.; Griesinger, C.; Mandelkow, E.; Zweckstetter, M. The “jaws” of the tau-microtubule interaction. J. Biol. Chem. 2007, 282, 12230–12239. [Google Scholar] [CrossRef] [PubMed]
- Al-Bassam, J.; Ozer, R.S.; Safer, D.; Halpain, S.; Milligan, R.A. MAP2 and tau bind longitudinally along the outer ridges of microtubule protofilaments. J. Cell. Biol. 2002, 157, 1187–1196. [Google Scholar]
- Chau, M.F.; Radeke, M.J.; de Ines, C.; Barasoain, I.; Kohlstaedt, L.A.; Feinstein, S.C. The microtubule-associated protein tau cross-links to two distinct sites on each alpha and beta tubulin monomer via separate domains. Biochemistry 1998, 37, 17692–17703. [Google Scholar] [CrossRef] [PubMed]
- Lu, Q.; Wood, J.G. Characterization of fluorescently derivatized bovine tau protein and its localization and functions in cultured Chinese hamster ovary cells. Cell. Mot. Cytoskelet. 1993, 25, 190–200. [Google Scholar] [CrossRef]
- Evangelio, J.A.; Abal, M.; Barasoain, I.; Souto, A.A.; Lillo, M.P.; Acuna, A.U.; Amat-Guerri, F.; Andreu, J.M. Fluorescent taxoids as probes of the microtubule cytoskeleton. Cell. Mot. Cytoskelet. 1998, 39, 73–90. [Google Scholar] [CrossRef]
- Lillo, M.P.; Canadas, O.; Dale, R.E.; Acuna, A.U. Location and properties of the taxol binding center in microtubules: a picosecond laser study with fluorescent taxoids. Biochemistry 2002, 41, 12436–12449. [Google Scholar] [CrossRef] [PubMed]
- Sun, W.C.; Gee, K.R.; Klaubert, D.H.; Haugland, R.P. Synthesis of fluorinated fluoresceins. J. Org. Chem. 1997, 62, 6469–6475. [Google Scholar] [CrossRef]
- Albani, J.; Vos, R.; Willaert, K.; Engelborghs, Y. Interaction between human alpha1-acid glycoprotein (orosomucoid) and 2-p-toluidinylnaphthalene-6-sulfonate. Photochem. Photobiol. 1995, 62, 30–34. [Google Scholar] [CrossRef] [PubMed]
- Diaz, J.F.; Barasoain, I.; Andreu, J.M. Fast kinetics of Taxol binding to microtubules. Effects of solution variables and microtubule-associated proteins. J. Biol. Chem. 2003, 278, 8407–8419. [Google Scholar]
- Schweers, O.; Schonbrunnhanebeck, E.; Marx, A.; Mandelkow, E. Structural studies of tau protein and Alzheimer paired helical filaments show no evidence for beta-structure. J. Biol. Chem. 1994, 269, 24290–24297. [Google Scholar] [PubMed]
- Kar, S.; Fan, J.; Smith, M.J.; Goedert, M.; Amos, L.A. Repeat motifs of tau bind to the insides of microtubules in the absence of taxol. EMBO J. 2003, 22, 70–77. [Google Scholar] [CrossRef] [PubMed]
- Magnani, E.; Fan, J.; Gasparini, L.; Golding, M.; Williams, M.; Schiavo, G.; Goedert, M.; Amos, L.A.; Spillantini, M.G. Interaction of tau protein with the dynactin complex. EMBO J. 2007, 26, 4546–4554. [Google Scholar] [CrossRef] [PubMed]
- Rappl, C.; Barbier, P.; Bourgarel-Rey, V.; Gregoire, C.; Gilli, R.; Carre, M.; Combes, S.; Finet, J.P.; Peyrot, V. Interaction of 4-arylcoumarin analogues of combretastatins with microtubule network of HBL100 cells and binding to tubulin. Biochemistry 2006, 45, 9210–9218. [Google Scholar] [CrossRef] [PubMed]
- Butner, K.A.; Kirschner, M.W. Tau protein binds to microtubules through a flexible array of distributed weak sites. J. Cell. Biol. 1991, 115, 717–730. [Google Scholar] [CrossRef] [PubMed]
- Marya, P.K.; Syed, Z.; Fraylich, P.E.; Eagles, P.A.M. Kinesin and tau bind to distinct sites on microtubules. J. Cell. Sci. 1994, 107, 339–344. [Google Scholar] [PubMed]
- Santarella, R.A.; Skiniotis, G.; Goldie, K.N.; Tittmann, P.; Gross, H.; Mandelkow, E.M.; Mandelkow, E.; Hoenger, A. Surface-decoration of microtubules by human tau. J. Mol. Biol. 2004, 339, 539–553. [Google Scholar] [CrossRef] [PubMed]
- Kanazawa, K.; Timasheff, S.N. Preparation and characterization of des-C-terminal tubulin. J. Prot. Chem. 1989, 8, 131–147. [Google Scholar] [CrossRef]
- Knipling, L.; Hwang, J.; Wolff, J. Preparation and properties of pure tubulin S. Cell. Mot. Cytoskelet. 1999, 43, 63–71. [Google Scholar] [CrossRef]
- Serrano, L.; de la torre, J.; Maccioni, R.B.; Avila, J. Involvement of the carboxyl-terminal domain of tubulin in the regulation of its assembly. Proc. Natl. Acad. Sci. USA 1984, 81, 5989–5993. [Google Scholar] [CrossRef] [PubMed]
- Sackett, D.L.; Wolff, J. Proteolysis of tubulin and the substructure of the tubulin dimer. J. Biol. Chem. 1986, 261, 9070–9076. [Google Scholar] [PubMed]
- Rai, S.S.; Wolff, J. The C terminus of beta-tubulin regulates vinblastine-induced tubulin polymerization. Proc. Natl. Acad. Sci. USA 1998, 95, 4253–4257. [Google Scholar] [CrossRef] [PubMed]
- Peyrot, V.; Briand, C.; Andreu, J.M. C-terminal cleavage of tubulin by subtilisin enhances ring formation. Arch. Biochem. Biophys. 1990, 279, 328–337. [Google Scholar] [CrossRef] [PubMed]
- Saoudi, Y.; Paintrand, I.; Multigner, L.; Job, D. Stabilization and bundling of subtilisin-treated microtubules induced by microtubule associated proteins. J. Cell. Sci. 1995, 108, 357–367. [Google Scholar] [PubMed]
- Nogales, E.; Wolf, S.G.; Downing, K.H. Structure of the alpha beta tubulin dimer by electron crystallography. Nature 1998, 391, 199–203. [Google Scholar] [CrossRef] [PubMed]
- Gigant, B.; Curmi, P.A.; Martin-Barbey, C.; Charbaut, E.; Lachkar, S.; Lebeau, L.; Siavoshian, S.; Sobel, A.; Knossow, M. The 4 A X-ray structure of a tubulin:stathmin-like domain complex. Cell 2000, 102, 809–816. [Google Scholar] [CrossRef] [PubMed]
- Priel, A.; Tuszynski, J.A.; Woolf, N.J. Transitions in microtubule C-termini conformations as a possible dendritic signaling phenomenon. Eur. Biophys. J. 2005, 35, 40–52. [Google Scholar] [CrossRef] [PubMed]
- Devred, F.; Barbier, P.; Douillard, S.; Monasterio, O.; Andreu, J.M.; Peyrot, V. Tau induces ring and microtubule formation from alphabeta-tubulin dimers under nonassembly conditions. Biochemistry 2004, 43, 10520–10531. [Google Scholar] [CrossRef] [PubMed] [Green Version]
- Pierce Biotechnology. Calculate Dye: Potein Molar Ratios; Rockford, IL, USA, 2007; #31. [Google Scholar]
- Weisenberg, R.C.; Borisy, G.G.; Taylor, W.E. The colchicine-binding protein of mammalian brain and its relation to microtubules. Biochemistry 1968, 7, 4466–4479. [Google Scholar] [CrossRef] [PubMed]
- Lee, J.C.; Frigon, R.P.; Timasheff, S.N. The chemical characterization of calf brain microtubule protein subunits. J. Biol. Chem. 1973, 248, 7253–7262. [Google Scholar] [PubMed]
- Barbier, P.; Peyrot, V.; Leynadier, D.; Andreu, J.M. The active GTP- and ground GDP-liganded states of tubulin are distinguished by the binding of chiral isomers of ethyl 5-amino-2-methyl-1,2-dihydro-3-phenylpyrido[3,4-b]pyrazin-7-yl carbamate. Biochemistry 1998, 37, 758–768. [Google Scholar] [CrossRef] [PubMed]
- Gaskin, F.; Cantor, C.R.; Shelanski, M.L. Turbidimetric studies of the in vitro assembly and disassembly of porcine neurotubules. J. Mol. Biol. 1974, 89, 737–755. [Google Scholar] [CrossRef] [PubMed]
- Schuck, P.; Rossmanith, P. Determination of the sedimentation coefficient distribution by least-squares boundary modeling. Biopolymers 2000, 54, 328–341. [Google Scholar] [CrossRef] [PubMed]
- Heller, C.A.; Henry, R.A.; McLaughlin, B.A.; Bliss, D.E. Fluorescence spectra and quantum yields. Quinine, uranine, 9,10-diphenylanthracene, and 9,10-bis(phenylethynyl)anthracenes. J. Chem. Eng. Data 1974, 19, 214–219. [Google Scholar]
- HORIBA Jobin Yvon. A Guide to Record Fluorescence Quantum Yield; Jobin Yvon Ltd.: Stanmore, UK, 2007. [Google Scholar]
© 2014 by the authors; licensee MDPI, Basel, Switzerland. This article is an open access article distributed under the terms and conditions of the Creative Commons Attribution license (http://creativecommons.org/licenses/by/3.0/).
Share and Cite
Maïo, I.L.D.; Barbier, P.; Allegro, D.; Brault, C.; Peyrot, V. Quantitative Analysis of Tau-Microtubule Interaction Using FRET. Int. J. Mol. Sci. 2014, 15, 14697-14714. https://doi.org/10.3390/ijms150814697
Maïo ILD, Barbier P, Allegro D, Brault C, Peyrot V. Quantitative Analysis of Tau-Microtubule Interaction Using FRET. International Journal of Molecular Sciences. 2014; 15(8):14697-14714. https://doi.org/10.3390/ijms150814697
Chicago/Turabian StyleMaïo, Isabelle L. Di, Pascale Barbier, Diane Allegro, Cédric Brault, and Vincent Peyrot. 2014. "Quantitative Analysis of Tau-Microtubule Interaction Using FRET" International Journal of Molecular Sciences 15, no. 8: 14697-14714. https://doi.org/10.3390/ijms150814697