Radiation-Induced Changes in Serum Lipidome of Head and Neck Cancer Patients

 ,
,
Abstract
:1. Introduction
2. Results
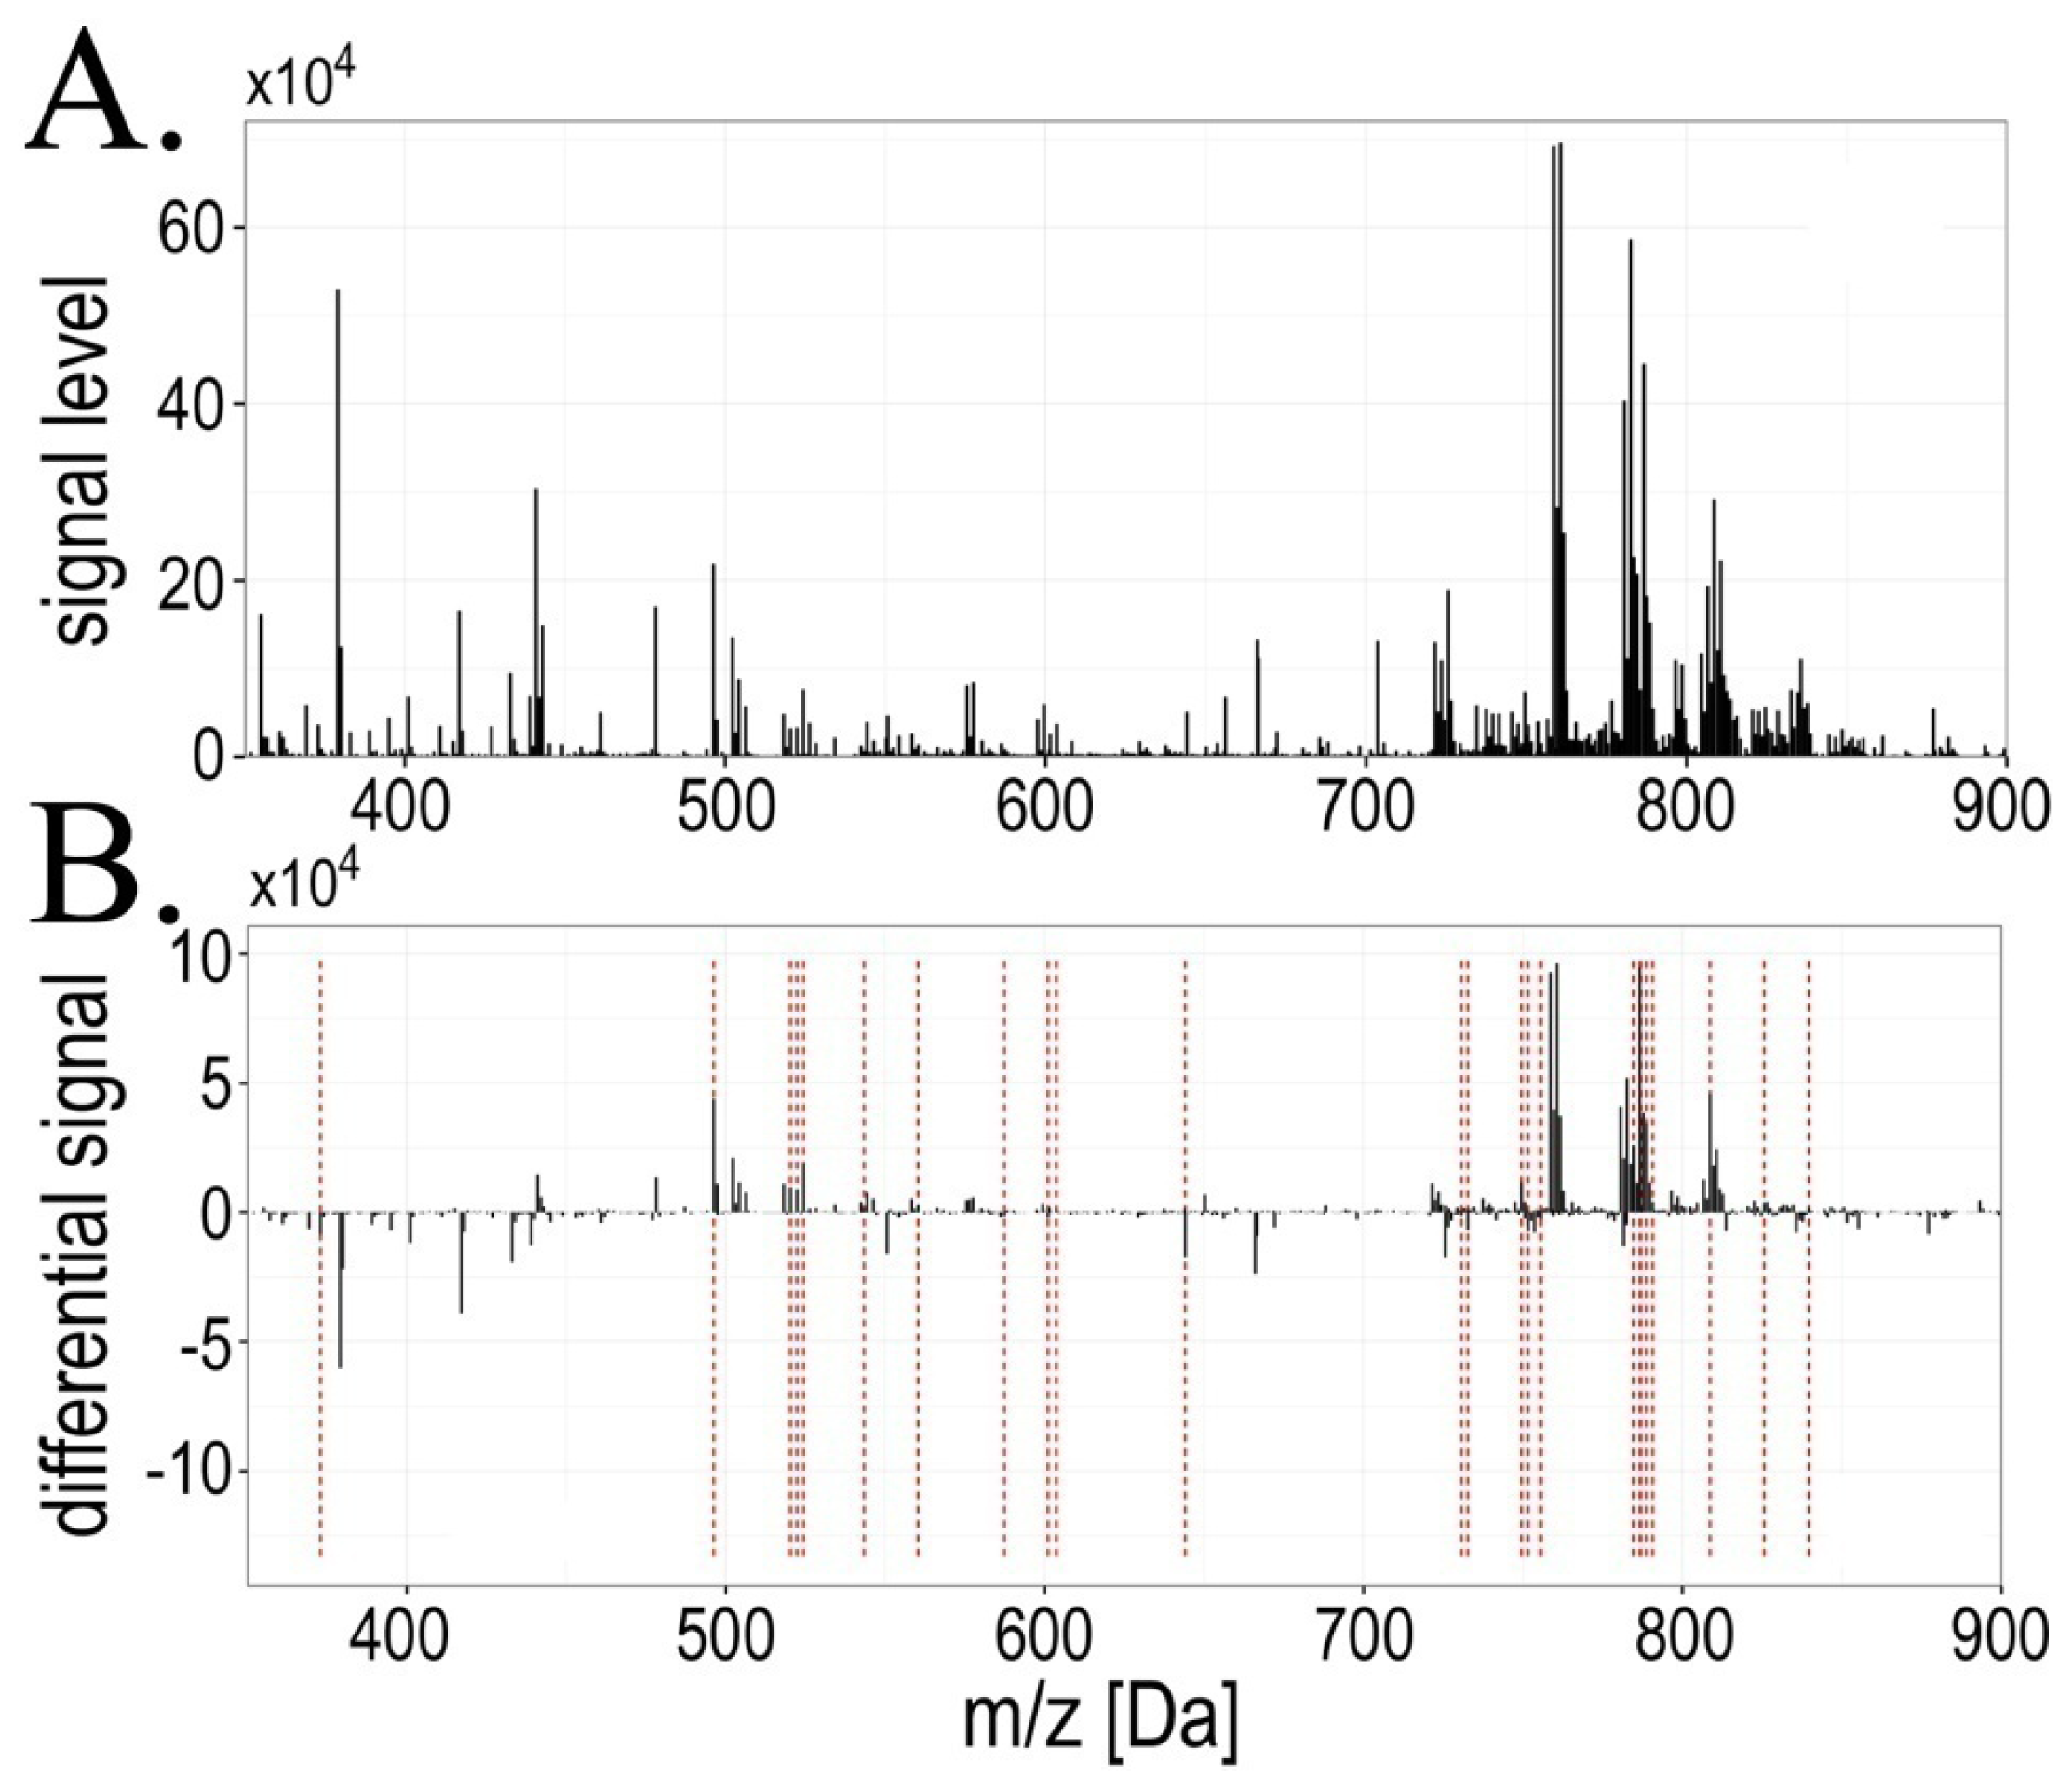
2.1. Exposure to Radiation during Radiotherapy Induced Changes in the Serum Lipidome Profiles
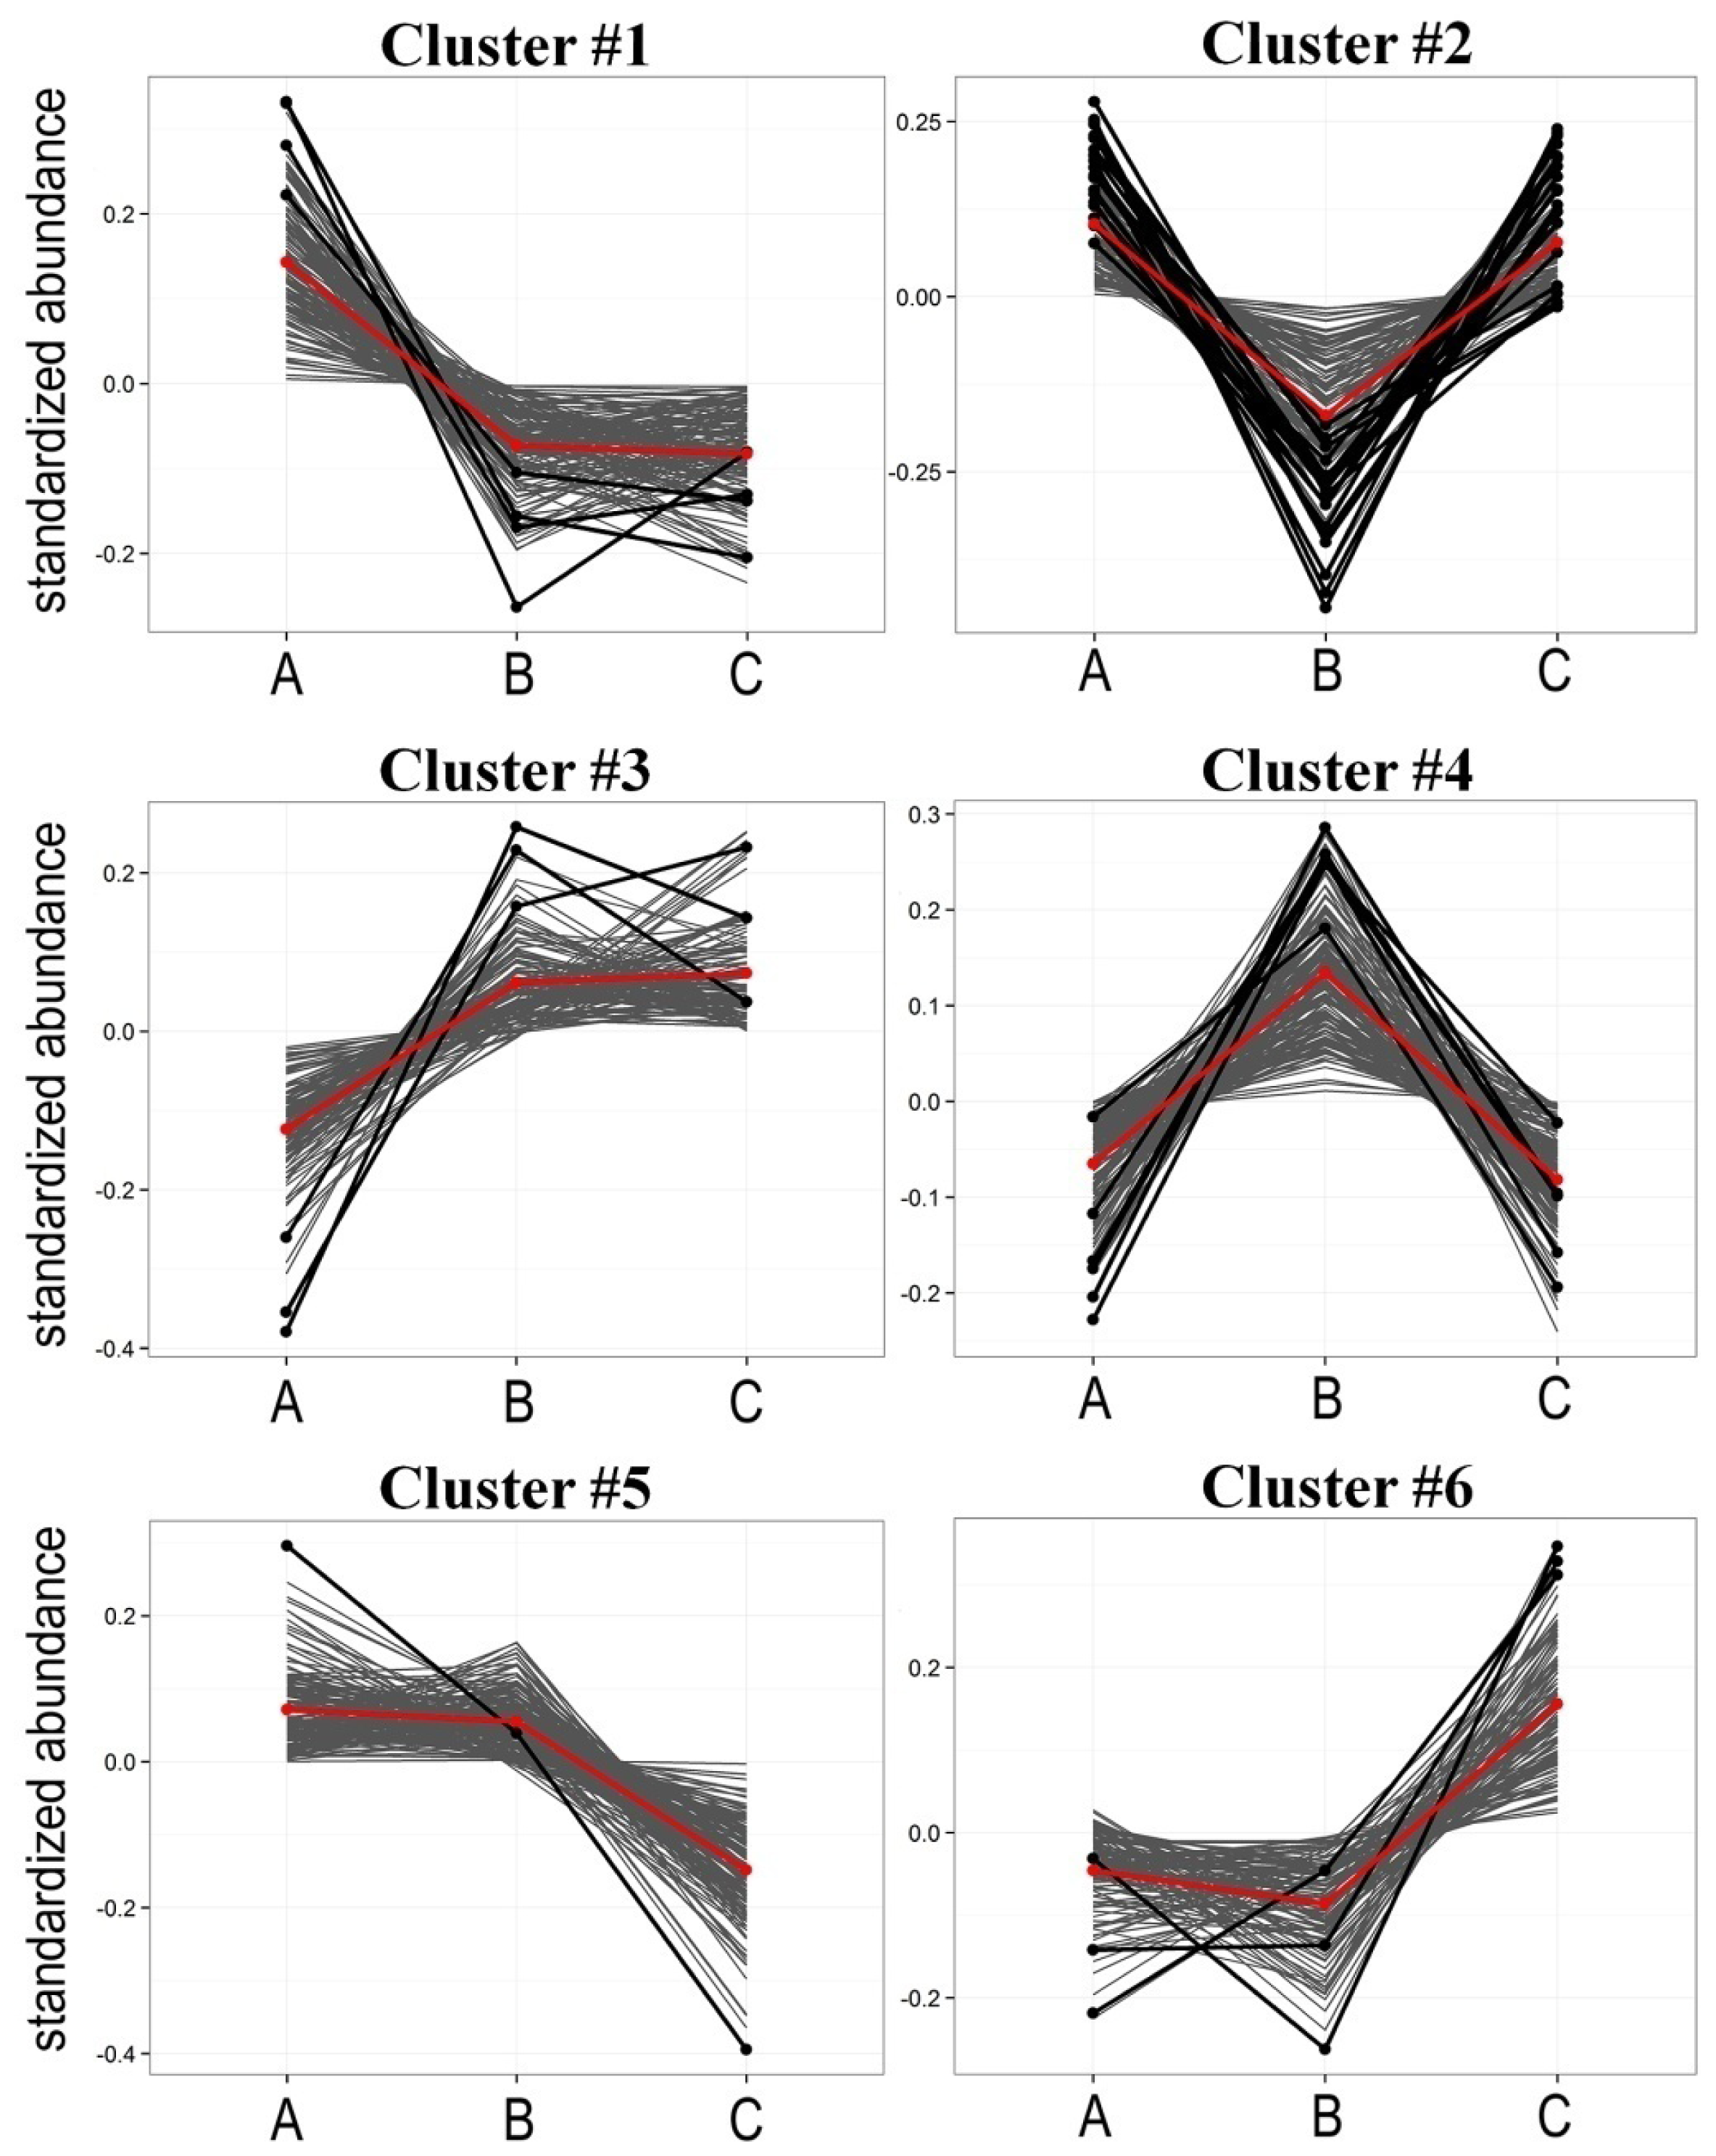
2.2. Radiotherapy-Related Changes in Lipidome Profiles Showed Different Time-Course Patterns
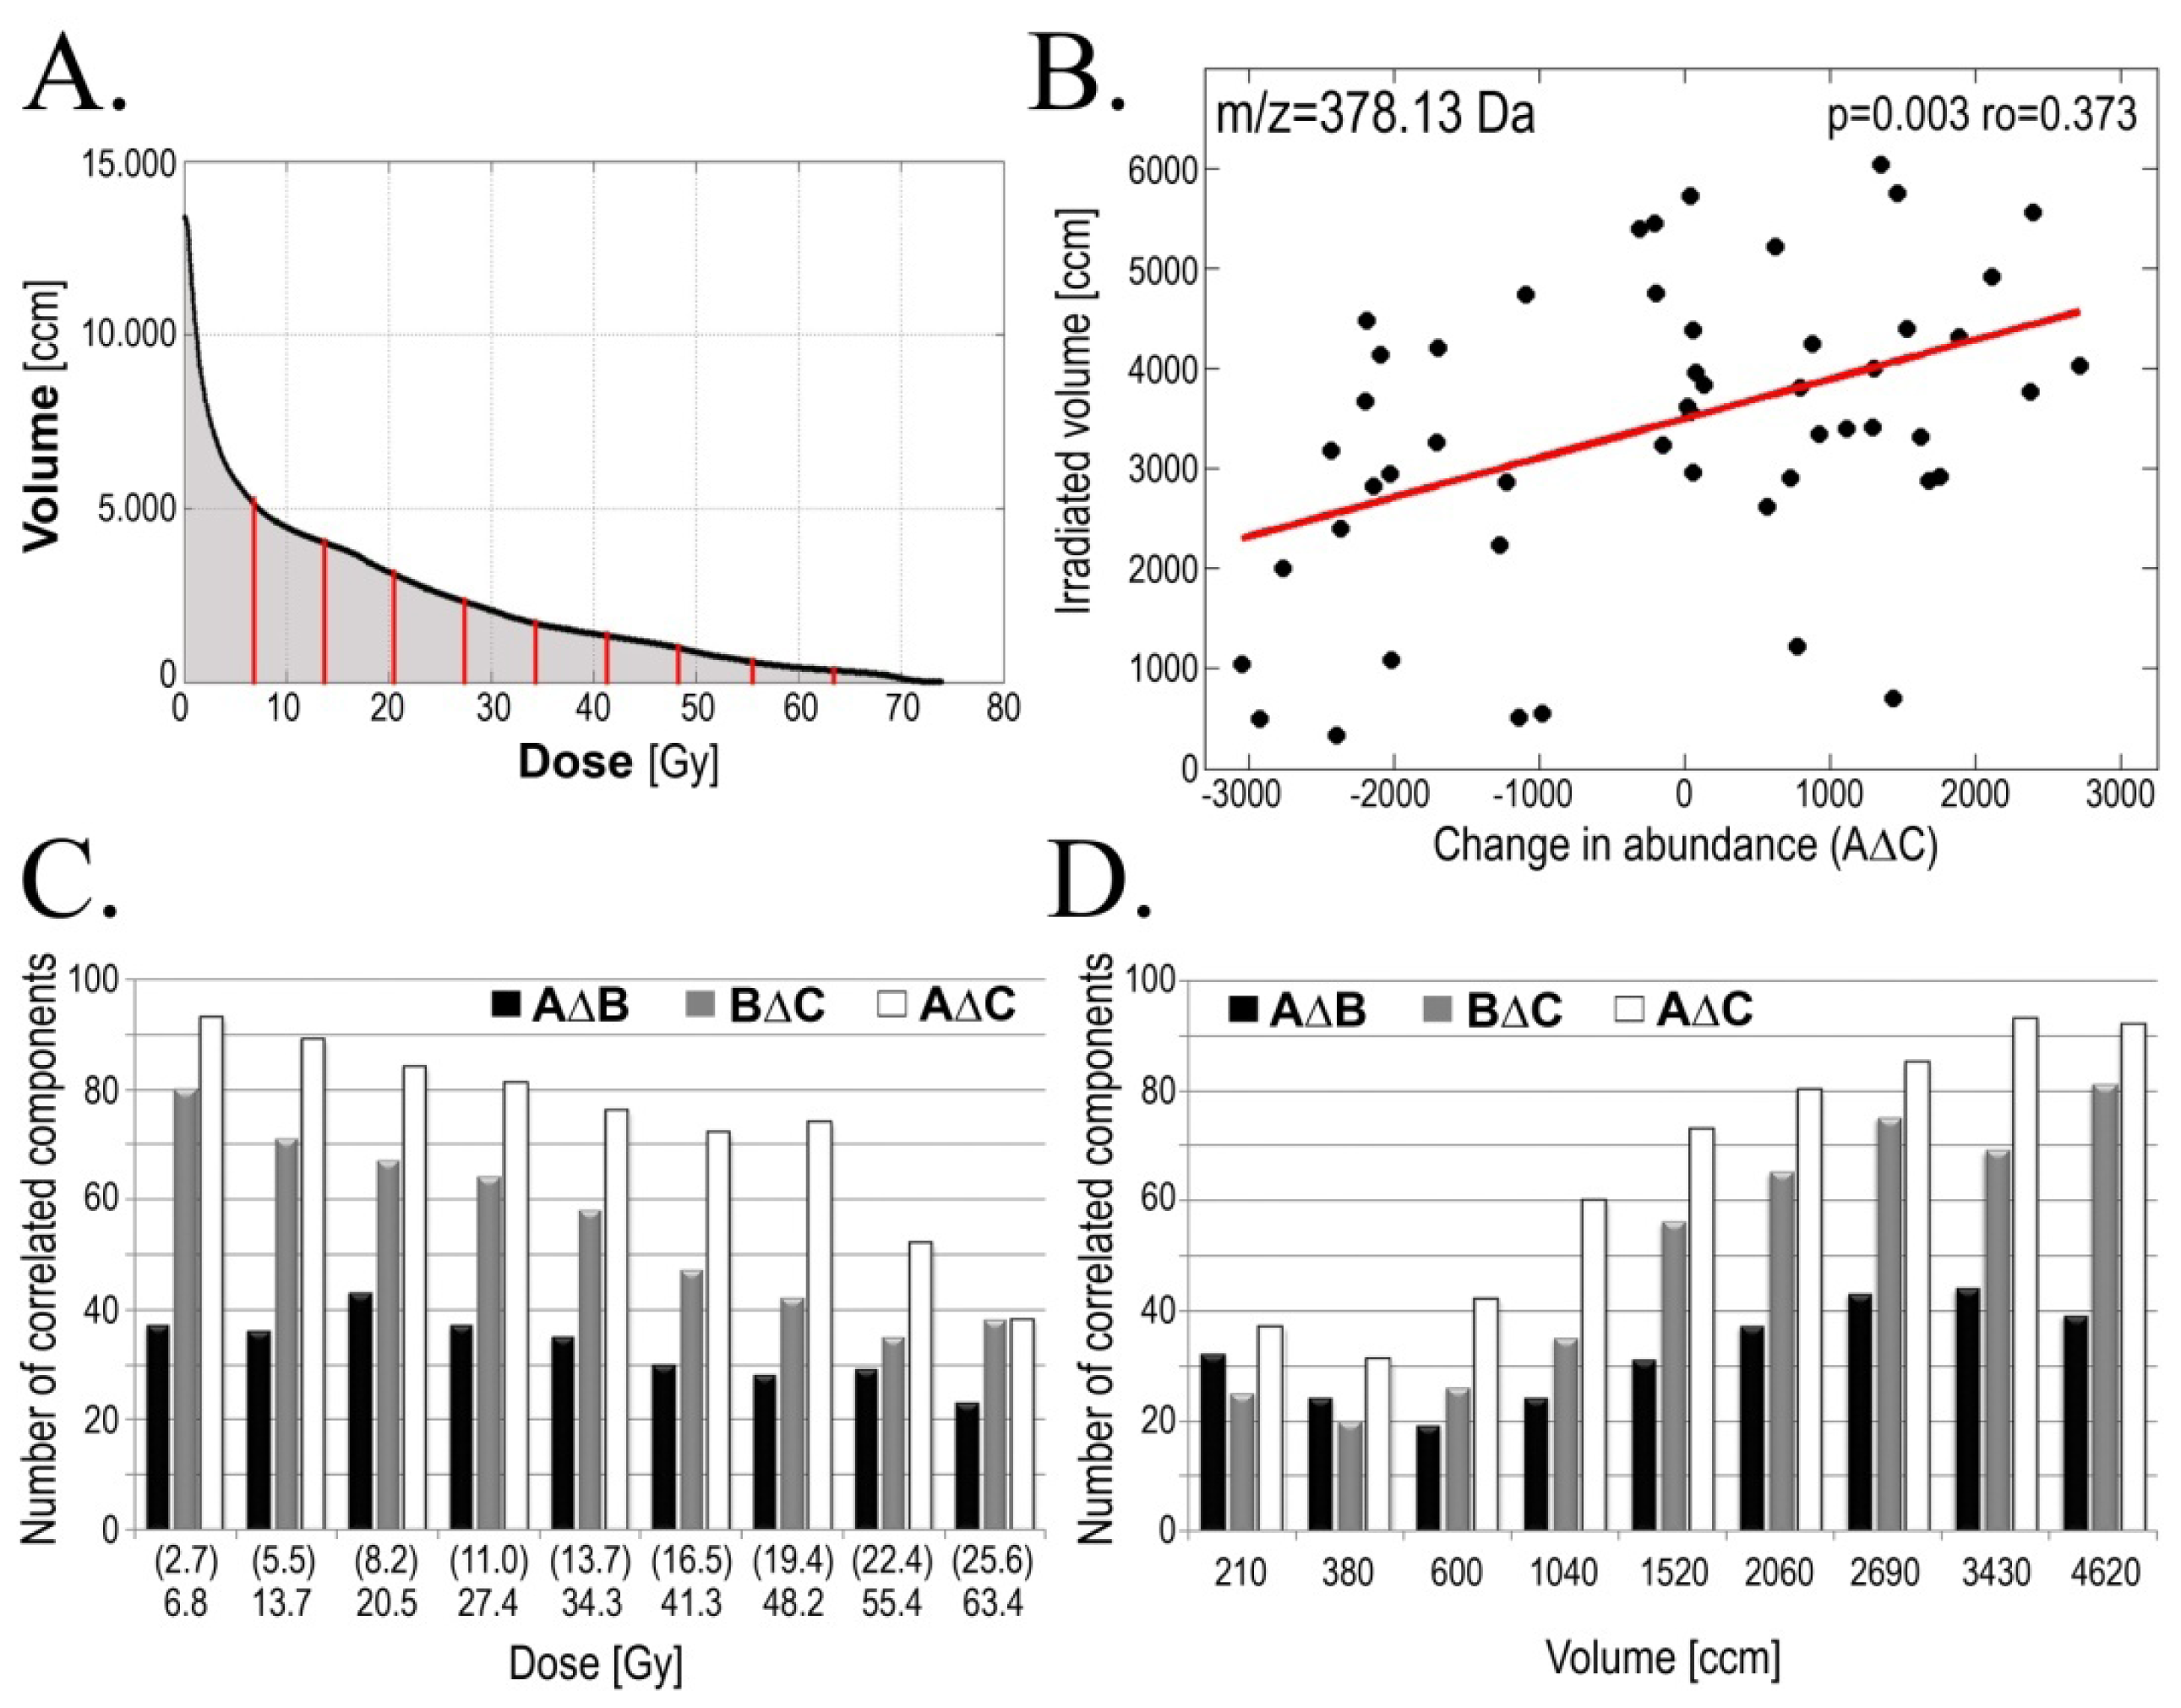
2.3. Radiotherapy-Related Changes in Serum Lipidome Were Associated with Doses of Radiation and Volumes of Irradiated Tissues
2.4. Radiotherapy-Related Changes in Serum Lipidome Were Associated with Radiation Toxicity
3. Discussion
4. Experimental Section
4.1. Characteristics of the Patients
4.2. Preparation of the Samples
4.3. MALDI Mass Spectrometry Analysis
4.4. Processing of the Mass Spectra
4.5. Testing for Differentiating Spectral Components
4.6. Identification of Differentiating Components
4.7. Analysis of Patterns of Changes
4.8. Correlation of Component’s Abundance with Radiation Parameters
5. Conclusions
Acknowledgments
Conflicts of Interest
- Author ContributionsKJ—Performed and interpreted experiments, identified lipid class and length of fatty acyl chains of statistically significant lipid components, prepared the final manuscript, MP—Interpreted MS results, MR—Interpreted MS results, AZ—Performed testing for differentiating spectral components, AS—Performed analysis of patterns of changes, JP—Performed analyses of correlation of component’s abundance with radiation parameters, MM—Performed analyses of correlation of component’s abundance with radiation parameters, TR—Collected and interpreted clinical data, KS—Collected and interpreted clinical data, MRC—Interpreted MS results, PW—Designed the project, designed and interpreted experiments, prepared the final manuscript. All authors read and approved the final manuscript.
References
- Dennis, E.A. Lipidomics joins the omics evolution. Proc. Natl. Acad. Sci. USA 2009, 106, 2089–2090. [Google Scholar]
- Quehenberger, O.; Armando, A.M.; Brown, A.H.; Milne, S.B.; Myers, D.S.; Merrill, A.H.; Bandyopadhyay, S.; Jones, K.N.; Kelly, S.; Shaner, R.L.; et al. Lipidomics reveals a remarkable diversity of lipids in human plasma. J. Lipid Res 2010, 51, 3299–3305. [Google Scholar]
- Marcus, A.J.; Hajjar, D.P. Vascular transcellular signaling. J. Lipid Res 1993, 34, 2017–2031. [Google Scholar]
- Berridge, M.J. Inositol trisphosphate and calcium signaling. Nature 1993, 361, 315–325. [Google Scholar]
- Wright, M.M.; Howe, A.G.; Zaremberg, V. Cell membranes and apoptosis: Role of cardiolipin, phosphatidylcholine, and anticancer lipid analogues. Biochem. Cell Biol 2004, 82, 18–26. [Google Scholar]
- Bartke, N.; Hannun, Y.A. Bioactive sphingolipids: Metabolism and function. J. Lipid Res 2009, 50 Suppl, 91–96. [Google Scholar]
- Ackerstaff, E.; Glunde, K.; Bhujwalla, Z.M. Choline phospholipid metabolism: A target in cancer cells? J. Cell. Biochem 2003, 90, 525–533. [Google Scholar]
- Jagannathan, N.R.; Kumar, M.; Seenu, V.; Coshic, O.; Dwivedi, S.N.; Julka, P.K.; Srivastava, A.; Rath, G.K. Evaluation of total choline from in vivo volume localized proton MR spectroscopy and its response to neoadjuvant chemotherapy in locally advanced breast cancer. Br. J. Cancer 2001, 84, 1016–1022. [Google Scholar]
- Feurgard, C.; Bayle, D.; Guezingar, F.; Serougne, C.; Mazur, A.; Lutton, C.; Aigueperse, J.; Gourmelon, P.; Mathe, D. Effects of ionizing radiation (neutrons/gamma rays) on plasma lipids and lipoproteins in rats. Radiat. Res 1998, 150, 43–51. [Google Scholar]
- Wang, C.; Yang, J.; Nie, J. Plasma phospholipid metabolic profiling and biomarkers of rats following radiation exposure based on liquid chromatography-mass spectrometry technique. Biomed. Chromatogr 2009, 23, 1079–1085. [Google Scholar]
- Halperin, E.C.; Perez, C.A.; Brady, L.W. Perez and Brady’s Principles and Practice of Radiation Oncology, 5th ed.; Wolters Kluwer Health, Lippincott Williams & Wilkins: Philadelphia, PA, USA, 2008. [Google Scholar]
- Lee, N.; Puri, D.R.; Blanco, A.I.; Chao, K.S. Intensity-modulated radiation therapy in head and neck cancers: An update. Head Neck 2007, 29, 387–400. [Google Scholar]
- De Neve, W.; de Gersem, W.; Madani, I. Rational use of intensity-modulated radiation therapy: The importance of clinical outcome. Semin. Radiat. Oncol 2012, 22, 40–49. [Google Scholar]
- Rana, S.; Kumar, R.; Sultana, S.; Sharma, R.K. Radiation-induced biomarkers for the detection and assessment of absorbed radiation doses. J. Pharm. Bioallied Sci 2010, 2, 189–196. [Google Scholar]
- Garaj-Vrhovac, V.; Kopjar, N. The alkaline comet assay as biomarker in assessment of DNA damage in medical personnel occupationally exposed to ionizing radiation. Mutagenesis 2003, 18, 265–271. [Google Scholar]
- Kang, C.M.; Park, K.P.; Song, J.E.; Jeoung, D.I.; Cho, C.K.; Kim, T.H.; Bae, S.; Lee, S.J.; Lee, Y.S. Possible biomarkers for ionizing radiation exposure in human peripheral blood lymphocytes. Radiat. Res 2003, 159, 312–319. [Google Scholar]
- Amundson, S.; Do, K.; Shahab, S.; Bittner, M.; Meltzer, P.; Trent, J.; Fornace, A.J. Identification of potential mRNA biomarkers in peripheral blood lymphocytes for human exposure to ionizing radiation. Radiat. Res 2000, 154, 342–346. [Google Scholar]
- Mah, L.J.; El-Osta, A.; Karagiannis, T.C. γH2AX: A sensitive molecular marker of DNA damage and repair. Leukemia 2010, 24, 679–686. [Google Scholar]
- Menard, C.; Johann, D.; Lowenthal, M.; Muanza, T.; Sproull, M.; Ross, S.; Gulley, J.; Petricoin, E.; Coleman, C.N.; Camphausen, K. Discovering clinical biomarkers of ionizing radiation exposure with serum proteomic analysis. Cancer Res 2006, 66, 1844–1850. [Google Scholar]
- Widlak, P.; Pietrowska, M.; Wojtkiewicz, K.; Rutkowski, T.; Wygoda, A.; Marczak, L.; Marczyk, M.; Polańska, J.; Walaszczyk, A.; Domińczyk, I.; et al. Radiation-related changes in serum proteome profiles detected by mass spectrometry in blood of patients treated with radiotherapy due to larynx cancer. J. Radiat. Res 2011, 52, 575–581. [Google Scholar]
- Widlak, P.; Pietrowska, M.; Polanska, J.; Rutkowski, T.; Jelonek, K.; Kalinowska-Herok, M.; Gdowicz-Klosok, A.; Wygoda, A.; Tarnawski, R.; Skladowski, K. Radiotherapy-related changes in serum proteome patterns of head and neck cancer patients; the effect of low and medium doses of radiation delivered to large volumes of normal tissue. J. Transl. Med 2013, 11. [Google Scholar] [CrossRef]
- Wygoda, A.; Maciejewski, B.; Skladowski, K.; Hutnik, M.; Pilecki, B.; Golen, M.; Rutkowski, T. Pattern analysis of acute mucosal reactions in patients with head and neck cancer treated with conventional and accelerated irradiation. Int. J. Radiat. Oncol. Biol. Phys 2009, 73, 384–390. [Google Scholar]
- Fuchs, B.; Süss, R.; Schiller, J. An update of MALDI-TOF mass spectrometry in lipid research. Prog. Lipid Res 2010, 49, 450–475. [Google Scholar]
- Huang, Y.H.; Schäfer-Elinder, L.; Wu, R.; Claesson, H.E.; Frostegard, J. Lysophosphatidylcholine (LPC) induces proinflammatory cytokines by a platelet-activating factor (PAF) receptor-dependent mechanism. Clin. Exp. Immunol 1999, 116, 326–331. [Google Scholar]
- Taylor, L.A.; Arends, J.; Hodina, A.K.; Unger, C.; Massing, U. Plasma lyso-phosphatidylcholine concentration is decreased in cancer patients with weight loss and activated inflammatory status. Lipids Health Dis 2007, 6, 17. [Google Scholar]
- Fang, X.; Schummer, M.; Mao, M.; Yu, S.; Tabassam, F.H.; Swaby, R.; Hasegawa, Y.; Tanyi, J.L.; LaPushin, R.; Eder, A.; et al. Lysophosphatidic acid is a bioactive mediator in ovarian cancer. Biochim. Biophys. Acta 2002, 23, 57–64. [Google Scholar]
- Schiller, J.; Fuchs, B.; Arnhold, J.; Arnold, K. Contribution of reactive oxygen species to cartilage degradation in rheumatic diseases: Molecular pathways, diagnosis and potential therapeutic strategies. Curr. Med. Chem 2003, 10, 2123–2145. [Google Scholar]
- Green, D.R. Apoptosis and sphingomyelin hydrolysis: The flip side. J. Cell Biol 2000, 150, 5–8. [Google Scholar]
- Skladowski, K.; Maciejewski, B.; Golen, M.; Tarnawski, R.; Slosarek, K.; Suwinski, R.; Sygula, M.; Wygoda, A. Continuous accelerated 7-days-a-week radiotherapy for head-and-neck cancer: Long-term results of phase III clinical trial. Int. J. Radiat. Oncol. Biol. Phys 2006, 66, 706–713. [Google Scholar]
- Folch, J.; Lees, M.; Stanley, G.H.S. A simple method for the isolation and purification of total lipids from animal tissues. J. Biol. Chem 1957, 226, 497–509. [Google Scholar]
- Hilario, M.; Kalousis, A.; Pellegrini, C.; Müller, M. Processing and classification of protein mass spectra. Mass Spectrom. Rev 2006, 25, 409–449. [Google Scholar]
- Spectrolyzer Software Suite, MedicWave AB, Halmstad, Sweden. 27 January 2014. Available online: http://www.spectrolyzer.com/spectrolyzer/help-support/manual/.
- Cruz-Marcelo, A.; Guerra, R.; Vannucci, M.; Li, Y.; Lau, C.; Man, T. Comparison of algorithms for preprocessing of SELDI-TOF mass spectrometry data. Bioinformatics 2008, 24, 2129–2136. [Google Scholar]
- Yang, C.; He, Z.; Yu, W. Comparison of public peak detection algorithms for MALDI mass spectrometry data analysis. BMC Bioinform 2009, 10. [Google Scholar] [CrossRef]
- R Core Team. R: A language and environment for statistical computing; R Foundation for Statistical Computing, 28 January 2014. Available online: http://www.R-project.org/.
- Storey, J.D. A direct approach to false discovery rates. JRSSB 2002, 64, 479–498. [Google Scholar]
- Sud, M.; Fahy, E.; Cotter, D.; Brown, A.; Dennis, E.A.; Glass, C.K.; Merrill, A.H., Jr.; Murphy, R.C.; Raetz, C.R.H.; Russell, D.W.; et al. LMSD: LIPID MAPS structure database. Nucleic Acids Res 2006, 35, D527–D532. [Google Scholar]
- Kaufman, L.; Rousseeuw, P.J. Finding Groups in Data: An Introduction to Cluster Analysis; John Wiley & Sons, Inc: Hoboken, NJ, USA, 1990. [Google Scholar]
- Handl, J.; Knowles, J.; Kell, D.B. Computational cluster validation in post-genomic data analysis. Bioinformatics 2005, 21, 3201–3212. [Google Scholar]


| Ion mass[m/z] | Significant change (FDR < 5%) | Pattern of changes | Cluster number | Lipid class identification |
|---|---|---|---|---|
| 373.08 | AΔB | A < B > C | #4 | not assigned |
| 496.36 | AΔB | A > B < C | #2 | LPC(16:0) + H+ |
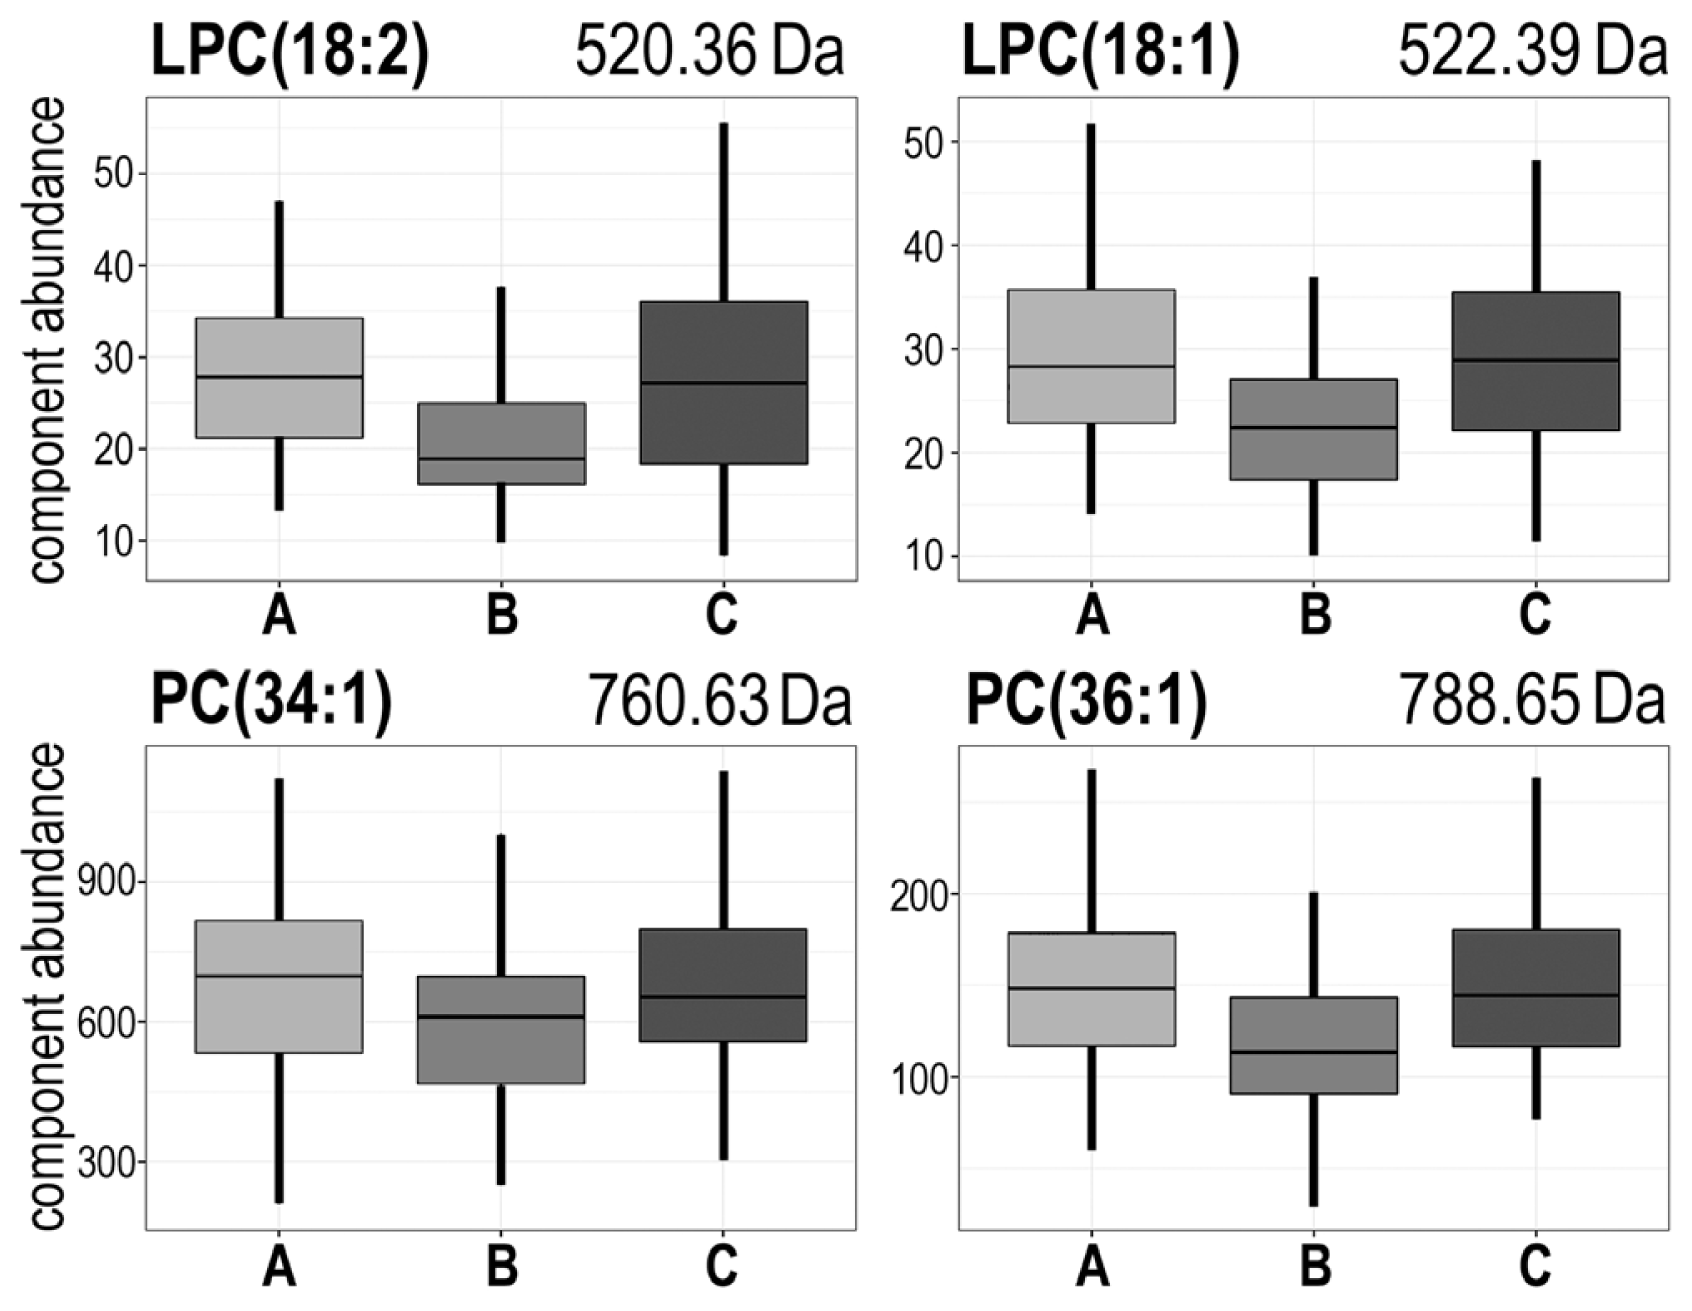
| 520.36 | AΔB;BΔC | A > B < C | #2 | LPC(18:2) + H+ |
| 522.39 | AΔB;BΔC | A > B < C | #2 | LPC(18:1) + H+ |
| 524.38 | AΔB | A > B < C | #2 | LPC(18:0) + H+ |
| 543.39 | AΔB | A > B = C | #2 | not assigned |
| 560.28 | AΔB | A > B = C | #1 | [Vitamin D3 adduct] + H+ |
| 564.64 | BΔC | A = B > C | #4 | Cer(36:2) + H+ |
| 587.33 | AΔB | A < B > C | #4 | not assigned |
| 601.12 | AΔB | A < B > C | #4 | not assigned |
| 603.68 | AΔB;BΔC | A < B < C | #6 | not assigned |
| 644.11 | AΔB | A < B > C | #4 | not assigned |
| 703.58 | BΔC | A = B < C | #6 | SM(34:1) + H+ |
| 721.49 | BΔC | A > B < C | #2 | not assigned |
| 726.53 | AΔC | A = B < C | #6 | not assigned |
| 730.62 | AΔB | A < B = C | #3 | PC(32:2) + H+ |
| 732.47 | BΔC | A > B < C | #2 | not assigned |
| 732.63 | AΔB | A < B = C | #3 | PC(32:1) + H+ |
| 749.51 | AΔB;BΔC | A > B < C | #2 | not assigned |
| 751.47 | AΔB;AΔC | A > B = C | #1 | not assigned |
| 751.61 | AΔB | A < B = C | #4 | not assigned |
| 755.42 | AΔB | A > B = C | #1 | not assigned |
| 755.63 | AΔB | A < B = C | #3 | SM(38:3) + H+ |
| 758.61 | BΔC | A > B < C | #2 | PC(34:2) + H+ |
| 760.63 | AΔB;BΔC | A > B < C | #2 | PC(34:1) + H+ |
| 762.63 | BΔC | A > B < C | #2 | PC(34:0) + H+ |
| 767.47 | BΔC | A > B < C | #2 | not assigned |
| 777.33 | AΔC | A = B > C | #5 | not assigned |
| 784.62 | AΔB | A > B < C | #2 | PC(36:3) + H+ |
| 786.64 | AΔB;BΔC | A > B < C | #2 | PC(36:2) + H+ |
| 786.94 | AΔB | A > B < C | #2 | not assigned |
| 788.65 | AΔB;BΔC | A > B < C | #2 | PC(36:1) + H+ |
| 790.65 | AΔB | A > B < C | #2 | PC(36:0) + H+ |
| 808.62 | AΔB | A > B < C | #2 | PC(38:5) + H+ |
| 825.58 | AΔB | A > B = C | #2 | not assigned |
| 839.50 | AΔB | A > B = C | #4 | not assigned |
| Cluster | Pattern of change * | Number of components | Number of differentiating components ** |
|---|---|---|---|
| #1 | A > B = C | 147 | 4 |
| #2 | A > B < C | 129 | 19 |
| #3 | A < B = C | 121 | 3 |
| #4 | A < B > C | 170 | 6 |
| #5 | A = B > C | 160 | 1 |
| #6 | A = B < C | 115 | 3 |
| Change | GTV-D | AMR | Examples of components [m/z] * |
|---|---|---|---|
| AΔB | 44 | 36 | 473.11; 514.21; 590.61; 872.42 |
| BΔC | 37 | 41 | 583.61; 669.64 |
| AΔC | 60 | 35 | 614.38; 641.33; 649.43; 655.65; 673.62; 765.64; 803.71; 886.88 |
© 2014 by the authors; licensee MDPI, Basel, Switzerland This article is an open access article distributed under the terms and conditions of the Creative Commons Attribution license (http://creativecommons.org/licenses/by/3.0/).
Share and Cite
Jelonek, K.; Pietrowska, M.; Ros, M.; Zagdanski, A.; Suchwalko, A.; Polanska, J.; Marczyk, M.; Rutkowski, T.; Skladowski, K.; Clench, M.R.; et al. Radiation-Induced Changes in Serum Lipidome of Head and Neck Cancer Patients. Int. J. Mol. Sci. 2014, 15, 6609-6624. https://doi.org/10.3390/ijms15046609
Jelonek K, Pietrowska M, Ros M, Zagdanski A, Suchwalko A, Polanska J, Marczyk M, Rutkowski T, Skladowski K, Clench MR, et al. Radiation-Induced Changes in Serum Lipidome of Head and Neck Cancer Patients. International Journal of Molecular Sciences. 2014; 15(4):6609-6624. https://doi.org/10.3390/ijms15046609
Chicago/Turabian StyleJelonek, Karol, Monika Pietrowska, Malgorzata Ros, Adam Zagdanski, Agnieszka Suchwalko, Joanna Polanska, Michal Marczyk, Tomasz Rutkowski, Krzysztof Skladowski, Malcolm R. Clench, and et al. 2014. "Radiation-Induced Changes in Serum Lipidome of Head and Neck Cancer Patients" International Journal of Molecular Sciences 15, no. 4: 6609-6624. https://doi.org/10.3390/ijms15046609