Exploring the Molecular Basis for Selective Binding of Homoserine Dehydrogenase from Mycobacterium leprae TN toward Inhibitors: A Virtual Screening Study

Abstract
:
1. Introduction
2. Results and Discussion
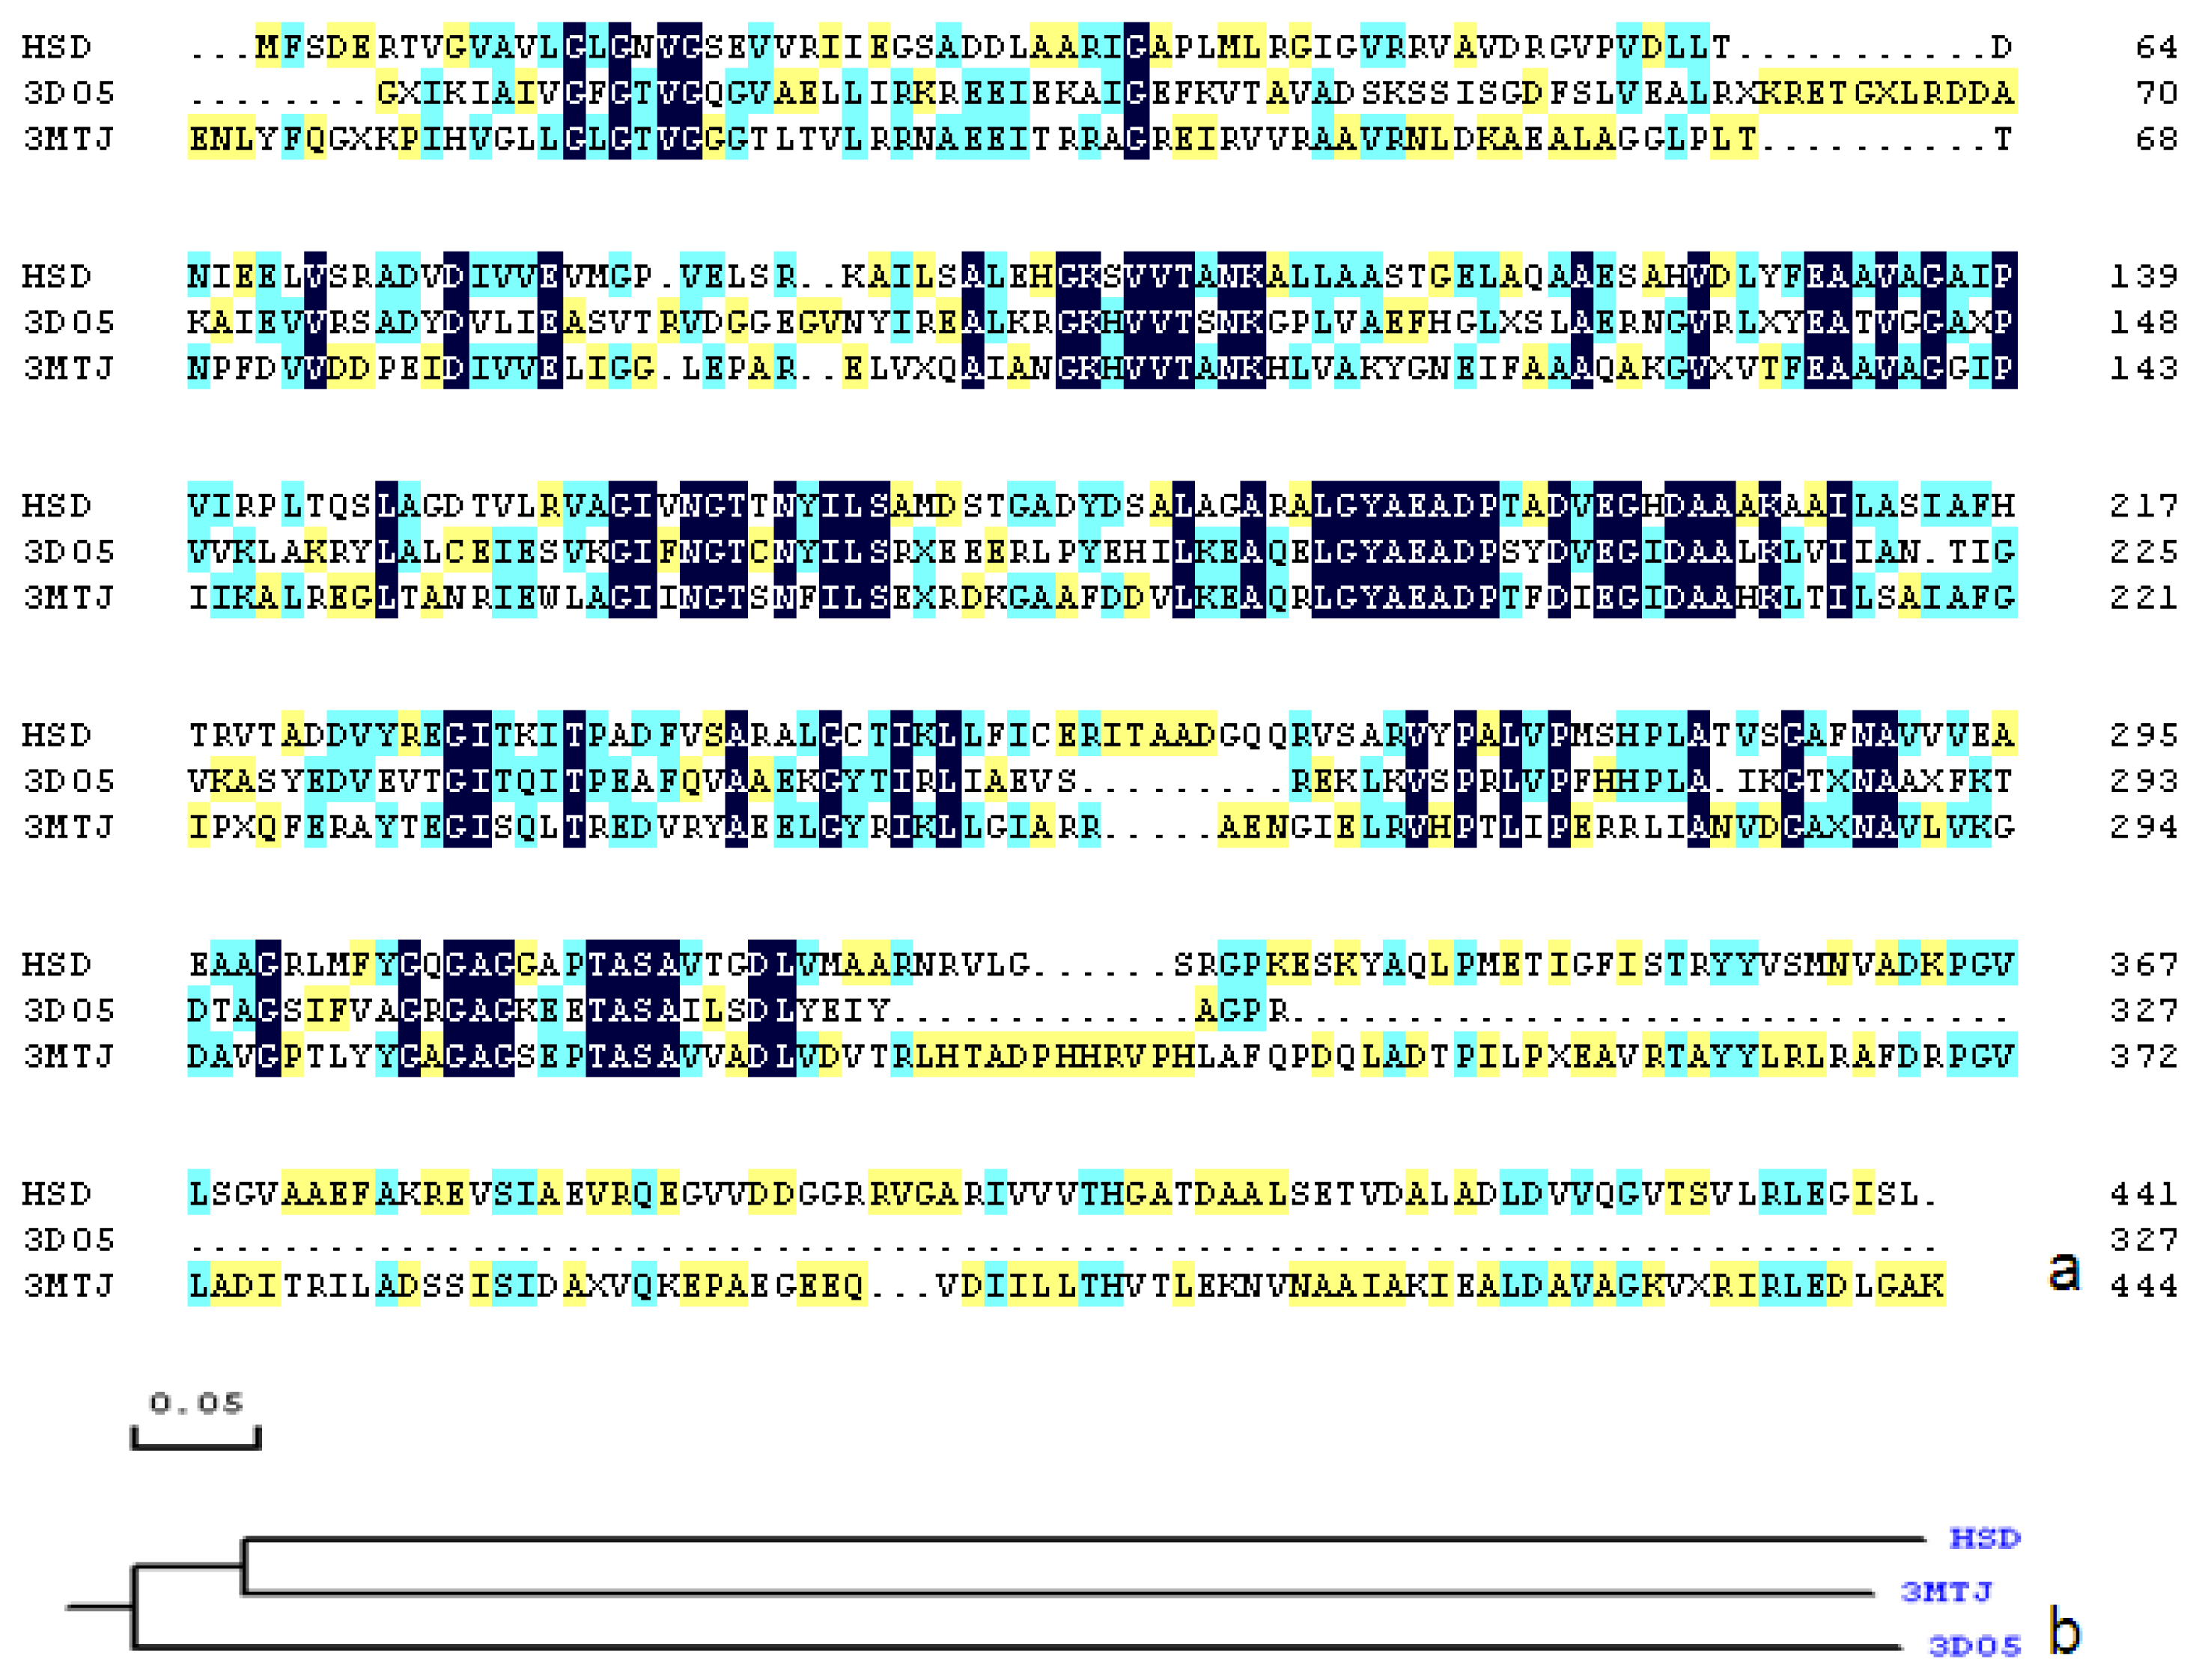
2.1. Sequence Alignments and Molecular Modeling
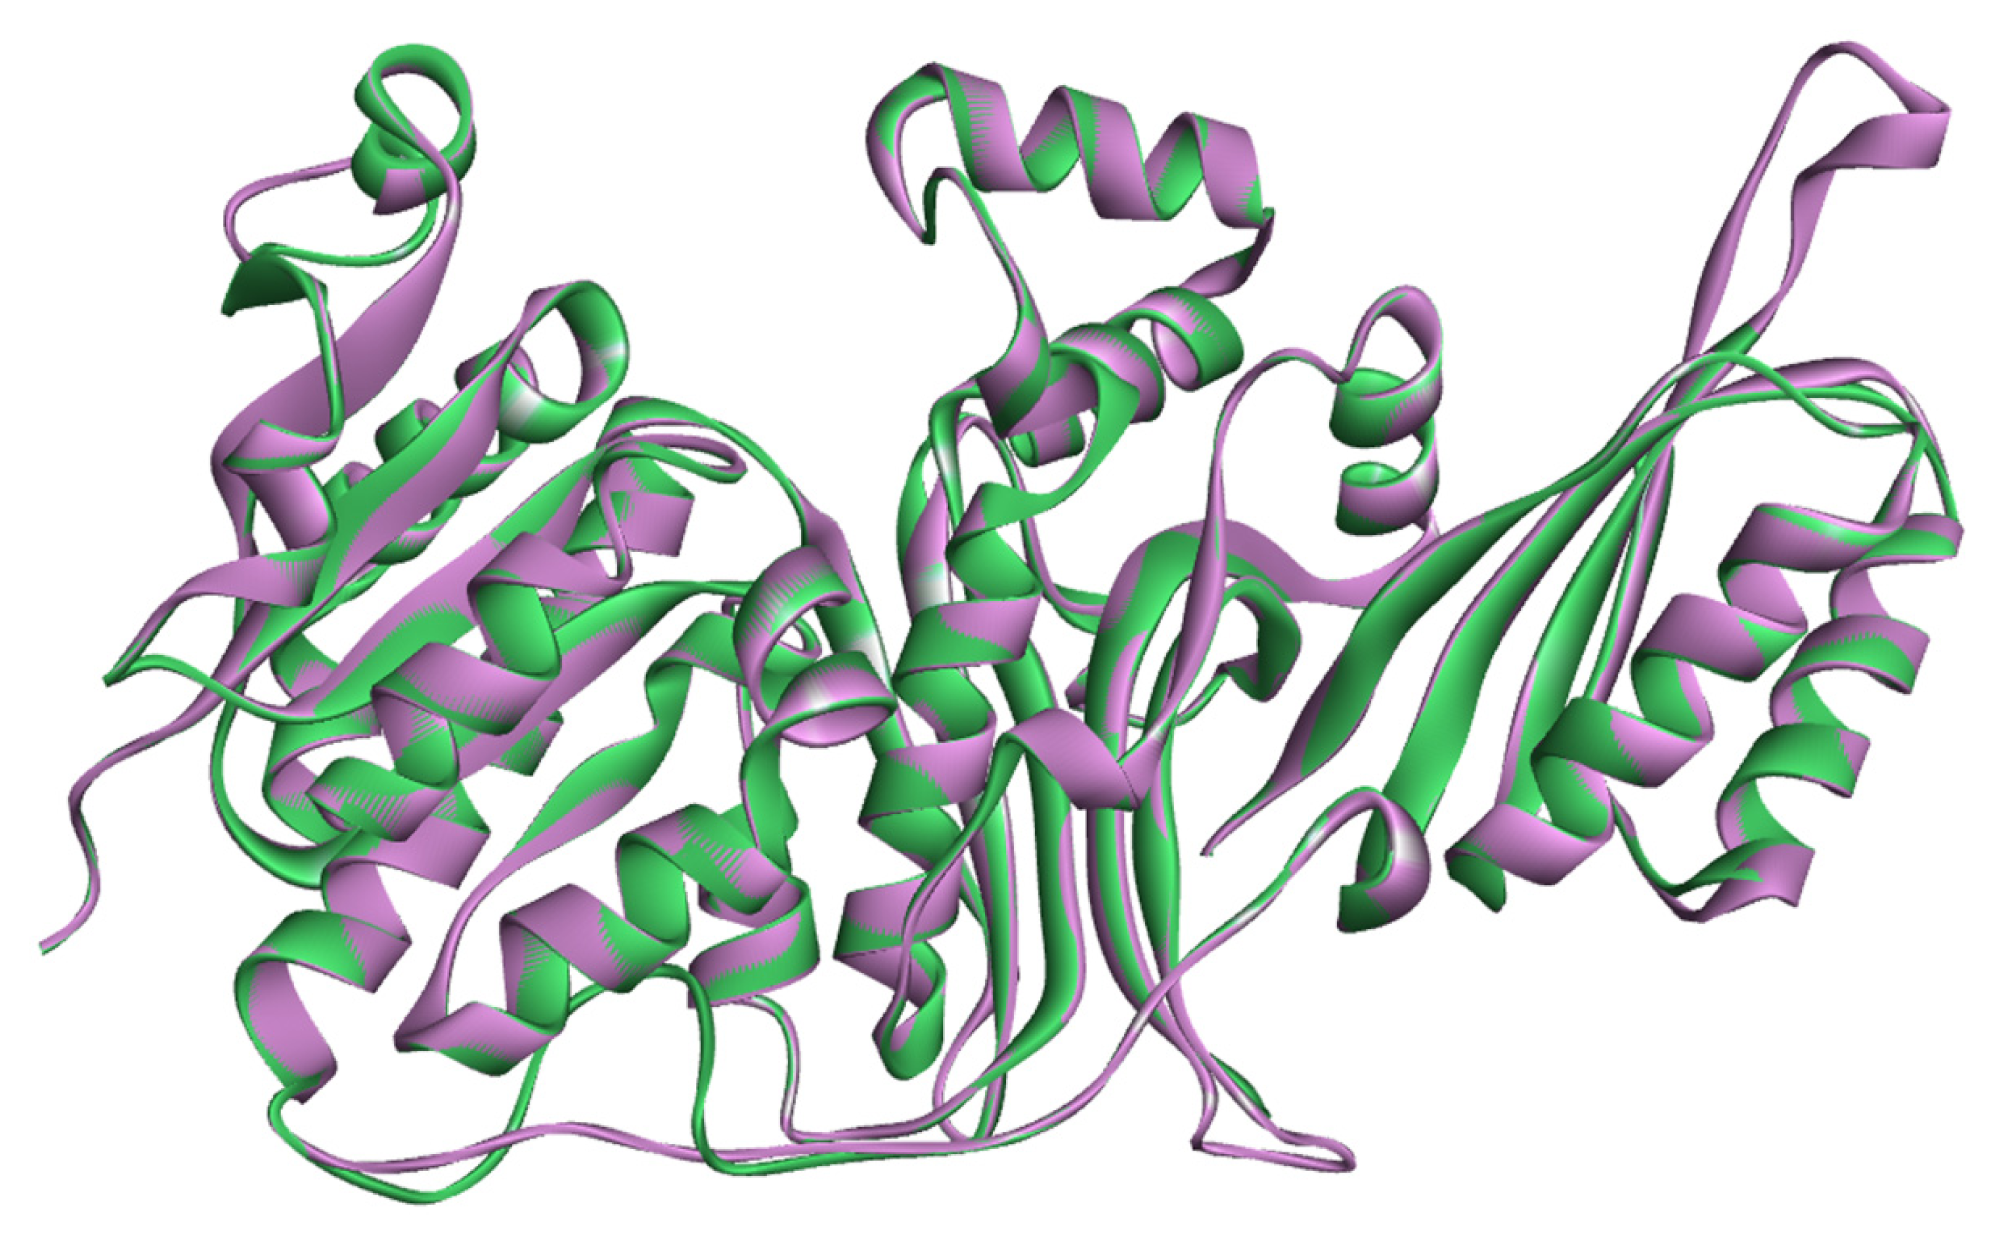
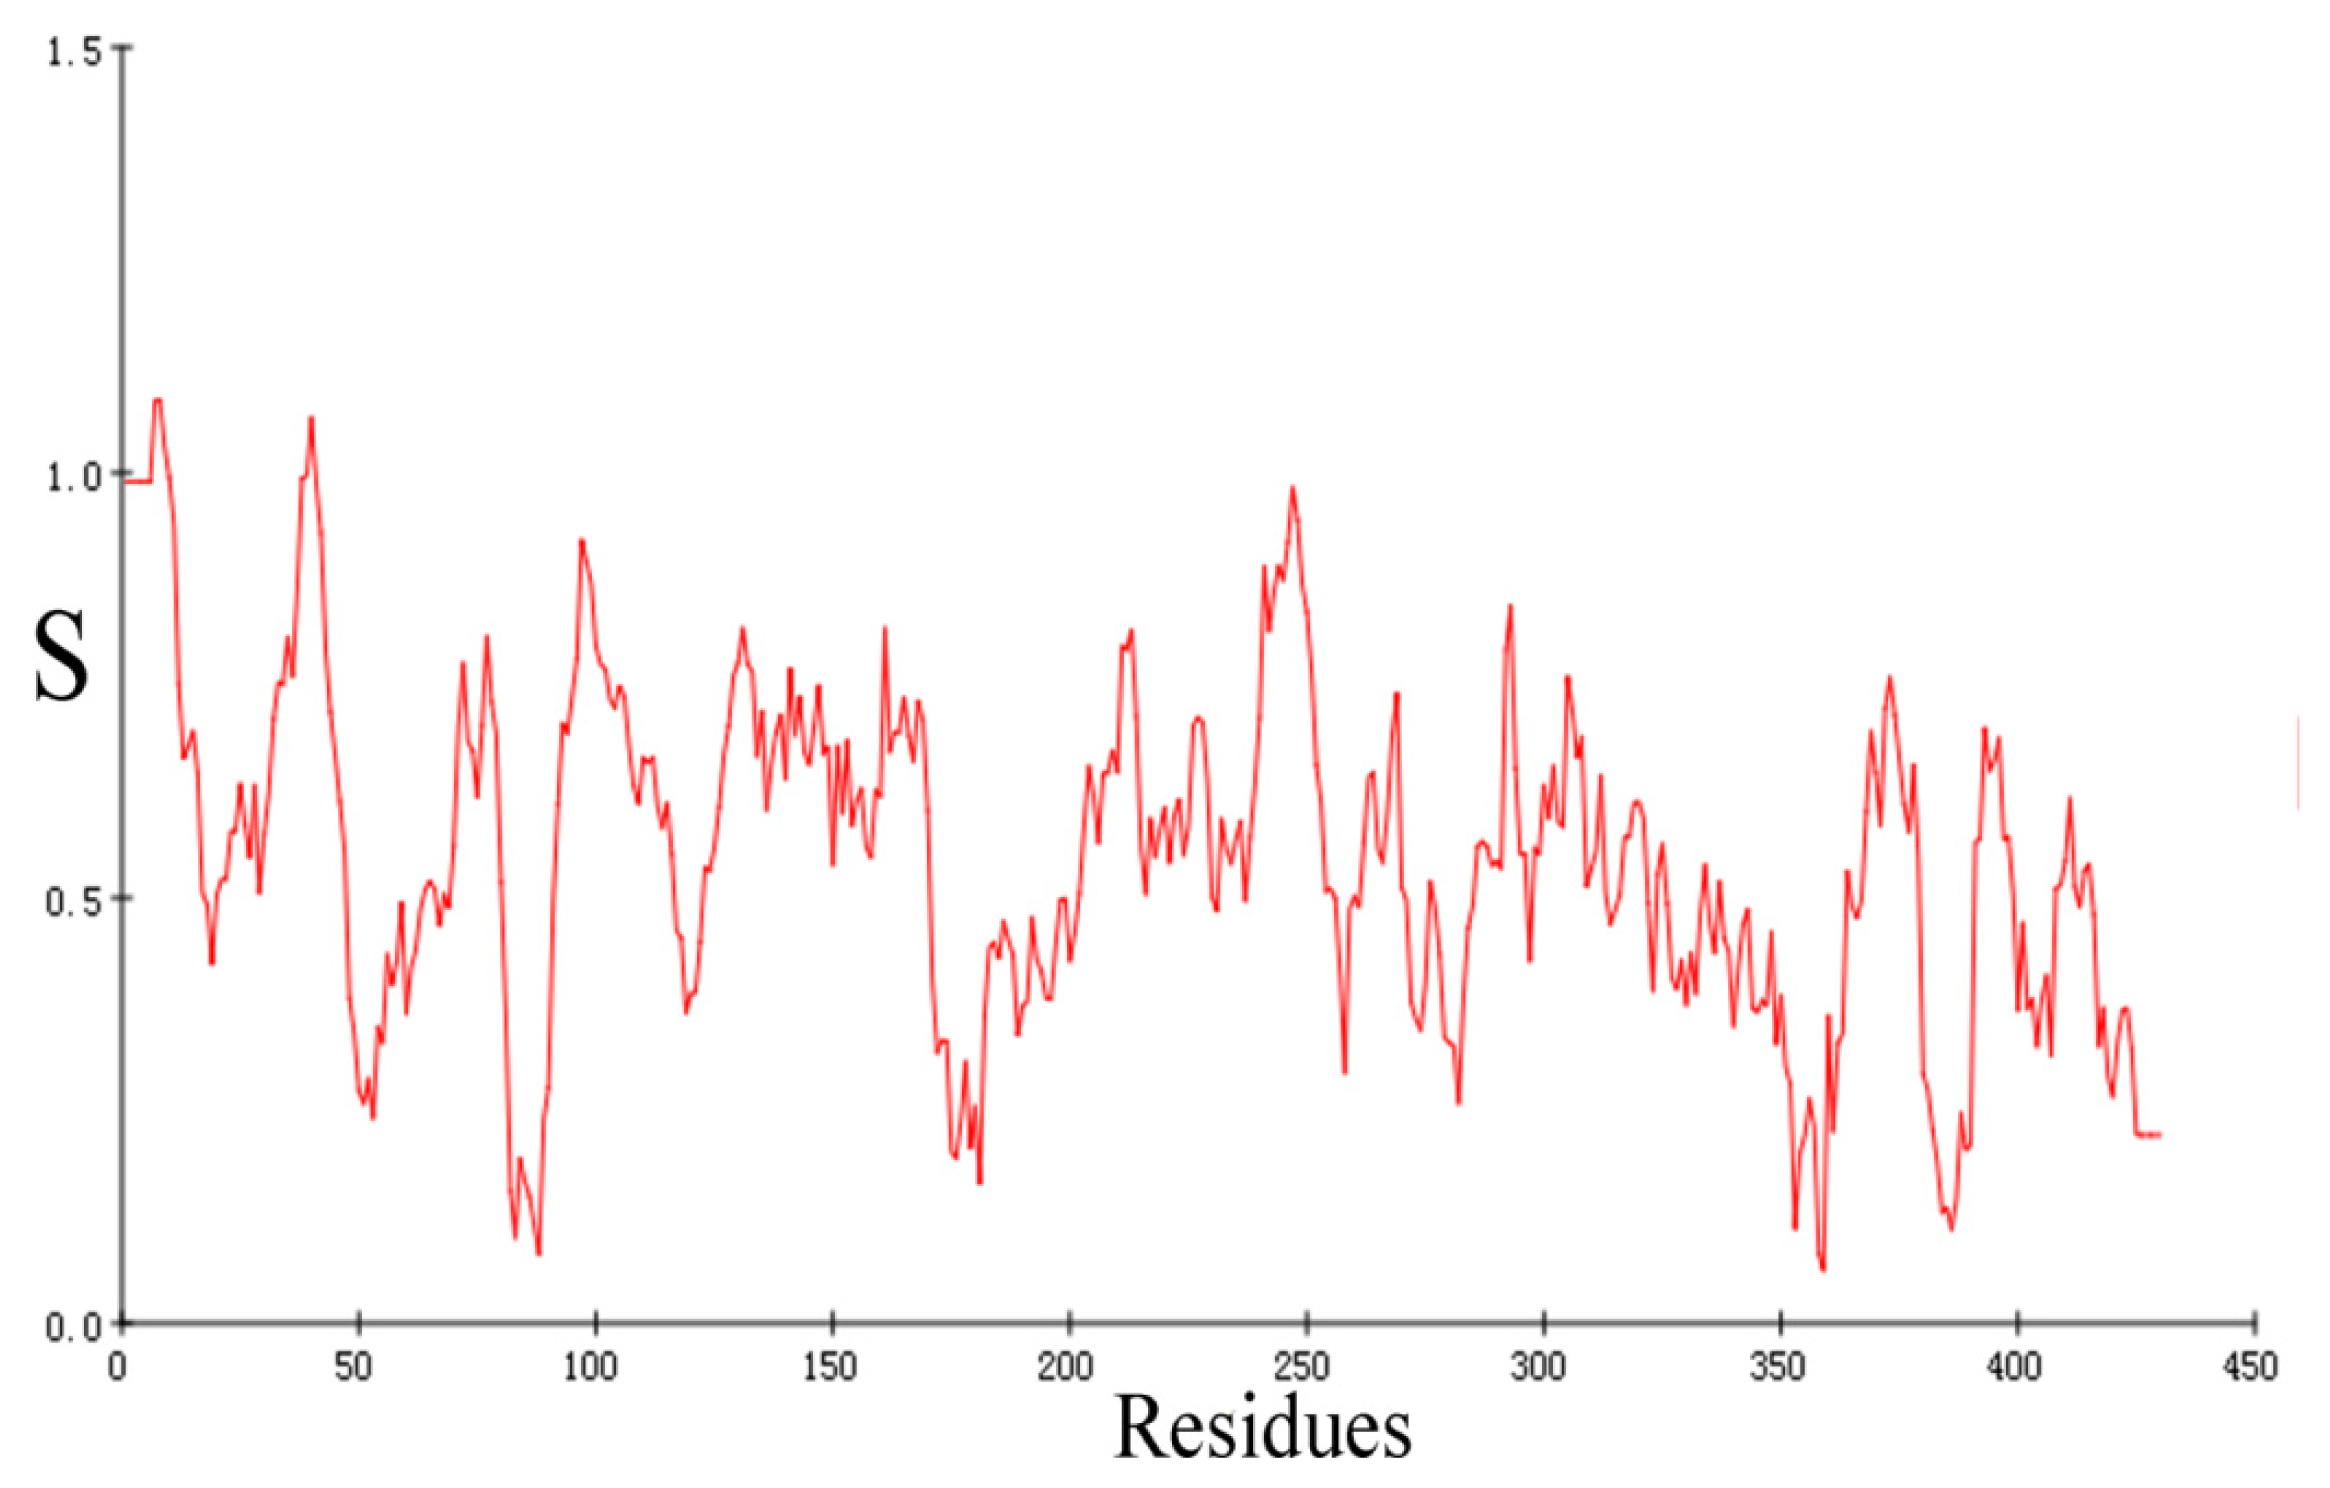
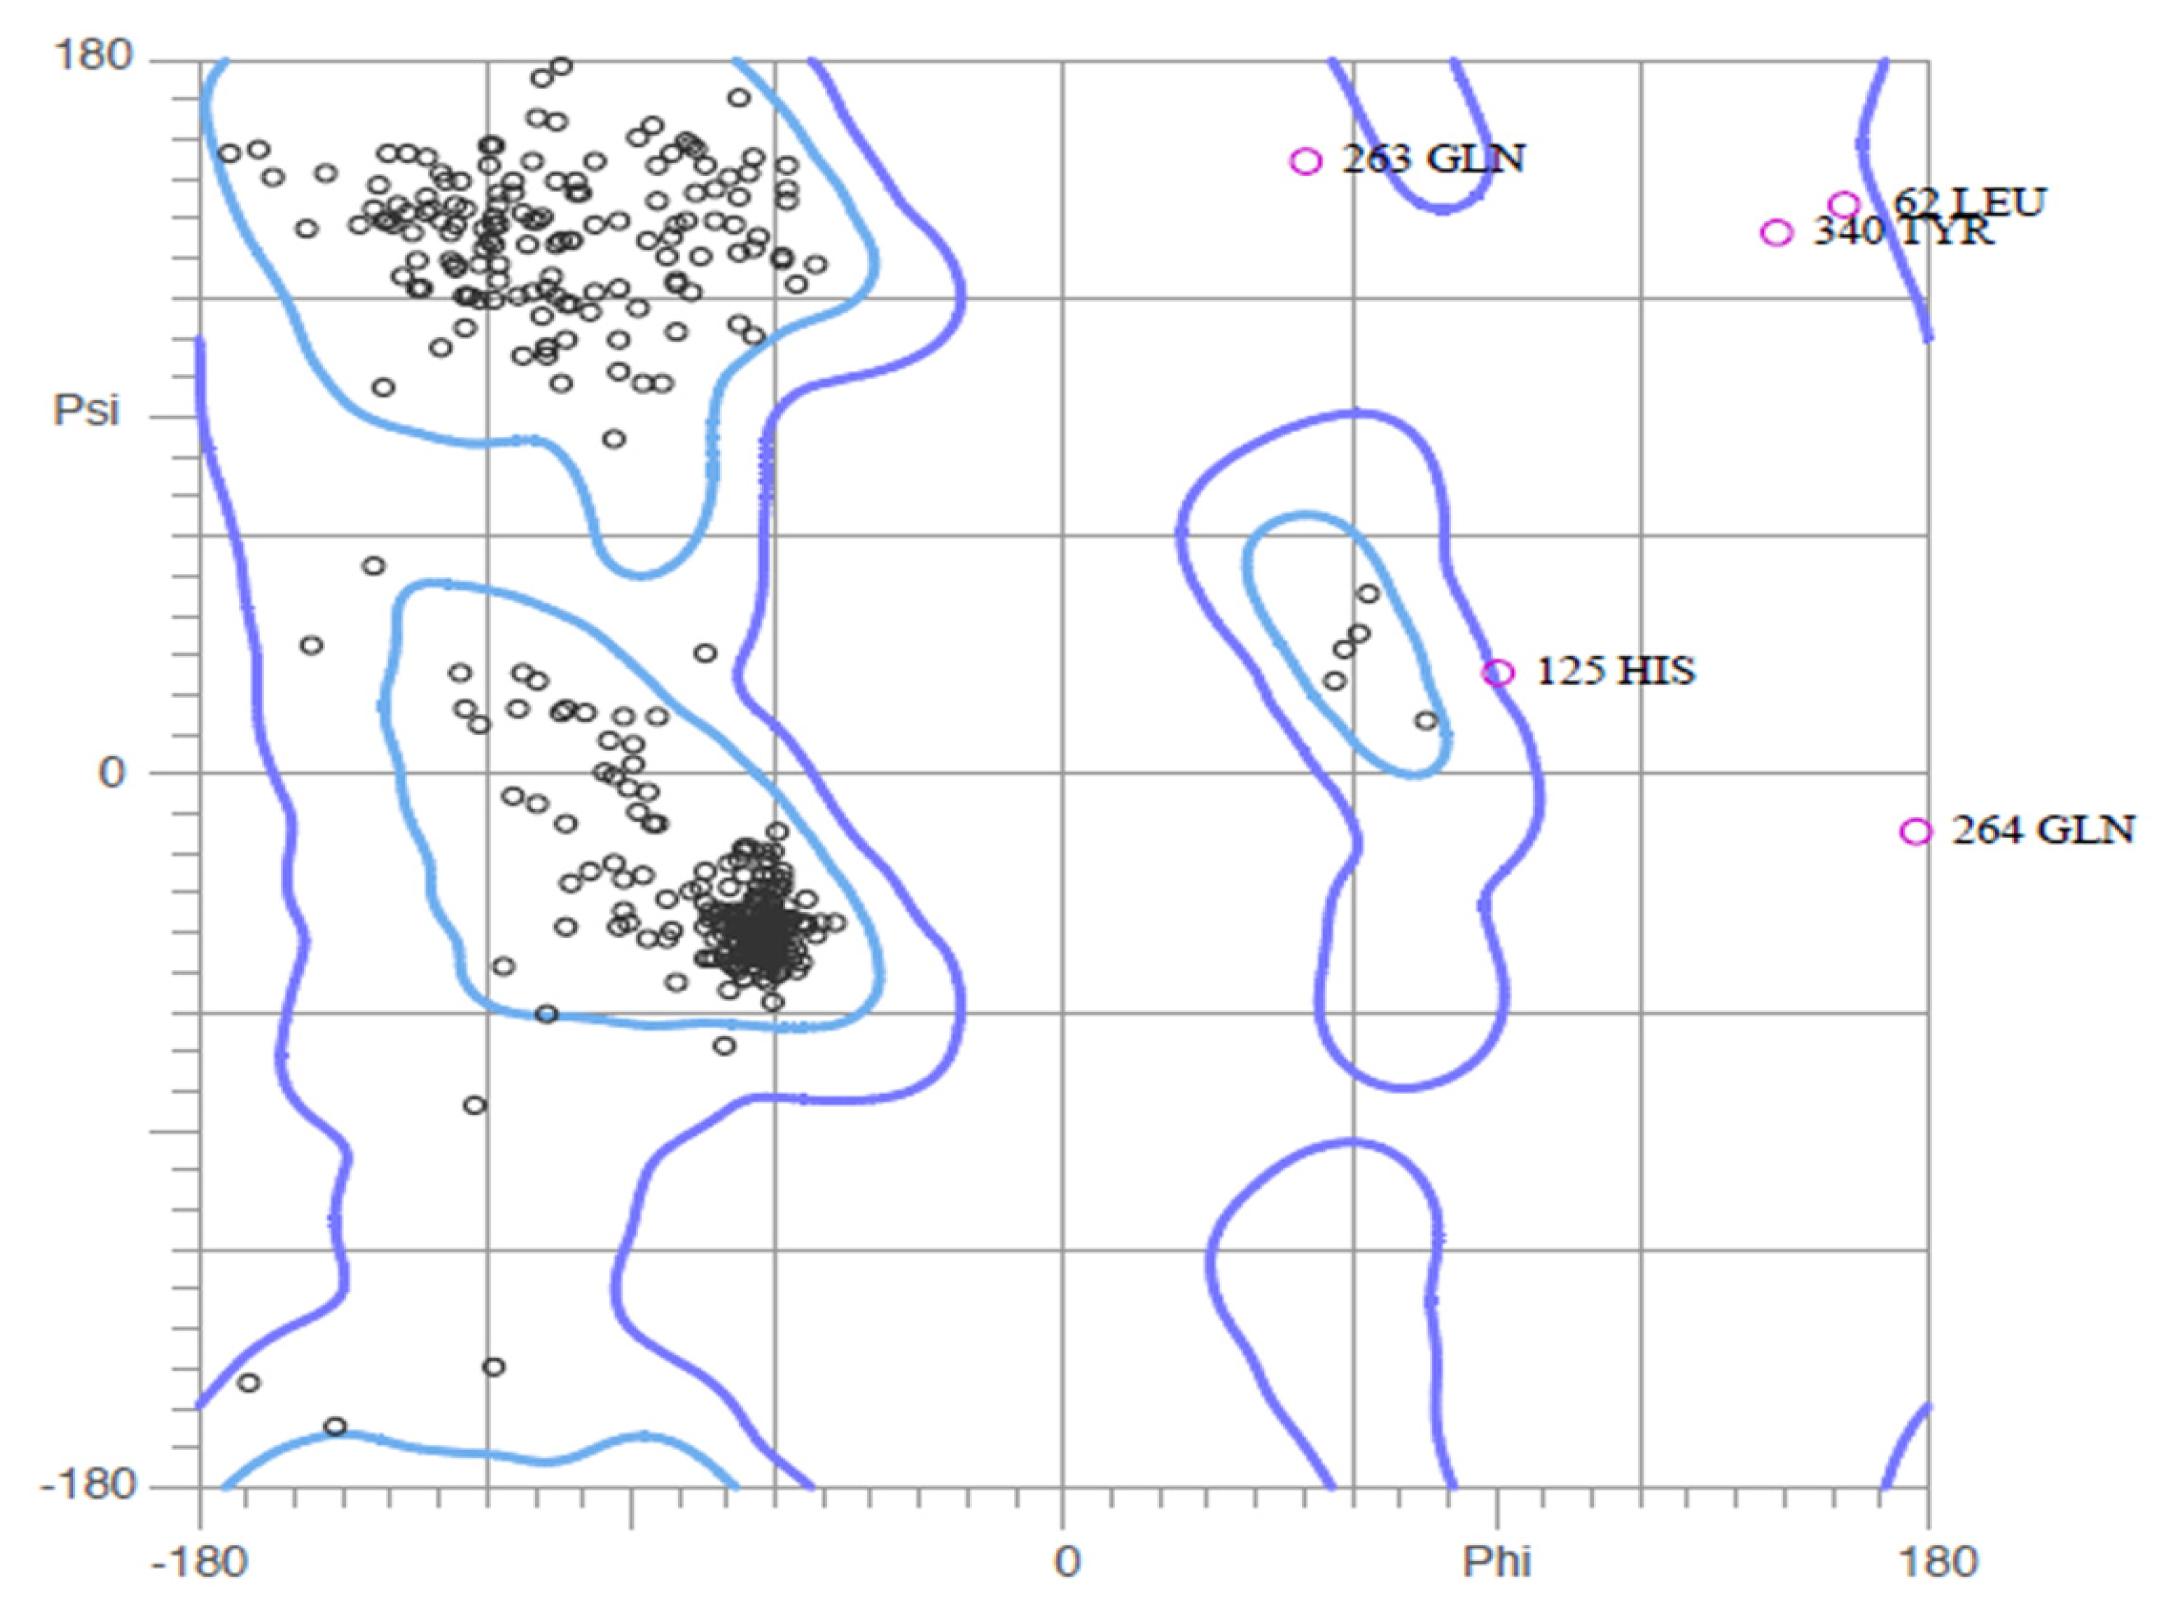
2.2. Validation of Homology Model
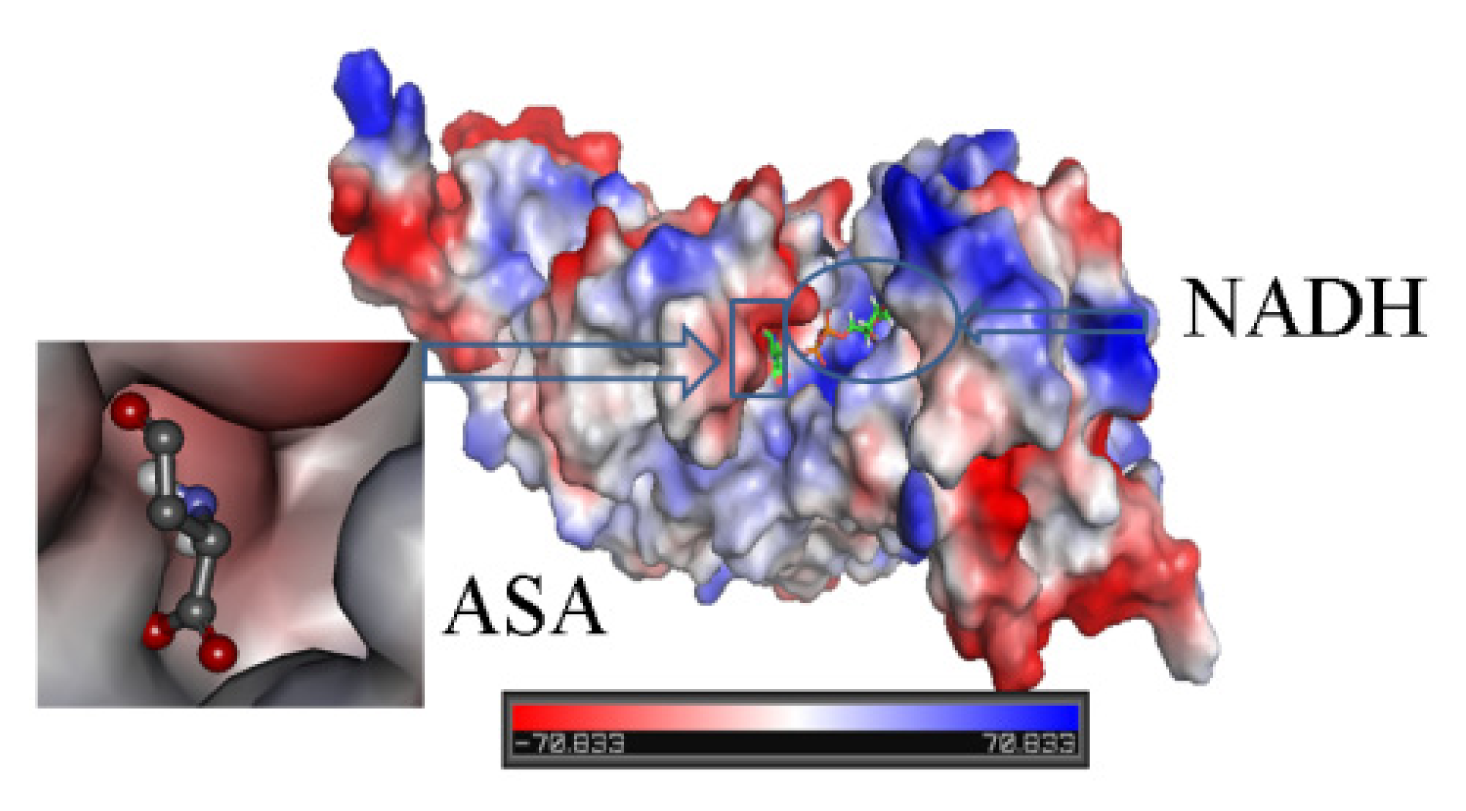
2.3. Identification of Substrate-Binding Region and Co-Factor-Binding Region in HSD
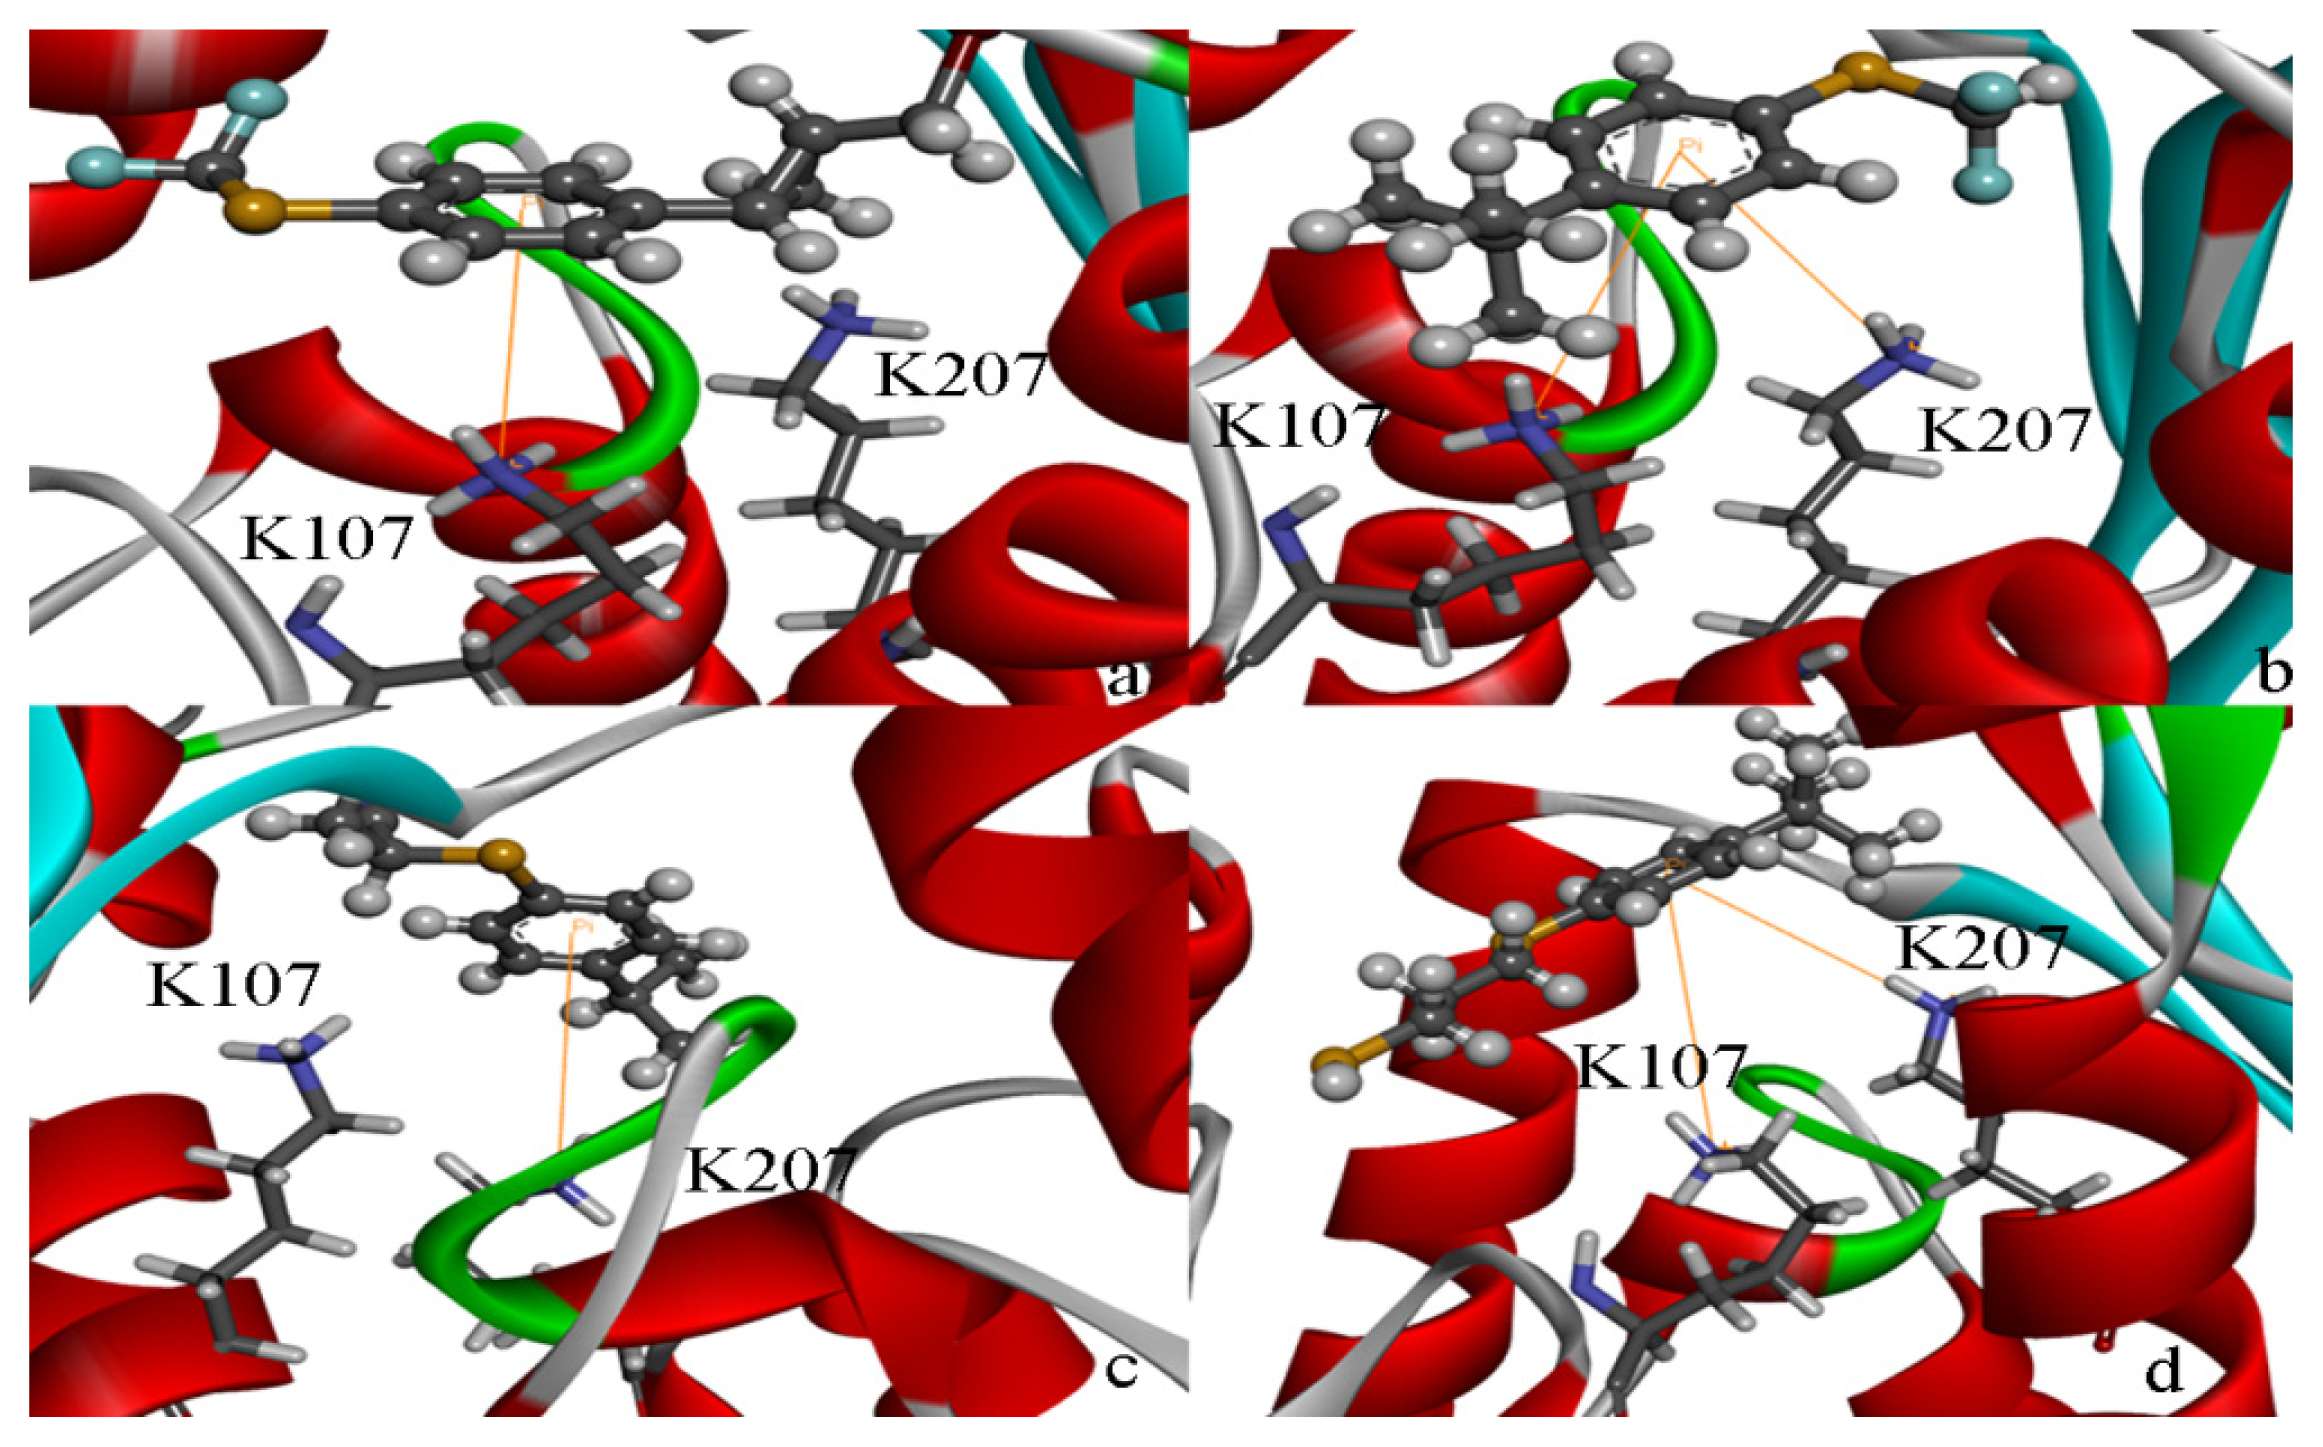
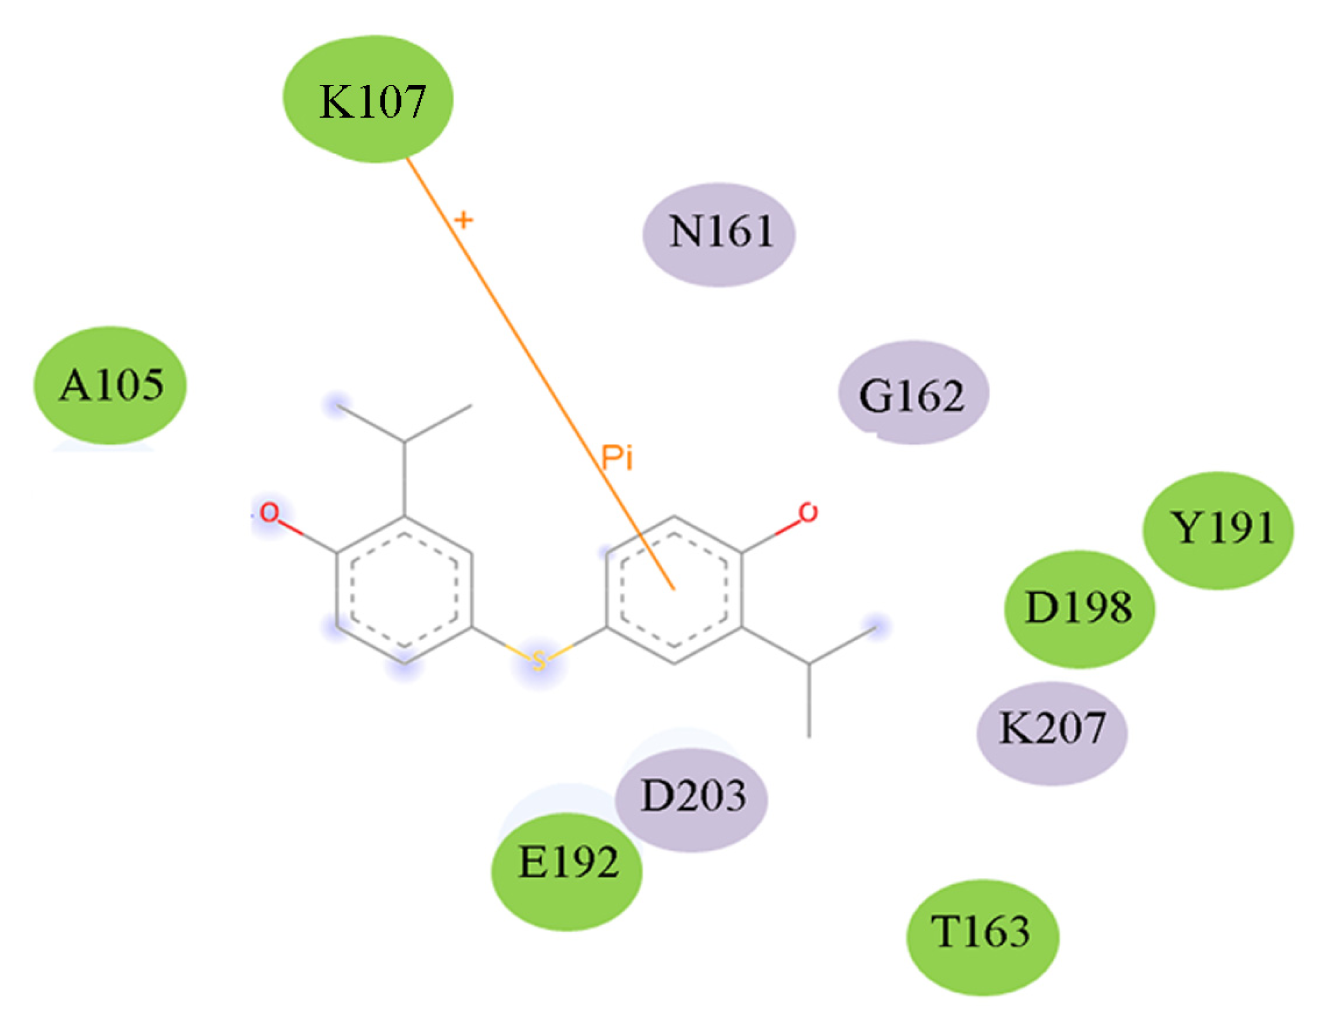
2.4. Docking Study
2.5. High Throughput Virtual Screening Procedure and Docking the Inhibitor to the Protein
3. Experimental Section
3.1. Molecular Modeling
3.2. Assessment of the Homology Model
3.3. Binding Pocket Analyses
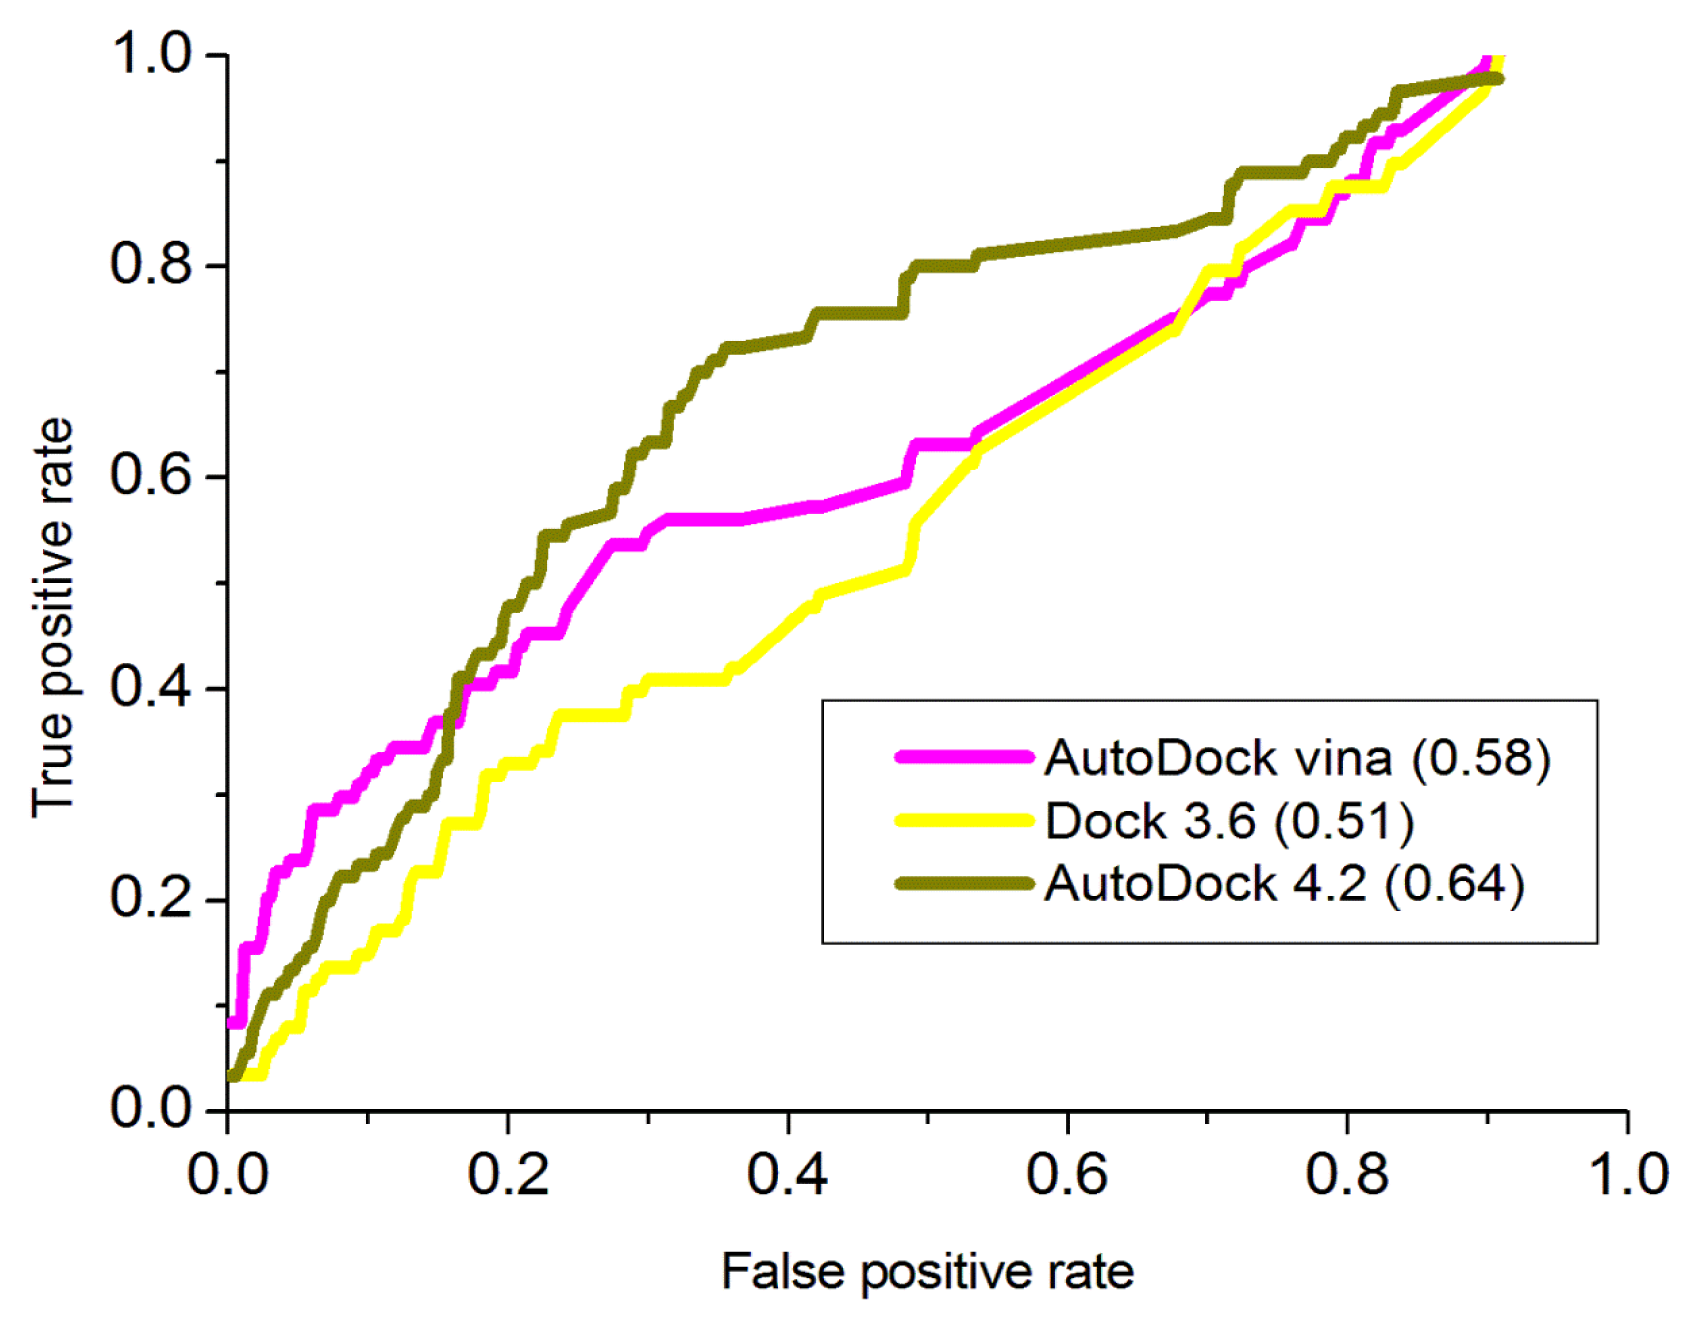
3.4. Validation of the Model by Docking Analysis
3.4.1. AutoDock 4.2
3.4.2. AutoDock Vina
3.4.3. Dock 3.6
4. Conclusions
Acknowledgments
Conflicts of Interest
References
- Sternberg, S. The emerging fungal threat. Science 1994, 266, 1632–1634. [Google Scholar]
- Jacques, S.L.; Nieman, C.; Bareich, D.; Broadhead, G.; Kinach, R.; Honek, J.F.; Wright, G.D. Characterization of yeast homoserine dehydrogenase, an antifungal target: The invariant histidine 309 is important for enzyme integrity. Biochim. Biophys. Acta 2001, 1544, 28–41. [Google Scholar]
- Han, J.Y.; Kwon, Y.S.; Yang, D.C.; Jung, Y.R.; Choi, Y.E. Expression and RNA interference-induced silencing of the dammarenediol synthase gene in Panax ginseng. Plant Cell Physiol 2006, 47, 1653–1662. [Google Scholar]
- Delabarre, B.; Thompson, P.R.; Wright, G.D.; Berghuis, A.M. Crystal structures of homoserine dehydrogenase suggest a novel catalytic mechanism for oxidoreductases. Nat. Struct. Mol. Biol 2000, 7, 238–244. [Google Scholar]
- Munro, H.N.; Aziz, N.; Leibold, E.A.; Murray, M.; Rogers, J.; Vass, J.K.; White, K. The ferritin genes: Structure, expression, and regulation. Ann. N.Y. Acad. Sci 1988, 526, 113–123. [Google Scholar]
- Hall, M.D.; Levitt, D.G.; Banaszak, L.J. Crystal structure of Escherichia coli malate dehydrogenase: A complex of the apoenzyme and citrate at 1.87 Å resolution. J. Mol. Biol 1992, 226, 867–882. [Google Scholar]
- White, J.L.; Hackert, M.L.; Buehner, M.; Adams, M.J.; Ford, G.C.; Lentz, P.J.; Smiley, I.E.; Steindel, S.J.; Rossmann, M.G. A comparison of the structures of apo dogfish M4 lactate dehydrogenase and its ternary complexes. J. Mol. Biol 1976, 102, 759–779. [Google Scholar]
- Skarżński, T.; Moody, P.; Wonacott, A. Structure of holo-glyceraldehyde-3-phosphate dehydrogenase from Bacillus stearothermophilus at 1.8 Å resolution. J. Mol. Biol 1987, 193, 171–187. [Google Scholar]
- Rossmann, M.G.; Argos, P. The taxonomy of binding sites in proteins. Mol. Cell. Biochem 1978, 21, 161–182. [Google Scholar]
- Groot, M. Excited state dynamics and catalytic mechanism of the light-driven enzyme protochlorophyllide oxidoreductase. Phys. Chem. Chem. Phys 2012, 14, 8818–8824. [Google Scholar]
- Burnett, B.P.; Levy, R.M. 5-Lipoxygenase metabolic contributions to NSAID-induced organ toxicity. Adv. Ther 2012, 29, 79–98. [Google Scholar]
- Paik, Y.H.; Brenner, D.A. NADPH oxidase mediated oxidative stress in hepatic fibrogenesis. Korean J. Hepatol 2011, 17, 251–257. [Google Scholar]
- Verkhovsky, M.I.; Bogachev, A.V.; Sodium-translocating, N.A.D.H. Quinone oxidoreductase as a redox-driven ion pump. Biochim. Biophy. Acta 2010, 1797, 738–746. [Google Scholar]
- Jacques, S.L.; Mirza, I.A.; Ejim, L.; Koteva, K.; Hughes, D.W.; Green, K.; Kinach, R.; Honek, J.F.; Lai, H.K.; Berghuis, A.M. Enzyme-assisted suicide: Molecular basis for the antifungal activity of 5-hydroxy-4-oxonorvaline by potent inhibition of homoserine dehydrogenase. Chem. Biol 2003, 10, 989–995. [Google Scholar]
- Ejim, L.; Mirza, I.A.; Capone, C. New phenolic inhibitors of yeast homoserine dehydrogenase. Bioorg. Med. Chem 2004, 12, 3825–3830. [Google Scholar]
- Arnold, K.; Bordoli, L.; Kopp, J.; Schwede, T. The SWISS-MODEL workspace: A web-based environment for protein structure homology modelling. Bioinformatics 2006, 22, 195–201. [Google Scholar]
- Kiefer, F.; Arnold, K.; Künzli, M.; Bordoli, L.; Schwede, T. The SWISS-MODEL Repository and associated resources. Nucleic Acids Res 2009, 37, D387–D392. [Google Scholar]
- Baker, D.; Sali, A. Protein structure prediction and structural genomics. Science 2001, 294, 93–96. [Google Scholar]
- Song, D.W.; Zhu, S.Z.; Li, X.Z.; Zheng, G.Z. Homology modeling and docking studies of BjGL, a novel (+)gamma-lactamase from Bradyrhizobium japonicum. J. Mol. Graph. Model 2014, 47, 1–7. [Google Scholar]
- Adams, P.D.; Afonine, P.V.; Bunkoczi, G.; Chen, V.B.; Davis, I.W.; Echols, N.; Headd, J.J.; Hung, L.W.; Kapral, G.J.; Grosse-Kunstleve, R.W. PHENIX: A comprehensive Python-based system for macromolecular structure solution. Acta Crystallogr. D 2010, 66, 213–221. [Google Scholar]
- Headd, J.J.; Echols, N.; Afonine, P.V.; Grosse-Kunstleve, R.W.; Chen, V.B.; Moriarty, N.W.; Richardson, D.C.; Richardson, J.S.; Adams, P.D. Use of knowledge-based restraints in phenix. refine to improve macromolecular refinement at low resolution. Acta Crystallogr. D 2012, 68, 381–390. [Google Scholar]
- Ian, W.D.; Laura, W.M.; Jane, S.R.; David, C.R. MOLPROBITY: Structure validation and all-atom contact analysis for nucleic acids and their complexes. Nucleic Acids Res 2004, 32, W615–W619. [Google Scholar]
- Colovos, C.; Yeates, T.O. Verification of protein structures: Patterns of nonbonded atomic interactions. Protein Sci 1993, 2, 1511–1519. [Google Scholar]
- Bowie, J.U.; Luthy, R.; Eisenberg, D. A method to identify protein sequences that fold into a known three-dimensional structure. Science 1991, 253, 164–170. [Google Scholar]
- Luthy, R.; Bowie, J.U.; Eisenberg, D. Assessment of protein models with three-dimensional profiles. Nature 1992, 356, 83–85. [Google Scholar]
- Dundas, J.; Ouyang, Z.; Tseng, J.; Binkowski, A.; Turpaz, Y.; Liang, J. CASTp: Computed atlas of surface topography of proteins with structural andtopographical mapping of functionally annotated residues. Nucleic Acids Res 2006, 34, W116–W118. [Google Scholar]
- Norgan, A.P.; Coffman, P.K.; Kocher, J.P. Multilevel Parallelization of AutoDock 4.2. J. Cheminform 2011, 28, 3–12. [Google Scholar]
- Han, W.W.; Wang, Y.; Zhou, Y.H. Understanding structural/functional properties of amidase from rhodococcus erythropolis by computational approaches. J. Mol. Model 2009, 15, 481–487. [Google Scholar]
- Trott, O.; Olson, A.J. AutoDock Vina: Improving the speed and accuracy of docking with a new scoring function, efficient optimization, and multithreading. J. Comput. Chem 2010, 31, 455–461. [Google Scholar]
- Si, Y.X.; Yin, S.J.; Oh, S.; Wang, Z.J.; Ye, S.; Yan, L.; Yang, J.M.; Park, Y.D.; Lee, J.; Qian, G.Y. An integrated study of tyrosinase inhibition by rutin: Progress using a computational simulation. J. Biomol. Struct. Dyn 2012, 29, 999–1012. [Google Scholar]
- Mysinger, M.M.; Carchia, M.; Irwin, J.J.; Shoichet, B.K. Directory of useful decoys, enhanced (DUD-E): Better ligands and decoys for better benchmarking. J. Med. Chem 2012, 55, 6582–6594. [Google Scholar]
- Hu, G.; Kuang, G.; Xiao, W.; Li, W.; Liu, G.; Tang, Y. Performance evaluation of 2D fingerprint and 3D shape similarity methods in virtual screening. J. Chem. Inf. Model 2012, 52, 1103–1113. [Google Scholar]
- Hamza, A.; Wei, N.-N.; Zhan, C.-G. Ligand-based virtual screening approach using a new scoring function. J. Chem. Inf. Model 2012, 52, 963–974. [Google Scholar]
- Triballeau, N.; Acher, F.; Brabet, I.; Pin, J.-P.; Bertrand, H.-O. Virtual screening workflow development guided by the “receiver operating characteristic” curve approach. Application to highthroughput docking on metabotropic glutamate receptor subtype 4. J. Med. Chem 2005, 48, 2534–2547. [Google Scholar]
- Amaki, H.; Yamaguchi, M.; Tsuruo, T.; Yamaguchi, H. Mechanism of action of an antifungal antibiotich, RI-331, (S)2-amino-4-oxo-5-hydroxypentanoic acid; kinetics of inactivation of homoserine dehydrogenase from Saccharomyces cerevisiae. J. Antibiot. (Tokyo) 1992, 25, 750–755. [Google Scholar]
- Bareich, D.C.; Nazi, I.; Wright, G.D. Simultaneous in vitro assay of the first four enzymes in the fungal aspartate pathway identifies a new class of aspartate kinase inhibitor. Chem. Biol 2003, 10, 967–973. [Google Scholar]
- Benod, C.; Carlsson, J.; Uthayaruban, R.; Hwang, P.; Irwin, J.J.; Doak, A.K.; Shoichet, B.K.; Sablin, E.P.; Fletterick, R.J. Structure-based discovery of antagonists of nuclear receptor LRH-. J. Biol. Chem 2013, 288, 19830–19844. [Google Scholar]
- Tsuzuki, S.; Yoshida, M.; Uchimaru, T.; Mikami, M. The origin of the cation/đ interaction: The significant importance of the induction in Li+ and Na+ complexes. J. Phys. Chem. A 2001, 105, 769–773. [Google Scholar]
- Ma, J.C.; Dougherty, D.A. The cationminus signpi interaction. Chem. Rev 1997, 97, 1303–1324. [Google Scholar]
- Gallivan, J.P.; Dougherty, D.A. A computational study of cation-đ interactions vs salt bridges in aqueous media: Implications for protein engineering. J. Am. Chem. Soc 2000, 122, 870–874. [Google Scholar]
- National Center for Biotechnology Information. Available online: http://www.ncbi.nlm.nih.gov (accessed on 30 June 2013).
- Lukat, G.; Krüger, J.; Sommer, B. APL@Voro: A voronoi-based membrane analysis tool for GROMACS trajectories. J. Chem. Inf. Model 2013, 53, 2908–2925. [Google Scholar]
- Jorgensen, W.L.; Chandrasekhar, J.; Madurs, J. Comparison of simple potential functions for simulating liquid water. J. Chem. Phys 1983, 79, 926–935. [Google Scholar]
- Computed Atlas of Surface Topography of Proteins. Available online: http://sts-fw.bioengr.uic.edu/castp (accessed on 30 June 2013).
- Velichkova, P.; Himo, F. Methyl transfer in glycine N-methyltransferase. A theoretical study. J. Phys. Chem. B 2005, 109, 8216–8219. [Google Scholar]
- DISI. Available online: http://wiki.compbio.ucsf.edu/wiki/index.php/naturalproductsdatabase (accessed on 30 June 2013).
- Open Babel: The Open Source Chemistry Toolbox. Available online: http://openbabel.sourceforge.net (accessed on 30 June 2013).
- Raccoon/AutoDock. Available online: http://autodock.scripps.edu/resources/raccoon/ (accessed on 30 June 2013).


| 1EBF | HSD |
|---|---|
| Thr344 | Thr313 |
| Val16 | Val18 |
| Asn92 | |
| Gly17 | |
| Ala39 | Gly45 |
| Ile98 | |
| Ala41 | Gly47 |
| Ile11 | Leu43 |
| Glu40 | Ile46 |
| Gly12 | Gly14 |
| Gly14 | Gly16 |
| Val15 | Asn17 |
| Thr93 | |
| Pro115 | Ala105 |
| Asn116 | Asn106 |
| Arg117 | Arg107 |
| ASA | Docking score (Kcal·mol−1) | RMSD |
|---|---|---|
| Autodock vina | −4.50 | 27.10 |
| Autodock 4.2 | −5.24 | 25.20 |
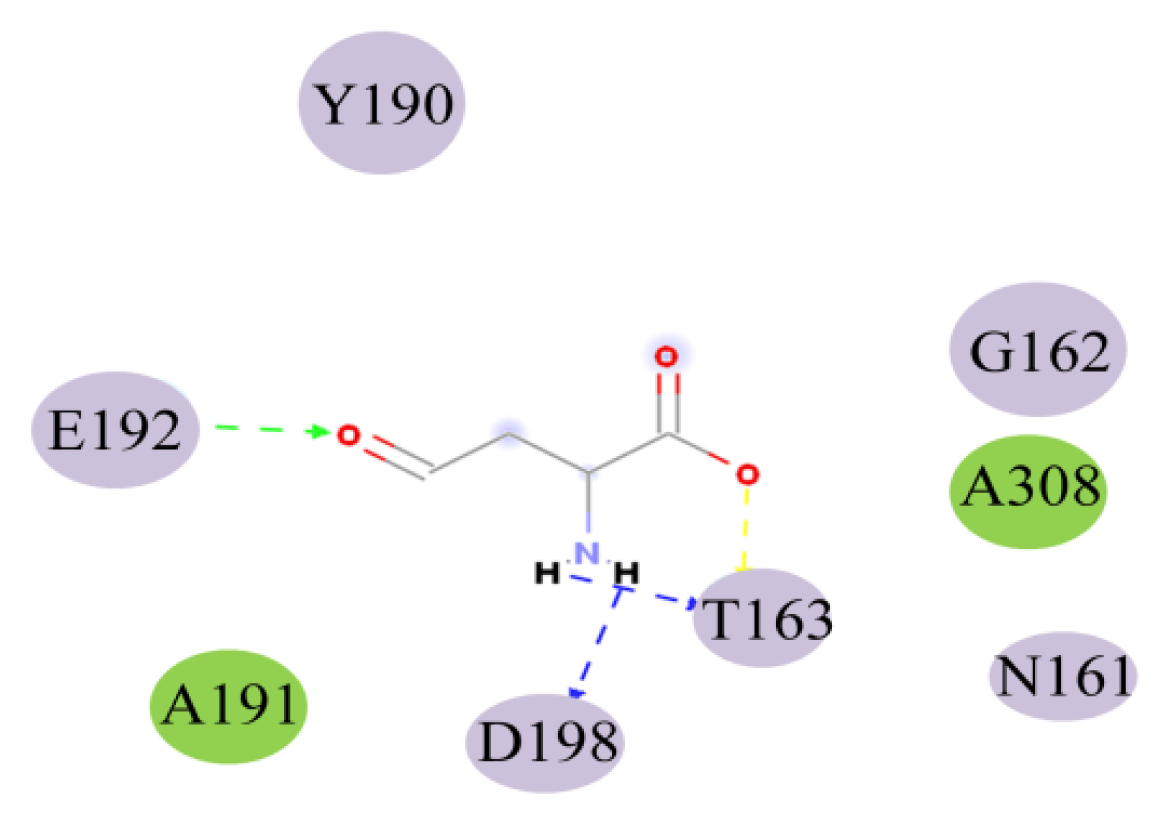
| Name | Distance (Å) | Donor atom | Acceptor atom | Angle |
|---|---|---|---|---|
| THR163:HN-ASA:O5 | 1.97 | HN | O5 | 138.44 |
| ASA:H9-THR163:OG1 | 1.70 | H9 | OG1 | 113.34 |
| ASA:H10-ASP198:OD1 | 1.95 | H10 | OD1 | 116.55 |
| GLU192:HN-ASA:O8 | 2.26 | HN | O8 | 135.69 |
| Structure | Enzyme | Ki (μM) | Autodock 4.2 (Kcal·mol−1) | Estimated inhibition constant, Ki (μM) |
|---|---|---|---|---|
 | HSD (PDB ID 1TVE) [15] | 10 ± 2 | −8.15 | 9.92 |
 | HSD (PDB ID 1Q7G) [14] | 3.3 ± 0.9 | −6.96 | 4.78 |
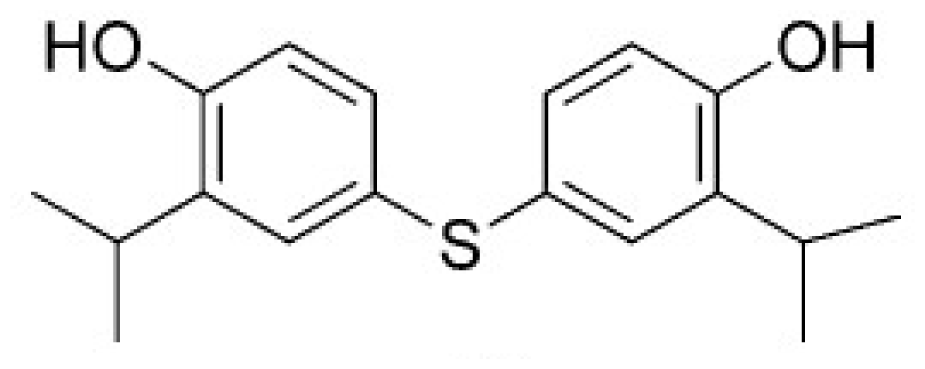
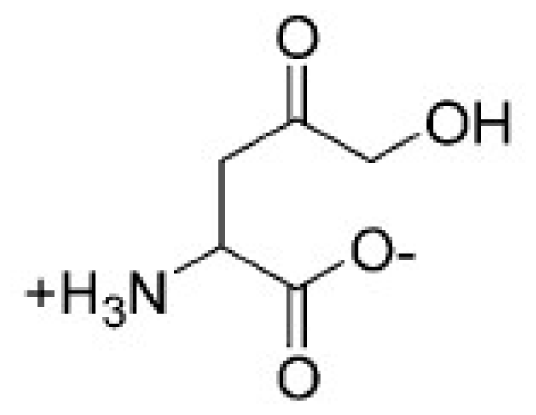
| Compound | Structure | Autodock 4.2 (Kcal·mol−1) | Tca | Ki (μM) |
|---|---|---|---|---|
| ZINC88161319 | 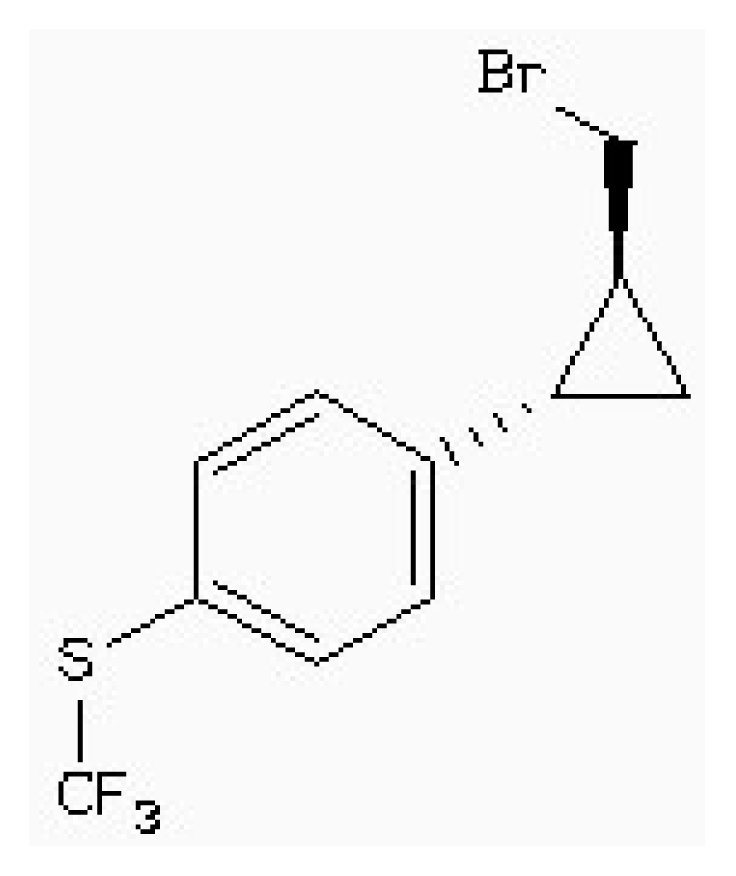 | −7.28 | 0.52 | 9.63 |
| Zinc41229093 |  | −7.09 | 0.55 | 13.07 |
| Zinc54918273 | 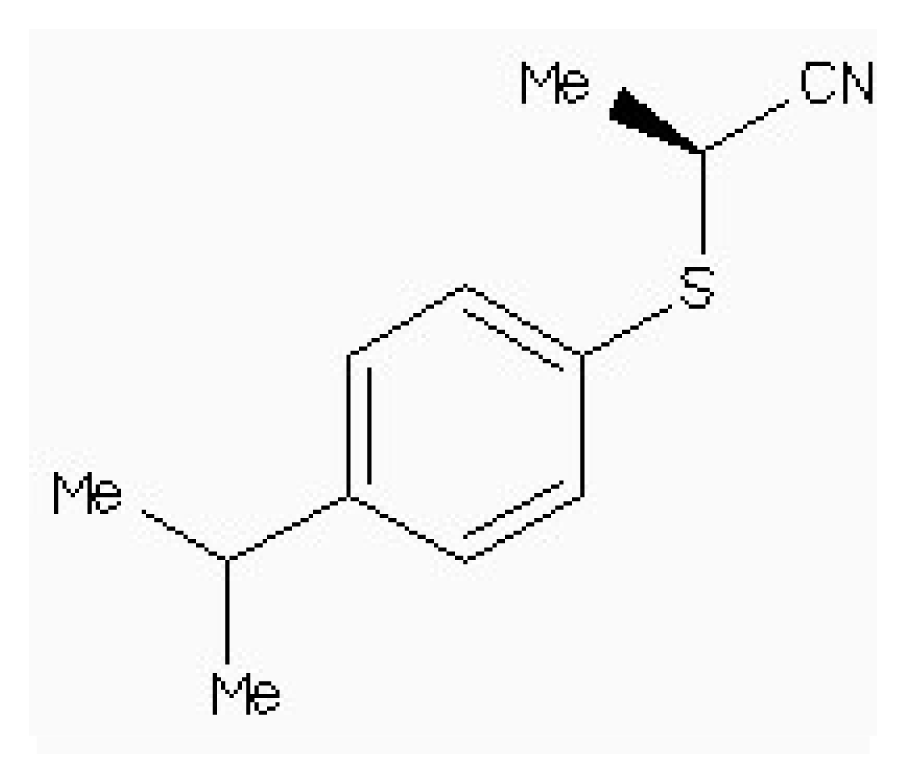 | −6.66 | 0.40 | 13.10 |
| Zinc87096659 | 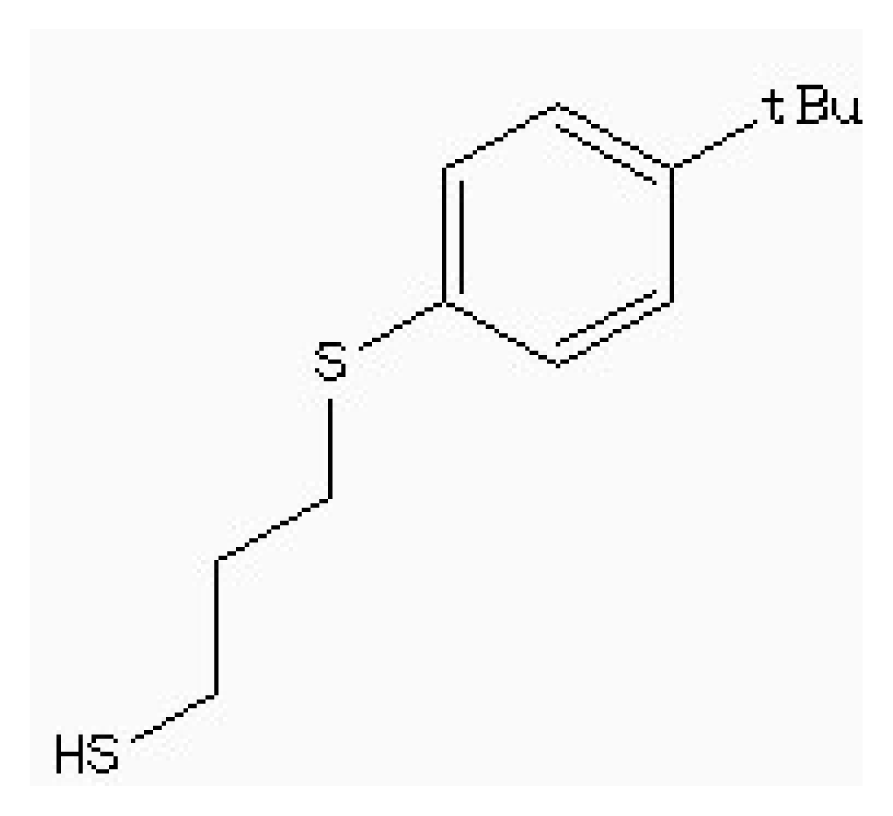 | −6.48 | 0.38 | 15.68 |
© 2014 by the authors; licensee MDPI, Basel, Switzerland This article is an open access article distributed under the terms and conditions of the Creative Commons Attribution license (http://creativecommons.org/licenses/by/3.0/).
Share and Cite
Zhan, D.; Wang, D.; Min, W.; Han, W. Exploring the Molecular Basis for Selective Binding of Homoserine Dehydrogenase from Mycobacterium leprae TN toward Inhibitors: A Virtual Screening Study. Int. J. Mol. Sci. 2014, 15, 1826-1841. https://doi.org/10.3390/ijms15021826
Zhan D, Wang D, Min W, Han W. Exploring the Molecular Basis for Selective Binding of Homoserine Dehydrogenase from Mycobacterium leprae TN toward Inhibitors: A Virtual Screening Study. International Journal of Molecular Sciences. 2014; 15(2):1826-1841. https://doi.org/10.3390/ijms15021826
Chicago/Turabian StyleZhan, Dongling, Dongmei Wang, Weihong Min, and Weiwei Han. 2014. "Exploring the Molecular Basis for Selective Binding of Homoserine Dehydrogenase from Mycobacterium leprae TN toward Inhibitors: A Virtual Screening Study" International Journal of Molecular Sciences 15, no. 2: 1826-1841. https://doi.org/10.3390/ijms15021826