Characterization and Study of Transgenic Cultivars by Capillary and Microchip Electrophoresis

Abstract
:1. Introduction
2. Applications of Capillary Electrophoresis (CE) to the Study and Characterization of Transgenic Cultivars
2.1. DNA Analysis

| Cultivar | Target DNA | DNA Amplification Approach | CE Mode | Detection (LOD) | CE Conditions | Ref. |
|---|---|---|---|---|---|---|
| Maize | DAS59122, LY038, MON88017, MIR604, event 3272 and hmga gene | Multiplex PCR | CGE | LIF (0.1%) | capillary, 50 cm × 50 µm containing POP-7™ as gel; voltage, 15 kV; temperature, 60 °C; injection, 15 s | [21] |
| Maize | DAS59122, LY038, MON88017, MIR604, Event 3272 and hmga gene | Multiplex PCR | CGE | LIF (0.1%) | capillary, 50 cm × 50 µm containing POP-7™ as gel; voltage, 15 kV; temperature, 60 °C; injection, 15 s | [22] |
| Maize | TC1507, MON810, NK603, MON863, BT176, T25, GA21, BT11 and hmga gene | Ligation-mediated probe amplification | CGE | LIF (0.4%–0.5%) | capillary, 50 cm × 50 µm containing POP-7™ as gel; voltage, 15 kV; temperature, 60 °C; injection, 15 s | [23] |
| Maize | MON810, GA21, MON863 and adh gene | Ligation-mediated genome amplification | CGE | LIF (0.1%–0.3%) | capillary, 50cm × 75 µm; BGE, 20 mM Tris, 10 mM phosphoric acid, 2 mM EDTA and 4.5% HC at pH 7.3; voltage, −13 kV; temperature, 45 °C; injection, 0.5 psi × 40 s | [25] |
| Maize | MON863 | Ligation-mediated genome amplification | CGE | LIF (n.i) | capillary, 50cm × 75 µm; BGE, 20 mM Tris, 10 mM phosphoric acid, 2 mM EDTA and 4.5% HC at pH 7.3; voltage, −13 kV; temperature, 45 °C; injection, 0.5 psi × 40 s | [26] |
| Yeast | KmP, KmT and mrp2 | Multiplex PCR | CGE | LIF (n.i.) | capillary, 50 cm ×75 µm; BGE, 20 mM Tris, 10 mM phosphoric acid, 2 mM EDTA, 500 nM YOPRO-1 and 4.5% HEC at pH 7.3;voltage, −13 kV; temperature, 45 °C; injection, 0.5 psi × 40 s | [30] |
| Cotton | MON531, MON15985, MON1445, 3006-210-23 and 281-24-236 and adh1 gene | Multiplex PCR | CGE | LIF (0.1%) | capillary, 47 cm × 50 µm containing POP-4™ as gel; voltage, 15 kV; temperature, 60 °C; injection, 5 s × 15 kV | [29] |
| Cotton | p35S, tNos, Sad1 and Cry1Ac | Multiplex PCR | CGE | LIF (0.01%–0.05%) | capillary, 36 cm × 50 µm containing POP-4™ as gel; voltage, 15 kV; temperature, 60 °C; injection, n.i. | [28] |
| Soybean | p35S, tNos, and Lec | Singleplex PCR | CGE | LIF (0.1%) | capillary, 36 cm × 50 µm containing POP-4™ as gel; voltage, 15 kV; temperature, 60 °C; injection, n.i. | [28] |
| Soybean | tNos, p35S | Multiplex PCR | CZE | UV (n.i.) | capillary, 40 cm × 75 µm; BGE, 2 mM EDTA, 20 mM phosphoric acid adjusted at pH 7.3 with Tris; voltage, −8 kV; temperature, 25 °C; injection, 10 kV × 10 s | [32] |
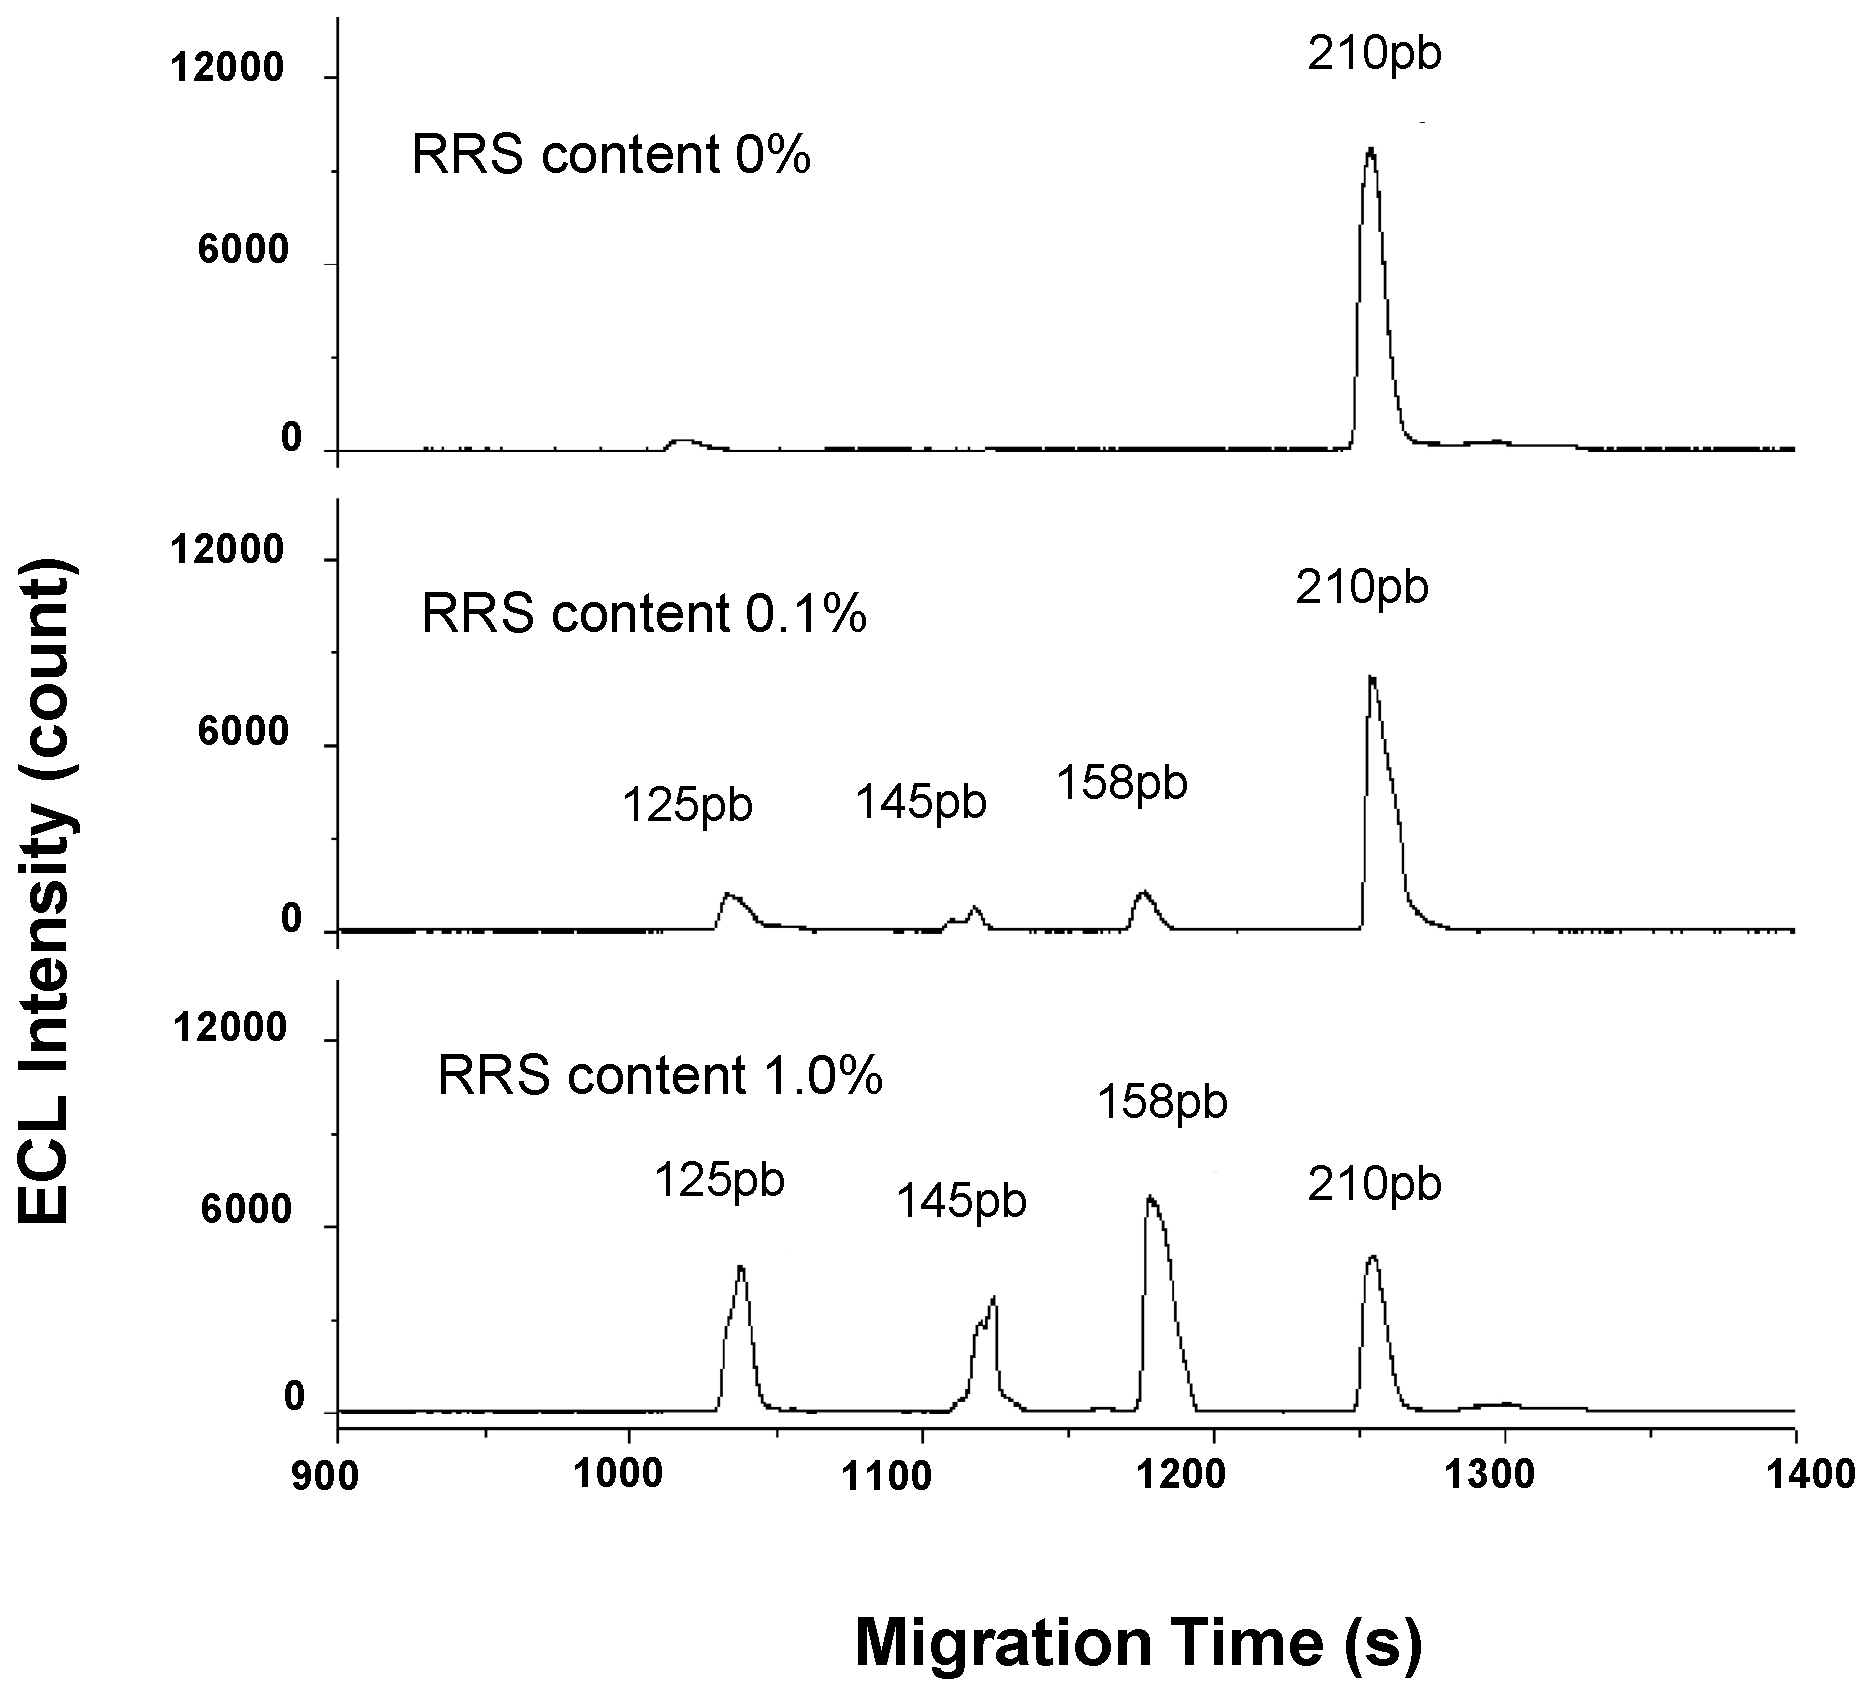
| Soybean | ttNos, p35S, cp4-epsps, lectin | Multiplex PCR | CGE | ECL (0.01%) | capillary, 45 cm × 75 µm; BGE, 20 mM Tris–HCl, 2 mM EDTA, 1.5 M urea and 2.5% (w:w) PVP at pH 8.0; voltage, −13.5 kV; temperature, n.i; injection, −13.5 kV × 12 s | [33] |
| Soybean | 400 pb target DNA | Singleplex PCR | CGE | C4D (n.i.) | capillary, 45 cm × 75 µm; BGE, 20 mM Tris–HCl, 2 mM EDTA, 1.5 M urea and 2.5% (w:w) PVP at pH 8.0; voltage, −13.5 kV; temperature, n.i; injection, −13.5 kV × 12 s | [34] |
| Maize and soybean | Maize, Bt176 (N09K9, MAX40), Bt11 (N44P4, 27M3), G4030, 09A4, 26L6, N4424, T25, MON88017, MON863xNK603 and MON863xNK603xMON810; soybean, GTS 40-30-2 | DNA insert fingerprint | CGE | LIF (1%) | Four-capillary array, 36 cm × 75 µM; voltage, 15 kV; temperature 60 °C; injection, 3 kV × 5 s | [35] |
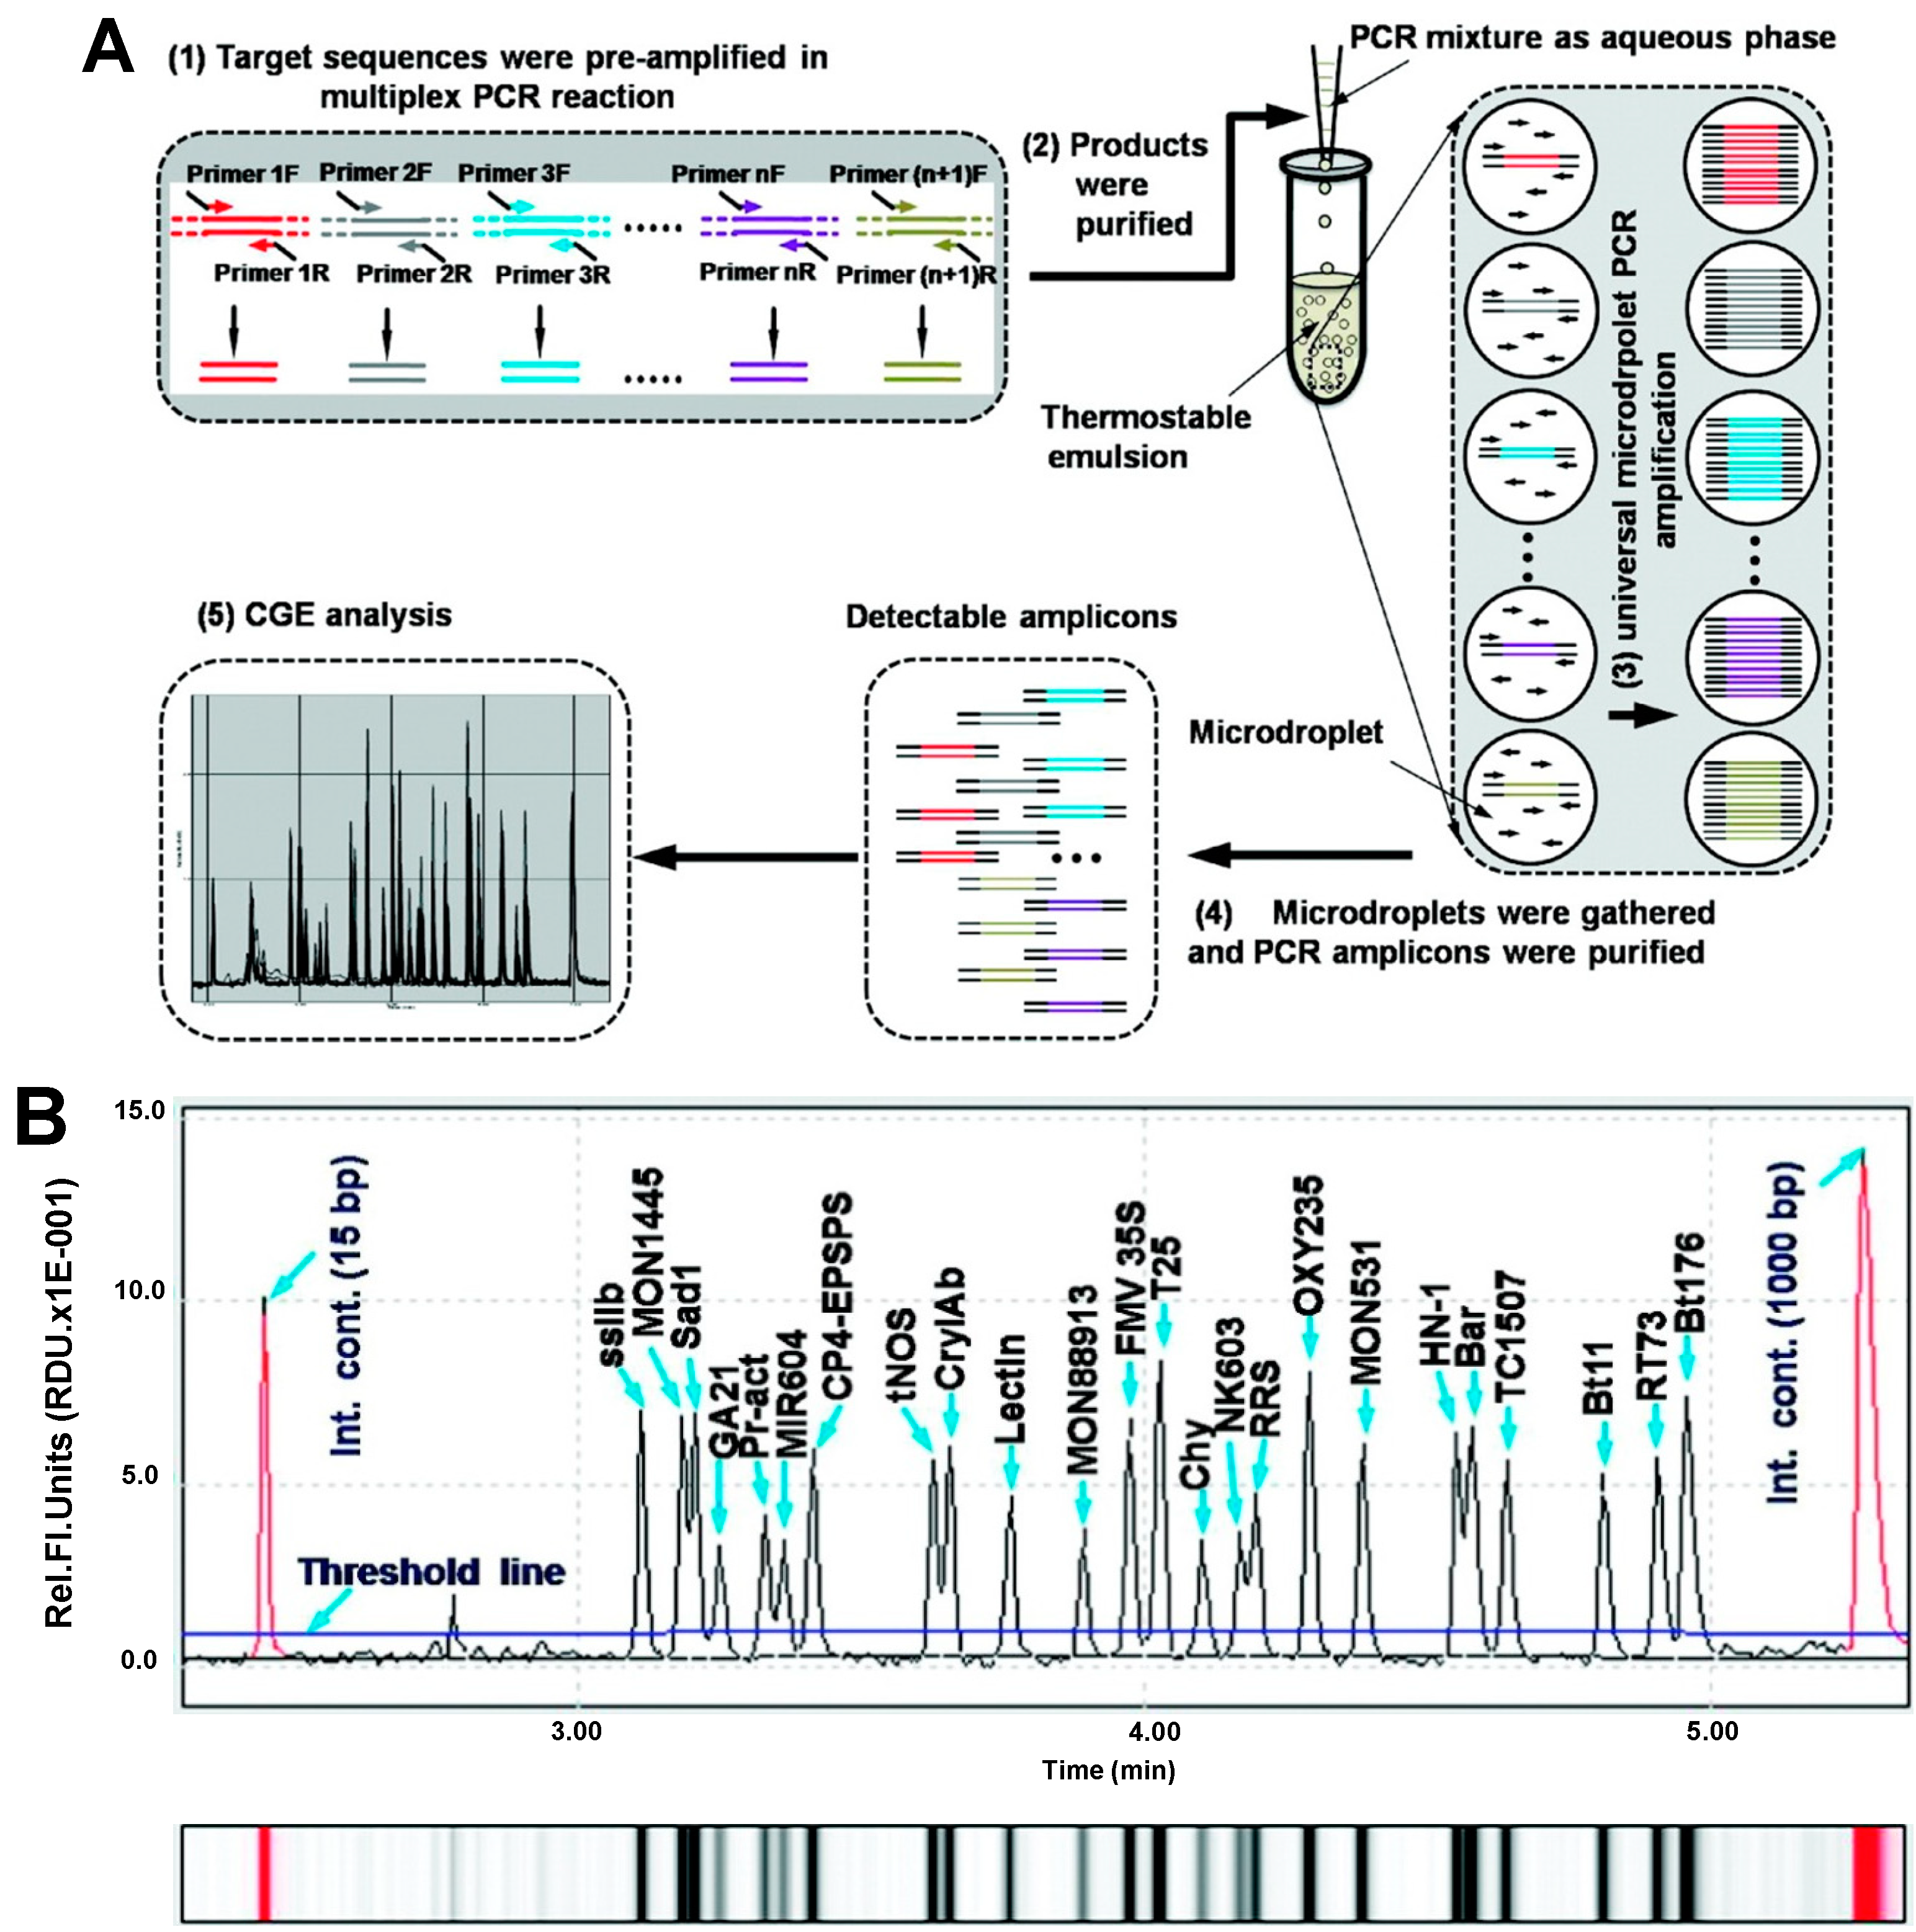
| Soybean, maize, canola and cotton | Bt176, Bt11, TC1507, NK603, T25, MIR604, GA21, MON531, MON1445, MON88913, RT73, OXY235, RRS, HN-1, ssIIb, Lectin, Sad1, Chy, tNos, FMV35S, CP4-EPSPS, CryIAb, Bar, Pr-act | Multiplex microdroplet PCR | CGE | Fluorescence (0.1%) | capillary, n.i; BGE, QIAxcel DNA high resolution kit buffer; voltage, 6 kV; temperature, r.t.; injection, 0.5 psi × 20 s | [36] |
2.2. Protein Analysis
| Cultivar | GMO | Analyte | CE Mode | Detection | CE Conditions | Sample Treatment | Ref. |
|---|---|---|---|---|---|---|---|
| Maize | Bt resistant (Bt11) | Zein fraction | CZE | UV | BGE: 100 mM phosphate buffer pH 3 containing 60% v:v ethanol; polyacrylamide coated capillary, 40 cm × 50 µm; voltage, 20 kV; temperature, 25 °C; injection, 0.5 psi × 10 s | Extraction with 70% v:v ethanol with 2% v:v β-mercaptoethanol | [38] |
| Maize | Bt resistant (Bt11) | Albumin and globulin fraction | CZE | UV | BGE: 100 mM phosphate buffer pH 3 containing 60% v:v ethanol; capillary, 40 cm × 50 µm; voltage, 20 kV; temperature, 25 °C; injection, 0.5 psi × 10 s | Albumin fraction: extraction with water and ultrafiltration (3 KDa cut off). Globulin fraction: extraction with 50 mM Tris buffer (pH 7.8) containing 50 mM KCl and 5 mM EDTA and ultrafiltration (3 KDa cut off) | [38] |
| Maize | Bt resistant (Bt11) | Protein water/ACN (75/25, v/v) fractions | EKC | UV | BGE: 80 mM phosphate buffer pH 2.5 containing 5% ACN and 0.01% DAB dendrimer; capillary, 40 cm × 50 µm; voltage, 10 kV; temperature, 25 °C; injection, 3.4 KPa × 5 s | Extraction with water/ACN (75:25, v:v) +s0.3% acetic acid | [39] |
| Maize | Bt resistant | Water soluble protein fraction | CZE | UV | BGE: 100 mM H3PO4, 50 mM Tris pH 2.25 or 200 mM iminodiacetic acid pH 2.26: capillary, 20 cm × 50 µm; voltage, 10 kV; temperature, r.t.; injection, 1.2 KPa × 22 s | Extraction with water | [40] |
| Maize | Bt resistant | Trypsin digested water soluble protein fraction | CZE | UV | BGE: 200 mM iminodiacetic acid pH 2.26; capillary, 20 cm × 50 µm; voltage, 10 kV; temperature, r.t.; injection, 12 mbar × 12 s | Extraction with water and trypsin digestion | [41] |
| Soybean | Glyphosate resistant (SB10) | Trypsin digested water/ACN (80/20, v/v) protein fractions | CZE | ESI-MS (+) | BGE: 0.5 M formic acid; capillary, 90 cm × 50 µm; voltage, 25 kV; temperature, 25 °C; injection, 0.5 psi × 20 s | Extraction with water/ACN (80:20, v:v) and trypsin digestion | [42] |

2.3. Metabolite Analysis
| Cultivar/Strain | GMO | Analyte | CE Mode | Detection | CE Conditions | Sample Treatment | Ref. |
|---|---|---|---|---|---|---|---|
| Maize | Bt resistant (PR33P66Bt, tietar Bt, and Aristis Bt) | Cationic metabolites | CZE | ESI-MS (+) | BGE: 0.5% formic acid pH 1.9; capillary, 80 cm × 50 µm; voltage, 20 kV; temperature, r.t.; injection, 0.5 psi × 15 s | Extraction with MeOH:water (50:50, v:v) | [43] |
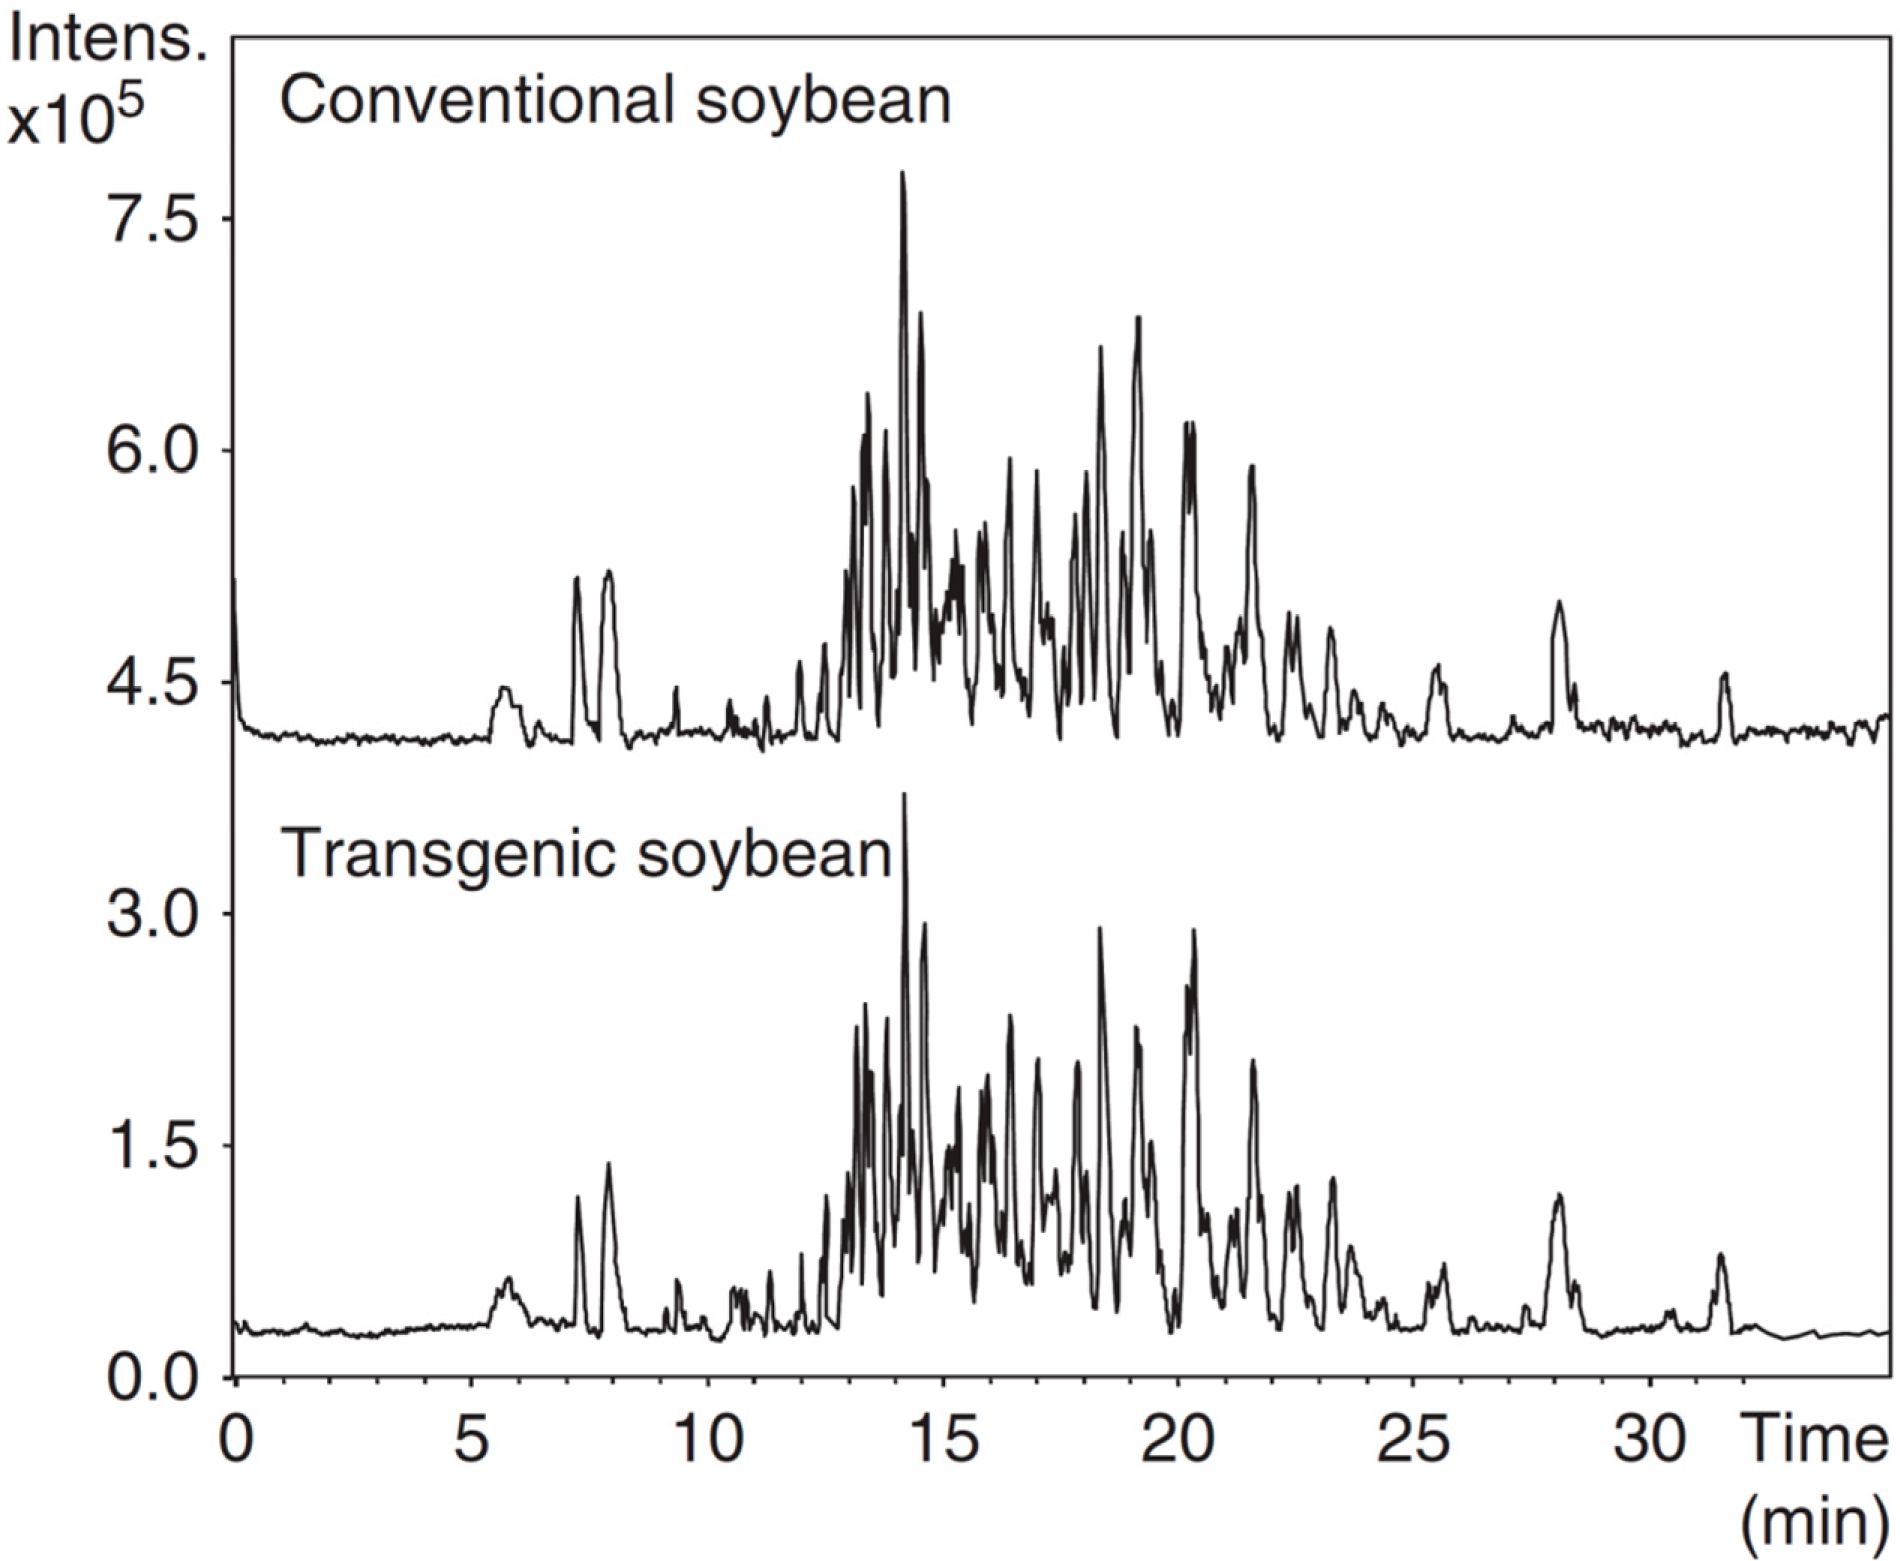
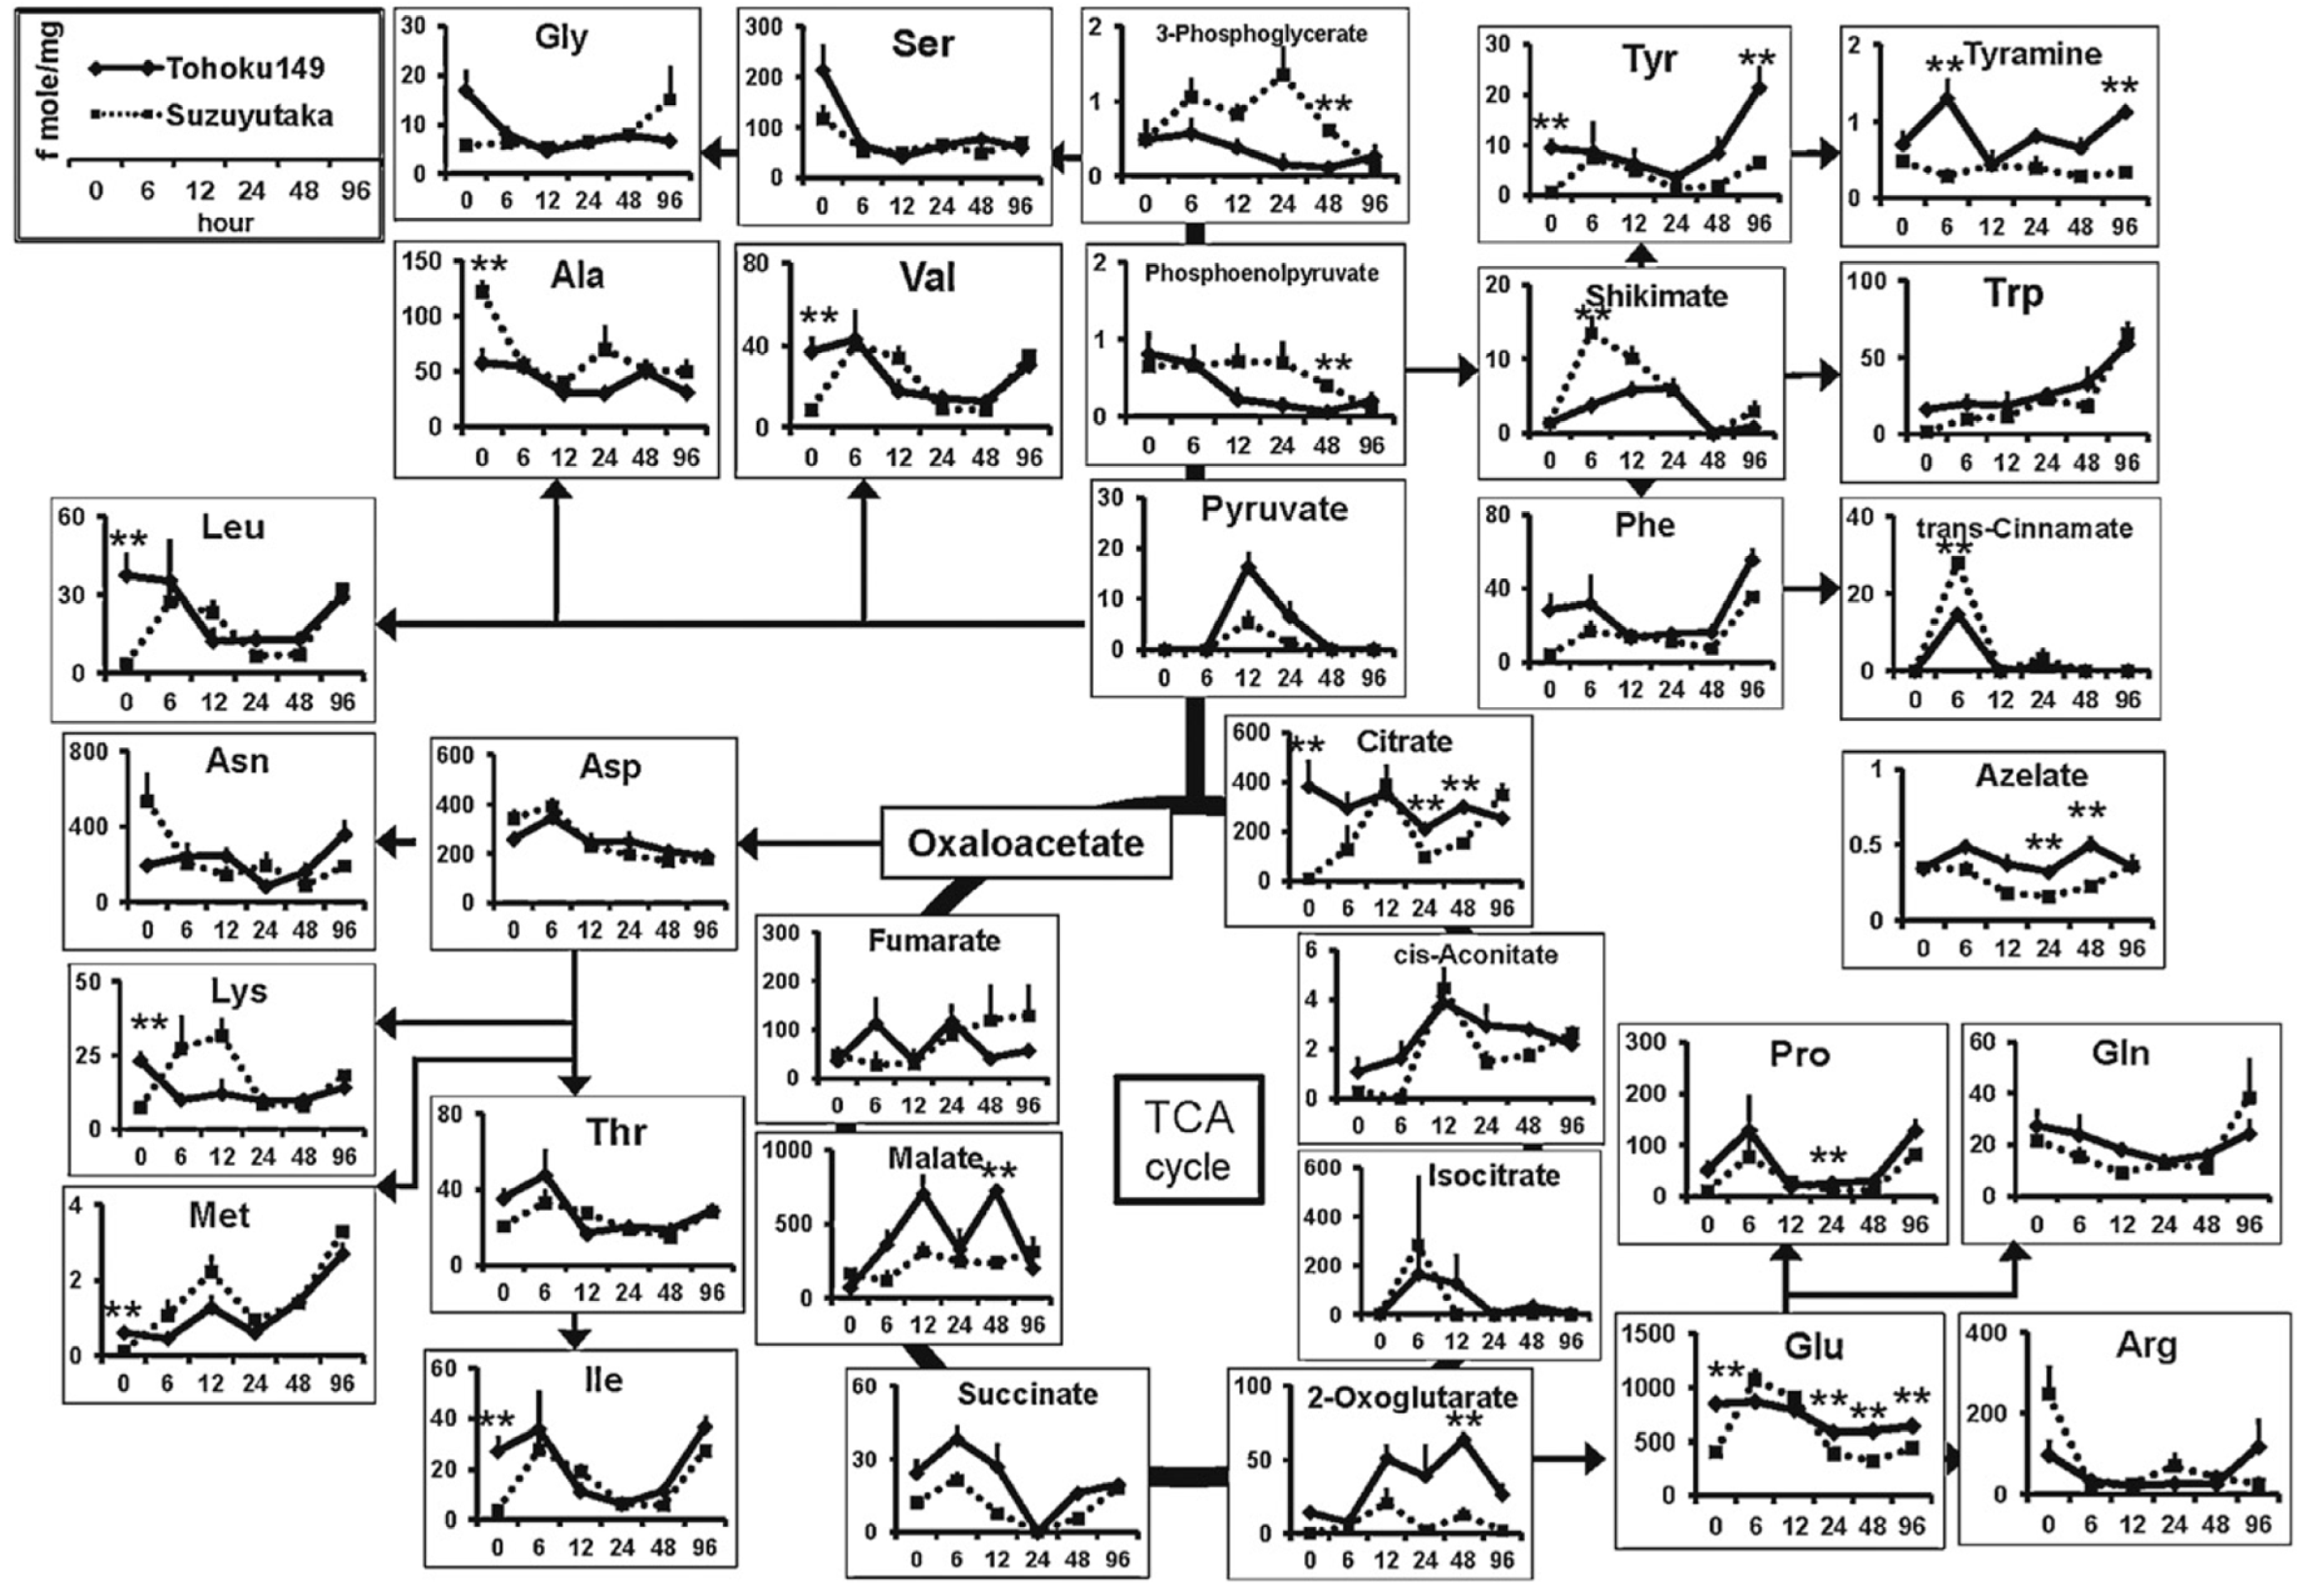
| Soybean | Aphid resistant (Tohoku149 and Suzuyuka) | Cationic metabolites | CZE | ESI-MS (+) | BGE: 1 M formic acid; capillary, 100 cm × 50 µm; voltage, 30 kV; temperature, 20 °C; injection, 5 kPa × 3 s | Extraction with MeOH followed by dilution in water, protein precipitation with chloroform and ultrafiltration (3 KDa cut off) | [44] |
| Soybean | Aphid resistant (Tohoku149, Suzuyuka) | Anionic metabolites | CZE | ESI-MS (−) | BGE: 50 mM ammonium acetate solution (pH 8.5); COSMO(+) coated capillary, 110 cm × 50 µm; voltage, −30 kV; temperature, 20 °C; injection, 50.8 kPa × 30 s | Extraction with MeOH followed by dilution in water, protein precipitation with chloroform and ultrafiltration (3 KDa cut off) | [44] |
| Rice | Transformants over-expresing Arabidopsis bax inhibitor-1 | Cationic metabolites | CZE | ESI-MS (+) | BGE: 1 M formic acid pH 1.9; uncoated capillary, 70 cm × 50 µm; voltage, 20 kV; temperature, 20 °C; injection, n.i. | Extraction with MeOH, chloroform and water (aprox 42:42:16, v:v:v) followed by MeOH evaporation and ultrafiltration (3 KDa) | [6] |
| Rice | Transformants over-expresing Arabidopsis bax inhibitor-1 | Anionic metabolites | CZE | ESI-MS (−) | BGE: 50 mM ammonium acetate pH 9.0; FunCap-CE type S capillary, 80 cm × 50 µm; voltage, −30 kV; temperature, 20 °C; injection, 2 psi × 5 s | Extraction with MeOH, chloroform and water (aprox 42:42:16, v:v:v) followed by MeOH evaporation and ultrafiltration (3 KDa) | [6] |
| Rice | Transformants over-expresing Arabidopsis bax inhibitor-1 | Nucleotides | CZE | ESI-MS (−) | BGE: 50 mM ammonium acetate pH 7.5; uncoated capillary, 100 cm × 50 µm; voltage, 30 kV + 50 mbar; temperature, 20 °C; injection, 50 mbar × 30 s | Extraction with MeOH, chloroform and water (aprox 42:42:16, v:v:v) followed by MeOH evaporation and ultrafiltration (3 KDa) | [6] |
| Rice | Transformants over-expresing Arabidopsis NADKinase gene | Cationic metabolites | CZE | ESI-MS (+) | BGE: 1 M formic acid (pH 1.9); uncoated capillary, 100 cm × 50 µm; voltage, 30 kV; temperature, 20 °C; injection, 50 mbar × 3 s | Extraction with MeOH:water (50:50, v:v) followed by ultrafiltration (5 KDa) | [7] |
| Rice | Transformants over-expresing Arabidopsis NADKinase gene | Anionic metabolites | CZE | ESI-MS (−) | BGE: 50 mM ammonium acetate pH 9.0; uncoated capillary, 80 cm × 50 µm; voltage, 30 kV (+0.10 bar after 30 min); temperature, 20 °C; injection, 2 psi × 5 s | Extraction with MeOH:water (50:50, v:v) followed by ultrafiltration (5 KDa) | [7] |
| Rice | Transformants over-expresing Arabidopsis NADKinase gene | Nucleotides | CZE | ESI-MS (−) | BGE: 50 mM ammonium acetate pH 7.5; uncoated capillary, 100 cm × 50 µm; voltage, 30 kV + 50 mbar; temperature, 20 °C; injection, 50 mbar × 30 s | Extraction with MeOH:water (50:50, v:v) followed by ultrafiltration (5 KDa) | [7] |
| Rice | Transformants with OsRBCS2 cDNA | Cationic metabolies | CZE | ESI-MS (+) | BGE: 1 M formic acid; uncoated capillary, 100 cm × 50 µm; voltage, 30 kV; temperature, 20 °C; injection, 50 mbar × 3 s | Extraction with MeOH, chloroform and water (aprox 42:42:16, v:v:v) followed by ultrafiltration (5 KDa) | [45] |
| Rice | Transformants with OsRBCS2 cDNA | Anionic metabolites | CZE | ESI-MS (−) | BGE: 50 mM ammonium acetate solution, pH 9.0; SMILE(+) coated capillary, 100 cm × 50 µm; voltage, −30 kV; temperature, 20 °C; injection, 50 mbar × 30 s | Extraction with MeOH, chloroform and water (aprox 42:42:16, v:v:v) followed by ultrafiltration (5 KDa) | [45] |
| Soybean | Glyphosate resistant | Chiral amino acids | EKC | ESI-MS (+) | BGE: 50 mM ammonium hydrogen carbonate pH 8.0 containing CD3NH2; capillary, 85 cm × 50 µm; voltage, 30 kV; temperature, 25 °C; injection, 0.5 psi × 25 s | Extraction with 0.37 M trichloroacetic acid and 3.6 mM sodium deoxycholate followed by derivatization with FITC | [46] |
| Yeast | Autolytic strains (LS11) | Chiral amino acids | EKC | LIF | BGE: 50 mM ammonium hydrogen carbonate pH 8.0 containing CD3NH2; uncoated capillary, 85 cm × 50 µm; voltage, 30 kV; temperature, 25 °C; injection, 0.5 psi × 25 s | Extraction with 2 M trichloroacetic acid and 3.6 mM sodium deoxycholate followed by derivatization with FITC | [48] |
3. Applications of Chip-Based Electrophoresis to the Study and Characterization of Transgenic Cultivars
4. Conclusions
Acknowledgments
Author Contributions
Conflicts of Interest
References
- Holst-Jensen, A. Testing for genetically modified organisms (GMOs): Past, present and future perspectives. Biotechnol. Adv. 2009, 27, 1071–1082. [Google Scholar] [CrossRef] [PubMed]
- SmartStax™. Available online: http://msdssearch.dow.com/PublishedLiteratureDOWCOM/dh_03e3/0901b803803e393d.pdf?filepath=productsafety/pdfs/noreg/233–00616.pdf&fromPage=GetDoc (accessed on 15 October 2014).
- Kuiper, H.A.; Kleter, G.A.; Noteborn, H.; Kok, E.J. Assessment of the food safety issues related to genetically modified foods. Plant J. 2001, 27, 503–528. [Google Scholar] [CrossRef] [PubMed]
- Kuiper, H.A.; Kok, E.J.; Engel, K.H. Exploitation of molecular profiling techniques for GM food safety assessment. Curr. Opin. Biotechnol. 2003, 14, 238–243. [Google Scholar] [CrossRef] [PubMed]
- Valdes, A.; Simo, C.; Ibanez, C.; Garcia-Canas, V. Foodomics strategies for the analysis of transgenic foods. Trac-Trends Anal. Chem. 2013, 52, 2–15. [Google Scholar] [CrossRef]
- Ishikawa, T.; Takahara, K.; Hirabayashi, T.; Matsumura, H.; Fujisawa, S.; Terauchi, R.; Uchimiya, H.; Kawai-Yamada, M. Metabolome analysis of response to oxidative stress in rice suspension cells overexpressing cell death suppressor bax inhibitor-1. Plant Cell Physiol. 2010, 51, 9–20. [Google Scholar] [CrossRef] [PubMed]
- Takahara, K.; Kasajima, I.; Takahashi, H.; Hashida, S.-N.; Itami, T.; Onodera, H.; Toki, S.; Yanagisawa, S.; Kawai-Yamada, M.; Uchimiya, H. Metabolome and photochemical analysis of rice plants overexpressing arabidopsis nad kinase gene. Plant Physiol. 2010, 152, 1863–1873. [Google Scholar] [CrossRef] [PubMed]
- Regulation (EC) 1829/2003. Available online: http://ec.europa.eu/food/food/animalnutrition/labelling/Reg_1829_2003_en.pdf (accessed on 15 October 2014).
- Regulation (EC) 1830/2003. Available online: http://eur-lex.europa.eu/LexUriServ/LexUriServ.do?uri=OJ:L:2003:268:0024:0028:EN:PDF (accessed on 15 October 2014).
- Michelini, E.; Simoni, P.; Cevenini, L.; Mezzanotte, L.; Roda, A. New trends in bioanalytical tools for the detection of genetically modified organisms: An update. Anal. Bioanal. Chem. 2008, 392, 355–367. [Google Scholar] [CrossRef] [PubMed]
- Marmiroli, N.; Maestri, E.; Gulli, M.; Malcevschi, A.; Peano, C.; Bordoni, R.; de Bellis, G. Methods for detection of GMOs in food and feed. Anal. Bioanal. Chem. 2008, 392, 369–384. [Google Scholar] [CrossRef] [PubMed]
- Elenis, D.S.; Kalogianni, D.P.; Glynou, K.; Ioannou, P.C.; Christopoulos, T.K. Advances in molecular techniques for the detection and quantification of genetically modified organisms. Anal. Bioanal. Chem. 2008, 392, 347–354. [Google Scholar] [CrossRef] [PubMed]
- Morisset, D.; Stebih, D.; Cankar, K.; Zel, J.; Gruden, K. Alternative DNA amplification methods to PCR and their application in GMO detection: A review. Eur. Food Res. Technol. 2008, 227, 1287–1297. [Google Scholar] [CrossRef]
- Chaouachi, M.; Chupeau, G.; Berapd, A.; McKhann, H.; Romaniuk, M.; Giancola, S.; Laval, V.; Bertheau, Y.; Brunel, D. A high-throughput multiplex method adapted for gmo detection. J. Agric. Food Chem. 2008, 56, 11596–11606. [Google Scholar] [CrossRef] [PubMed]
- Ahmed, F.E. Detection of genetically modified organisms in foods. Trends Biotechnol. 2002, 20, 215–223. [Google Scholar] [CrossRef] [PubMed]
- Garcia-Cañas, V.; Simó, C.; Leon, C.; Ibañez, E.; Cifuentes, A. MS-based analytical methodologies to characterize genetically modified crops. Mass Spectrom. Rev. 2011, 30, 396–416. [Google Scholar] [CrossRef] [PubMed] [Green Version]
- Kok, M.G.M.; Ruijken, M.M.A.; Swann, J.R.; Wilson, I.D.; Somsen, G.W.; de Jong, G.J. Anionic metabolic profiling of urine from antibiotic-treated rats by capillary electrophoresis-mass spectrometry. Anal. Bioanal. Chem. 2013, 405, 2585–2594. [Google Scholar] [CrossRef] [PubMed]
- Trojanowicz, M.; Latoszek, A.; Pobozy, E. Analysis of genetically modified food using high-performance separation methods. Anal. Lett. 2010, 43, 1653–1679. [Google Scholar] [CrossRef]
- Guo, L.; Qiu, B.; Xiao, X.; Chen, G. Applications of capillary electrophoresis and microchip capillary electrophoresis for detection of genetically modified organisms. Food Sci. Biotechnol. 2009, 18, 823–832. [Google Scholar]
- García-Cañas, V.; Cifuentes, A.; González, R. Detection of genetically modified organisms in foods by DNA amplification techniques. Crit. Rev. Food Sci. Nutr. 2004, 44, 425–436. [Google Scholar] [CrossRef] [PubMed]
- Holck, A.; Pedersen, B.O.; Heir, E. Detection of five novel gmo maize events by qualitative, multiplex PCR and fluorescence capillary gel electrophoresis. Eur. Food Res. Technol. 2010, 231, 475–483. [Google Scholar] [CrossRef]
- Holck, A.L.; Pedersen, B.O. Simple, sensitive, accurate multiplex quantitative competitive PCR with capillary electrophoresis detection for the determination of genetically modified maize. Eur. Food Res. Technol. 2011, 233, 951–961. [Google Scholar] [CrossRef]
- Holck, A.L.; Dromtorp, S.M.; Heir, E. Quantitative, multiplex ligation-dependent probe amplification for the determination of eight genetically modified maize events. Eur. Food Res. Technol. 2009, 230, 185–194. [Google Scholar] [CrossRef]
- Schouten, J.P.; McElgunn, C.J.; Waaijer, R.; Zwijnenburg, D.; Diepvens, F.; Pals, G. Relative quantification of 40 nucleic acid sequences by multiplex ligation-dependent probe amplification. Nucleic Acids Res. 2002, 30, e57. [Google Scholar] [CrossRef] [PubMed]
- Garcia-Cañas, V.; Mondello, M.; Cifuentes, A. Simultaneous detection of genetically modified organisms by multiplex ligation-dependent genome amplification and capillary gel electrophoresis with laser-induced fluorescence. Electrophoresis 2010, 31, 2249–2259. [Google Scholar] [CrossRef] [PubMed] [Green Version]
- Garcia-Cañas, V.; Mondello, M.; Cifuentes, A. Combining ligation reaction and capillary gel electrophoresis to obtain reliable long DNA probes. J. Sep. Sci. 2011, 34, 1011–1019. [Google Scholar] [CrossRef] [PubMed] [Green Version]
- Hecker, K.H.; Rill, R.L. Error analysis of chemically synthesized polynucleotides. BioTechniques 1998, 24, 256–260. [Google Scholar] [PubMed]
- Basak, S.; Ehtesham, N.Z.; Sesikeran, B.; Ghosh, S. Detection and identification of transgenic elements by fluorescent-PCR-based capillary gel electrophoresis in genetically modified cotton and soybean. J. AOAC Int. 2014, 97, 159–165. [Google Scholar] [CrossRef] [PubMed]
- Nadal, A.; Esteve, T.; Pla, M. Multiplex polymerase chain reaction-capillary gel electrophoresis: A promising tool for gmo screening-assay for simultaneous detection of five genetically modified cotton events and species. J. AOAC Int. 2009, 92, 765–772. [Google Scholar] [PubMed]
- Leon, C.; Garcia-Cañas, V.; González, R.; Morales, P.; Cifuentes, A. Fast and sensitive detection of genetically modified yeasts in wine. J. Chromatogr. 2011, 1218, 7550–7556. [Google Scholar] [CrossRef] [Green Version]
- González-Ramos, D.; Cebollero, E.; González, R. A recombinant saccharomyces cerevisiae strain over-producing mannoproteins stabilizes wine against protein haze. Appl. Environ. Microbiol. 2008, 74, 5533–5540. [Google Scholar] [CrossRef] [PubMed] [Green Version]
- Jiang, C.; Xu, S.; Zhang, S.; Jia, L. Chitosan functionalized magnetic particle-assisted detection of genetically modified soybeans based on polymerase chain reaction and capillary electrophoresis. Anal. Biochem. 2012, 420, 20–25. [Google Scholar] [CrossRef] [PubMed]
- Guo, L.; Yang, H.; Qiu, B.; Xiao, X.; Xue, L.; Kim, D.; Chen, G. Capillary electrophoresis with electrochemiluminescent detection for highly sensitive assay of genetically modified organisms. Anal. Chem. 2009, 81, 9578–9584. [Google Scholar] [CrossRef] [PubMed]
- Stojkovic, M.; Uda, N.R.; Brodmann, P.; Popovic, M.; Hauser, P.C. Determination of pcr products by CE with contactless conductivity detection. J. Sep. Sci. 2012, 35, 3509–3513. [Google Scholar] [CrossRef] [PubMed]
- Raymond, P.; Gendron, L.; Khalf, M.; Paul, S.; Dibley, K.L.; Bhat, S.; Xie, V.R.D.; Partis, L.; Moreau, M.-E.; Dollard, C.; et al. Detection and identification of multiple genetically modified events using DNA insert fingerprinting. Anal. Bioanal. Chem. 2010, 396, 2091–2102. [Google Scholar] [CrossRef] [PubMed]
- Guo, J.; Yang, L.; Chen, L.; Morisset, D.; Li, X.; Pan, L.; Zhang, D. Mpic: A high-throughput analytical method for multiple DNA targets. Anal. Chem. 2011, 83, 1579–1586. [Google Scholar] [CrossRef] [PubMed]
- Haselberg, R.; de Jong, G.J.; Somsen, G.W. Capillary electrophoresis-mass spectrometry for the analysis of intact proteins. J. Chromatogr. 2007, 1159, 81–109. [Google Scholar] [CrossRef]
- Pobozy, E.; Sentkowska, A.; Piskor, A. Comparison of three modifications of fused-silica capillaries and untreated capillaries for protein profiling of maize extracts by capillary electrophoresis. J. Sep. Sci. 2014, 37, 2388–2394. [Google Scholar] [CrossRef] [PubMed]
- Latoszek, A.; Garcia-Ruiz, C.; Marina, M.L.; de la Mata, F.J.; Gómez, R.; Rasines, B.; Cifuentes, A.; Pobozy, E.; Trojanowicz, M. Modification of resolution in capillary electrophoresis for protein profiling in identification of genetic modification in foods. Croat. Chem. Acta 2011, 84, 375–382. [Google Scholar] [CrossRef] [Green Version]
- Sazelova, P.; Kasicka, V.; Ibañez, E.; Cifuentes, A. Extraction and separation of water-soluble proteins from bacillus thuringiensis-transgenic and non-transgenic maize species by CZE. J. Sep. Sci. 2009, 32, 3801–3808. [Google Scholar] [CrossRef] [PubMed]
- Sazelova, P.; Kasicka, V.; Leon, C.; Ibañez, E.; Cifuentes, A. Capillary electrophoretic profiling of tryptic digests of water soluble proteins from bacillus thuringiensis-transgenic and non-transgenic maize species. Food Chem. 2012, 134, 1607–1615. [Google Scholar] [CrossRef] [PubMed]
- Simó, C.; Dominguez-Vega, E.; Luisa Marina, M.; Concepcion Garcia, M.; Dinelli, G.; Cifuentes, A. CE-TOF MS analysis of complex protein hydrolyzates from genetically modified soybeans—A tool for foodomics. Electrophoresis 2010, 31, 1175–1183. [Google Scholar] [CrossRef] [PubMed] [Green Version]
- Leon, C.; Rodriguez-Meizoso, I.; Lucio, M.; Garcia-Cañas, V.; Ibañez, E.; Schmitt-Kopplin, P.; Cifuentes, A. Metabolomics of transgenic maize combining fourier transform-ion cyclotron resonance-mass spectrometry, capillary electrophoresis-mass spectrometry and pressurized liquid extraction. J. Chromatogr. 2009, 1216, 7314–7323. [Google Scholar] [CrossRef]
- Sato, D.; Akashi, H.; Sugimoto, M.; Tomita, M.; Soga, T. Metabolomic profiling of the response of susceptible and resistant soybean strains to foxglove aphid, aulacorthum solani kaltenbach. J. Chromatogr. 2013, 925, 95–103. [Google Scholar]
- Suzuki, Y.; Fujimori, T.; Kanno, K.; Sasaki, A.; Ohashi, Y.; Makino, A. Metabolome analysis of photosynthesis and the related primary metabolites in the leaves of transgenic rice plants with increased or decreased rubisco content. Plant Cell Environ. 2012, 35, 1369–1379. [Google Scholar] [CrossRef] [PubMed]
- Giuffrida, A.; Leon, C.; Garcia-Canas, V.; Cucinotta, V.; Cifuentes, A. Modified cyclodextrins for fast and sensitive chiral-capillary electrophoresis-mass spectrometry. Electrophoresis 2009, 30, 1734–1742. [Google Scholar] [CrossRef] [PubMed]
- Blaschke, G.; Chankvetadze, B. Enantiomer separation of drugs by capillary electromigration techniques. J. Chromatogr. 2000, 875, 3–25. [Google Scholar] [CrossRef]
- Giuffrida, A.; Tabera, L.; González, R.; Cucinotta, V.; Cifuentes, A. Chiral analysis of amino acids from conventional and transgenic yeasts. J. Chromatogr. 2008, 875, 243–247. [Google Scholar]
- Breadmore, M.C. Capillary and microchip electrophoresis: Challenging the common conceptions. J. Chromatogr. 2012, 1221, 42–55. [Google Scholar] [CrossRef]
- Nagl, S.; Schulze, P.; Ludwig, M.; Belder, D. Progress in microchip enantioseparations. Electrophoresis 2009, 30, 2765–2772. [Google Scholar] [CrossRef] [PubMed]
- Dolnik, V.; Liu, S.R.; Jovanovich, S. Capillary electrophoresis on microchip. Electrophoresis 2000, 21, 41–54. [Google Scholar] [CrossRef] [PubMed]
- Dolnik, V.; Liu, S.R. Applications of capillary electrophoresis on microchip. J. Sep. Sci. 2005, 28, 1994–2009. [Google Scholar] [CrossRef] [PubMed]
- Burrell, A.; Foy, C.; Burns, M. Applicability of three alternative instruments for food authenticity analysis: GMO identification. Biotechnol. Res. Int. 2011, 2011, 838232. [Google Scholar] [CrossRef] [PubMed]
- Refinement of GMO screening methods by combining existing multiplex PCR approaches with lab-on-a-chip capillary electrophoresis endpoint detection. Available online: http://www.foodbase.org.uk//admintools/reportdocuments/300–1-525_G03022_FSA_GMO_Project_Final_Report.pdf (accessed on 15 October 2014).
- Kluga, L.; Folloni, S.; Kagkli, D.M.; Bogni, A.; Foti, N.; Savini, C.; Mazzara, M.; van den Eede, G.; van den Bulcke, M. Combinatory SYBR® green real-time PCR screening approach for tracing materials derived from genetically modified rice. Food Anal. Methods 2013, 6, 361–369. [Google Scholar] [CrossRef]
- Pobozy, E.; Filaber, M.; Koc, A.; Garcia-Reyes, J.F. Application of capillary electrophoretic chips in protein profiling of plant extracts for identification of genetic modifications of maize. Electrophoresis 2013, 34, 2740–2753. [Google Scholar] [CrossRef] [PubMed]
- Nan, H.; Lee, S.-W.; Kang, S.H. Fast screening of rice knockout mutants by multi-channel microchip electrophoresis. Talanta 2012, 97, 249–255. [Google Scholar] [CrossRef] [PubMed]
© 2014 by the authors; licensee MDPI, Basel, Switzerland. This article is an open access article distributed under the terms and conditions of the Creative Commons Attribution license (http://creativecommons.org/licenses/by/4.0/).
Share and Cite
Vega, E.D.; Marina, M.L. Characterization and Study of Transgenic Cultivars by Capillary and Microchip Electrophoresis. Int. J. Mol. Sci. 2014, 15, 23851-23877. https://doi.org/10.3390/ijms151223851
Vega ED, Marina ML. Characterization and Study of Transgenic Cultivars by Capillary and Microchip Electrophoresis. International Journal of Molecular Sciences. 2014; 15(12):23851-23877. https://doi.org/10.3390/ijms151223851
Chicago/Turabian StyleVega, Elena Domínguez, and Maria Luisa Marina. 2014. "Characterization and Study of Transgenic Cultivars by Capillary and Microchip Electrophoresis" International Journal of Molecular Sciences 15, no. 12: 23851-23877. https://doi.org/10.3390/ijms151223851