Article

Proteomic Analysis of Rice Nonhost Resistance to Puccinia striiformis f. sp. tritici Using Two-Dimensional Electrophoresis

State Key Laboratory of Crop Stress Biology for Arid Areas and College of Plant Protection, Northwest A&F University, No. 3 Taicheng Road, Yangling 712100, China
*
Author to whom correspondence should be addressed.
These authors contributed equally to this work.
Int. J. Mol. Sci. 2014, 15(12), 21644-21659; https://doi.org/10.3390/ijms151221644
Submission received: 17 September 2014 / Revised: 9 November 2014 / Accepted: 10 November 2014 / Published: 25 November 2014
(This article belongs to the Section Biochemistry)

Abstract

:
Rice (Oryza sativa L.) is the only widely cultivated gramineous crops that cannot be infected by rust fungi. To decipher the molecular basis of rice nonhost resistance (NHR) to Puccinia striiformis f. sp. tritici (Pst), the causal agent of wheat stripe rust, proteomic analysis was performed using the two-dimensional electrophoresis (2-DE) technique. The expressed proteins from rice leaves 24 and 48 h post inoculation with Pst and from mock-inoculated leaves were identified. Quantitative analysis revealed a total of 27 differentially expressed proteins in response to Pst inoculation. Most of these proteins fall into the category “response to stimulus” and are involved in basic resistance processes, such as glycerol-3-phosphate and hydrogen peroxide signaling. A homologue of wheat leaf rust resistance protein Lr10 was also identified, implicating multiple layers of plant defense are implicated in rice NHR to Pst. These results demonstrate an intrinsic relationship between host and nonhost resistance. Changes in abundance of these proteins, together with their putative functions reveal a comprehensive profile of rice NHR to Pst and provide new insights into plant immunity.

1. Introduction

Wheat stripe rust, caused by Puccina striiformis f. sp. tritici (Pst), is one of the most devastating fungal diseases of wheat, and leads to significant yield losses worldwide [1]. Due to the frequent virulence variation of the pathogen, several resistance genes have been defeated by new races [2]. Nonhost resistance (NHR) provides immunity to all members of a plant species against all isolates of a pathogen species that normally infects other plant species [3,4]. As the most common form of plant resistance, NHR is remarkable for its broad-spectrum effectiveness and durability, and has therefore attracted much attention owing to its potential for improving crop resistance [3,5,6].
In recent years, the interactions between non host plants and rust fungi have been studied at histocytological and genetic levels [7,8,9,10]. In most cases, plant responses to non-adapted rust fungi were similar to the basic defense responses to the adapted rust fungi. For example, interaction between Arabidopsis and non-adapted Puccinia triticina (Ptr, wheat leaf rust fungus) induces production of nitric oxide (NO), salicylic acid (SA), camalexin and transient stomatal closure [9]. Genetic studies revealed that multiple quantitative trait loci (QTL) and occasionally resistance genes (R) conferred NHR in barley to heterologous rust species. Moreover, most of these genes were effective against only one non-adapted rust species [11,12]. These findings reveal that multiple genetic and molecular components contribute to NHR, indicating that a multitude of underlying mechanisms determine the outcome of diverse nonhost interactions.
As a model plant for monocotyledonous crops, rice (Oryza sativa L.) is a nonhost species to all known rust fungi. Histocytological studies demonstrated that multiple defense responses, including callose deposition, production of reactive oxygen species and cell death, contributed to rice NHR against several rust species. Rice mutants lacking some defense-related or basic defense genes, did not exhibit increased susceptibility to rust fungi [13]. These results suggested that the mechanisms underlying rice NHR were different from basic resistance despite the similar responses.
Proteomic approaches have been extensively applied in plant pathology research [14]. However, only a few studies have examined changes in the plant proteome in response to non-adapted pathogens, especially to rust pathogens. To understand the molecular basis of rice NHR to rust fungi, we identified a set of NHR-related proteins in rice plants that were inoculated with Pst using two-dimensional electrophoresis (2-DE). Results are discussed according to the functional implications of the proteins identified, with special emphasis on their possible roles in defense response. This study extends our knowledge on NHR and allows us to further understand plant immune systems.

2. Results

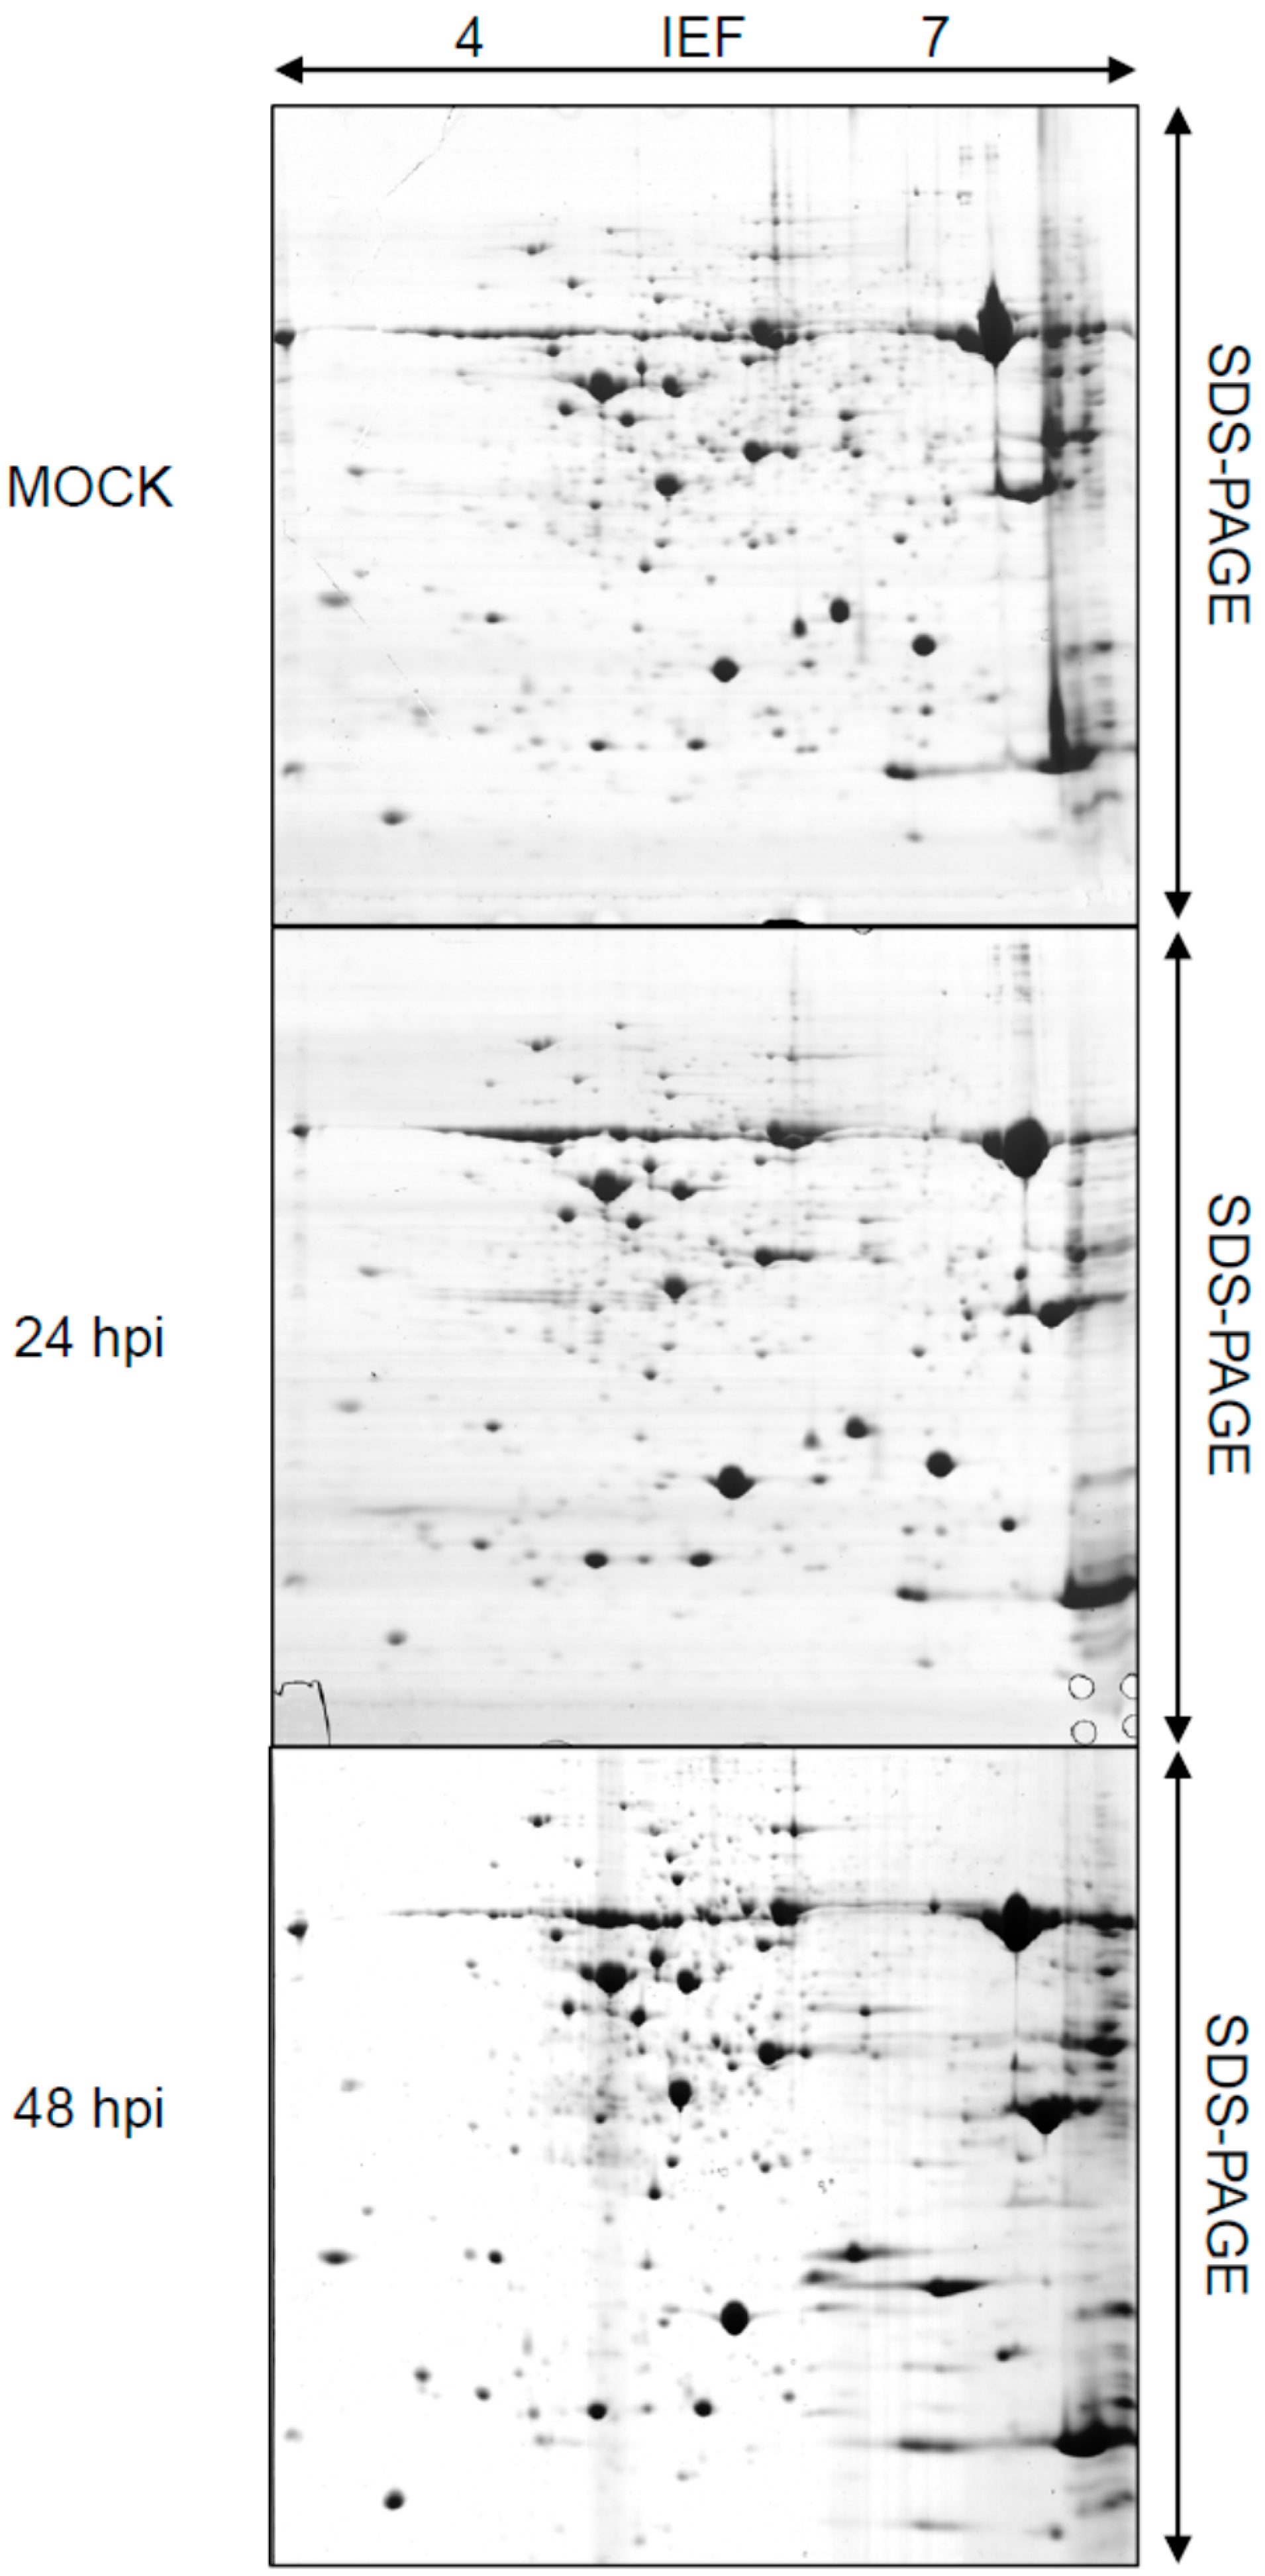
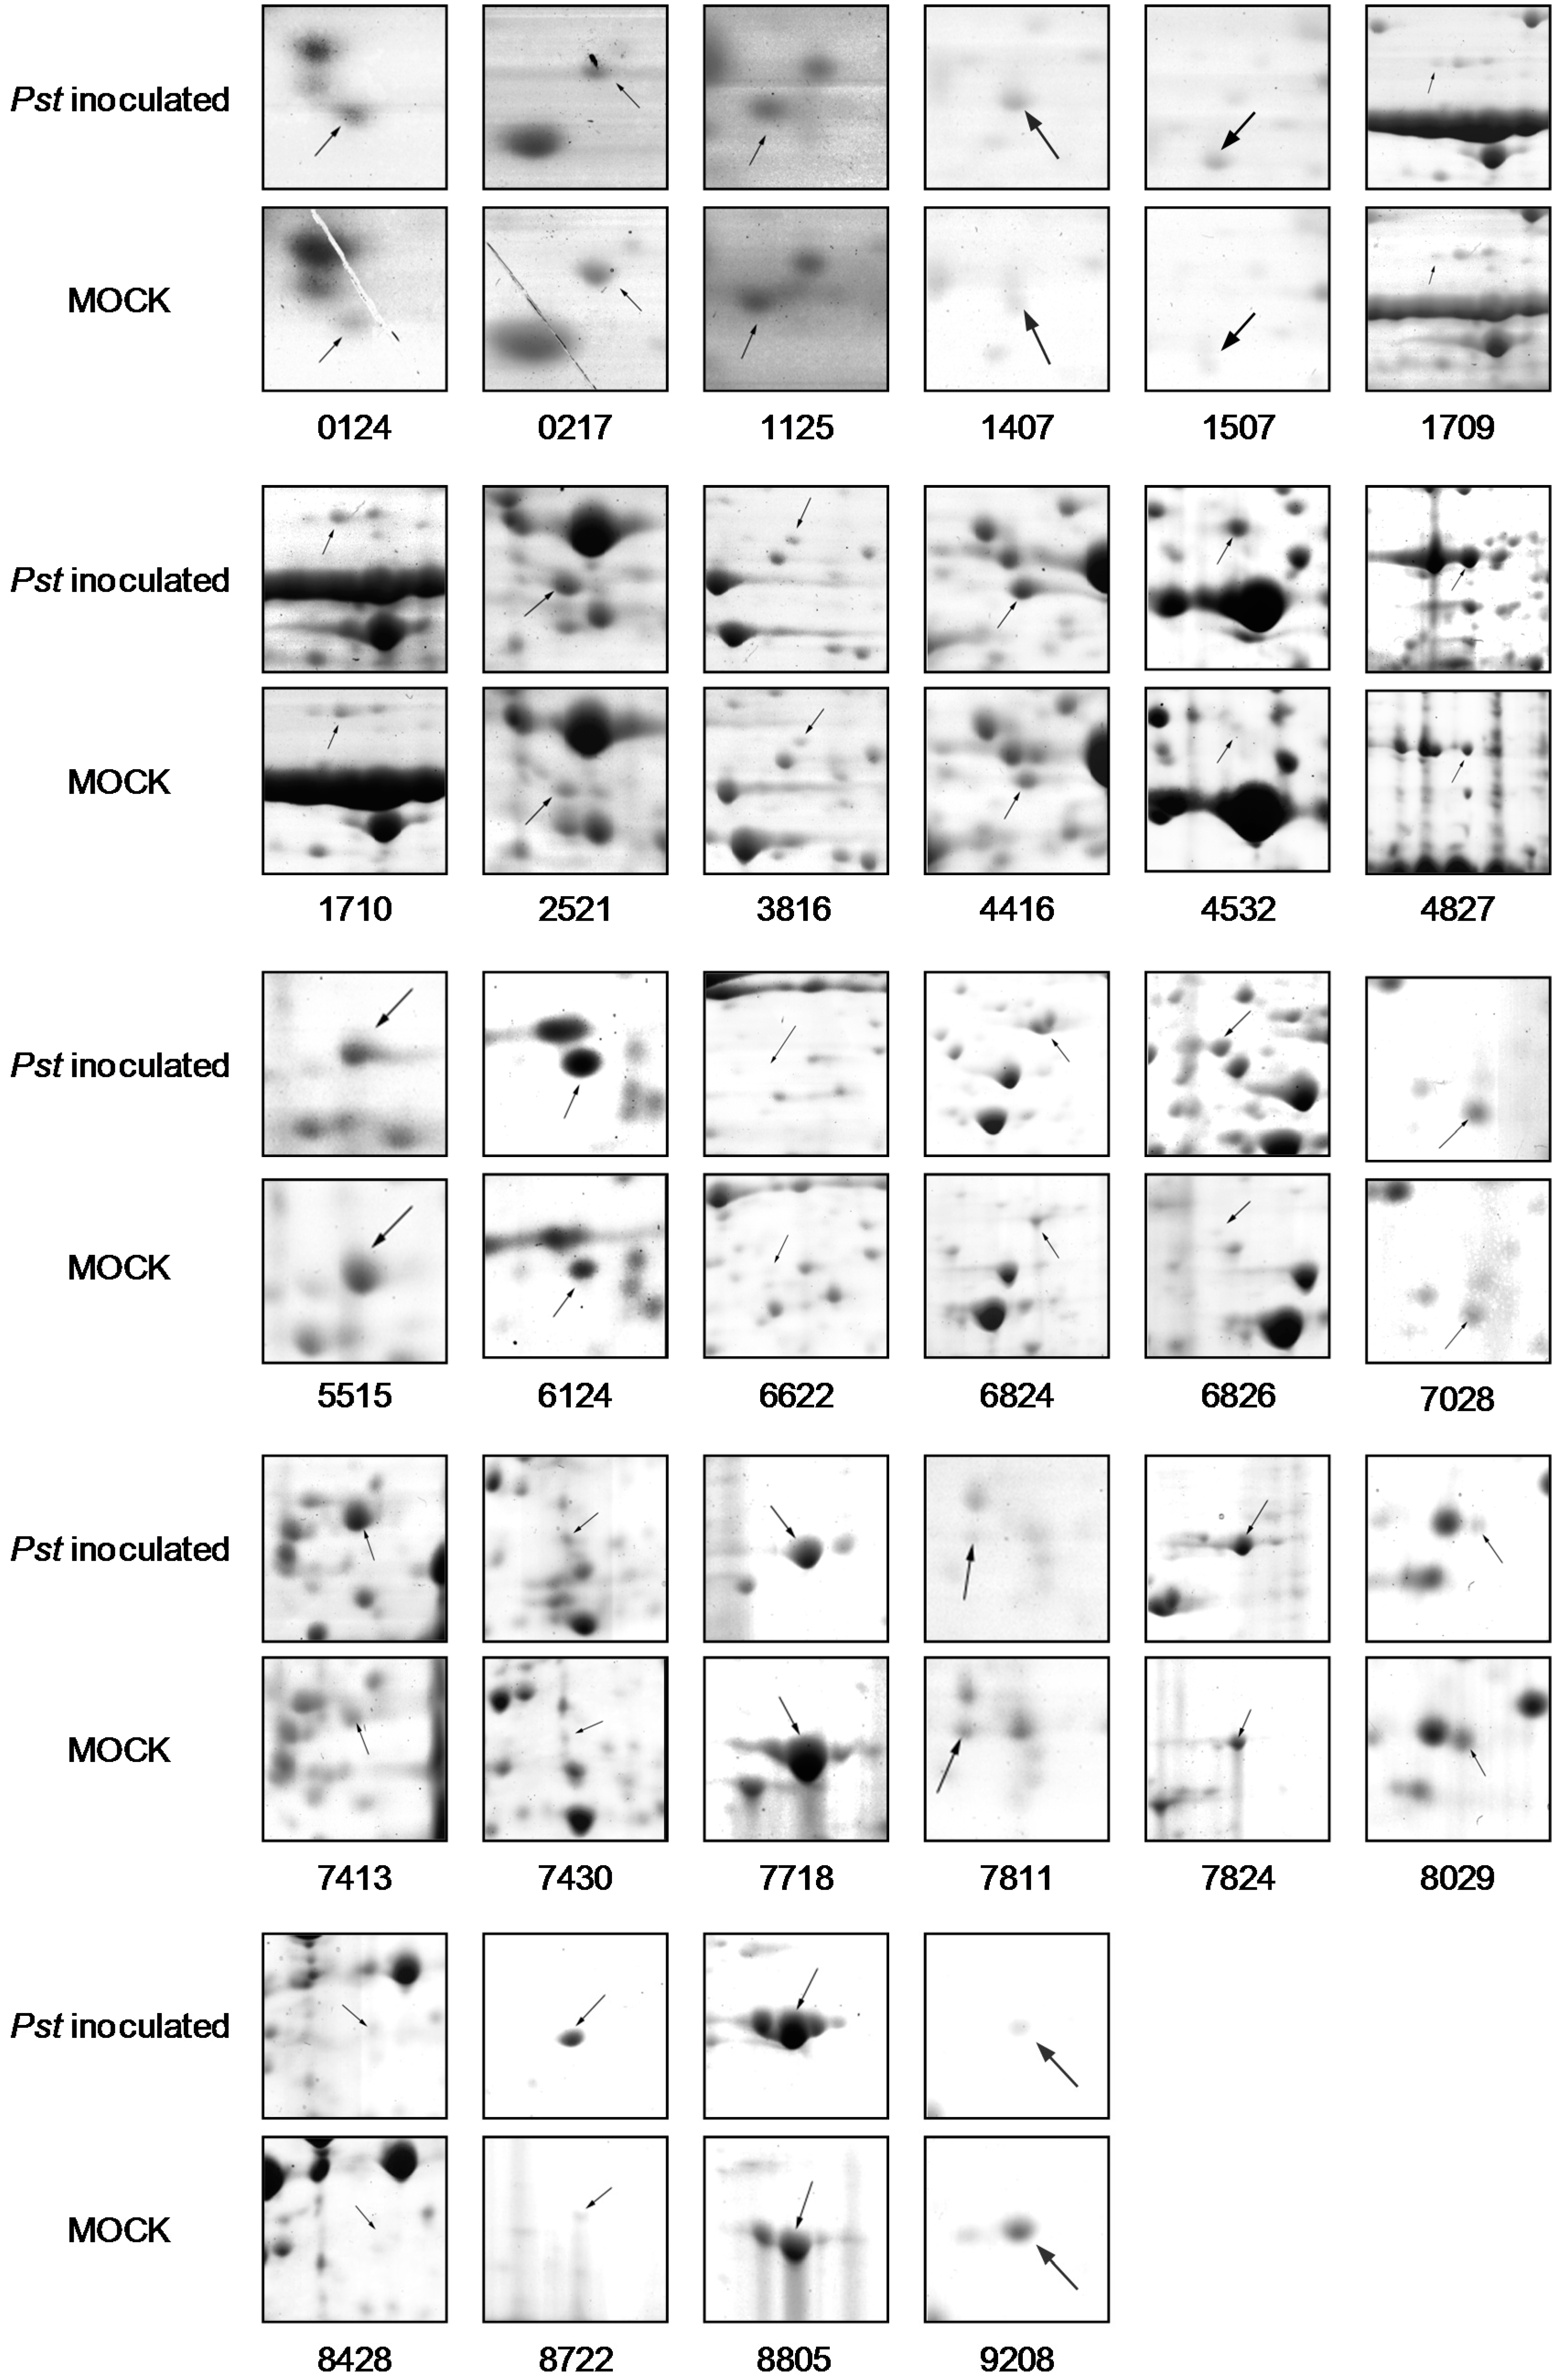
2.1. Rice Proteome Induced by Pst Infection

The loading quantities of protein samples have significant impact on the results of 2-DE. In a preliminary study 400, 500 and 600 μg of protein extracts were used to optimize the quantity of the loading samples. A loading sample of 500 μg generated well-resolved gel maps and was selected as the standard for subsequent analysis (data not shown).
To ensure successful inoculation, leaf samples from 24 and 48 h post inoculation (hpi) treatments were collected and subjected to histological examination (Supplementary Figure S1). Rice leaf proteins from 24 and 48 hpi treatments or mock controls were analyzed by 2-DE. A total of 878 spots from each sample were resolved (Figure 1). Comparative analysis revealed 30 spots showing significant differences (fold change > 2.0) in protein abundance between inoculated and control plants. Among them, 15 spots were obtained from samples at 24 and 48 hpi respectively (Table 1 and Table 2; Figure 2).
Figure 1. Two-dimensional electrophoresis (2-DE) gel maps with proteins isolated from rice leaves inoculated with water (MOCK) or Puccina striiformis f. sp. tritici (Pst) (harvested at 24 and 48 h post inoculation (hpi)). Proteins were first separated by their pI through isoelectric focusing (IEF) and then further separated by molecular weight through SDS-PAGE.
Ijms 15 21644 g001
Table 1. Differentially expressed proteins in rice leaves at 24 h post inoculation with Puccinia striiformis f. sp. tritici.
Spot No.IdentificationGenBank Accession No.pI/MW (kDa) aPeptides Count bCoverage (%) cProtein Score/Ion ScoreMock Average QtyInoculated Average QtyFold Change
Up-Regulated Expression
124Ribulosebiphosphate carboxylasegi|2246127185.96/21.5634.795/143307.4 ± 3.11180.6 ± 19.33.84 ± 0.04
1125Ribosomal protein S6gi|1255886015.97/23.1529.8138/171444.5 ± 0.51118.3 ± 93.72.51 ± 0.21
1407Phosphoglycerate kinasegi|1255528516.86/30.5943.3568/63455.5 ± 9.0572.5 ± 25.210.59 ± 1.71
1507Chloroplast phosphoglycerate kinasegi|469812589.93/32.51038.4229/3000238.9 ± 9.8
1709OsAPx8, Thylakoid-bound ascorbateperoxidasegi|1255824914.79/43.61235.7250/3330176.8 ± 3.9
1710OsAPx8, Thylakoid-bound ascorbateperoxidasegi|1154466635.36/51.42144.8348/53878.4 ± 0.4424.2 ± 0.45.41 ± 0.01
2521Glyceraldehyde-3-phosphate dehydrogenase bgi|1154504936.22/47.51948.4648/810355.2 ± 7.41333.9 ± 4.53.76 ± 0.08
3816OsFtsH1, FtsH proteasegi|1154700525.87/67.01524.5149/24752.4 ± 3.7122.9 ± 10.12.34 ± 0.01
4416Glyceraldehyde-3-phosphate dehydrogenasegi|1154587687.62/43.01854.2864/1030660.8 ± 23.21636.4 ± 31.32.48 ± 0.09
7122Ribulose-bisphosphate carboxylase oxygenase large subunitgi|2977204716.35/29.11439.7408/6211607.2 ± 32.78024.3 ± 34.25.22 ± 1.08
7413Glyceraldehyde-3-phosphate dehydrogenasegi|1154587687.62/43.02159.2716/923342.25 ± 11.91922.6 ± 31.36.16 ± 1.83
0217ATP synthase F1, delta subunit family proteingi|1154487014.98/26.2831.7378/439739.1 ± 3.130.3 ± 0.30.04 ± 0.04
5515Aminotransferasegi|1154774836.48/50.41746.9704/847916.1 ± 31.5282.5 ± 134.80.31 ± 0.15
Down-Regulated Expression
6622NAD dependent epimerase/dehydratase family proteingi|1154820325.75/43.22365.9418/635955.9 ± 47.3353.9 ± 103.90.37 ± 0.11
7811Ferredoxin-nitrite reductasegi|2975999616.63/47.1513.466/94122.3 ± 14.952.2 ± 1.60.43 ± 0.01
a: pI of predicted protein/molecular mass of predicted protein (kDa); b: Number of peptides for protein identification; c: Percentage of protein sequence represented by peptides identified in MS.
Table 2. Differentially expressed proteins in rice leaves at 48 h post inoculation with Puccinia striiformis f. sp. tritici.
Spot No.IdentificationGenBank Accession No.pI/MW (kDa) aPeptides Count bCoverage (%) cProtein Score/Ion ScoreMock Average QtyInoculated Average QtyFold Change
Up-Regulated Expression
4532Glyceraldehyde-3-phosphate dehydrogenase bgi|1154504936.22/47.51431.8641/747359.7 ± 13.71349.8 ± 37.43.76 ± 0.14
4827Transketolase, chloroplast precursorgi|1154662245.44/74.02553.1543/773497.3 ± 23.61267.7 ± 35.42.55 ± 0.10
5318Chloroplast ATP synthase CF1 alpha chaingi|201435645.27/29.4323.0150/166324.5 ± 10.6732.9 ± 21.72.26 ± 0.10
6124Ribulose-1,5-bisphophate carboxylase oxygenasegi|3546185175.80/19.7838.2268/340729.0 ± 17.01702.1 ± 31.22.34 ± 0.08
6824DnaK family protein, chloroplast Hsp70gi|1255780885.33/69.82337.3586/763344.4 ± 24.81192.8 ± 84.63.48 ± 0.25
6826OsFtsH1, FtsH proteasegi|1154700525.51/72.91325.8587/66844.2 ± 2.7335.6 ± 21.27.59 ± 0.68
7028Carbonic anhydrasegi|59177838.41/29.6741.8203/253451.3 ± 37.21196.4 ± 79.52.65 ± 0.25
7430Chloroplast 28 kDa ribonucleo proteingi|1493913655.03/21.01275.3234/351316.9 ± 0.31552.1 ± 13.04.90 ± 0.06
7824Putative LR10 resistance proteingi|3056911436.08/105.4814.713/37284.7 ± 3.5763.3 ± 17.72.68 ± 0.13
8428Phosphoribulo kinasegi|1154480915.68/45.21225.6153/230210.4 ± 1.3432.7 ± 57.82.05 ± 0.26
8722Rhodanese-like domain-containing protein chloroplastic-likegi|1154453875.05/48.4615.5215/238108.0 ± 1.8650.0 ± 15.96.03 ± 0.35
8805Chloroplast Hsp70gi|152337795.07/76.61626.9789/887703.9 ± 13.52818.1 ± 105.04.00 ± 0.22
Down-Regulated Expression
7718T-complex proteingi|1154881605.12/61.12338.6683/8822229.3 ± 60.5859.0 ± 35.20.39 ± 0.01
8029Thioredoxingi|2977289258.16/18.9323.882/99897.8 ± 22.2275.5 ± 7.40.31 ± 0.01
9208Ribonucleoprotein chloroplastic-likegi|1493925454.45/22.2635.1420/4621228.8 ± 35.4403.5 ± 5.80.33 ± 0.01
a: pI of predicted protein/molecular mass of predicted protein (kDa); b: Number of peptides for protein identification; c: Percentage of protein sequence represented by peptides identified in MS.
Figure 2. Differentially expressed proteins induced by Pst. Arrows point to protein spots with altered expression levels (fold change > 2.0, p < 0.05).
Ijms 15 21644 g002

2.2. Identification of Differentially Expressed Proteins by Mass Spectrometry

All differentially expressed spots were subjected to mass spectrometry analysis and identification (Table 1 and Table 2). The 30 differentially expressed spots represented 27 annotated proteins. Three proteins each identified by two spots included two glyceraldehyde-3-phosphate dehydrogenases (gi|115458768 and gi|115450493) represented by spots 4416/7413 and 2521/4532, and one FtsH protease (gi|115470052) represented by spots 3816/6826. This was probably due to posttranslational protein modifications or presence of homologous proteins. Ten proteins were up-regulated and four proteins were down-regulated at 24 hpi; 12 were up-regulated and three were down-regulated at 48 hpi. Two proteins, a glyceraldehyde-3-phosphate dehydrogenase (GAPDH, gi|115450493) and an FtsH protease (gi|115470052), were up-regulated at both time points.
All 27 proteins identified were analyzed for gene ontology using GO (gene ontology) Slim and classified by biological processes. As expected, 19 differentially expressed proteins were attributed to the class “response to stimulus” (Figure 3; Supplementary Table S1), accounting for 63.0% of all identified proteins. They were categorized according to function into six groups including energy metabolism, protein synthesis and modification, photosynthesis, glycerol-3-phosphate metabolism, oxidation-reduction processes and resistance protein. Four proteins, including one ATP synthase F1, delta subunit family protein (spot no. 0217), one chloroplast ATP synthase CF1 alpha chain protein (spot no. 5318), one rhodanese-like domain-containing protein (spot no. 8722) and one transketolase (spot no. 4827) were involved in energy metabolism. Four proteins associated with protein synthesis and modification included two Hsp70 family proteins (spot no. 6824 and 8805), one amino transferase (spot no. 5515) and one ribonucleo protein (spot no. 9208). Three proteins in the class of oxidation-reduction processes included OsAPx8 (spot no. 1710), one thylakoid-bound ascorbate peroxidase (spot no. 1709) and one thioredoxin (spot no. 8029). Three proteins involved in glycerol-3-phosphate metabolism included two phosphoglycerate kinase (spot no. 1407 and 1507) and one GAPDH (spot no. 2521/4532). Two proteins involved in photosynthesis included one FtsH protease (spot no. 3816/6826) and one phosphoribulokinase (spot no. 8428). A homologue protein of wheat Lr10, a host resistance protein that confers resistance to the wheat leaf rust fungus, was also identified. These results indicated that proteins involved in host resistance also have roles in the nonhost response.

2.3. Validation of Up-Regulated Proteins by qRT-PCR

To further confirm the changes in protein abundance, qRT-PCR was used to analyze the expression patterns of coding genes after inoculation. Fifteen up-regulated proteins were selected. The mRNA levels of 14 proteins exhibited significant increases (fold change > 2) in at least one sampling time (Table 3). The changes were consistent with the induced increases of corresponding proteins and validated the differentially expressed proteins identified by two-dimensional polyacrylamide gelelectrophoresis (2D-PAGE). Additionally, the mRNA levels of five proteins, including an Hsp70 (gi|125578088), a phosphoribulokinase (gi|115448091), a rhodanese-like domain-containing protein (gi|115445387), a transketolase (gi|115466224) and an ATP synthase CF1 alpha chain protein (gi|20143564), were induced as early as 12 hpi. The single transcript that remained stable over both time courses was the coding gene for FtsH protease, which was up-regulated at both 24 and 48 hpi. Since FtsH protease interacts with molecular chaperone Hsp70, we suggest it is stabilized by Hsp70 and therefore has an increased half-life, allowing it to persist in abundance at a relatively steady transcriptional level [15,16].
Figure 3. GO (gene ontology) Slim analysis of differentially expressed proteins in rice inoculated with Pst. Number of proteins attributed to each GO term are in parentheses.
Ijms 15 21644 g003
Table 3. Transcriptional changes of differentially expressed proteins induced by Pst relative to the mock control.
Accession No.Gene12 hpi24 hpi48 hpi72 hpi
gi|125588601Os03g626300.94 ± 0.322.65 ± 1.162.86 ± 0.841.25 ± 0.16
gi|46981258Os05g416400.96 ± 0.192.06 ± 0.273.60 ± 1.180.85 ± 0.40
gi|125582491Os02g348100.96 ± 0.142.31 ± 0.432.12 ± 0.750.87 ± 0.20
gi|115450493Os03g037201.09 ± 0.053.77 ± 0.334.23 ± 0.411.91 ± 1.26
gi|115470052Os06g510291.03 ± 0.160.68 ± 0.051.15 ± 0.290.63 ± 0.22
gi|115458768Os04g386000.79 ± 0.503.41 ± 0.406.00 ± 2.131.11 ± 0.18
gi|115466224Os06g042702.86 ± 0.742.86 ± 0.741.07 ± 0.310.51 ± 0.11
gi|20143564OSJNBa0034L04.442.19 ± 0.700.89 ± 0.022.43 ± 0.682.30 ± 0.41
gi|5917783Os01g452741.15 ± 0.230.88 ± 0.1313.39 ± 0.540.84 ± 0.24
gi|149391365Os09g391800.63 ± 0.190.83 ± 0.274.67 ± 0.641.84 ± 0.64
gi|115448091Os02g470207.54 ± 0.852.91 ± 0.901.81 ± 0.481.13 ± 0.27
gi|115445387Os02g157502.91 ± 1.700.70 ± 0.124.65 ± 0.740.99 ± 0.28
gi|15233779Os12g140700.77 ± 0.091.35 ± 0.163.09 ± 0.191.33 ± 0.07
gi|305691143Os11g143800.64 ± 0.091.84 ± 0.122.17 ± 0.192.39 ± 0.55
gi|125578088Os11g4776036.82 ± 9.8412.18 ± 5.570.69 ± 0.211.20 ± 0.31
hpi: hours post inoculation.

3. Discussion

Our previous work indicated that the nonhost response of rice to Pst started at 24 hpi and was characterized by increasing hydrogen peroxide (H2O2) accumulation [17]. However, the time points selected in the previous proteomic studies were too late. For example, Liang et al. [18] identified wheat proteins 14 days after inoculation with Pst; Ma et al. [19] studied the wheat proteome 48 hpi with Pst; Li et al. [20] analyzed the rice proteins 3 days after inoculation with the leaf rust fungus. The relatively earlier time points (24 and 48 hpi) we chose may not only help us to find more relevant proteins, but also provide more accurate information regarding proteome reprogramming in rice at the early stages of Pst infection.
As shown in the results, GAPDH, a key enzyme in glycerol-3-phosphate metabolism was up-regulated at both 24 and 48 hpi. Another key enzyme linked to glycerol-3-phosphate metabolism, phosphoglycerate kinase (PGK), that acts downstream of GAPDH, was also induced and exhibited significant changes in abundance (10.6-fold higher than the control) at 24 hpi. GAPDH was also induced in disease-resistance enhanced rice mutants spl5, spl1 and cdr2 [21,22,23]. GAPDH mainly converts glyceraldehyde-3-phosphate into 1,3-bisphosphoglycerate, which is then converted to glycerol-3-phosphate by phosphoglycerate kinase in the glycolytic pathway [24]. Glycerol-3-phosphate is an important signal molecule in systemic acquired resistance in Arabidopsis and wheat [25,26]. A recent study indicated that the Arabidopsis GAPDH interacts with phospholipase Dδ on the plasma membrane, and is involved in abscisic acid (ABA) and H2O2 signal transduction, triggering stress responses such as stomatal closing [27]. It was also reported that PGK was involved in the hypoxic responses of rice and wheat [28]. These results showed that the GAPDH and PGK pathway plays an important role in the the nonhost response in rice.
Numerous studies have demonstrated that heat shock protein Hsp70 plays an important role in the plant defense response. Hsp70-silenced tobacco exhibited a compromised HR response to Phytophthora infestans and impaired nonhost resistance to Pseudomonas cichorii [28]. Hsp70 and another heat shock protein, Hsp90, together with RAR1 and Rac1, two key components of the plant immune system, were found to form a complex, which may be critical in rice innate immunity [29]. In the present study, two Hsp70 proteins were up-regulated, indicating that both of them played a role in nonhost resistance. In rice, Hsp70 suppresses H2O2-induced programmed cell death [30]. We presumethat as a molecular chaperon, Hsp70 may protect key components of the rice immune system from degradation induced by H2O2 at the early stage of the nonhost defense response. This was supported by the accumulation of two FtsH proteases following Pst infection in the present study. Hsp70 protects precursors of FtsH2 and FtsH1 from degrading by 26S proteasome ubiquitylation, leading to H2O2 excess and HR responses under high-intensity light conditions [15]. H2O2 production occurred not only in infected mesophyll cells and stomatal guard cells, but also at attempted infection sites [13]. In a previous study, we found that compared to japonica rice plants, indica plants were more vulnerable to the infection by Pst due to lower H2O2 production, suggesting a critical role of H2O2 in rice NHR to Pst [17]. The expression levels of a major ROS detoxification enzyme, thylakoid ascorbate peroxidase OsAPx8 (Os02g34810) in inoculated plants was 5-fold higher at 24 hpi than that in the non-inoculated control, indicating that the reactive oxygen scavenging system was also involved in response to infection by the non-adapted pathogen. These results further demonstrate the complex regulation of H2O2 in the early stages of NHR.
Lr10, a typical CC-NBS-LRR (coiled-coil, nucleotide-binding site and leucine-rich repeat) type disease resistance protein in wheat, confers resistance to leaf rust fungus. Although it is encoded by a single-copy gene located on wheat chromosome 1AS, there are six homologous proteins in rice [31]. Among them, Os11g14380 was induced at 48 hpi in the presentstudy and another Lr10 homologue (Os08g29809) was also up-regulated in rice challenged by the leaf rust fungus [20]. Although NHR is mainly controlled by multiple quantitative loci, R genes have also been implicated in NHR. A typical R protein from maize, RXO1, confers resistance to Xanthomonas oryzae Pv. oryzkola, which causes bacterial leaf streak in rice [32]. Genetic studies demonstrated that NHR in wheat and barley crown rust (Puccinia coronata var. hordei) was controlled through one or two dominant genes in wheat accessions Chris and Chinese Spring, respectively [33]. Niks et al. [12] proposed that nonhost plants, especially near-nonhost, possess multiple R genes corresponding to Avr genes in potential pathogens. The possible role of rice Lr10 homologue in defense responses to rust fungi further supports participation of R genes in NHR.
Our proteomic study provided a macroscopic profile of rice nonhost response to Pst at the early stage of infection. Most of the differentially expressed proteins identified were known and commonly involved in host plant stress responses, such as H2O2 production and glycerol-3-phosphate signaling. Nonhost resistance may overlap with host basal resistance, and only a few key components may be specific for NHR. Since these key components are usually located upstream in the signaling pathway and are stable at the transcriptional level, mutant screening and genetic studies would be helpful to identify them in future studies.

4. Experimental Section

4.1. Plants and Pathogens

Plants of japonica rice (Oryza sativa L. ssp. japonica) cultivar Nipponbare were grown in a greenhouse at 25 °C with 16 h of light and at 20 °C in 8 h of darkness. Pst isolate CYR32 (a predominant Pst race in China from 2002) was maintained on the susceptible wheat line, Mingxian 169, following the procedures and conditions described by Zhang et al. [34]. Fresh aqueous Pst suspensions of urediniospores were applied with a fine paintbrush onto the adaxial surface of the second leaves of rice seedlings at the two-leaf stage. The inoculated seedlings were kept in a dew chamber in darkness for 36 h at 12 °C and then transferred to a growth chamber at 16 °C with a 16/8 h photoperiod. To ensure successful inoculation, leaf samples were collected and subjected to histological examination according to the method previously described [17]. Leaf tissues for various analyses were collected at specific time points post-inoculation. Controls inoculated with water were treated in the same way.

4.2. Protein Extraction

Harvested leaf tissues were ground to fine powder with liquid nitrogen. Total protein extraction was performed according to the trichloroacetic acid (TCA)-acetone precipitation method [35]. Protein concentrations were estimated using Bradford’s reagent (Sigma–Aldrich, St. Louis, MO, USA) [36].

4.3. Two-Dimensional Electrophoresis

For 2-DE, 500 μg of protein was loaded onto 17 cm isoelectric focusing (IEF) strips with pH 4 to 7 linear gradient (Bio-Rad, Richmond, CA, USA) according to the manufacturer’s protocol. The IEF conditions were: 50 V for 14 h, 250 V for 1 h, 500 V for 1 h, 1000 V for 1 h, 1000–8500 V for 5 h over a linear gradient, 8500 V for 6.5 h, and a 500 V hold. For the second dimension, the strips were first incubated in equilibration buffer I containing 2% dithiothreitol for 15 min and then replaced with equilibration buffer II containing 2.5% iodoacetamide for 15 min. After equilibration, proteins were separated by 12% SDS–PAGE and sealed with 1% agarose. Electrophoresis was carried out at 5 mA per gel for 1 h, and then 25 mA per gel for 6 h using a PROTEAN II XL machine (Bio-Rad). After electrophoresis, the gels were stained with Coomassie Brilliant Blue R-250 (Colab Laboratories Inc., Chicago, IL, USA). Two gels were run for each time point.

4.4. Image Analysis

Stained gels were scanned with a UMAX PowerLook Scanner (Bio-Rad). Protein spots were then detected, normalized, and quantified by PDQuest 8.0 (Bio-Rad). Proteins were considered significantly different between treated samples and controls when spot intensities passed a threshold of at least a two-fold difference in up- or down-regulation in combination with a Student’s t-test on concentrations using a 95% reliability score.

4.5. Mass Spectrometric Analysis and Protein Identification

Protein spots with at least two-fold differences (p < 0.05) were collected from the 2-DE gels for inoculated and control groups. Protein samples for MS were excised manually from the gels and prepared according to Shevchenko et al. [37]. MS and MS/MS data for protein identification were obtained by using a MALDI-TOF-TOF instrument (4800 proteomics analyzer; Applied Biosystems, Foster City, CA, USA). Instrument parameters were set using the 4000 Series Explorer software (Applied Biosystems). The MS spectra were recorded in reflector mode in a mass range from 800 to 4000 with a focus mass of 2000. A CalMix5 standard was used to calibrate the instrument (ABI 4700 calibration mixture; Applied Biosystems). For one main MS spectrum, 25 subspectra with 125 shots per subspectrum were accumulated using a random search pattern. For MS calibration, autolysis peaks of trypsin ((M + H) + 842.5100 and 2211.1046) were used as internal calibrates, and up to 10 of the most intense ion signals were selected as precursors for MS/MS acquisition, excluding the trypsin autolysis peaks and the matrix ion signals. In MS/MS positive ion mode, for one main MS spectrum, 50 subspectra with 50 shots per subspectrum were accumulated using a random search pattern. Collision energy was 2 kV, the collision gas was air, and default calibration was set by using the Glu1-Fibrino-peptide B ((M + H) + 1570.6696) spotted onto Cal 7 positions of the MALDI target. Combined peptide mass fingerprinting PMF and MS/MS queries were performed by using the MASCOT search engine 2.2 (Matrix Science, London, UK) embedded into GPS-Explorer Software 3.6 (Applied Biosystems) on the NCBI Non-redundant Database with the following parameter settings: 100 ppm mass accuracy, trypsin cleavage with one missed cleavage allowed, carbamidomethylation set as a fixed modification, oxidation of methionine was allowed as variable modification, MS/MS fragment tolerance was set to 0.4 Da. A GPS-Explorer protein confidence index ≥95% were used for further manual validation.

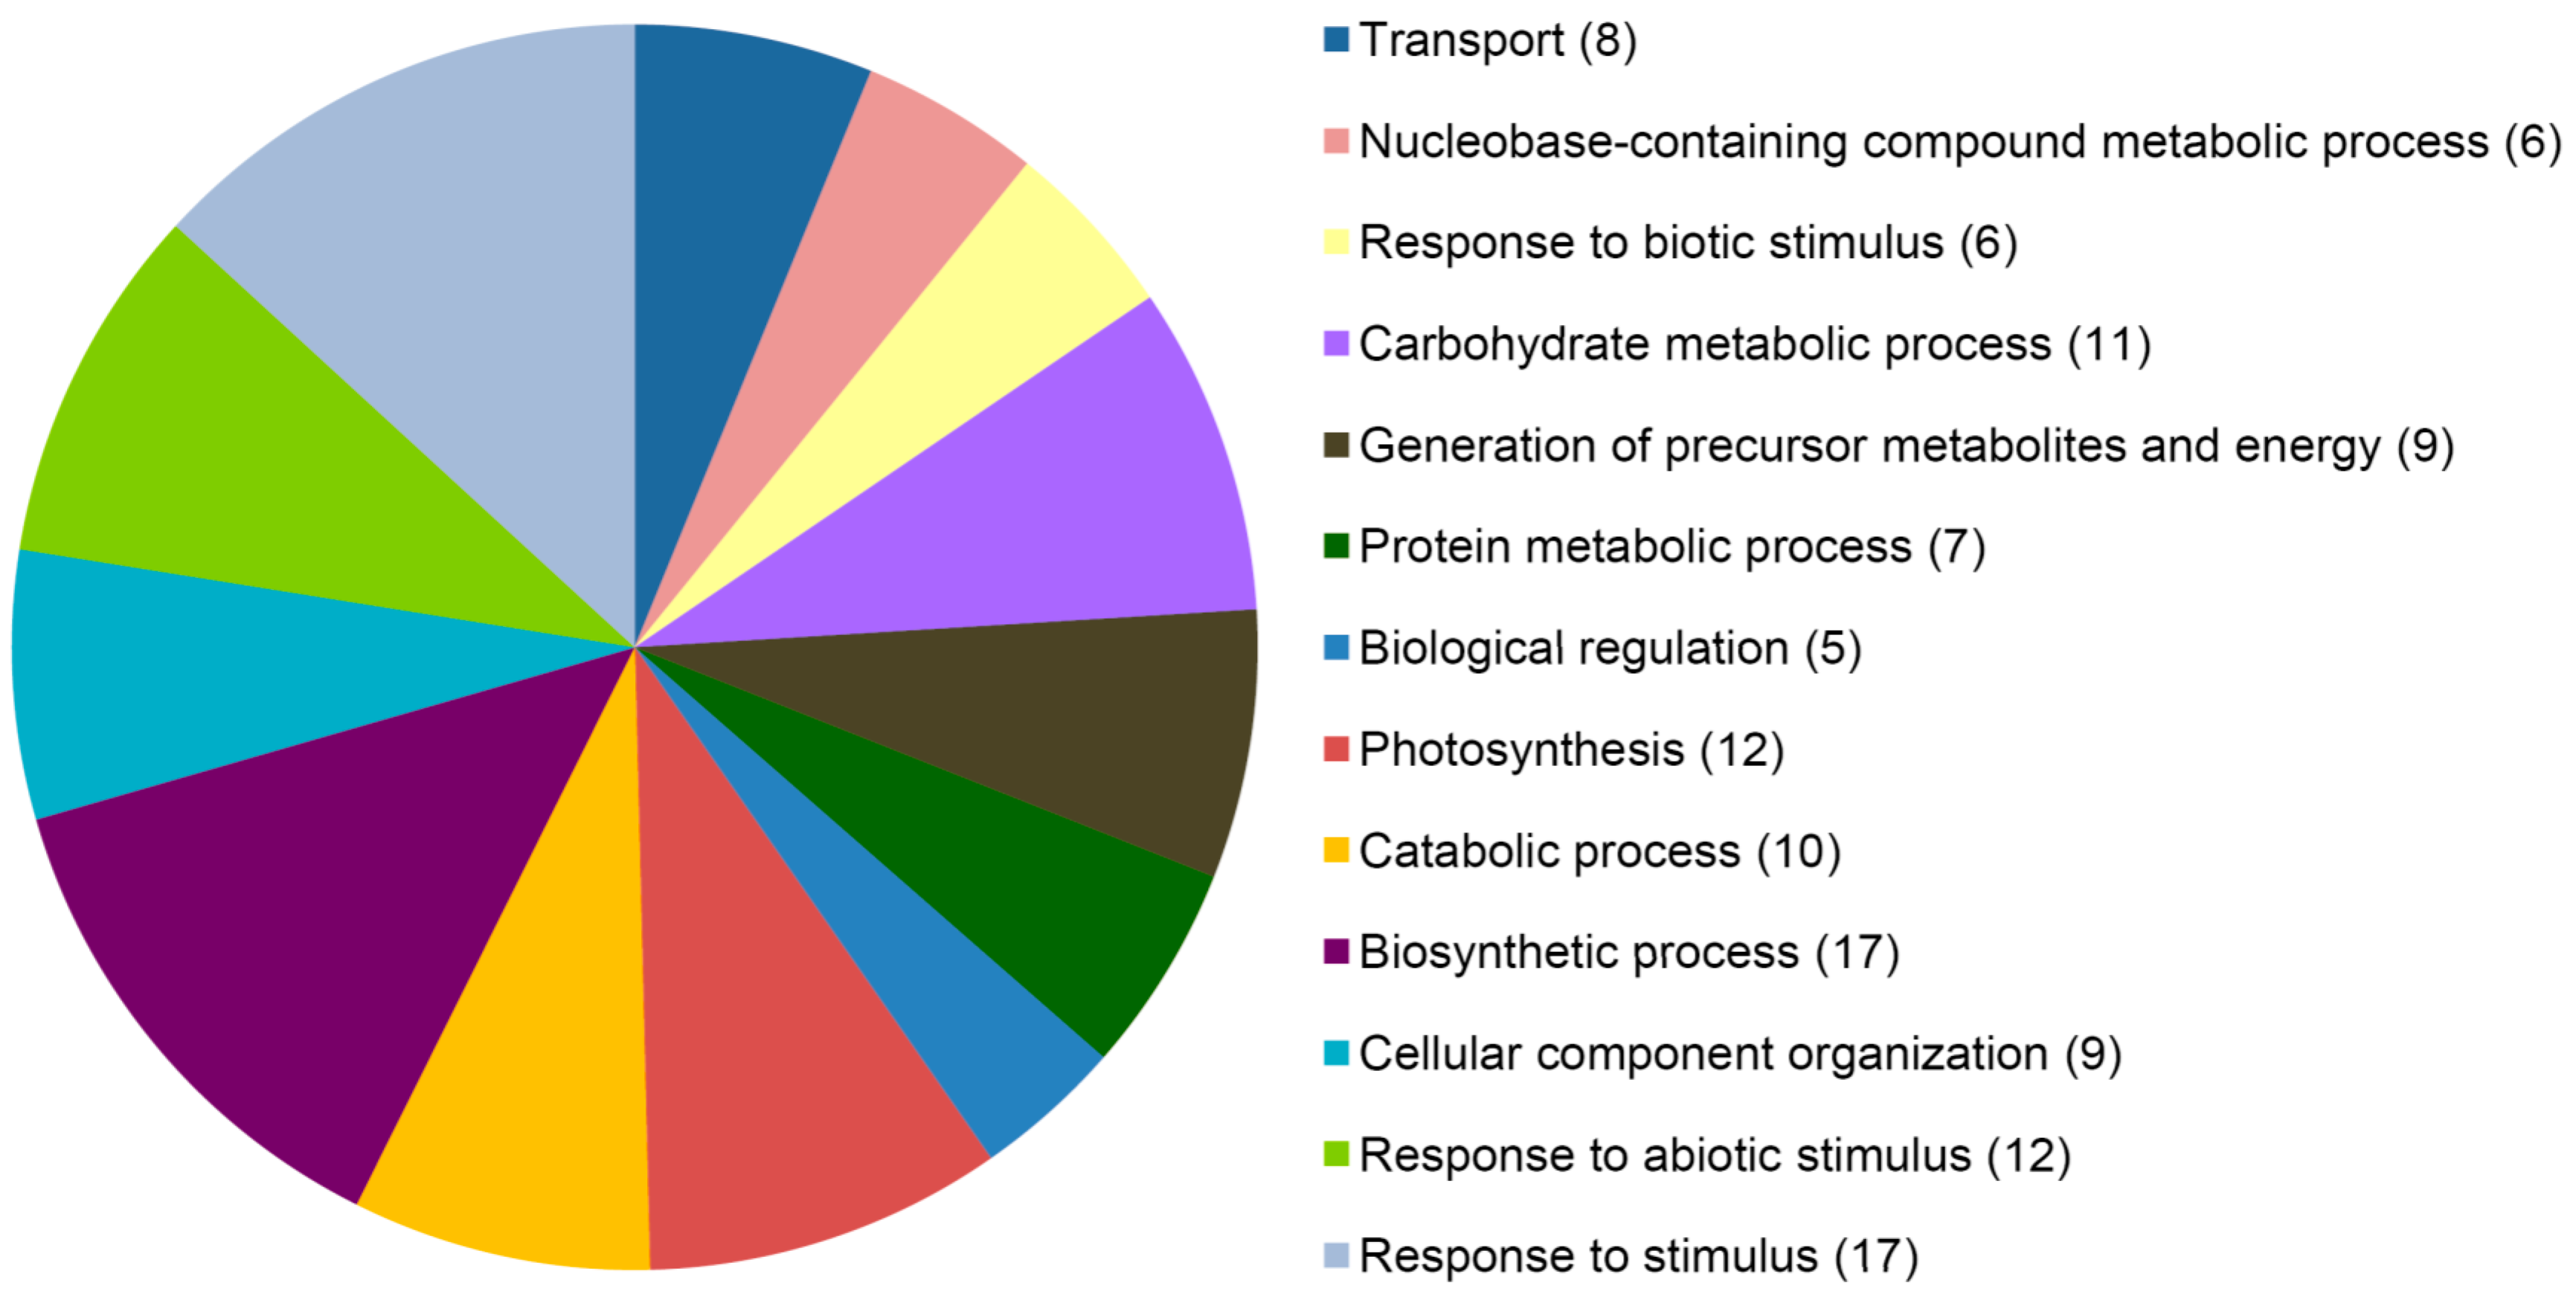
4.6. Gene Ontology Analysis

Gene ontology (GO) analysis of differentially expressed proteins was performed by BLAST2GO software (version 2.7.2) [38]. To perform GO mapping and annotation, sequences of the differentially expressed proteins were inported into the software by setting the maximum number of blast hits to 20. The mapping step retrieved the GO terms associated with the blastx hits via the public BLAST2GO Database “b2g_sep13”. Then, the annotation step was carried out with default parameters to select reliable terms among those obtained in the mapping and to assign them to the queries. To summarize the functional classification of thedifferentially expressed proteins, resulting GO annotation was mapped to GO slim terms using the BLAST2GO internal mapping function using the “oslim_plant.obo” ontology subset.

4.7. RNA Isolation and qRT-PCR Assays

Total RNA from CYR32- or mock-inoculated rice leaves were sampled at 0, 12, 24, 48 and 72 hpi and extracted using the Trizol reagent (Life Technologies, Grand Island, NY, USA). DNase I (Fermentas, Shenzhen, China) treatment was applied to remove genomic DNA and first strand cDNA was synthesized with a RevertAid First Strand cDNA Synthesis Kit (Fermentas). Primers (see Supplementary Table S2) were specifically designed to anneal to each of the selected genes and the endogenous reference gene OsActin (Genbank accession No. KC140126). Expression patterns of selected genes were analyzed with a Bio-Rad iQ5 system. Relative gene quantification was calculated by the comparative 2–ΔΔCt method [39] and normalized to the corresponding expression level of the OsActin. All reactions were performed in triplicate, including three no-template controls.

5. Conclusions

In summary, we identified 27 differentially expressed proteins in rice in response to Pst inoculation using 2-DE and mass spectrometry. Most of these proteins are involved in basic resistance, such as glycerol-3-phosphate and hydrogen peroxide signaling. A homologue of wheat leaf rust resistance protein Lr10 was also identified, indicating that multiple defense layers are involved in rice NHR to Pst infection. These results demonstrate an intrinsic relationship between host and nonhost resistance and extend our knowledge on plant immune systems.

Supplementary Materials

Supplementary materials can be found at https://www.mdpi.com/1422-0067/15/12/21644/s1.

Acknowledgments

We thank Robert McIntosh and Xianming Chen for improving the manuscript and invaluable suggestions. This study was supported by the National Basic Research Program of China (2013CB127700), the Fundamental Research Funds for the Central Universities (QN2012008) and the 111 Project from the Ministry of Education of China (B07049).

Author Contributions

Zhensheng Kang and Jing Zhao designed research; Jing Zhao and Yuheng Yang performed the experiments and analyzed the data; Jing Zhao and Yuheng Yang wrote the manuscript and Zhensheng Kang revised the manuscript. All authors read and approved the final manuscript.

Conflicts of Interest

We declare that we have no financial and personal relationships with other people or organizations that can inappropriately influence our work, there is no professional or other personal interest of any nature or kind in any product, service and/or company that could be construed as influencing the position presented in, or the review of, the manuscript entitled “Proteomic analysis of rice nonhost resistance to Puccinia striiformis f. sp. tritici using two-dimensional electrophoresis”.

References

  1. Dean, R.; van Kan, J.; Pretorius, Z.A.; Hammond-Kosack, K.E.; Di Pietro, A.; Spanu, P.D.; Rudd, J.J.; Dickman, M.; Kahmann, R.; Ellis, J.; et al. The top 10 fungal pathogens in molecular plant pathology. Mol. Plant Pathol. 2012, 13, 414–430. [Google Scholar]
  2. Chen, W.; Wu, L.; Liu, T.; Xu, S. Race dynamics, diversity, and virulence evolution in Puccinia striiformis f. sp. tritici, the causal agent of wheat stripe rust in China from 2003 to 2007. Plant Dis. 2009, 93, 1093–1101. [Google Scholar]
  3. Fan, J.; Doerner, P. Genetic and molecular basis of nonhost disease resistance: Complex, yes; silver bullet, no. Curr. Opin. Plant Biol. 2012, 15, 400–406. [Google Scholar]
  4. Mysore, K.S. Nonhost resistance against bacterial pathogens: Retrospectives and prospects. Annu. Rev. Phytopathol. 2013, 51, 407–427. [Google Scholar]
  5. Mysore, K.S.; Ryu, C.M. Nonhost resistance: How much do we know? Trends Plant Sci. 2004, 9, 97–104. [Google Scholar]
  6. Schulze-Lefert, P.; Panstruga, R. A molecular evolutionary concept connecting nonhost resistance, pathogen host range, and pathogen speciation. Trends Plant Sci. 2011, 16, 117–125. [Google Scholar]
  7. Azinheira, H.G.; do Céu Silva, M.; Talhinhas, P.; Medeira, C.; Maia, I.; Petitot, A.S.; Fernandez, D. Nonhost resistance responses of Arabidopsis thaliana to the coffee leaf rust fungus (Hemileia vastatrix). Botany 2010, 88, 621–629. [Google Scholar]
  8. Loehrer, M.; Langenbach, C.; Goellner, K.; Conrath, U.; Schaffrath, U. Characterization of nonhost resistance of Arabidopsis to the Asian soybean rust. Mol. Plant-Microbe Interact. 2008, 21, 1421–1430. [Google Scholar]
  9. Shafiei, R.; Hang, C.; Kang, J.G.; Loake, G.J. Identification of loci controlling non-host disease resistance in Arabidopsis against the leaf rust pathogen Puccinia triticina. Mol. Plant Pathol. 2007, 8, 773–784. [Google Scholar]
  10. Mellersh, D.G.; Heath, M.C. An investigation into the involvement of defense signaling pathways in components of the nonhost resistance of Arabidopsis thaliana to rust fungi also reveals a model system for studying rust fungal compatibility. Mol. Plant-Microbe Interact. 2003, 16, 398–404. [Google Scholar]
  11. Jafary, H.; Albertazzi, G.; Marcel, T.C.; Niks, R.E. High diversity of genes for nonhost resistance of barley to heterologous rust fungi. Genetics 2008, 178, 2327–2339. [Google Scholar]
  12. Niks, R.E. How specific is non-hypersensitive host and nonhost resistance of barley to rust and mildew fungi? J. Integr. Agric. 2014, 13, 244–254. [Google Scholar]
  13. Ayliffe, M.; Devilla, R.; Mago, R.; White, R.; Talbot, M.; Pryor, A.; Leung, H. Nonhost resistance of rice to rust pathogens. Mol. Plant-Microbe Interact. 2011, 24, 1143–1155. [Google Scholar]
  14. Rampitsch, C.; Bykova, N.V. Proteomics and plant disease: Advances in combating a major threat to the global food supply. Proteomics 2012, 12, 673–690. [Google Scholar]
  15. Shen, G.; Adam, Z.; Zhang, H. The E3 ligase AtCHIP ubiquitylates FtsH1, a component of the chloroplast FtsH protease, and affects protein degradation in chloroplasts. Plant J. 2007, 52, 309–321. [Google Scholar]
  16. Vogel, C.; Marcotte, E.M. Insights into the regulation of protein abundance from proteomic and transcriptomic analyses. Nat. Rev. Genet. 2012, 13, 227–232. [Google Scholar]
  17. Yang, Y.; Zhao, J.; Xing, H.; Wang, J.; Zhou, K.; Zhan, G.; Zhang, H.; Kang, Z. Different non-host resistance responses of two rice subspecies, japonica and indica, to Puccinia striiformis f. sp. tritici. Plant Cell Rep. 2013, 33, 423–433. [Google Scholar]
  18. Liang, G.; Ji, H.; Zhang, Z.; Wei, H.; Kang, Z.; Peng, Y.; Li, Y. Proteome analysis of slow-rusting variety Chuanmai 107 inoculated by wheat stripe rust (Puccina striiformis). J. Triticeae Crops 2007, 27, 335–340. [Google Scholar]
  19. Ma, C.; Xu, S.; Xu, Q.; Zhang, Z.; Pan, Y. Proteomic analysis of stripe rust resistance wheat line Taichung29*6/Yr5 inoculated with stripe rust race CYR32. Sci. Agric. Sin. 2009, 42, 1616–1623. [Google Scholar]
  20. Li, H.; Goodwin, P.H.; Han, Q.; Huang, L.; Kang, Z. Microscopy and proteomic analysis of the non-host resistance of Oryza sativa to the wheat leaf rust fungus, Puccinia triticina f. sp. tritici. Plant Cell Rep. 2012, 31, 637–650. [Google Scholar]
  21. Tsunezuka, H.; Fujiwara, M.; Kawasaki, T.; Shimamoto, K. Proteome analysis of programmed cell death and defense signaling using the rice lesion mimic mutant cdr2. Mol. Plant-Microbe Interact. 2005, 18, 52–59. [Google Scholar]
  22. Kim, S.T.; Kim, S.G.; Kang, Y.H.; Wang, Y.; Kim, J.Y.; Yi, N.; Kim, J.K.; Rakwal, R.; Koh, H.J.; Kang, K.Y. Proteomics analysis of rice lesion mimic mutant (spl1) reveals tightly localized probenazole-induced protein (PBZ1) in cells undergoing programmed cell death. J. Proteome Res. 2008, 7, 1750–1760. [Google Scholar]
  23. Chen, X.; Fu, S.; Zhang, P.; Gu, Z.; Liu, J.; Qian, Q.; Ma, B. Proteomic analysis of a disease-resistance-enhanced lesion mimic mutant spotted leaf 5 in rice. Rice 2013. [Google Scholar] [CrossRef]
  24. Bolton, M.D. Primary metabolism and plant defense-fuel for the fire. Mol. Plant-Microbe Interact. 2009, 22, 487–497. [Google Scholar]
  25. Chanda, B.; Xia, Y.; Mandal, M.; Yu, K.; Sekine, K.; Gao, Q.; Selote, D.; Hu, Y.; Stromberg, A.; Navarre, D.; et al. Glycerol-3-phosphate is a critical mobile inducer of systemic immunity in plants. Nat. Genet. 2011, 43, 421–427. [Google Scholar]
  26. Yang, Y.; Zhao, J.; Liu, P.; Xing, H.; Li, C.; Wei, G.; Kang, Z. Glycerol-3-phosphate metabolism in wheat contributes to systemic acquired resistance against Puccinia striiformis f. sp. tritici. PLoS One 2013, 8, e81756. [Google Scholar]
  27. Guo, L.; Devaiah, S.P.; Narasimhan, R.; Pan, X.; Zhang, Y.; Zhang, W.; Wang, X. Cytosolic glyceraldehyde-3-phosphate dehydrogenases interact with phospholipase Dδ to transduce hydrogen peroxide signals in the Arabidopsis response to stress. Plant Cell 2012, 24, 2200–2212. [Google Scholar]
  28. Shingaki-Wells, R.N.; Huang, S.; Taylor, N.L.; Carroll, A.J.; Zhou, W.; Millar, A.H. Differential molecular responses of rice and wheat coleoptiles to anoxia reveal novel metabolic adaptations in amino acid metabolism for tissue tolerance. Plant Physiol. 2011, 156, 1706–1724. [Google Scholar]
  29. Thao, N.P.; Chen, L.; Nakashima, A.; Hara, S.; Umemura, K.; Takahashi, A.; Shirasu, K.; Kawasaki, T.; Shimamoto, K. RAR1 and HSP90 form a complex with Rac/Rop GTPase and function in innate-immune responses in rice. Plant Cell 2007, 19, 4035–4045. [Google Scholar]
  30. Qi, Y.; Wang, H.; Zou, Y.; Liu, C.; Liu, Y.; Wang, Y.; Zhang, W. Over-expression of mitochondrial heat shock protein 70 suppresses programmed cell death in rice. FEBS Lett. 2011, 585, 231–239. [Google Scholar]
  31. Feuillet, C.; Travella, S.; Stein, N.; Albar, L.; Nublat, A.; Keller, B. Map-based isolation of the leaf rust disease resistance gene Lr10 from the hexaploid wheat (Triticum aestivum L.) genome. Proc. Natl. Acad. Sci. USA 2003, 100, 15253–15258. [Google Scholar]
  32. Zhao, B.; Li0n, X.; Poland, J.; Trick, H.; Leach, J.; Hulbert, S. A maize resistance gene functions against bacterial streak disease in rice. Proc. Natl. Acad. Sci. USA 2005, 102, 15383–15388. [Google Scholar]
  33. Niu, Z.; Puri, K.; Chao, S.; Jin, Y.; Sun, Y.; Steffenson, B.; Maan, S.; Xu, S.; Zhong, S. Genetic analysis and molecular mapping of crown rust resistance in common wheat. Theor. Appl. Genet. 2014, 127, 609–619. [Google Scholar]
  34. Zhang, H.; Wang, C.; Cheng, Y.; Wang, X.; Li, F.; Han, Q.; Xu, J.; Chen, X.; Huang, L.; Wei, G.; et al. Histological and molecular studies of the non-host interaction between wheat and Uromyces fabae. Planta 2011, 234, 979–991. [Google Scholar]
  35. Xiang, X.; Ning, S.; Jiang, X.; Gong, X.; Zhu, R.; Zhu, L.; Wei, D. Protein extraction from rice (Oryza sativa L.) root for two-dimensional electrophresis. Front. Agric. China 2010, 1, 416–421. [Google Scholar]
  36. Kruger, N.J. The Bradford method for protein quantitation. In The Protein Protocols Handbook, 3rd ed.; Walker, J.M., Ed.; Humana Press: Totowa, NJ, USA, 2009; pp. 17–24. [Google Scholar]
  37. Shevchenko, A.; Wilm, M.; Vorm, O.; Mann, M. Mass spectrometric sequencing of proteins from silver-stained polyacrylamide gels. Anal. Chem. 1996, 68, 850–858. [Google Scholar]
  38. Gotz, S.; Garcia-Gomez, J.M.; Terol, J.; Williams, T.D.; Nagaraj, S.H.; Nueda, M.J.; Robles, M.; Talon, M.; Dopazo, J; Conesa, A. High-throughput functional annotation and data mining with the Blast2GO suite. Nucleic Acids Res. 2008, 36, 3420–3435. [Google Scholar]
  39. Livak, K.J.; Schmittgen, T.D. Analysis of relative gene expression data using real-time quantitative PCR and the 2−ΔΔCt Method. Methods 2001, 25, 402–408. [Google Scholar]

