Article

Development of Microsatellite Markers in the Branched Broomrape Phelipanche ramosa L. (Pomel) and Evidence for Host-Associated Genetic Divergence

by
Valérie Le Corre
1,*,
Carole Reibel
2 and
Stéphanie Gibot-Leclerc
2
1
INRA, UMR1347 Agroécologie, Dijon F-21000, France
2
Agrosup-Dijon, UMR1347 Agroécologie, Dijon F-21000, France
*
Author to whom correspondence should be addressed.
Int. J. Mol. Sci. 2014, 15(1), 994-1002; https://doi.org/10.3390/ijms15010994
Submission received: 21 November 2013 / Revised: 7 January 2014 / Accepted: 8 January 2014 / Published: 13 January 2014
(This article belongs to the Section Biochemistry)

Abstract

:
Phelipanche ramosa is a parasitic plant that infects numerous crops worldwide. In Western Europe it recently expanded to a new host crop, oilseed rape, in which it can cause severe yield losses. We developed 13 microsatellite markers for P. ramosa using next-generation 454 sequencing data. The polymorphism at each locus was assessed in a sample of 96 individuals collected in France within 6 fields cultivated with tobacco, hemp or oilseed rape. Two loci were monomorphic. At the other 11 loci, the number of alleles and the expected heterozygosity ranged from 3 to 6 and from 0.31 to 0.60, respectively. Genetic diversity within each cultivated field was very low. The host crop from which individuals were collected was the key factor structuring genetic variation. Individuals collected on oilseed rape were strongly differentiated from individuals collected on hemp or tobacco, which suggests that P. ramosa infecting oilseed rape forms a genetically diverged race. The microsatellites we developed will be useful for population genetics studies and for elucidating host-associated genetic divergence in P. ramosa.

Graphical Abstract

1. Introduction

Among flowering plants, approximately 3000 species (1%) are parasitic. These parasitic plants form a close connection with the vascular system of their host plant through a specialized organ, the haustorium, through which they remove water, mineral salts, and carbon elements [1,2]. Broomrapes are chlorophyll-lacking, obligate root parasitic plants. Among broomrapes, branched broomrape, Phelipanche ramosa (L.) Pomel (syn. Orobanche ramosa L. Pomel), is the most widespread species. It occurs throughout the South-East of Europe, West Asia and North Africa and was accidentally introduced in several other parts of the worlds (e.g., in Australia, the USA and Chile). It is a noxious weed that infects numerous crops, among which tobacco, tomato and hemp, particularly in countries surrounding the Mediterranean basin and in Central Europe [3,4]. From the 1980s, infections have been identified on a new host crop: oilseed rape, in several European countries such as Bulgaria, France, Italy and Spain [3,5]. In western France, a massive extension of P. ramosa to oilseed rape fields has been observed since the beginning of the 1990s [6,7], causing heavy yield losses. This crop has now become the primary host for the parasite, along with tobacco, hemp and buckwheat [5,8].
Investigations of the extent of genetic variation in P. ramosa have been fairly limited up to now. All previous studies used dominant markers, either RAPD [8,9], ISSR [5] or AFLP [10]. Their results suggested the existence of two or three diverged genetic groups among populations of P. ramosa, which might be associated with host specificity. Among the molecular markers available to study genetic variation in natural plant populations, microsatellites or SSRs (simple sequence repeats) are especially valuable because of their high reproducibility, high degree of polymorphism and codominant inheritance. Despite the economic importance of broomrapes, up to now SSRs have been developed for only one species, the sunflower broomrape Orobanche cumana [11]. Here, we report the development of microsatellite markers for P. ramosa and investigate whether these markers reveal some genetic divergence in relation with the host crop, and especially with the ability to infect oilseed rape.

2. Results and Discussion

2.1. Development of Microsatellite Markers

The 454-sequencing data retrieved from the Sequence Read Archive (SRA) contained a total of 1,516,538 reads, with an average read length of 563 bp. After quality filtering, we retained a reduced set of 172,364 reads (11%), with a mean length of 395 bp (range: 250–483 bp). After discarding sequences without microsatellite motifs using the QDD software, the remaining sequences were filtered for redundancy and multiple copies in the sequence data set. In total, 2091 microsatellite loci were identified, and automated primer design was successful for 425 loci.
We selected 63 primers pairs with highest quality based on a low self-end complementarity and high end-stability of the primers. PCR amplification was assayed using 6 DNA samples. After these initial PCR assays, 13 microsatellites markers reliably yielding a single PCR product were retained. Based on Sanger sequencing, these markers were all confirmed to contain the expected microsatellite motif.

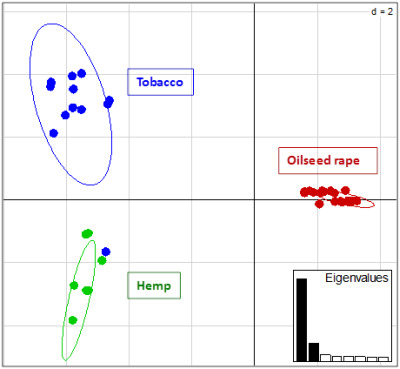
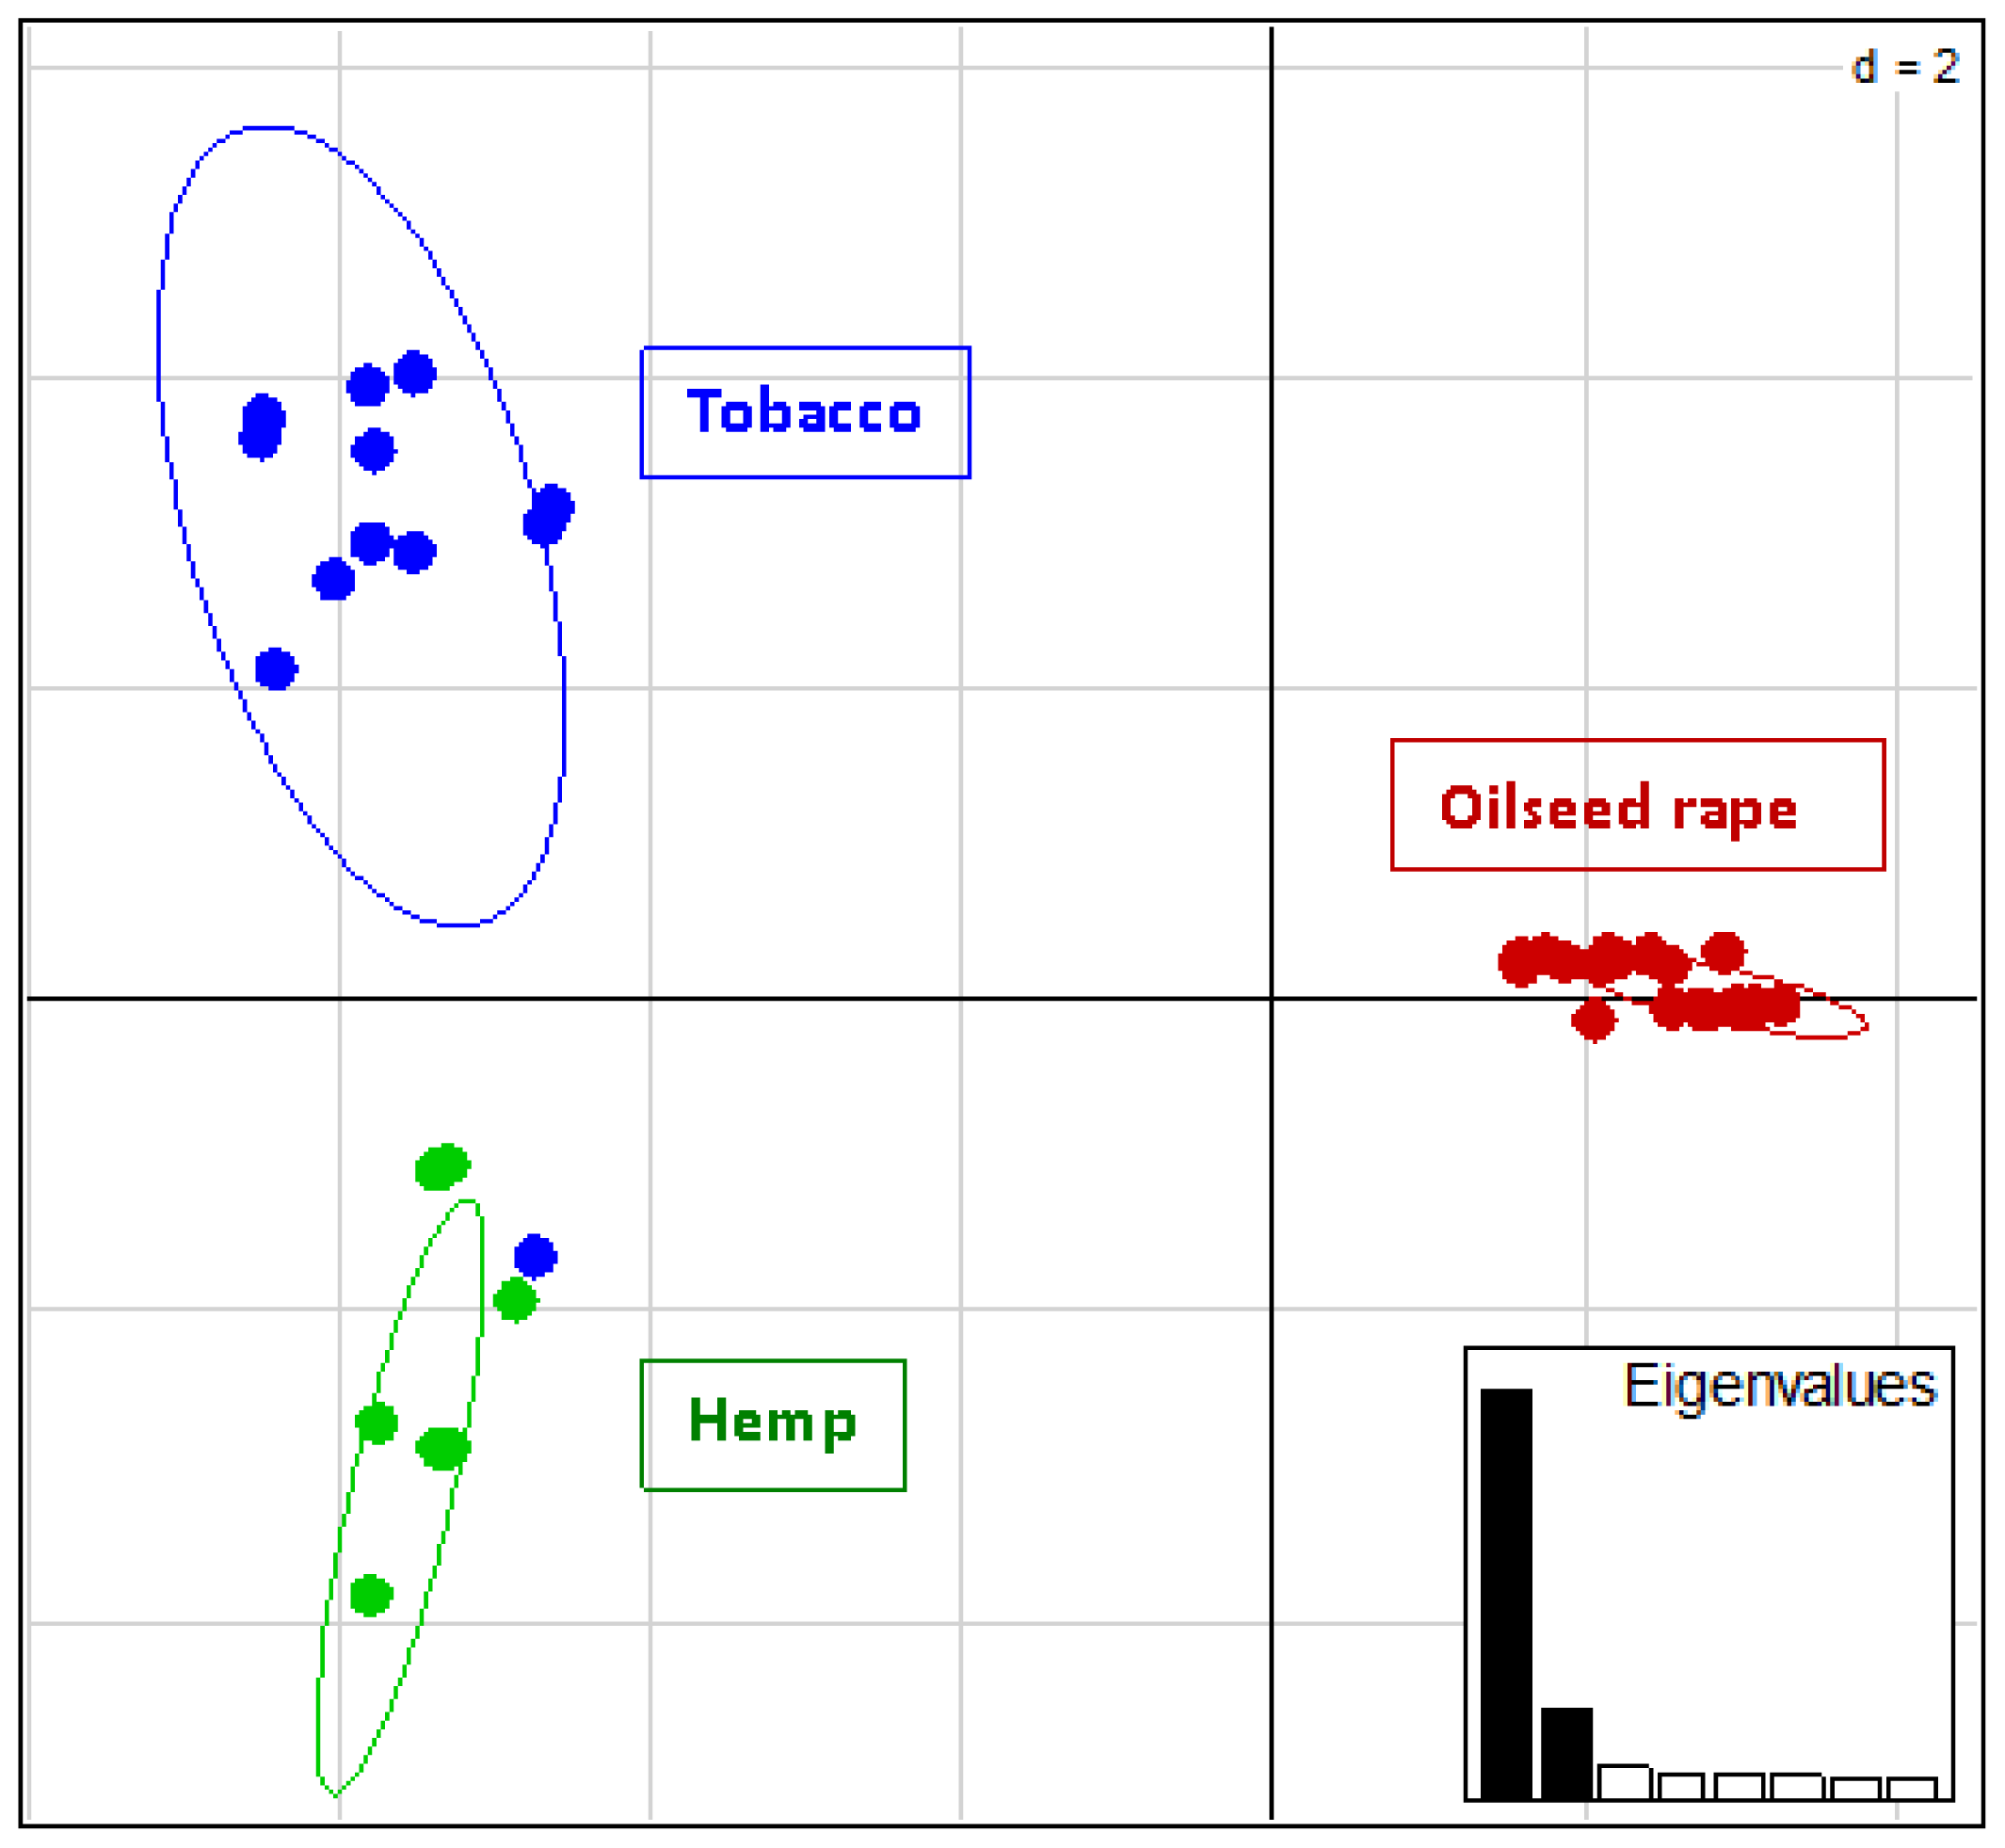
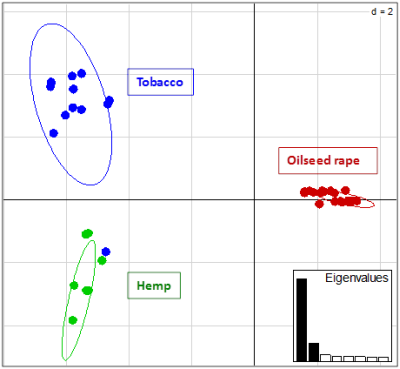
2.2. Genotyping and Population Genetics Analysis

Polymorphism at each of the 13 developed microsatellites was determined using 96 P. ramosa individuals from six populations. Among the 13 loci, 2 were found to be monomorphic (Table 1). As the samples considered here were all collected in France, and therefore only represent a small subset of the wide distribution area of P. ramosa, it is possible that these 2 microsatellite markers would be found polymorphic using a geographically enlarged sampling scheme. Therefore we consider them as potentially useful for future studies of the genetic variation in P. ramosa. For the remaining eleven markers, the number of alleles per locus ranged from two to six, the observed heterozygosity (Ho) ranged from 0.000 to 0.025 and the expected heterozygosity (He) ranged from 0.308 to 0.601 (Table 1). The observed heterozygosity over all loci and plants was very low (0.003), and the overall mean value of the inbreeding coefficient Fis was 0.863. These figures are well in agreement with the assumption that P. ramosa is a self-fertile species with a very high rate of selfing [3].
Genetic variation within each of the studied populations was very low: in each population, only one, two or three markers among the eleven ones were polymorphic (Table 2). Moreover, for each microsatellite that was polymorphic within a population, the frequency of the most frequent allele was always high (between 0.594 and 0.969, mean = 0.855) and minor alleles generally differed from the most frequent allele by a small number of repeat motifs.
The host crop from which the populations were collected was the key factor structuring the genetic variation at microsatellites. The four populations collected from oilseed rape fields shared the same fixed or major alleles at all loci (Table 2). At six loci (Phera14, Phera18, Phera20, Phera40, Phera46 and Phera53), the two populations collected on tobacco and hemp shared a same allele, which was different from alleles found in the four populations collected on oilseed rape. At locus Phera19, two alleles were present, one that characterized the tobacco population and one that was shared between the hemp population and the four oilseed rape populations. At the other loci, three distinct major alleles characterized each of the three host crops.
Polymorphic microsatellites displayed 8 different multilocus genotypes in the population collected on tobacco, four multilocus genotypes in the population collected on hemp and five multilocus genotypes in the four populations collected on oilseed rape. None of those multilocus genotypes was shared between different host crops. In tobacco, two genotypes were predominant (frequencies of 0.36 and 0.21), while one single genotype was predominant in hemp (frequency 0.79), and one single genotype was also predominant in oilseed rape (frequency 0.82). Finally, a multivariate analysis of the genetic variation at the eleven polymorphic microsatellites perfectly distinguished among P. ramosa individuals collected on different host crops (Figure 1). The first principal component accounted for 56% of the variation and differentiated individuals collected on oilseed rape from all other individuals, while the second principal component accounted for 12% of the variation and differentiated individuals collected on tobacco from those collected on hemp, at the exception of one individual collected on tobacco that seemed to be a hybrid between these two genetic groups.
Geographic effects might have contributed to the genetic structure observed. However, this seemed unlikely here. Population PO (hemp) was localized in the north-east of France, more than 400 km away from the other five populations, which were all localized in the same area (West of France), at less than 50 km from one another (Table 3). Thus geographic structure did not match with genetic structure.

3. Experimental Section

3.1. Plant Material and DNA Extraction

Parasite seeds were collected from French natural populations of P. ramosa that had severely infected hemp, oilseed rape and tobacco fields in 2001 and 2002. The plants sampled were distributed throughout each cultivated field. Geographic origins of the populations are shown in Table 3. The total genomic DNA of 96 individuals (16 from each of the six populations) was extracted using a rapid method based on incubation at high temperature in a TrisHCl-EDTA buffer [12].

3.2. Isolation of Microsatellite Markers

Raw sequence data for the P. ramosa genome was retrieved from the NCBI Sequence Read Archive ( http://www.ncbi.nlm.nih.gov/sra). The experiment was reported in [13]. It consisted in one run of sequencing on one GS Titanium PicoTiterPlate on a 454 Genome Sequencer (Roche Diagnostics, Indianapolis, IN, USA), using the recommended standard protocols and chemistry.
After converting raw sequence data to the fastq format, quality control and filtering was performed using the PRINSEQ web ( http://edwards.sdsu.edu/prinseq) [14]. Briefly, read ends were first trimmed by quality scores, after which only sequences longer than 250 bp, having a mean Phred quality score higher than 35% and less than 1% Ns were retained. Exact sequence duplicates were removed.
Microsatellites were identified by running the QDD pipe-line [15] using the following criteria: a minimum of eight repeats for dinucleotide motifs, six repeats for trinucleotide motifs and five repeats for tetranucleotide motifs and a minimum length of 100 pb for the PCR product. Primer sequences generated by QDD were checked for end stability, self-complementarity and complementarity between primers in a same pair to avoid the formation of primer dimers.

3.3. DNA Amplification and Genotyping

PCR amplification was first assayed on a subsample of 6 individuals. PCR amplifications were performed using a Mastercycler (Eppendorf, Hamburg, Germany) thermocycler, in a 20 μL reaction mix containing 70 mM Tris-HCL, 2 mM MgCl2, 17 mM (NH4)2SO4, 10 mM β-mercaptoethanol, 0.05% (w/v) polyoxyethylene-ether W1, 0.2 mg/mL bovine serum albumin, 200 mM of each dNTP, 10 ng genomic DNA, 0.5 units of Taq DNA polymerase, and 0.2 μM each of reverse and forward primers. The PCR program used consisted of 5 min at 95 °C, followed by 37 cycles of 5 s at 95 °C, 10 s at 60 °C and 30 s at 72 °C. Amplicons were visualised under UV light by electrophoresis on a 3% (w/v) agarose gel stained with ethidium bromide. When a single, intense amplicon was obtained from all 6 plants, it was sequenced on both strands to confirm the presence of the expected microsatellite motif.
For genotyping, the DNA extracts of all plants were diluted 50-fold prior to genotyping with fluorescent dye-labelled markers (6-FAM, NED, VIC, PET). PCR products were assayed on an ABI 3730XL sequencer (Applied Biosystems, Foster City, CA, USA) using GeneScan 500 LIZ dye size standard (Applied Biosystems). Amplicon sizes were analyzed with the software Peak Scanner 1.0 (Applied Biosystems).

3.4. Data Analysis

The number of alleles (Na) per locus, observed heterozygosity (Ho), expected heterozygosity (He), and inbreeding coefficient (Fis) were estimated using GenAlex 6.5 [16]. Overall and per-population values were calculated. To summarize the genetic variation among individuals, a multivariate analysis was performed via Principal Component Analysis, using the R package adegenet [17].

4. Conclusions

We report the development and characterization of 13 microsatellites markers in the branched broomrape, Phelipanche ramosa. Eleven out of the 13 markers were polymorphic on a set of 96 individuals of P. ramosa sampled in France. The level of polymorphism was low, especially within populations. This low level of variation may be explained by a high selfing rate in this species and possibly by bottlenecks associated with founding events for the studied populations. Genetic variation was strongly structured by the three host crops on which individuals were collected: tobacco, hemp and oilseed rape. Our results suggest that P. ramosa infecting oilseed rape in France belong to a recently evolved but highly genetically divergent host race. Analyzing more populations collected from different hosts will be necessary to confirm this. The microsatellites developed here will be useful for future population genetics studies in P. ramosa and for elucidating the presence of genetically diverged host races.

Acknowledgments

The present work was financed by AgroSup Dijon (ARS O129). We thank Charles Poncet and his team from the platform Gentyane at INRA Clermont-Ferrand for performing microsatellite genotyping.

Conflicts of Interest

The authors declare no conflict of interest.

References

  1. Parker, C.; Riches, C.R. Parasitic Weeds of the World: Biology and Control; CAB International: Wallingford, UK, 1993; p. 332. [Google Scholar]
  2. Press, M.C.; Graves, J.D. Parasitic Plants; Chapman and Hall: London, UK, 1995. [Google Scholar]
  3. Parker, C. Observations on the current status of Orobanche and Striga problems worldwide. Pest Manag. Sci 2009, 65, 453–459. [Google Scholar]
  4. Press, M.C.; Phoenix, G.K. Impacts of parasitic plants on natural communities. New Phytol 2005, 166, 737–751. [Google Scholar]
  5. Benharrat, H.; Boulet, C.; Theodet, C.; Thalouarn, P. Virulence diversity among branched broomrape (O. ramosa L.) populations in France. Agron. Sustain. Dev 2005, 25, 123–128. [Google Scholar]
  6. Gibot-Leclerc, S.; Brault, M.; Pinochet, X.; Sallé, G. Potential role of winter rape weeds in the extension of broomrape in Poitou-Charentes. C. R. Biol 2003, 326, 645–658. [Google Scholar]
  7. Gibot-Leclerc, S.; Sallé, G.; Reboud, X.; Moreau, D. What are the traits to Phelipanche ramosa (L.) Pomel that contribute to the success of its biological cycle on its host Brassica napus L.? Flora 2012, 207, 512–521. [Google Scholar]
  8. Brault, M.; Betsou, F.; Jeune, B.; Tuquet, C.; Sallé, G. Variability of Orobanche ramosa populations in France as revealed by cross infestations and molecular markers. Environ. Exp. Bot 2007, 67, 271–280. [Google Scholar]
  9. Roman, B.; Alfaro, C.; Torres, A.M.; Moreno, M.T.; Satovic, S.; Pujadas, A.; Rubiales, D. Genetic relationships among Orobanche species as revealed by RAPD analysis. Ann. Bot 2003, 91, 637–642. [Google Scholar]
  10. Vaz-Patto, M.C.; Fernandez-Aparicio, M.; Satovic, Z.; Rubiales, D. Extent and pattern of genetic differentiation within and between European populations of Phelipanche ramosa revealed by amplified fragment length polymorphism analysis. Weed Res 2009, 49, 48–55. [Google Scholar]
  11. Pineda-Martos, R.; Velasco, L.; Fernandez-Escobar, J.; Fernandez-Martinez, J.M.; Perez-Vich, B. Genetic diversity of Orobanche cumana populations from Spain assessed using SSR markers. Weed Res 2013, 53, 279–289. [Google Scholar]
  12. Délye, C.; Boucansaud, K.; Pernin, F.; le Corre, V. Variation in the gene encoding acetolactate-synthase in Lolium species and proactive detection of mutant, herbicide-resistant alleles. Weed Res 2009, 49, 326–336. [Google Scholar]
  13. Piednöel, M.; Aberer, I.J.; Schneeweiss, G.M.; Macas, J.; Novak, P.; Heidrun, G.; Tench, E.M.; Renner, S.S. Next-generation sequencing reveals the impact of repetitive DNA across phylogenetically closely related genomes of Orobanchaceae. Mol. Biol. Evol 2012, 29, 3601–3611. [Google Scholar]
  14. Schmieder, R.; Edwards, R. Quality control and preprocessing of metagenomic datasets. Bioinformatics 2011, 27, 863–864. [Google Scholar]
  15. Meglécz, E.; Costedoat, C.; Dubut, V.; Gilles, A.; Malausa, T.; Pech, N.; Martin, J.F. QDD: A user-friendly program to select microsatellite markers and design primers from large sequencing projects. Bioinformatics 2010, 26, 403–404. [Google Scholar]
  16. Peakall, R.; Smouse, P.E. GenAlEx 6.5: Genetic analysis in excel: Population genetic software for teaching and research—An update. Bioinformatics 2012, 28, 2537–2539. [Google Scholar]
  17. Jombart, T. Adegenet: A R package for the multivariate analysis of genetic markers. Bioinformatics 2008, 24, 1403–1405. [Google Scholar]
Figure 1. Genetic variation detected at eleven polymorphic microsatellites in 96 P. ramosa individuals sampled from six populations: projection of individual data on the first and second axes of a Principal Component Analysis. The host crops on which individuals were collected are represented as different colors.
Ijms 15 00994f1
Table 1. The set of 13 microsatellite markers developed in P. ramosa: locus name, repeat motif, primer sequences, annealing temperature (Ta), allele size range, number of alleles (Na), observed (Ho) and expected (He) heterozygosities and GenBank accession number.
LocusRepeat motifPrimer sequences (5′-3′)Ta (°C)Size range (bp)NaHoHeGenBank accession No.
Phera02(AT)4T(AT)15F: CTCACACCCGGACAAAGTTC
R: GGTCAATCCAGACTCGCTTC
60118–14350.0130.542SRR364824.1090
Phera10(AT)12F: CCACATCAGCAACAATAGCAA
R: CATGATCTTTGATAGGCACGA
60116–14460.0110.522SRR364824.897002
Phera14(CTT)12F: ATGGGAACGTCTTATGGCAC
R: GTGGATCCCATGGTCTTTTG
60330–33620.0000.442SRR364824.865553
Phera18(GAT)10F: TGGTGAAGAAACGAACAATCA
R: CATTCTCCACATTTTCCGCT
60122–13120.0000.481SRR364824.939350
Phera19(ACC)9F: AGCAGTTACGGAACCACCAC
R: CAGTTTCACGGGGAGAATGT
60140–14320.0000.308SRR364824.843255
Phera20(ATT)9F: TCACAATACGCTCCAAGCTG
R: GAGTTCACGTTGTGGGCTTT
60134–15920.0000.484SRR364824.981601
Phera28(AT)5A(AT)9F: TGCGTCTGTTCTCTCAACGA
R:CGGAAAGGAAGGTTCTTATTTG
60195–19720.0000.432SRR364824.879658
Phera38(AT)11F: TCAGGTGAAGTGTTGCAATTAT
R: GCCTTTCTTGTTCCTTGTCG
60243–26160.0000.601SRR364824.320858
Phera40(AC)11F: CATCTGAGGTGCACATTACGTC
R: TTTGTCATTGCTTCGTGGAG
60199–20320.0000.442SRR364824.873170
Phera46(CAT)8(CAA)(CAT)3F: GTCACTTGTCCCAACATCCC
R: TCTCGCCTCGCTGATAAAAT
60237–25830.0000.446SRR364824.286970
Phera47(ACC)8F: GCATCAGCATCAGAAGACGA
R: GGTGGTTGGTAGTTGGTTGG
6013910.0000.000SRR364824.375211
Phera53(ATC)2(ATT)(ATC)8F: CAACATCAGCGTCAACCATC
R: GATCACCGACTGATGGAGGT
60128–13430.0110.449SRR364824.227061
Phera59(TTA)7F: CGTTGGCCTTAAATCGCTAC
R: TTGGTTTTGTGTGTGGAGGA
6030410.0000.000SRR364824.1022037
Table 2. Genetic variation at 11 polymorphic microsatellites in six populations of P. ramosa. The crop from which each population was sampled is indicated within parentheses.
PR (Tobacco)PO (Hemp)GI (Oilseed rape)


LocusNaAllele sizesHoHeNaAllele sizesHoHeNaAllele sizesHoHe


Phera023131/135/1370.0000.3383135/137/1430.0710.19611180.0000.000
Phera105136/138/140/142/1440.0630.5922138/1400.0000.21911160.0000.000
Phera1413300.0000.00013300.0000.00013360.0000.000
Phera1811220.0000.00011220.0000.00011310.0000.000
Phera1911400.0000.00011430.0000.00011430.0000.000
Phera2011340.0000.00011340.0000.00011590.0000.000
Phera282195/1970.0000.13311950.0000.00011970.0000.000
Phera3812430.0000.00012470.0000.0002257/2590.0000.142
Phera4012030.0000.00012030.0000.00011990.0000.000
Phera4612370.0000.00012370.0000.00012580.0000.000
Phera5311340.0000.00011340.0000.00011310.0000.000

SJ (Oilseed rape)SA (Oilseed rape)SV (Oilseed rape)


LocusNaAllele sizesHoHeNaAllele sizesHoHeNaAllele sizesHoHe


Phera0211180.0000.00011180.0000.00011180.0000.000
Phera1011160.0000.00011160.0000.00011160.0000.000
Phera1413360.0000.00013360.0000.00013360.0000.000
Phera1811310.0000.00011310.0000.00011310.0000.000
Phera1911430.0000.00011430.0000.00011430.0000.000
Phera2011590.0000.00011590.0000.00011590.0000.000
Phera2811970.0000.00011970.0000.00011970.0000.000
Phera382259/2610.0000.2714255/257/259/2610.0000.4592257/2590.0000.133
Phera4011990.0000.00011990.0000.00011990.0000.000
Phera462255/2580.0000.12112580.0000.00012580.0000.000
Phera5311310.0000.00011310.0000.0002128/1310.0630.061
PR, PO, GI, SJ, SA and SV are abbreviated names of the populations (see Table 3); Na: number of alleles; Ho: observed heterozygosity; He: expected heterozygosity.
Table 3. Geographic origins of the six P. ramosa populations used in this study.
NameLocalizationLatitude (N)Longitude (E)Crop
PRPriaires46.143−0.607Tobacco
POPont-sur-Seine48.5193.595Hemp
GIGibourne45.935−0.312Oilseed rape
SJSaint-Jean-d’Angély45.946−0.519Oilseed rape
SASavarit46.1142−0.8302Oilseed rape
SVSavarit46.1142−0.8302Oilseed rape

