Comparative Proteomic Analysis of Puccinellia tenuiflora Leaves under Na2CO3 Stress

Abstract
:1. Introduction
2. Results
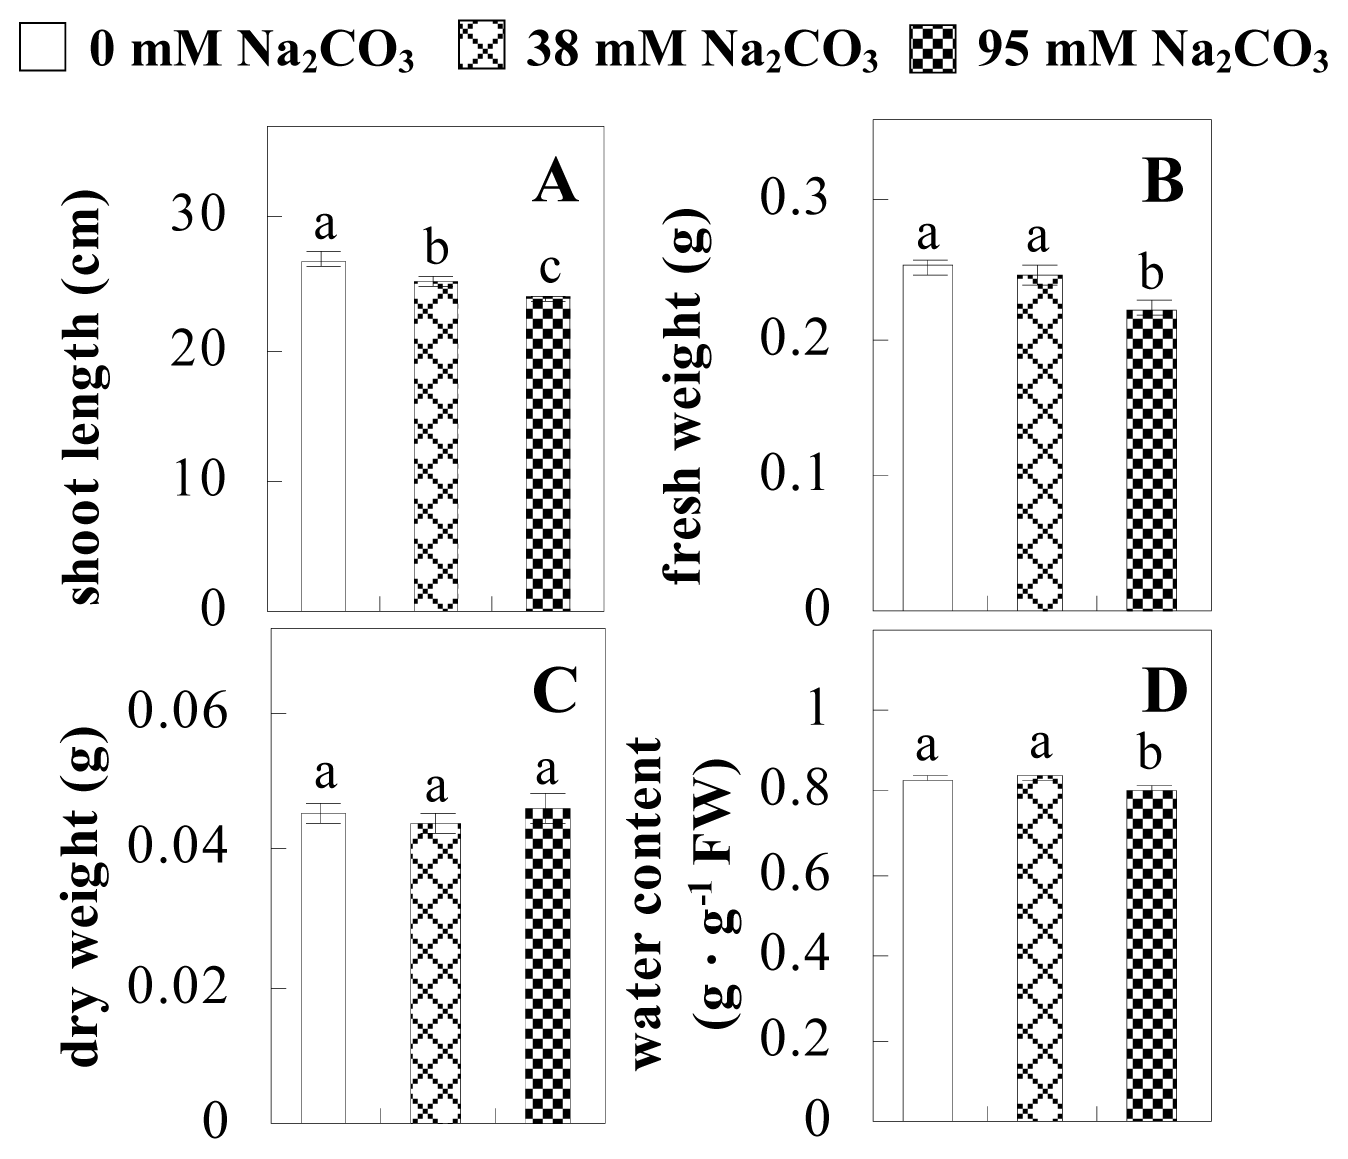
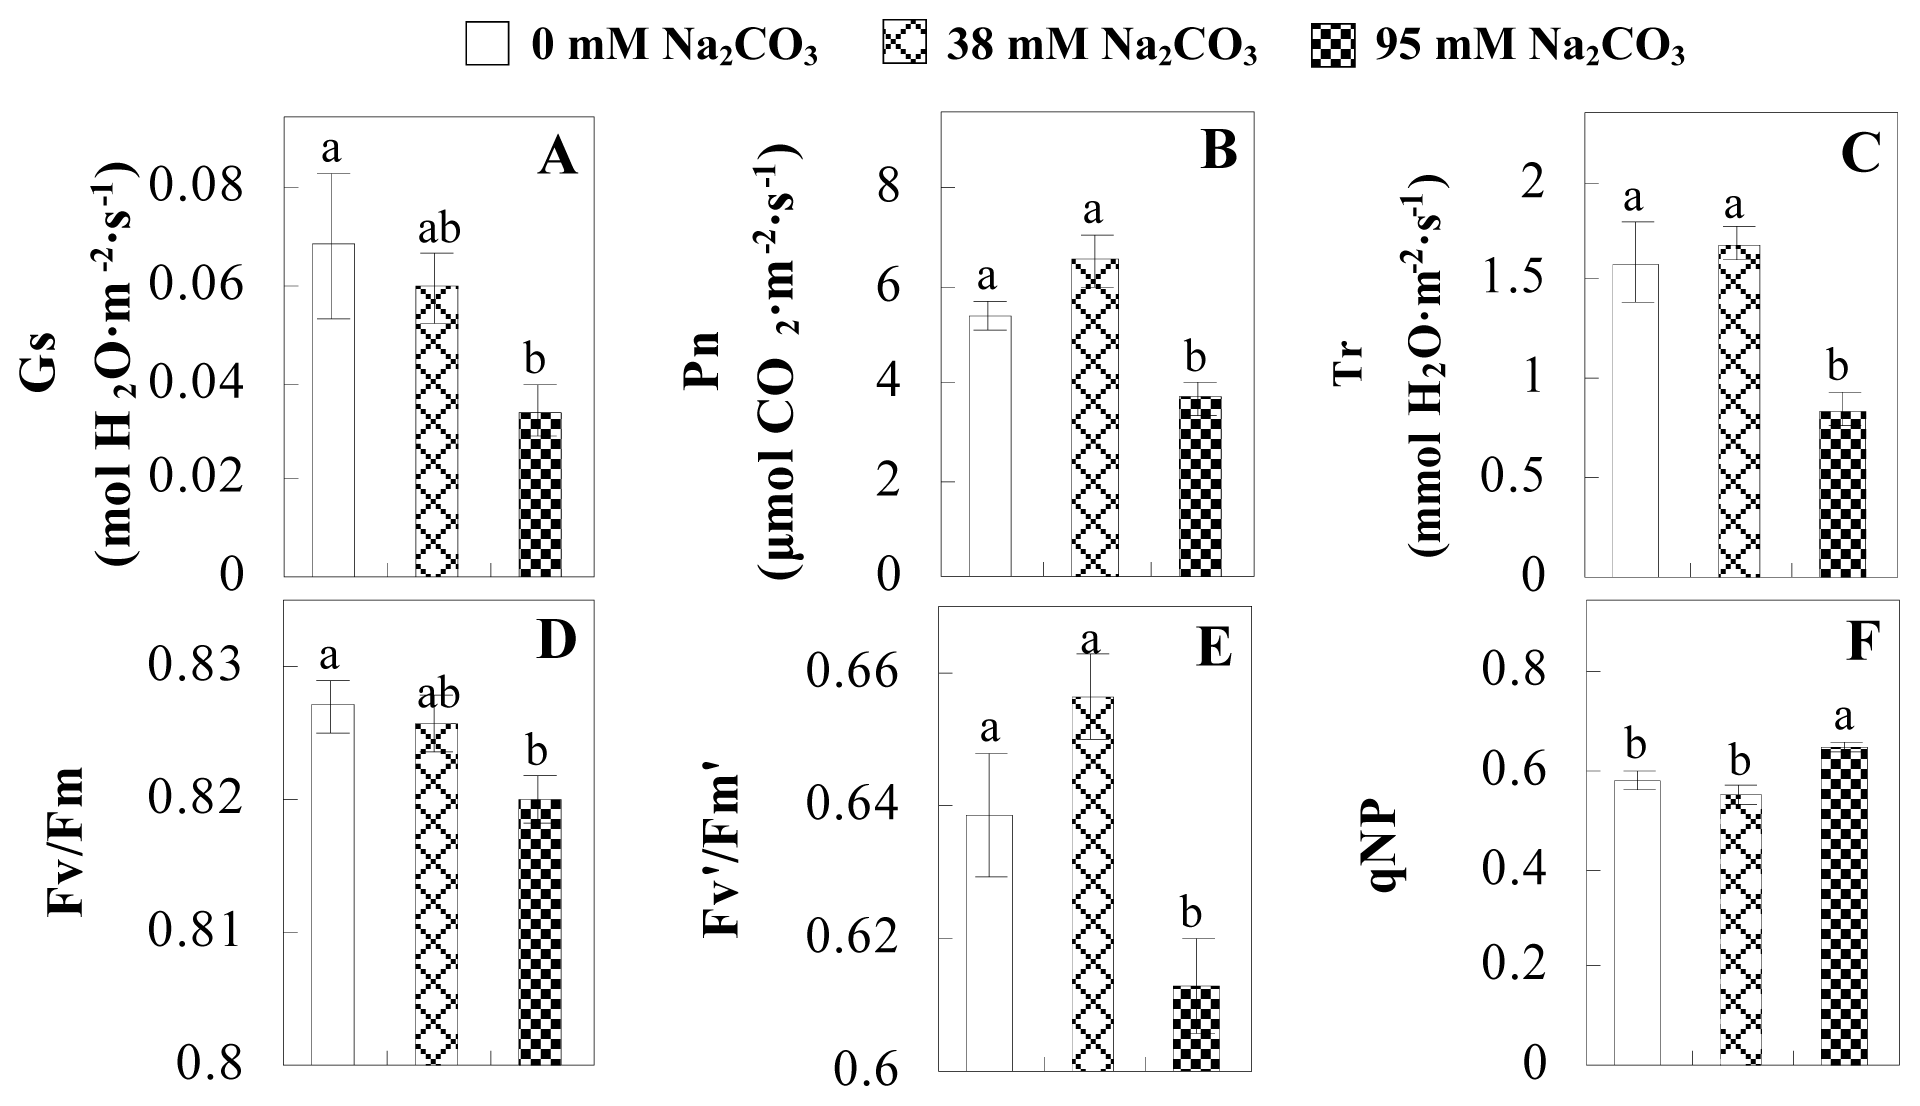
2.1. Effects of Na2CO3 Stress on the Growth and Photosynthesis of P. tenuiflora
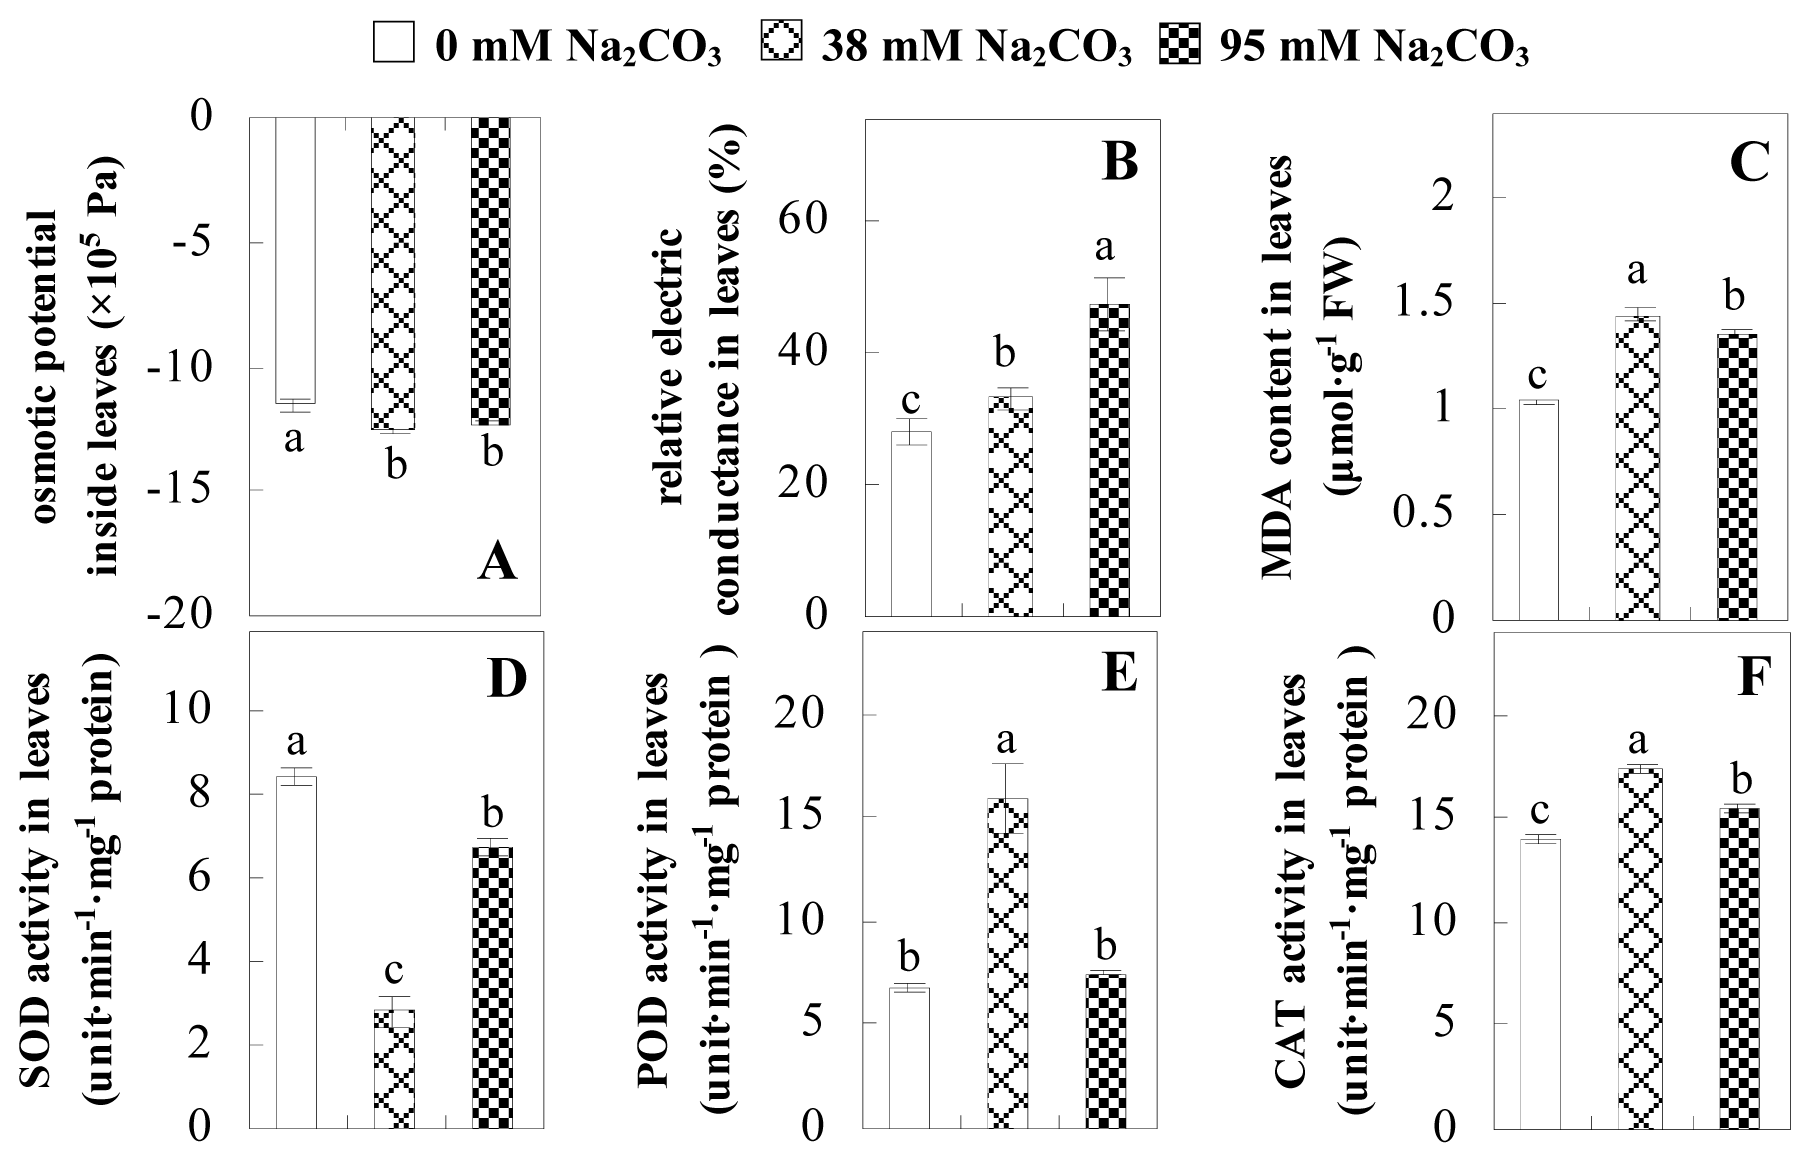
2.2. Changes to Leaf Osmotic Potential, Plasma Membrane Integrity and Antioxidant Enzyme Activities
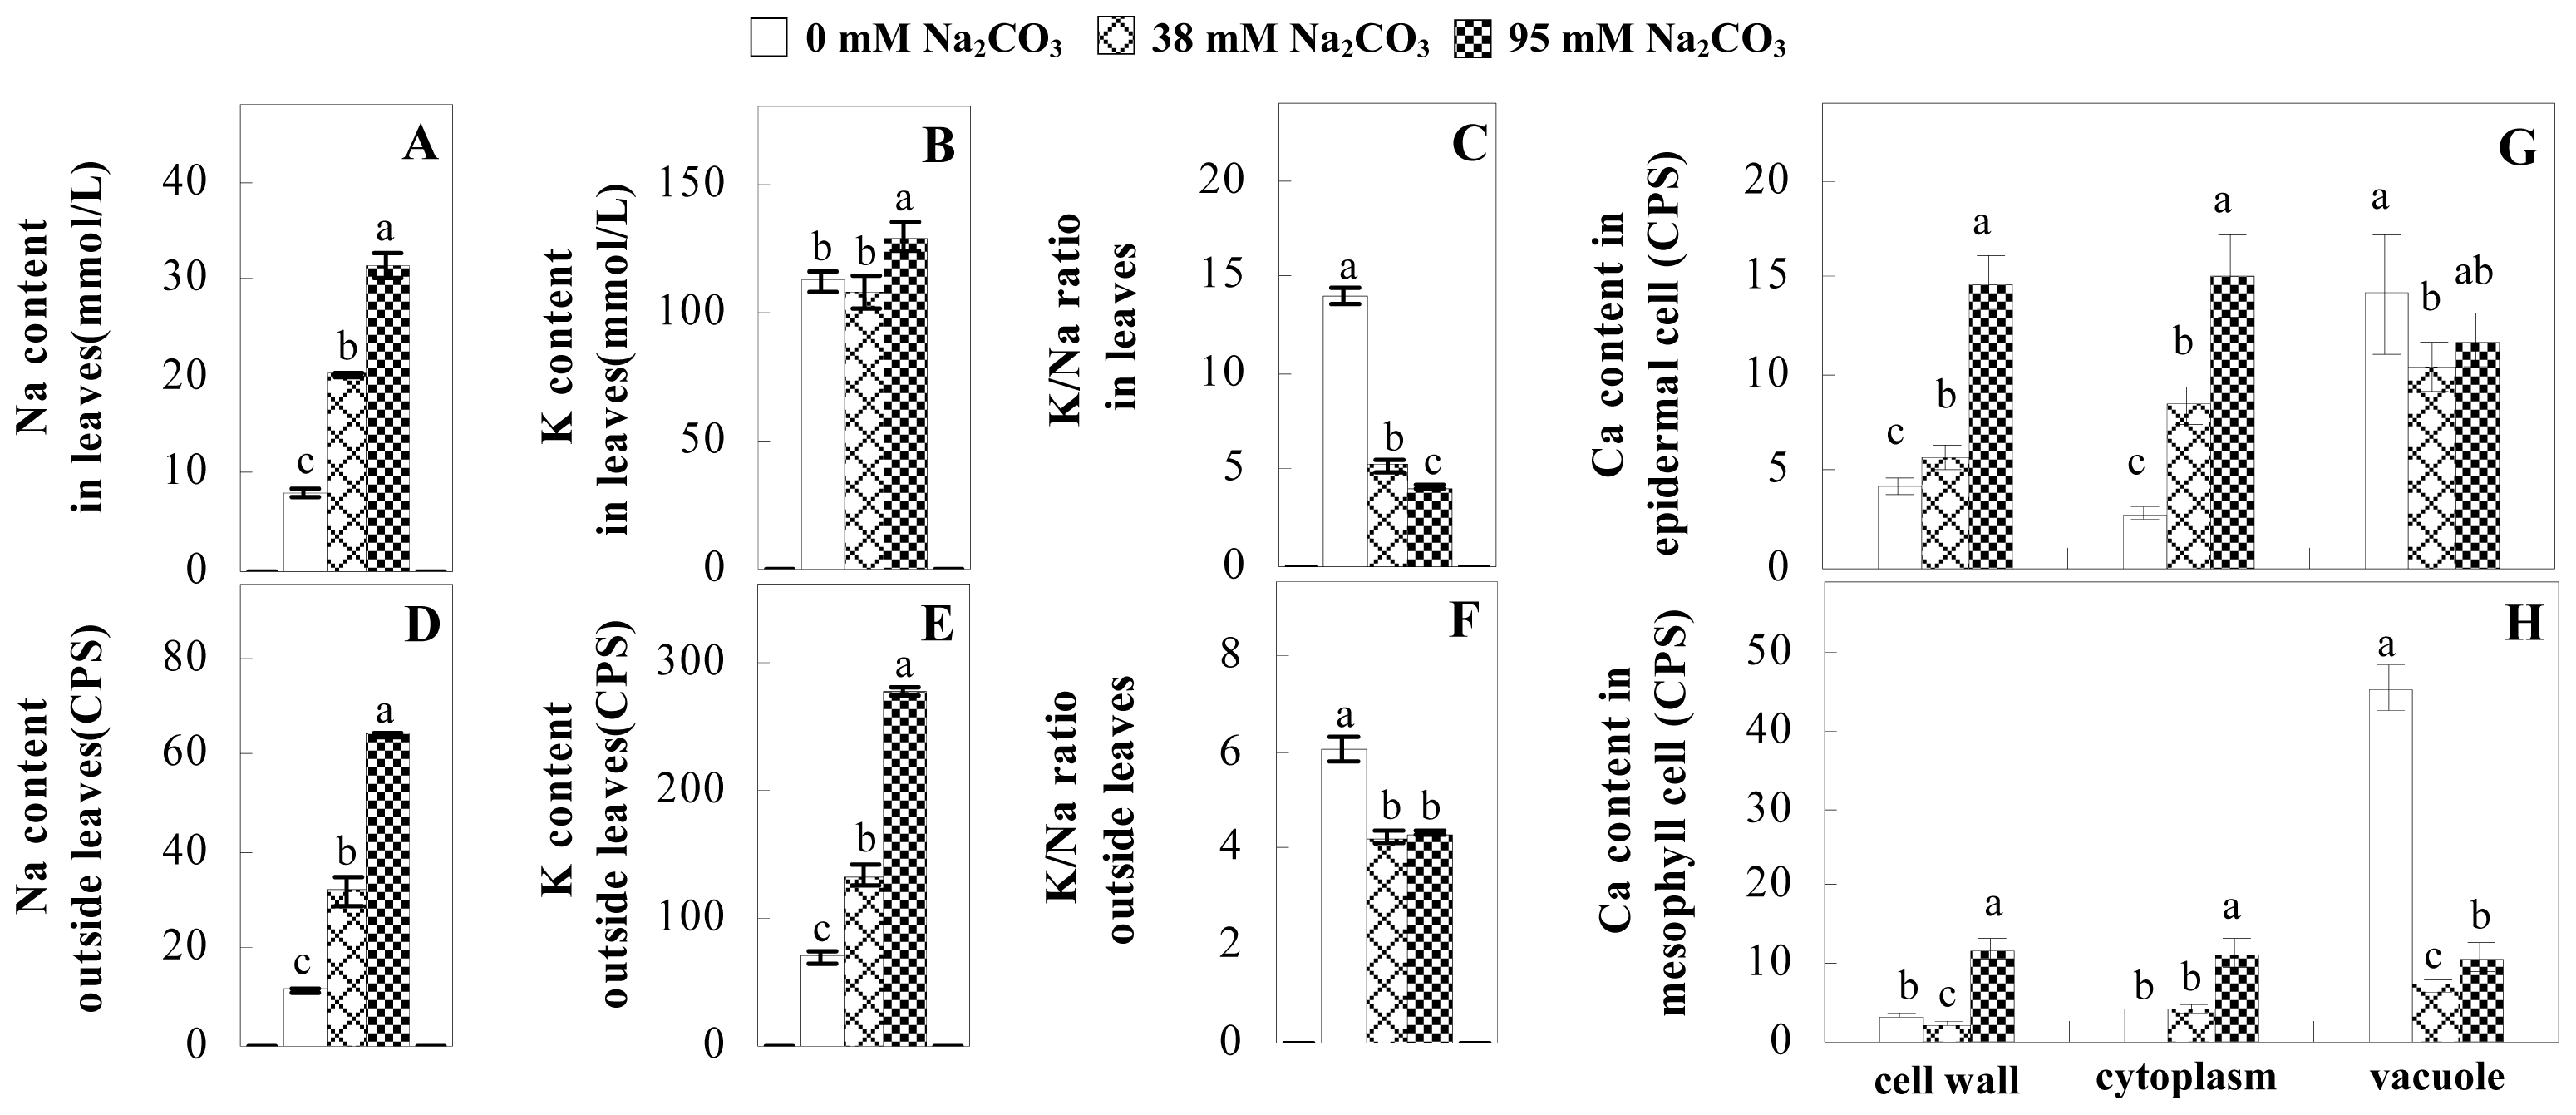
2.3. Ion Content Changes in Leaves under Na2CO3 Stress
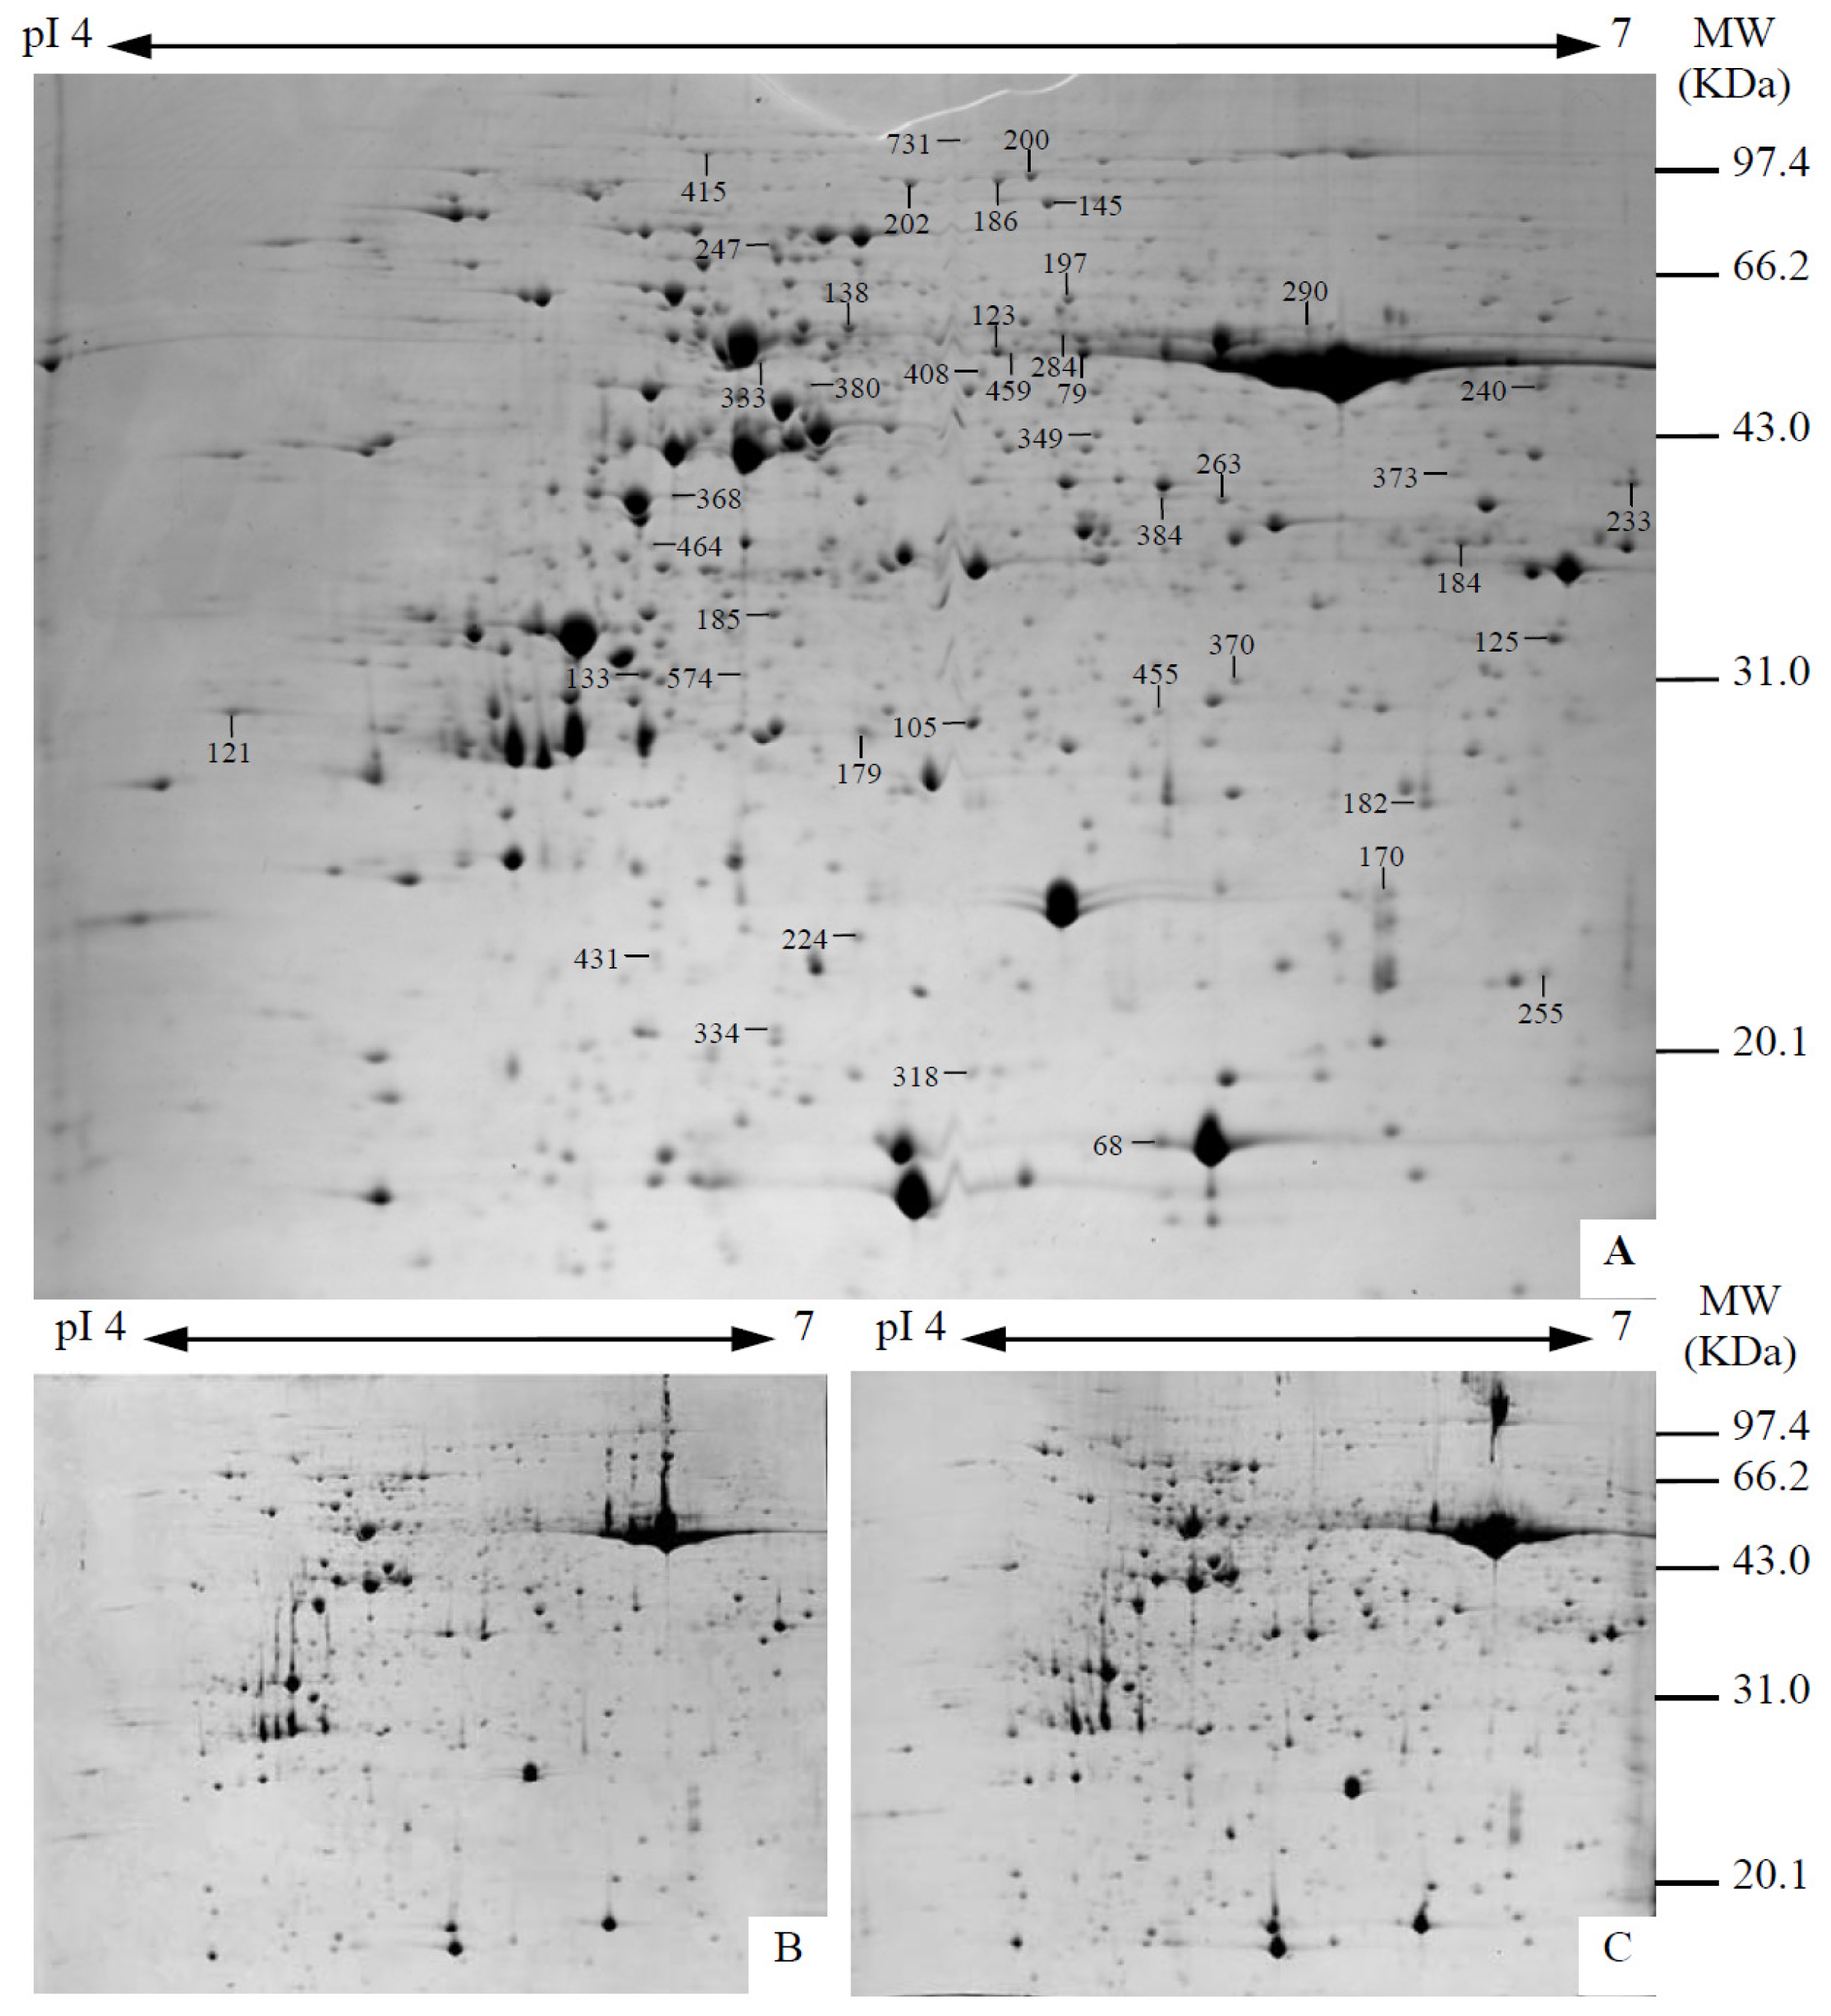
2.4. Identification and Functional Categorization of Na2CO3 Responsive Proteins
2.5. Protein Clustering and the Dynamics of Protein Networks
3. Discussion
3.1. Photosynthesis Is Inhibited by Na2CO3
3.2. Antioxidant Mechanisms in Leaves to Cope with Na2CO3
3.3. Ion Homeostasis and Transport under Na2CO3 Stress
3.4. Enhancement of Energy Supply and Other Specialized Metabolism
4. Experimental Section
4.1. Plant Cultivation and Treatment
4.2. Photosynthesis and Chlorophyll Fluorescence Analysis
4.3. Analysis of Osmotic Potential, Electrolyte Leakage, MDA Content, and Antioxidant Enzymes
4.4. Determination of Ion Content
4.5. Protein Sample Preparation, 2DE, and Image Analysis
4.6. Protein Identification and Database Searching
4.7. Protein Classification and Hierarchical Cluster Analysis
4.8. Statistical Analysis
5. Conclusion
Acknowledgments
Abbreviation
| 6PGDH | 6-phosphogluconate dehydrogenase |
| AAIR | acetohydroxy acid isomeroreductase |
| AIPLP | aluminum-induced protein-like protein |
| ALD | aldolase |
| AST | aspartate aminotransferase |
| ATP ase CF1 | ATP synthase CF1 alpha subunit |
| ATPase 1 | ATP synthase alpha subunit |
| CA | carbonic anhydrase |
| CAT | catalase |
| CPS | counts per second |
| DREPP | developmentally regulated plasma membrane polypeptide |
| FBA | fructose-bisphosphate aldolase |
| FRKs | fructokinases |
| FTR | ferredoxin-thioredoxin reductase |
| Fv/Fm | maximum quantum efficiency of PSII photochemistry |
| Fv′/Fm′ | PSII maximum efficiency |
| GAPDH | glyceraldehyde-3-phosphate dehydrogenase |
| GLO | glyoxalase |
| GLP | germin-like protein 1 |
| Gs | Stomatal conductance |
| IDs | identities |
| IF4A | eukaryotic initiation factor 4A |
| M30 | membrane-associated 30 kDa protein |
| MDA | malondialdehyde |
| MDH | malate dehydrogenase |
| MS | methionine synthase |
| PDI | protein disulfide-isomerase |
| PGK | phosphoglycerate kinase |
| Pn | photosynthetic rate |
| POD | peroxidase |
| PPIase | peptidyl-prolyl cis-trans isomerase |
| PRK | phosphoribulokinase |
| Proteasome α3 | proteasome alpha type 3 |
| PSII | photosystem II |
| qNP | non-photochemical quenching coefficient |
| ROS | reactive oxygen species |
| RP | Ribosomal protein S1-like RNA-binding domain |
| RRM | RNA recognition motif |
| Rubisco LSU | Rubisco large subunit |
| Rubisco SSU | Rubisco small subunit |
| SOD | superoxide dismutase |
| TIL | temperature stress-induced lipocalin |
| TIM | triosephosphate isomerase |
| Tr | transpiration rate |
| V-ATPase | vacuolar-type H; +-ATPase |
References
- Munns, R.; Tester, M. Mechanisms of salinity tolerance. Annu. Rev. Plant Biol 2008, 59, 651–681. [Google Scholar]
- Parida, A.K.; Das, A.B. Salt tolerance and salinity effects on plants: A review. Ecotoxicol. Environ. Saf 2005, 60, 324–349. [Google Scholar]
- Tuteja, N. Mechanisms of high salinity tolerance in plants. Methods Enzymol 2007, 428, 419–438. [Google Scholar]
- Yang, C.; Chong, J.; Li, C.; Kim, C.; Shi, D.; Wang, D. Osmotic adjustment and ion balance traits of an alkali resistant halophyte Kochia sieversiana during adaptation to salt and alkali conditions. Plant Soil 2007, 294, 263–276. [Google Scholar]
- Yang, C.; Shi, D.; Wang, D. Comparative effects of salt and alkali stresses on growth, osmotic adjustment and ionic balance of an alkali-resistant halophyte Suaeda glauca (Bge.). Plant Growth Regul 2008, 56, 179–190. [Google Scholar]
- Yu, J.; Chen, S.; Zhao, Q.; Wang, T.; Yang, C.; Diaz, C.; Sun, G.; Dai, S. Physiological and proteomic analysis of salinity tolerance in Puccinellia tenuiflora. J. Proteome Res 2011, 10, 3852–3870. [Google Scholar]
- Peng, Y.H.; Zhu, Y.F.; Mao, Y.Q.; Wang, S.M.; Su, W.A.; Tang, Z.C. Alkali grass resists salt stress through high K+ and an endodermis barrier to Na+. J. Exp. Bot 2004, 55, 939–949. [Google Scholar]
- Wang, C.M.; Zhang, J.L.; Liu, X.S.; Li, Z.; Wu, G.Q.; Cai, J.Y.; Flowers, T.J.; Wang, S.M. Puccinellia tenuiflora maintains a low Na+ level under salinity by limiting unidirectional Na+ influx resulting in a high selectivity for K+ over Na+. Plant Cell Environ 2009, 32, 486–496. [Google Scholar]
- Guo, L.; Shi, D.; Wang, D. The key physiological response to alkali stress by the alkali-resistant halophyte Puccinellia tenuiflora is the accumulation of large quantities of organic acids and into the rhyzosphere. J. Agron. Crop Sci 2010, 196, 123–135. [Google Scholar]
- Sun, G.R.; Peng, Y.Z.; Shao, H.B.; Chu, L.Y.; Zhao, X.N.; Min, H.Y.; Cao, W.Z.; Wei, C.X. Does Puccinelia tenuiflora have the ability of salt exudation? Colloid Surf. B 2005, 46, 197–203. [Google Scholar]
- Shi, D.C.; Yin, S.J.; Yang, G.H.; Zhao, K.F. Citric acid accumulation in an alkali-tolerant plant Puccinellia tenuiflora under alkaline stress. Acta Bot. Sin 2002, 44, 537–540. [Google Scholar]
- Wang, Y.X.; Sun, G.R.; Suo, B.; Chen, G.; Wang, J.B.; Yan, Y. Effects of Na2CO3 and NaCl stresses on the antioxidant enzymes of chloroplasts and chlorophyll fluorescence parameters of leaves of Puccinellia tenuiflora (Turcz.) scribn.et Merr. Acta Physiol. Plant 2008, 30, 143–150. [Google Scholar]
- Zhang, C.Q.; Nishiuchi, S.; Liu, S.K.; Takano, T. Characterization of two plasma membrane protein 3 genes (PutPMP3) from the alkali grass, Puccinellia tenuiflora, and functional comparison of the rice homologues, OsLti6a/b from rice. BMB Rep 2008, 41, 448–454. [Google Scholar]
- Ardie, S.W.; Xie, L.; Takahashi, R.; Liu, S.; Takano, T. Cloning of a high-affinity K+ transporter gene PutHKT2;1 from Puccinellia tenuiflora and its functional comparison with OsHKT2;1 from rice in yeast and Arabidopsis. J. Exp. Bot 2009, 60, 3491–3502. [Google Scholar]
- Ardie, S.W.; Liu, S.; Takano, T. Expression of the AKT1-type K+ channel gene from Puccinellia tenuiflora, PutAKT1, enhances salt tolerance in Arabidopsis. Plant Cell Rep 2010, 29, 865–874. [Google Scholar]
- Ardie, S.W.; Nishiuchi, S.; Liu, S.; Takano, T. Ectopic expression of the K+ channel beta subunits from Puccinellia tenuiflora (KPutB1) and rice (KOB1) alters K+ homeostasis of yeast and Arabidopsis. Mol. Biotechnol 2011, 48, 76–86. [Google Scholar]
- Liu, H.; Zhang, X.; Takano, T.; Liu, S. Characterization of a PutCAX1 gene from Puccinellia tenuiflora that confers Ca2+ and Ba2+ tolerance in yeast. Biochem. Biophys. Res. Commun 2009, 383, 392–396. [Google Scholar]
- Wang, X.; Yang, R.; Wang, B.; Liu, G.; Yang, C.; Cheng, Y. Functional characterization of a plasma membrane Na+/H+ antiporter from alkali grass (Puccinellia tenuiflora). Mol. Biol. Rep 2011, 38, 4813–4822. [Google Scholar]
- Wang, Y.; Yang, C.; Liu, G.; Jiang, J. Development of a cDNA microarray to identify gene expression of Puccinellia tenuiflora under saline-alkali stress. Plant Physiol. Biochem 2007, 45, 567–576. [Google Scholar]
- Wang, X.; Fan, P.; Song, H.; Chen, X.; Li, X.; Li, Y. Comparative proteomic analysis of differentially expressed proteins in shoots of Salicornia europaea under different salinity. J. Proteome Res 2009, 8, 3331–3345. [Google Scholar]
- Wang, Y.X.; Sun, G.R.; Wang, J.B.; Chen, G.; Cao, W.Z.; Liu, A.P.; Wang, C. Comparison of the effects of Na2CO3 and NaCl stresses on antioxidant enzymes of chloroplasts of Puccinellia tenuiflora seedlings. Acta Prataculturae Sin 2007, 16, 81–86. [Google Scholar]
- Yan, X.F.; Xiao, W.; Sun, G.R. Physiological reaction of seedlings of Puccinellia tenuiflora under the condition of salt stress I. Effect of salt stress on the growth of Puccinellia tenuiflora seedlings. Heilongjiang J. Anim. Sci. Vet. Med 1994, 3, 1–3. [Google Scholar]
- Flowers, T.J.; Colmer, T.D. Salinity tolerance in halophytes. New Phytol 2008, 179, 945–963. [Google Scholar]
- Glenn, E.P.; Brown, J.J.; Blumwald, E. Salt tolerance and crop potential of halophytes. Crit. Rev. Plant Sci 1999, 18, 227–255. [Google Scholar]
- Niyogi, K.K. Photoprotection Revisited: Genetic and molecular approaches. Annu. Rev. Plant Physiol. Plant Mol. Biol 1999, 50, 333–359. [Google Scholar]
- Zhang, H.; Han, B.; Wang, T.; Chen, S.; Li, H.; Zhang, Y.; Dai, S. Mechanisms of plant salt response: Insights from proteomics. J. Proteome Res 2012, 11, 49–67. [Google Scholar]
- Badger, M.R.; Price, G.D. The role of carbonic anhydrase in photosynthesis. Annu. Rev. Plant Biol 1994, 45, 369–392. [Google Scholar]
- Raines, C.A. The Calvin cycle revisited. Photosynth. Res 2003, 75, 1–10. [Google Scholar]
- Droux, M.; Jacquot, J.P.; Miginac-Maslow, M.; Gadal, P.; Huet, J.; Crawford, N.; Yee, B.; Buchanan, B. Ferredoxin-thioredoxin reductase, an iron-sulfur enzyme linking light to enzyme regulation in oxygenic photosynthesis: Purification and properties of the enzyme from C3, C4, and cyanobacterial species. Arch. Biochem. Biophys 1987, 252, 426–439. [Google Scholar]
- Miller, G.; Suzuki, N.; Ciftci-Yilmaz, S.; Mittler, R. Reactive oxygen species homeostasis and signalling during drought and salinity stresses. Plant Cell Environ 2010, 33, 453–467. [Google Scholar]
- Demmig-Adams, B.; Adams, W.W., Iii. Photoprotection and other responses of plants to high light stress. Annu. Rev. Plant Biol 1992, 43, 599–626. [Google Scholar]
- Bugos, R.C.; Hieber, A.D.; Yamamoto, H.Y. Xanthophyll cycle enzymes are members of the lipocalin family, the first identified from plants. J. Biol. Chem 1998, 273, 15321–15324. [Google Scholar]
- Chen, S.; Gollop, N.; Heuer, B. Proteomic analysis of salt-stressed tomato (Solanum lycopersicum) seedlings: Effect of genotype and exogenous application of glycinebetaine. J. Exp. Bot 2009, 60, 2005–2019. [Google Scholar]
- Yadav, S.K.; Singla-Pareek, S.L.; Ray, M.; Reddy, M.; Sopory, S. Methylglyoxal levels in plants under salinity stress are dependent on glyoxalase I and glutathione. Biochem. Biophys. Res. Commun 2005, 337, 61–67. [Google Scholar]
- Yadav, S.K.; Singla-Pareek, S.L.; Reddy, M.; Sopory, S. Transgenic tobacco plants overexpressing glyoxalase enzymes resist an increase in methylglyoxal and maintain higher reduced glutathione levels under salinity stress. FEBS Lett 2005, 579, 6265–6271. [Google Scholar]
- Bernier, F.; Berna, A. Germins and germin-like proteins: Plant do-all proteins. But what do they do exactly? Plant Physiol. Biochem 2001, 39, 545–554. [Google Scholar]
- Dani, V.; Simon, W.J.; Duranti, M.; Croy, R.R. Changes in the tobacco leaf apoplast proteome in response to salt stress. Proteomics 2005, 5, 737–745. [Google Scholar]
- Jiang, Y.; Yang, B.; Harris, N.S.; Deyholos, M.K. Comparative proteomic analysis of NaCl stress-responsive proteins in Arabidopsis roots. J. Exp. Bot 2007, 58, 3591–3607. [Google Scholar]
- Snowden, K.C.; Richards, K.D.; Gardner, R.C. Aluminum-induced genes (induction by toxic metals, low calcium, and wounding and pattern of expression in root tips). Plant Physiol 1995, 107, 341–348. [Google Scholar]
- Ozturk, Z.N.; Talamé, V.; Deyholos, M.; Michalowski, C.B.; Galbraith, D.W.; Gozukirmizi, N.; Tuberosa, R.; Bohnert, H.J. Monitoring large-scale changes in transcript abundance in drought-and salt-stressed barley. Plant Mol. Biol 2002, 48, 551–573. [Google Scholar]
- Kobayashi, S.; Abe, N.; Yoshida, K.T.; Liu, S.; Takano, T. Molecular cloning and characterization of plasma membrane- and vacuolar-type Na+/H+ antiporters of an alkaline-salt-tolerant monocot, Puccinellia tenuiflora. J. Plant Res 2012, 125, 587–594. [Google Scholar]
- Dietz, K.J.; Tavakoli, N.; Kluge, C.; Mimura, T.; Sharma, S.; Harris, G.; Chardonnens, A.; Golldack, D. Significance of the V-type ATPase for the adaptation to stressful growth conditions and its regulation on the molecular and biochemical level. J. Exp. Bot 2001, 52, 1969–1980. [Google Scholar]
- Chen, G.; Yang, W.; Sun, G.R.; Peng, Y.Z.; Zhou, X.Y.; Zhou, W.D.; Du, K.; Zhang, B. The content of K and Na in epidermis and mesophyll cells of Puccinellia tenuiflora seedings leaves under Na2CO3 stress. Acta Ecol. Sin 2007, 27, 5408–5413. [Google Scholar]
- Kawamura, Y.; Uemura, M. Mass spectrometric approach for identifying putative plasma membrane proteins of Arabidopsis leaves associated with cold acclimation. Plant J 2003, 36, 141–154. [Google Scholar]
- Cheng, Y.; Qi, Y.; Zhu, Q.; Chen, X.; Wang, N.; Zhao, X.; Chen, H.; Cui, X.; Xu, L.; Zhang, W. New changes in the plasma-membrane-associated proteome of rice roots under salt stress. Proteomics 2009, 9, 3100–3114. [Google Scholar]
- Sanchez-Aguayo, I.; Rodriguez-Galan, J.M.; Garcia, R.; Torreblanca, J.; Pardo, J.M. Salt stress enhances xylem development and expression of S-adenosyl-l-methionine synthase in lignifying tissues of tomato plants. Planta 2004, 220, 278–285. [Google Scholar]
- Economou, A.; Wickner, W. SecA promotes preprotein translocation by undergoing ATP-driven cycles of membrane insertion and deinsertion. Cell 1994, 78, 835–843. [Google Scholar]
- Wang, X.; Chen, S.; Zhang, H.; Shi, L.; Cao, F.; Guo, L.; Xie, Y.; Wang, T.; Yan, X.; Dai, S. Desiccation tolerance mechanism in resurrection fern-ally Selaginella tamariscina revealed by physiological and proteomic analysis. J. Proteome Res 2010, 9, 6561–6577. [Google Scholar]
- Akram, M.S.; Ashraf, M.; Shahbaz, M.; Aisha Akram, N. Growth and photosynthesis of salt-stressed sunflower (Helianthus annuus) plants as affected by foliar-applied different potassium salts. J. Plant Nutr. Soil Sci 2009, 172, 884–893. [Google Scholar]
- Qi, L.; Fritz, E.; Tianqing, L.; Hüttermann, A. X-ray microanalysis of ion contents in roots of Populus maximowiczii grown under potassium and phosphorus deficiency. J. Plant Physiol 1991, 138, 180–185. [Google Scholar]
- Dai, S.; Li, L.; Chen, T.; Chong, K.; Xue, Y.; Wang, T. Proteomic analyses of Oryza sativa mature pollen reveal novel proteins associated with pollen germination and tube growth. Proteomics 2006, 6, 2504–2529. [Google Scholar]
- The National Center for Biotechnology Information (NCBI). Available online: http://www.ncbi.nlm.nih.gov/ accessed on 8 August 2012.
- The Universal Protein Resource (UniProt). Available online: http://www.ebi.uniprot.org/ accessed on 8 August 2012.
- Eisen Lab. Available online: http://rana.lbl.gov/EisenSoftware accessed on 8 August 2012.


| Spot No. a | Protein name b | Plant species c | gi Number d | Thr. MW (Da)/pI e | Exp. MW (Da)/pI f | Sco g | Cov (%) h | QM i | V% ± SE j 0, 38, 95 mM Na2CO3 |
|---|---|---|---|---|---|---|---|---|---|
| Photosynthesis (6) | |||||||||
| 182 | carbonic anhydrase, chloroplast precursor (CA) | Hordeum vulgare | 729003 | 35,736/8.93 | 30,029/6.47 | 125 | 6 | 2 |  |
| 459 | Rubisco large subunit (Rubisco LSU) | Tristachya leucothrix | 125991685 | 51,294/6.23 | 64,412/5.71 | 86 | 19 | 8 |  |
| 240 | Rubisco large subunit (Rubisco LSU) | Orobanche coerulescens | 46410750 | 47,410/6.45 | 62,047/6.68 | 176 | 10 | 4 |  |
| 68 | Rubisco small subunit (Rubisco SSU) | Avena sterilis subsp. ludoviciana | 3790104 | 19,030/8.29 | 4088/5.98 | 78 | 9 | 2 |  |
| 368 | phosphoribulokinase (PRK), chloroplast precursor | Oryza sativa | 125578 | 44,486 | 53,645/5.08 | 210 | 14 | 6 |  |
| 318 | ferredoxin-thioredoxin reductase, variable chain (FTR) | Zea mays | 2498397 | 10,937/5.69 | 9350/5.63 | 49 | 14 | 2 |  |
| Stress and defense (4) | |||||||||
| 224 | temperature stress-induced lipocalin (TIL) | Triticum aestivum | 18650668 | 21,809/5.50 | 19,791/5.42 | 114 | 7 | 1 |  |
| 185 | glyoxalase I (GLO) | O. sativa (japonica cultivar-group) | 16580747 | 32,861/5.51 | 44,631/5.27 | 202 | 15 | 6 |  |
| 170 | germin-like protein 1 (GLP) | O. sativa | 4239821 | 22,017/6.01 | 22,973/6.40 | 84 | 10 | 1 |  |
| 574 | aluminum-induced protein-like protein (AIPLP) | Setaria italica | 124263781 | 27,004/6.05 | 39,899/5.21 | 114 | 9 | 2 | 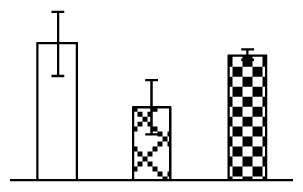 |
| Membrane and transport (3) | |||||||||
| 133 | Os01g0233000, containing pfam05558 DREPP plasma membrane polypeptide domain (DREPP) | O.sativa (japonica cultivar-group) | 115435500 | 21,788/4.92 | 40,022/4.03 | 89 | 7 | 2 | 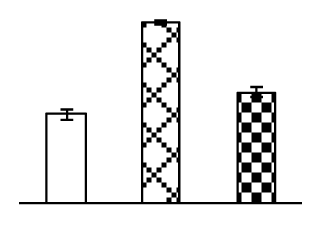 |
| 125 | Vacuolar-type H+-ATPase (V-ATPase) | H. vulgare | 2493132 | 53,806/5.12 | 42,714/6.71 | 70 | 3 | 2 |  |
| 370 | membrane-associated 30 kDa protein, chloroplast precursor (M30) | Pisum sativum | 729842 | 35,709/9.30 | 39,410/6.12 | 80 | 6 | 2 | 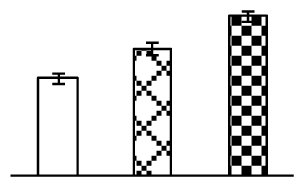 |
| Carbohydrate and energy metabolism (18) | |||||||||
| 464 | Os08g0113100, containing cd01167 fructokinases (FRKs) domain | O. sativa (japonica cultivar-group) | 115474481 | 35,893/5.02 | 49,892/5.04 | 127 | 5 | 1 | 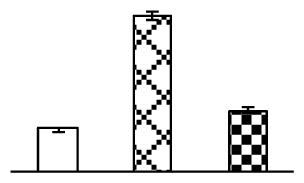 |
| 233 | putative fructose-bisphosphate aldolase (FBA) | Phleum pratense | 5419990 | 25,028/7.79 | 54,664/6.85 | 132 | 17 | 2 |  |
| 373 | cytoplasmic aldolase (ALD) | O. sativa | 218157 | 39,151/6.56 | 55,317/6.53 | 226 | 10 | 7 |  |
| 179 | triosephosphate isomerase, cytosolic (TIM) | Secale cereale | 1174749 | 27,138/5.24 | 35,657/5.43 | 79 | 13 | 3 |  |
| 384 | Os03g0129300, containing pfam00044 Gp_dh_N (GAPDH) domain | O. sativa (japonica cultivar-group) | 115450493 | 47,537/6.22 | 53,685/5.98 | 239 | 12 | 8 |  |
| 380 | phosphoglycerate kinase (PGK) | Vitis vinifera | 147843754 | 42,510/6.29 | 62,210/5.33 | 137 | 9 | 3 |  |
| 138 | enolase2 | Z. mays | 162460735 | 48,418/5.70 | 66,697/5.4 | 143 | 10 | 3 |  |
| 184 | malate dehydrogenase, mitochondrial precursor (MDH) | Citrullus lanatus var. lanatus | 126896 | 36,406/9.68 | 50,177/6.54 | 78 | 3 | 2 |  |
| 408 | putative cytosolic 6-phosphogluconate dehydrogenase (6PGDH) | Z. mays | 3342802 | 53,204/6.24 | 63,107/5.65 | 64 | 4 | 2 |  |
| 79 | ATP synthase alpha (ATPase 1) | T. aestivum | 81176509 | 55,557/5.70 | 64,698/5.84 | 361 | 12 | 4 |  |
| 123 | ATP synthase alpha subunit (ATPase 1) | T. aestivum | 81176509 | 55,557/5.70 | 64,820/5.68 | 207 | 39 | 19 |  |
| 290 | ATP synthase alpha subunit (ATPase 1) | Elymus sibiricus | 51556908 | 55,549/6.03 | 66,615/6.26 | 77 | 20 | 8 |  |
| 284 | ATP synthase CF1 alpha subunit (ATP ase CF1) | Agrostis stolonifera | 118430299 | 55,491/6.11 | 66,044/5.8 | 88 | 24 | 9 |  |
| 105 | mitochondrial ATP synthase precursor (ATPase 1) | T. aestivum | 47607439 | 27,090/7.71 | 36,228/5.63 | 62 | 6 | 2 |  |
| 200 | Os12g0230100, containing two AAA ATPase family protein domain | O. sativa (japonica cultivar-group) | 115487910 | 102,068/6.62 | 78,280/5.74 | 87 | 16 | 13 | 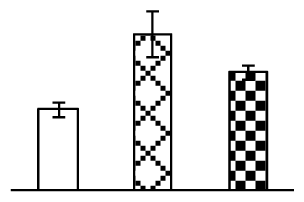 |
| 202 | hypothetical protein OsI_036614, containing two AAA ATPase family protein domain | O. sativa (indica cultivar-group) | 125536167 | 156,826/7.37 | 77,750/5.52 | 73 | 4 | 10 | 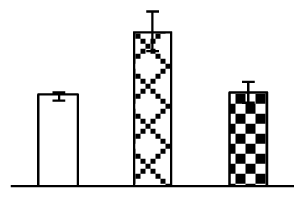 |
| 186 | unnamed protein product, containing cd00009 the AAA, ATPases domain | Vitis vinifera | 157343871 | 50,950/5.8 | 78,076/5.68 | 146 | 37 | 16 | 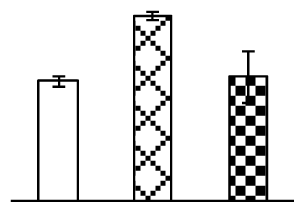 |
| 247 | hypothetical protein OsI_023646, containing AAA, ATPases domain | O. sativa (indica cultivar-group) | 125556808 | 64,173/5.65 | 72,936/5.27 | 74 | 22 | 12 | 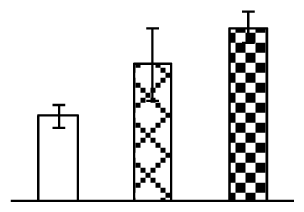 |
| Amino acid metabolism (2) | |||||||||
| 349 | aspartate aminotransferase (AST) | O. sativa | 29468084 | 46,016/5.90 | 58,376/5.86 | 375 | 16 | 7 |  |
| 145 | methionine synthase (MS) | H. vulgare subsp. vulgare | 50897038 | 84,794/5.68 | 76,241/5.77 | 112 | 4 | 3 |  |
| Transcription related (1) | |||||||||
| 121 | cp31BHv, containing cd00590 RNA recognition motif (RRM) domain | H. vulgare subsp. vulgare | 3550483 | 30,662/4.76 | 37,167/4.27 | 115 | 8 | 2 |  |
| Protein synthesis (2) | |||||||||
| 333 | eukaryotic initiation factor 4A (IF4A) | O. sativa (japonica cultivar-group) | 303844 | 47,187/5.29 | 64,045/5.24 | 166 | 12 | 3 |  |
| 415 | Os07g0168000, containing cd00164 Ribosomal protein S1-like RNA-binding domain(RP) | O. sativa (japonica cultivar-group) | 115470767 | 98,023/5.64 | 79,993/5.15 | 84 | 3 | 2 |  |
| Protein folding and transporting (3) | |||||||||
| 255 | peptidyl-prolyl cis-trans isomerase, chloroplast precursor (PPIase) | Glycine max | 9899901 | 18,841/8.49 | 17,018/6.69 | 146 | 19 | 2 |  |
| 263 | protein disulfide-isomerase precursor (PDI) | Nicotiana tabacum | 1848212 | 40,082/5.99 | 53,400/6.09 | 92 | 6 | 3 |  |
| 731 | putative SecA | O. sativa (japonica cultivar-group) | 52075758 | 114,899/5.78 | 80,931/5.62 | 88 | 11 | 10 |  |
| Protein degradation (3) | |||||||||
| 455 | Os01g0811100, containing cd03751 proteasome alpha type 3 (Proteasome α3) domain | O. sativa (japonica cultivar-group) | 115440617 | 27,506/5.75 | 37,044/5.97 | 107 | 6 | 2 |  |
| 431 | unknown, containing cd03751 proteasome alpha type 3 (Proteasome α3) domain | H. vulgare | 117670154 | 27,448/5.82 | 18,201/5.05 | 167 | 15 | 4 |  |
| 197 | Os05g0573700, containing pfam07991 acetohydroxy acid isomeroreductase, catalytic domain (AAIR) | O. sativa (japonica cultivar-group) | 115465569 | 62,680/6.01 | 68,899/5.81 | 254 | 11 | 6 |  |
| Signaling (1) | |||||||||
| 334 | plant adhesion molecule PAM1 | Arabidopsis thaliana | 22531279 | 34,306/8.80 | 12,776/5.27 | 74 | 17 | 6 |  |
© 2013 by the authors; licensee Molecular Diversity Preservation International, Basel, Switzerland. This article is an open-access article distributed under the terms and conditions of the Creative Commons Attribution license (http://creativecommons.org/licenses/by/3.0/).
Share and Cite
Yu, J.; Chen, S.; Wang, T.; Sun, G.; Dai, S. Comparative Proteomic Analysis of Puccinellia tenuiflora Leaves under Na2CO3 Stress. Int. J. Mol. Sci. 2013, 14, 1740-1762. https://doi.org/10.3390/ijms14011740
Yu J, Chen S, Wang T, Sun G, Dai S. Comparative Proteomic Analysis of Puccinellia tenuiflora Leaves under Na2CO3 Stress. International Journal of Molecular Sciences. 2013; 14(1):1740-1762. https://doi.org/10.3390/ijms14011740
Chicago/Turabian StyleYu, Juanjuan, Sixue Chen, Tai Wang, Guorong Sun, and Shaojun Dai. 2013. "Comparative Proteomic Analysis of Puccinellia tenuiflora Leaves under Na2CO3 Stress" International Journal of Molecular Sciences 14, no. 1: 1740-1762. https://doi.org/10.3390/ijms14011740