Room-Temperature Fluorescence Lifetime of Pseudoisocyanine (PIC) J Excitons with Various Aggregate Morphologies in Relation to Microcavity Polariton Formation

Abstract
:1. Introduction
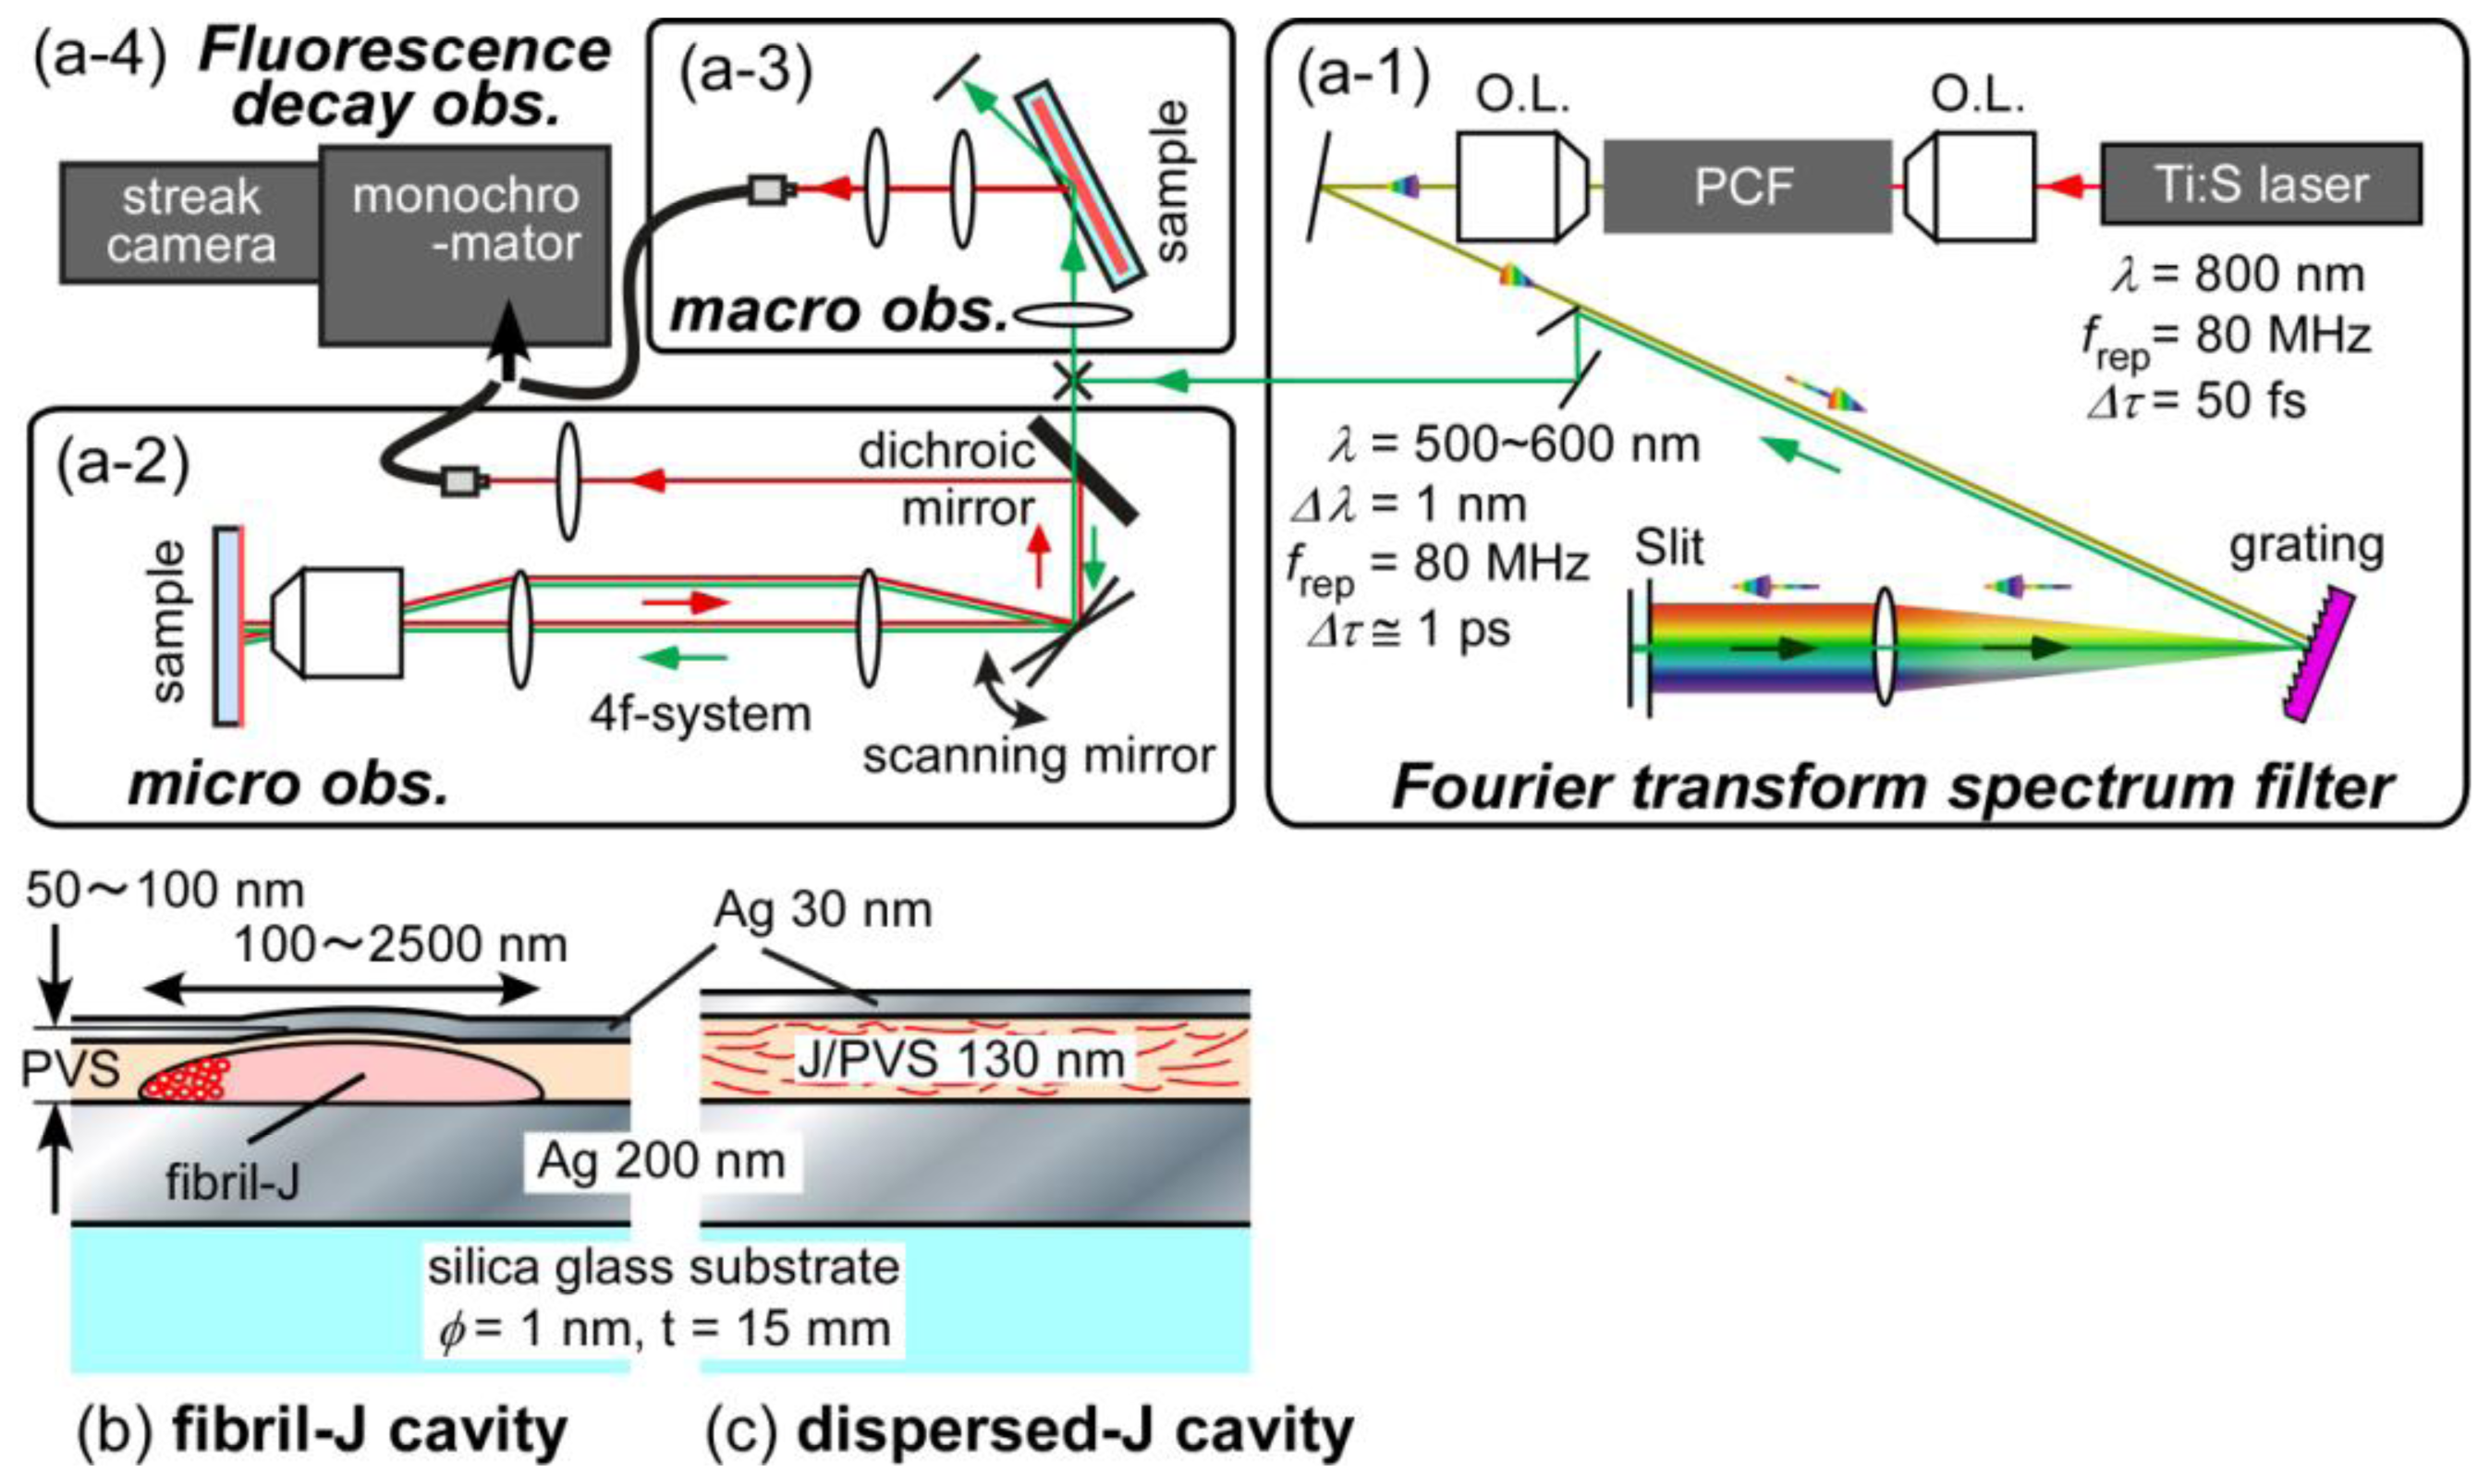
2. Experimental
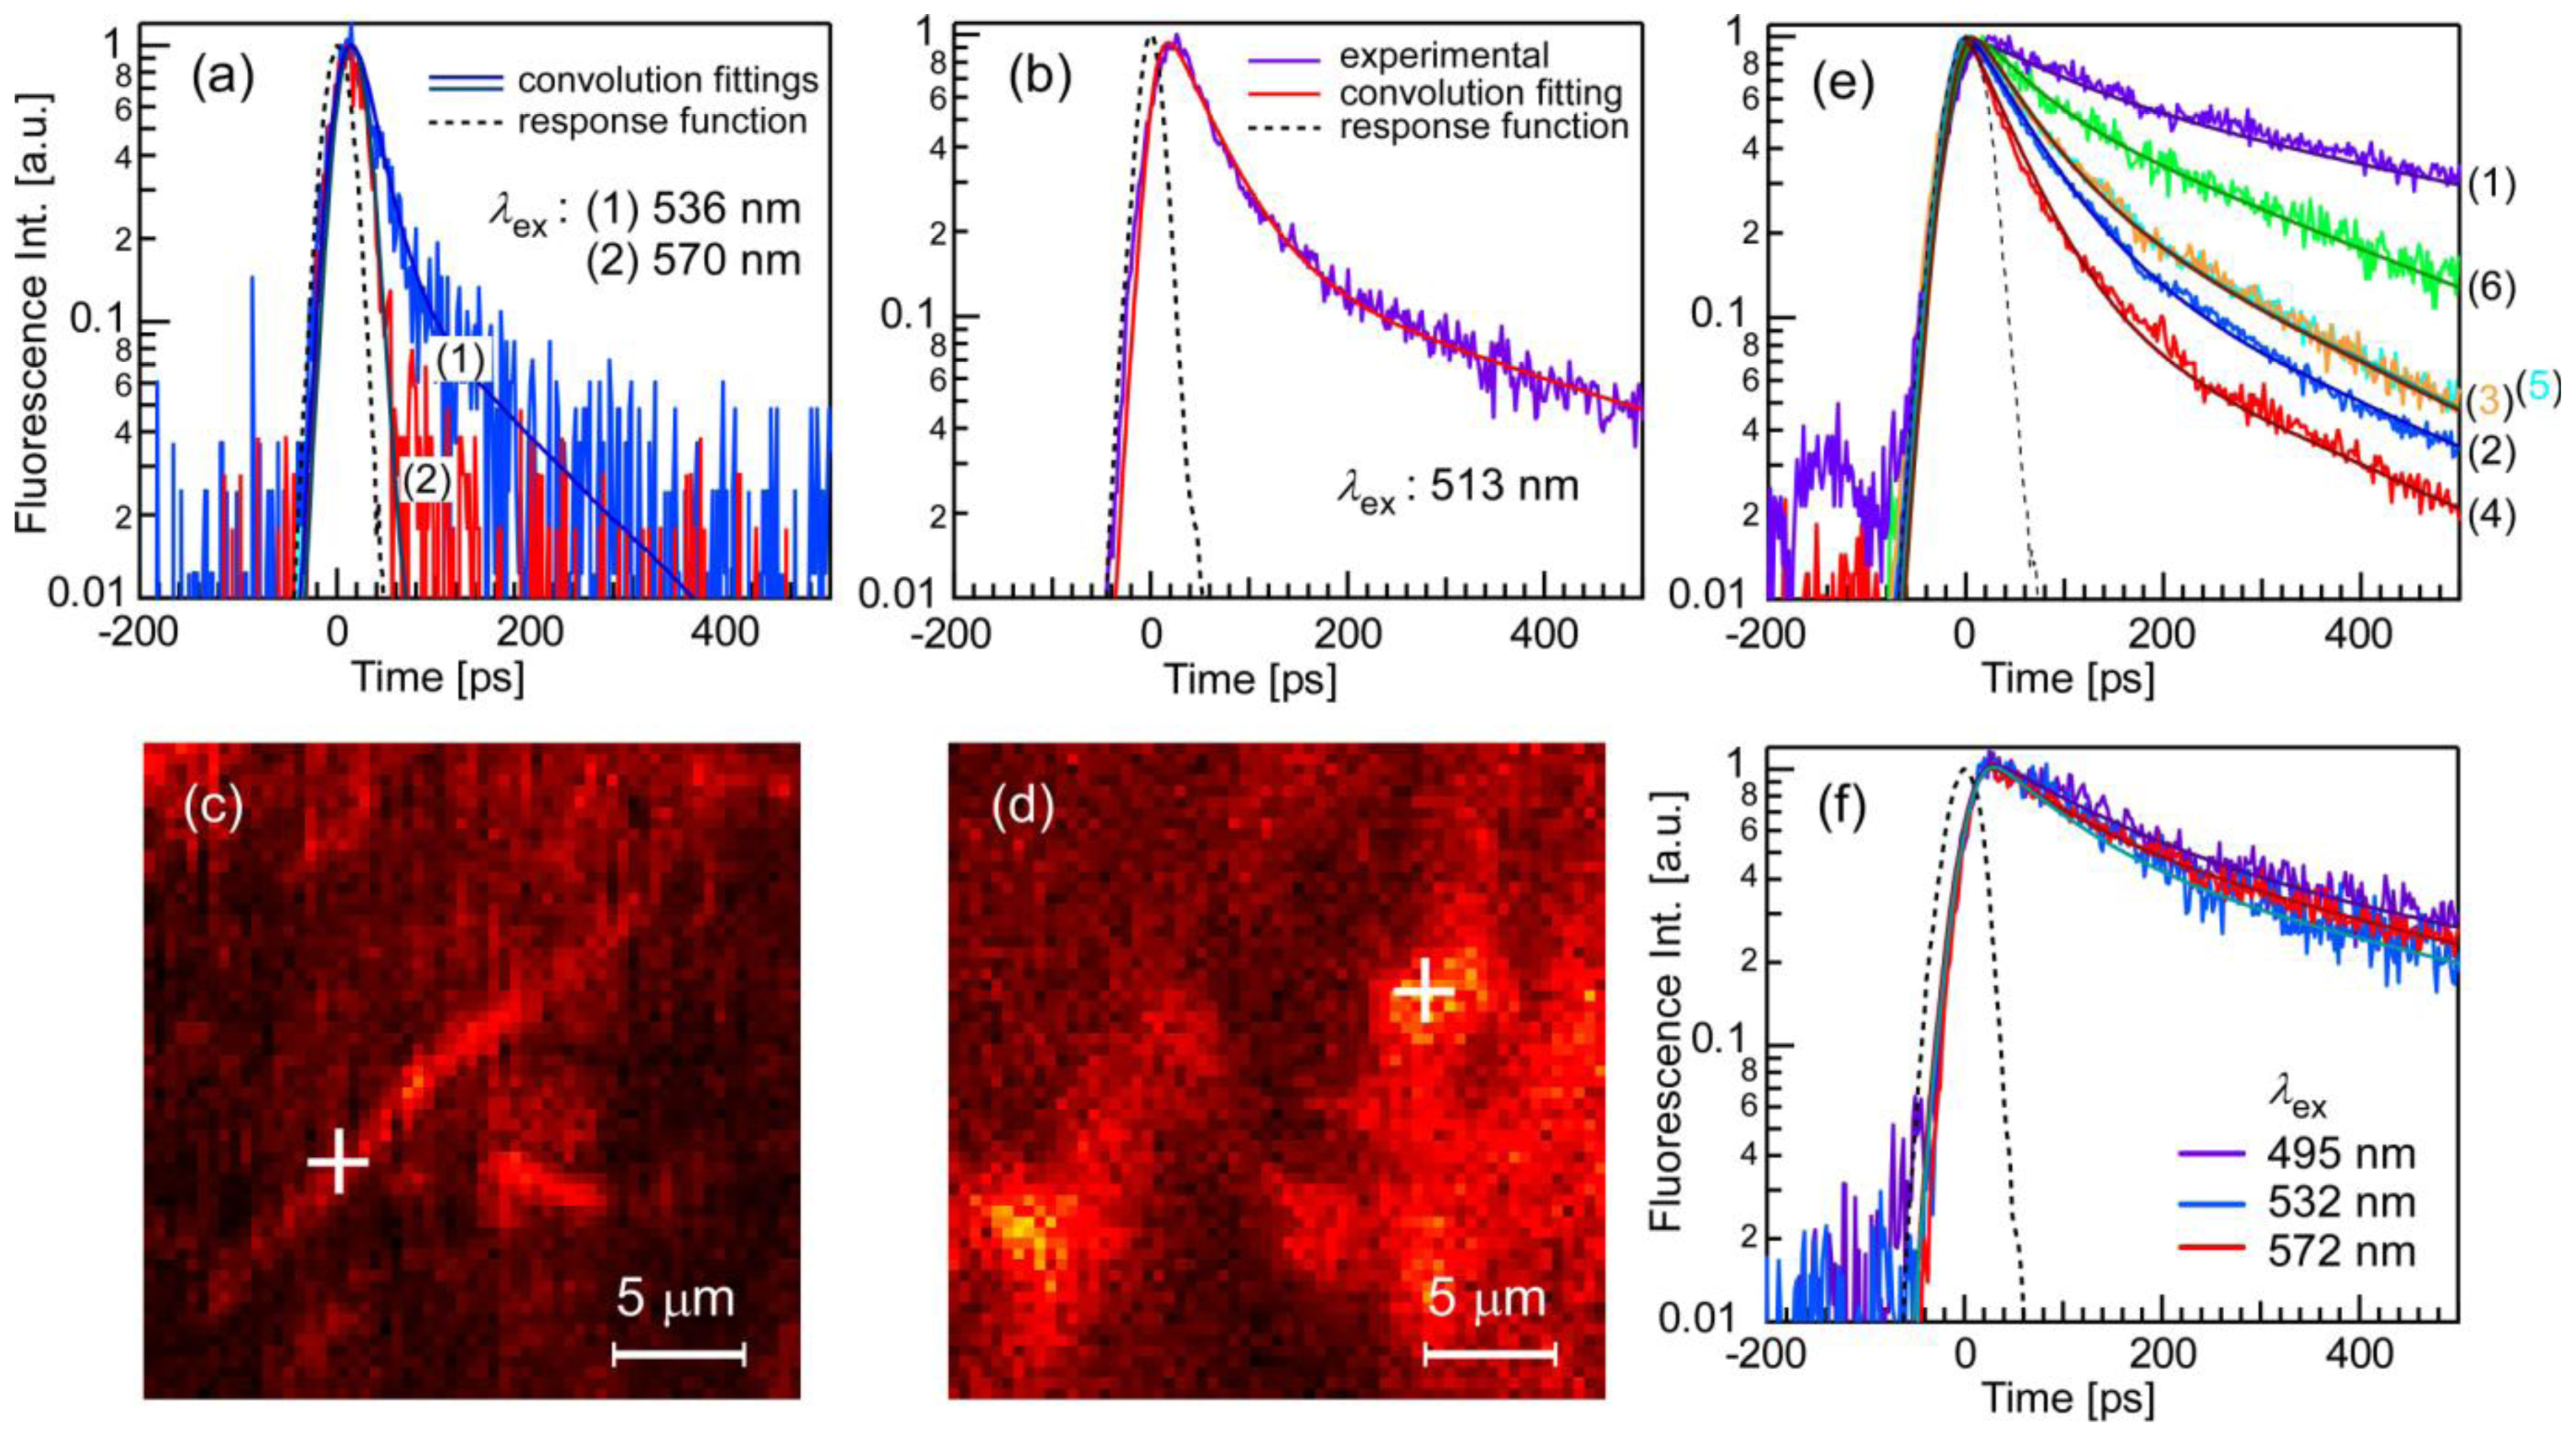
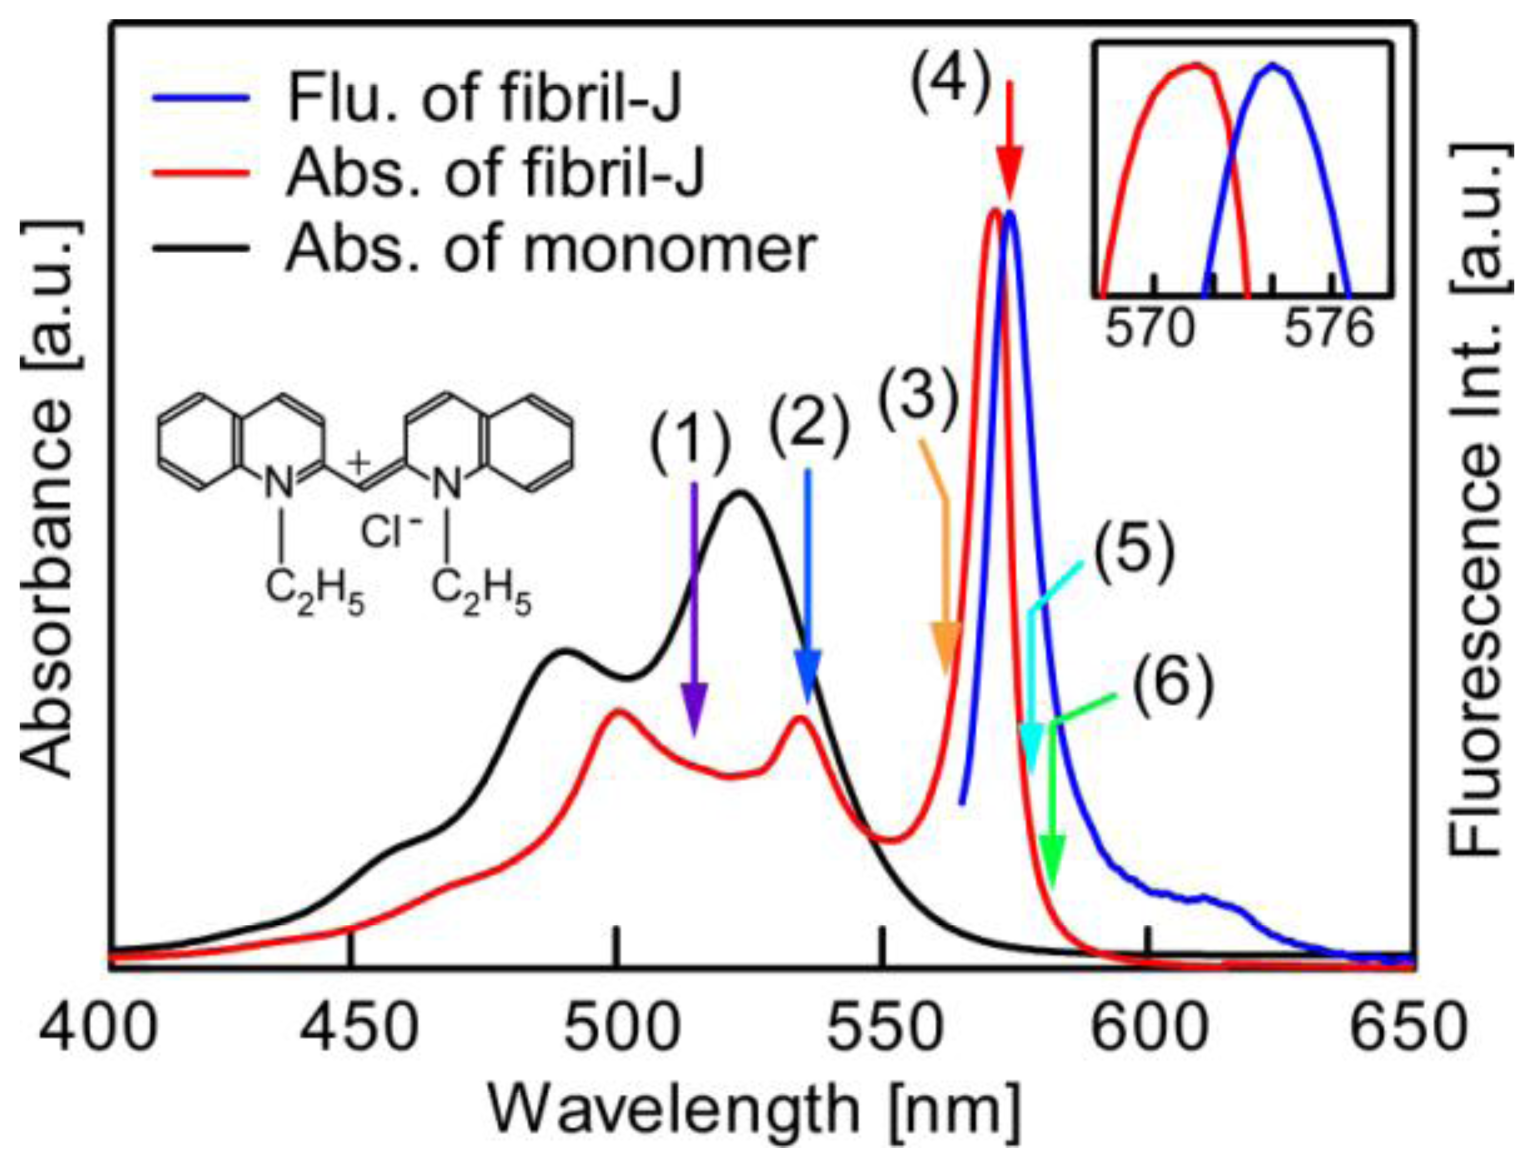
3. Results and Discussion
4. Conclusion
Acknowledgements
References
- Jelley, E.E. Spectral absorption and fluorescence of dyes in the molecular state. Nature 1936, 138, 1009–1010. [Google Scholar]
- Scheibe, G. Über die Veränderlichkeit der Absorptionsspektren in Lösungen und die Nebenvalenzen als ihre Ursache. Angew. Chem 1937, 50, 212–219. [Google Scholar]
- Kasha, M. Molecular Excitons in Small Aggregates. In Spectroscopy of the Excited State; DiBartolo, B., Ed.; Plenum Press: New York NY, USA, 1976; pp. 337–363. [Google Scholar]
- Möbius, D. Scheibe aggregates. Adv. Mater 1995, 7, 437–444. [Google Scholar]
- Würthner, F.; Kaiser, T.E.; Saha-Möller, C.R. J-aggregates: From serendipitous discovery to supramolecular engineering of functional dye materials. Angew. Chem. Int. Ed. Engl 2011, 50, 3376–3410. [Google Scholar]
- Pope, M.; Swenberg, C.E. Electronic Processes in Organic Crystals and Polymers; Oxford University Press: New York, NY, USA, 1999. [Google Scholar]
- Chaudhuri, D.; Li, D.B.; Che, Y.; Shafran, E.; Gerton, J.M.; Zang, L.; Lupton, J.M. Long-range exciton migration in molecular H-aggregate nanowires. Nano Lett 2011, 11, 488–492. [Google Scholar]
- Scheblykin, I.G.; Varnavsky, O.P.; Verbouwe, W.; van der Auweraer, M.; Vitukhnovsky, A.G. Relaxation dynamics of excitons in J-aggregates revealing a two-component Davydov splitting. Chem. Phys. Lett 1998, 282, 250–256. [Google Scholar]
- Matsushita, M.; Ketelaars, M.; van Oijen, A.M.; Köhler, J.; Aartsma, T.J.; Schmidt, J. Spectroscopy on the B850 band of individual light-harvesting 2 complexes of rhodopseudomonas acidophila II. Exciton states of an elliptically deformed ring aggregate. Biophys. J 2001, 80, 1604–1614. [Google Scholar]
- Van Grondelle, R.; Novoderezhkin, V. Dynamics of excitation energy transfer in the LH1 and LH2 light-harvesting complexes of photosynthetic bacteria. Biochemistry 2001, 40, 15057–15068. [Google Scholar]
- Sarovar, M.; Ishizaki, A.; Fleming, G.R.; Whaley, K.B. Quantum entanglement in photosynthetic light harvesting complexes. Nature 2010, 6, 462–467. [Google Scholar]
- Tani, T.; Saeki, M.; Yamaguchi, Y.; Hayashi, T.; Oda, M. Microscopic exciton properties of fibril-shaped molecular J-aggregates prepared in ultra-thin polymer films. J. Lumin 2004, 107, 339–346. [Google Scholar]
- Tani, T.; Yamaguchi, Y.; Hayashi, T.; Oda, M. Fibril-shaped molecular J-aggregates in thin polymer films-preparation and local photo-physics (in Japanese). Kobunshi Ronbunshu 2004, 60, 712–724. [Google Scholar]
- Tani, T.; Oda, M.; Hayashi, T.; Ohno, H.; Hirata, K. Anisotropic observation of absorption and fluorescence transition dipoles in exciton–polariton properties of PIC J-aggregates. J. Lumin 2007, 122–123, 244–246. [Google Scholar]
- Oda, M.; Hirata, K.; Inoue, T.; Obara, Y.; Fujimura, T.; Tani, T. Strong exciton-photon coupling and its polarization dependence in a metal-mirror microcavity with oriented PIC J-aggregates. Phys. Status Solidi 2009, C6, 288–291. [Google Scholar]
- Oda, M.; Obara, Y.; Saitoh, K.; Higashi, K.; Tani, T. Fabrication, characterization and its local reflection properties of a metal-mirror microcavity with high concentrated PIC J-aggregates. Phys. Procedia 2010, 3, 1615–1620. [Google Scholar]
- Lidzey, D.G.; Bradley, D.D.C.; Skolnick, M.S.; Virginli, T.; Cingolani, R.; Whittaker, D.M. Strong exciton–photon coupling in an organic semiconductor microcavity. Nature 1998, 395, 53–55. [Google Scholar]
- Camposeo, A.; Persano, L.; Carro, P.D.; Virgili, T.; Cingolani, R.; Pisignano, D. Polarization splitting in organic-based microcavities working in the strong coupling regime. Org. Electron 2007, 8, 114–119. [Google Scholar]
- Hobson, P.A.; Barnes, W.L.; Lidzey, D.G.; Gehring, G.A.; Whittaker, D.M.; Skolnick, M.S.; Walker, S. Strong exciton–photon coupling in a low-Q all-metal mirror microcavity. Appl. Phys. Lett 2002, 81, 3519–3521. [Google Scholar]
- Skolnick, M.S.; Fisher, T.A.; Whittaker, D.M. Strong coupling phenomena in quantum microcavity structures. Semicond. Sci. Technol 1998, 13, 645–669. [Google Scholar]
- Tawara, T.; Gotoh, H.; Akasaka, T.; Kobayashi, N.; Saitoh, T. Cavity polaritons in InGaN microcavities at room temperature. Phys. Rev. Lett 2004, 92, 256402:1–256402:4. [Google Scholar]
- Higgins, D.A.; Barbara, P.F. Excitonic transitions in J-aggregates probed by near-field scanning optical microscopy. J. Phys. Chem 1995, 99, 3–7. [Google Scholar]
- Higgins, D.A.; Reid, P.J.; Barbara, P.F. Structure and exciton dynamics in J-Aggregates studied by polarization-dependent near-field scanning optical microscopy. J. Phys. Chem 1996, 100, 1174–1180. [Google Scholar]
- Vacha, M.; Saeki, M.; Isobe, O.; Hashizume, K.; Tani, T. Mapping the orientation of exciton transition dipoles along individual nanostructures of molecular J-aggregates. J. Chem. Phys 2001, 115, 4973–4976. [Google Scholar]
- Vacha, M.; Saeki, M.; Furuki, M.; Pu, L.S.; Hashizume, K.; Tani, T. Optical properties of individual nanostructures of molecular J-aggregates. J. Lumin 2002, 98, 35–40. [Google Scholar]
- Gadde, S.; Batchelor, E.K.; Kaifer, A.E. Controlling the formation of cyanine dye H- and J-aggregates with cucurbituril hosts in the presence of anionic polyelectrolytes. Chem. Eur. J 2009, 15, 6025–6031. [Google Scholar]
- Obara, Y.; Saito, K.; Oda, M.; Tani, T. Anomalous reflection properties in high density limit fibril shaped PIC-J aggregates in microcavity structure. Phys. Status Solidi 2011, C8, 595–597. [Google Scholar]
- Schuwink, P.; Berlepsch, H.V.; Dähne, L.; Mahrt, R.F. Observation of strong exciton-photon coupling in an organic microcavity. Chem. Phys. Lett 2001, 344, 352–356. [Google Scholar]
- Schuwink, P.; Berlepsch, H.V.; Dähne, L.; Mahrt, R.F. Dependence of Rabi-splitting on the spatial position of the optically active layer in organic microcavities in the strong coupling regime. Chem. Phys 2002, 285, 113–120. [Google Scholar]
- Bel’tyugov, V.N.; Plekhanov, A.I.; Shelkovnikov, V.V. Observation of the exciton-photon strong coupling regime at room temperature in a microcavity containing J aggregates of pseudoisocyanine. J. Opt. Technol 2004, 71, 411–414. [Google Scholar]
- Struganova, I. Dynamics of formation of 1,1′-diethyl-2,2′-cyanine iodide J-aggregates in solution. J. Phys. Chem. A 2000, 104, 9670–9674. [Google Scholar]
- Khairutdinov, R.F. Photophysics of cyanine dyes: Subnanosecond relaxation dynamics in monomers, dimers, and H- and J-aggregates in solution. J. Phys. Chem. B 1997, 101, 2602–2610. [Google Scholar]
- Obara, Y.; Saitoh, K.; Oda, M.; Tani, T. Versatile implementation in angle-resolved optical microscopy: Its application to local spectrometry of microcavities with PIC-J-aggregates. Int. J. Spectros 2011, 2011. [Google Scholar] [CrossRef]
- Hashimoto, Y.; Mino, H.; Yamamoto, T.; Kanbara, D.; Matsusue, T.; Takeyama, S.; Karczewski, G.; Wojtowicz, T.; Kossut, J. Photo-induced ferromagnetism in bulk-Cd0.95Mn0.05Te via exciton magnetic polarons. AIP Conf. Proc 2005, 772, 1363–1364. [Google Scholar]
- Oda, M.; Hasegawa, A.; Iwami, N.; Nishiura, K.; Ando, N.; Nishiyama, A.; Horiuchi, H.; Tani, T. Photoluminescence behaviors of single CdSe/ZnS/TOPO nanocrystals: Adsorption effects of water molecules onto nanocrystal surfaces. J. Lumin 2007, 127, 198–203. [Google Scholar]
- Van Burgel, M.; Wiersma, D.A.; Duppen, K. The dynamics of one-dimensional excitons in liquids. J. Chem. Phys 1995, 102, 20–33. [Google Scholar]
- Reid, P.J.; Higgins, D.A.; Barbara, P.F. Environment-dependent photophysics of polymer-bound J aggregates determined by time-resolved fluorescence spectroscopy and time-resolved near-field scanning optical microscopy. J. Phys. Chem 1996, 100, 3892–3899. [Google Scholar]
- Sundström, V.; Gillbo, T.; Gadonas, R.A.; Piskarskas, A. Annihilation of singlet excitons in J aggregates of pseudoisocyanine (PIC) studied by pico- and subpicosecond spectroscopy. J. Chem. Phys 1988, 89, 2754–2762. [Google Scholar]
- Scheblykin, I.G.; Bataiev, M.; Auweraer, M.V.; Vitukhnovsky, A.G. Dimensionality and temperature dependence of the radiative lifetime of J-aggregates with Davydov splitting of the exciton band. Chem. Phys. Lett 2000, 316, 37–44. [Google Scholar]
- Dorn, H.-P.; Müller, A. Temperature dependence of the fluorescence lifetime and quantum yield of pseudoisocyanine monomers. Chem. Phys. Lett 1986, 130, 426–431. [Google Scholar]
- Fidder, H.; Knoester, J.; Wiersma, D.A. Superradiant emission and optical dephasing in J-aggregates. Chem. Phys. Lett 1990, 171, 529–536. [Google Scholar]
- De Boer, S.; Wiersma, D.A. Dephasing-induced damping of superradiant emission in J-aggregates. Chem. Phys. Lett 1990, 165, 45–53. [Google Scholar]
- Spano, F.C.; Kuklinski, J.R.; Mukamel, S. Temperature-dependent superradiant decay of excitons in small aggregates. Phys. Rev. Lett 1990, 65, 211–214. [Google Scholar]
- Potma, E.O.; Wiersma, D.A. Exciton superradiance in aggregates: The effect of disorder, higher order exciton-phonon coupling and dimensionality. J. Chem. Phys 1998, 108, 4894–4903. [Google Scholar]
- Fidder, H.; Wiersma, D.A. Collective optical response of molecular aggregates. Phys. Status Solidi B 1995, 188, 285–295. [Google Scholar]
- Von Berlepsch, H.; Böttcher, C.; Dähne, S. Structure of J-aggregates of pseudoisocyanine dye in aqueous solution. J. Phys. Chem. B 2000, 104, 8792–8799. [Google Scholar]
- Von Berlepsch, H.; Böttcher, C. Network superstructure of pseudoisocyanine J-aggregates in aqueous sodium chloride solution revealed by cryo-transmission electron microscopy. J. Phys. Chem. B 2002, 106, 3146–3150. [Google Scholar]
- Agranovich, V.M.; Litinskaia, M.; Lidzey, D.G. Cavity polaritons in microcavities containing disordered organic semiconductors. Phys. Rev. B 2003, 67, 085311–085320. [Google Scholar]
- Lidzey, D.G.; Fox, A.M.; Rahn, M.D.; Skolnick, M.S.; Agranovich, V.M.; Walker, S. Experimental study of light emission from strongly coupled organic semiconductor microcavities following nonresonant laser excitation. Phys. Rev. B 2002, 65, 195312:1–195312:10. [Google Scholar]
- Schouwink, P.; von Berlepsch, H.; Dähne, L.; Mahrt, R.F. Observation of strong exciton–photon coupling in an organic microcavity in transmission and photoluminescence. J. Lumin 2001, 94–95, 821–826. [Google Scholar]
- Obara, Y.; Saitoh, K.; Oda, M.; Tani, T. Cavity polariton formation and its optical properties of PIC-J aggregates in quantum microcavity structures (in Japanese). Kobunshi Ronbunshu 2011, 68, 97–114. [Google Scholar]
- Takada, N.; Kamata, T.; Bradley, D.D.C. Polariton emission from polysilane-based organic microcavities. Appl. Phys. Lett 2003, 82, 1812–1814. [Google Scholar]
- Didraga, C.; Malyshev, V.A.; Knoester, J. Excitation energy transfer between closely spaced multichromophoric systems: Effects of band mixing and intraband relaxation. J. Phys. Chem. B 2006, 110, 18818–18827. [Google Scholar]
- Lemaistre, J.P. Intraband relaxation and dephasing of Frenkel exciton states in one-dimensional J-aggregates. J. Lumin 2004, 107, 332–338. [Google Scholar]
- Bednarz, M.; Malyshev, V.A.; Knoester, J. Low-temperature dynamics of weakly localized Frenkel excitons in disordered linear chains. J. Chem. Phys 2004, 120, 3827–3840. [Google Scholar]
- Shimizu, M.; Suto, S.; Goto, T.; Watanabe, A.; Matsuda, M. Exciton dynamics in disordered linear chains of poly(di-n-hexylsilane): Experiment and theory. Phys. Rev. B 1998, 58, 5032–5042. [Google Scholar]
- Malyshev, A.V.; Malyshev, V.A. Statistics of low energy levels of a one-dimensional weakly localized Frenkel exciton: A numerical study. Phys. Rev. B 2001, 63, 195111–195118. [Google Scholar]
- Vacha, M.; Takei, S.; Hashizume, K.; Sakakibara, Y.; Tani, T. Onset of exciton–polariton behavior observed in individual fibers of pseudoisocyanine J-aggregates by sub-micron scale reflectance spectroscopy. Chem. Phys. Lett 2000, 331, 387–395. [Google Scholar]
- Fucks, R.; Kliewer, K.L.; Pardee, W.J. Optical properties of an ionic crystal slab. Phys. Rev 1966, 150, 589–596. [Google Scholar]


| λex [nm] | τ1 [ps] (ratio1 [%]) | τ2 [ps] (ratio2 [%]) |
|---|---|---|
| 511 | 110 (12) | 660 (88) |
| 534 | 55 (59) | 270 (41) |
| 560 | 49 (36) | 220 (64) |
| 572 | 42 (70) | 260 (30) |
| 576 | 56 (43) | 250 (57) |
| 580 | 55 (17) | 310 (83) |
| λex [nm] | τ1 [ps] (ratio1 [%]) | τ2 [ps] (ratio2 [%]) |
|---|---|---|
| 495 | 100 (16) | 560 (84) |
| 532 | 86 (23) | 540 (77) |
| 572 | 89 (17) | 520 (83) |
© 2012 by the authors; licensee Molecular Diversity Preservation International, Basel, Switzerland. This article is an open-access article distributed under the terms and conditions of the Creative Commons Attribution license (http://creativecommons.org/licenses/by/3.0/).
Share and Cite
Obara, Y.; Saitoh, K.; Oda, M.; Tani, T. Room-Temperature Fluorescence Lifetime of Pseudoisocyanine (PIC) J Excitons with Various Aggregate Morphologies in Relation to Microcavity Polariton Formation. Int. J. Mol. Sci. 2012, 13, 5851-5865. https://doi.org/10.3390/ijms13055851
Obara Y, Saitoh K, Oda M, Tani T. Room-Temperature Fluorescence Lifetime of Pseudoisocyanine (PIC) J Excitons with Various Aggregate Morphologies in Relation to Microcavity Polariton Formation. International Journal of Molecular Sciences. 2012; 13(5):5851-5865. https://doi.org/10.3390/ijms13055851
Chicago/Turabian StyleObara, Yuki, Keita Saitoh, Masaru Oda, and Toshiro Tani. 2012. "Room-Temperature Fluorescence Lifetime of Pseudoisocyanine (PIC) J Excitons with Various Aggregate Morphologies in Relation to Microcavity Polariton Formation" International Journal of Molecular Sciences 13, no. 5: 5851-5865. https://doi.org/10.3390/ijms13055851