Article

Changes on the Caco-2 Secretome through Differentiation Analyzed by 2-D Differential In-Gel Electrophoresis (DIGE)

by
Andrés García-Lorenzo
,
Ana M. Rodríguez-Piñeiro
,
Francisco J. Rodríguez-Berrocal
,
María Páez de la Cadena
and
Vicenta S. Martínez-Zorzano
*
Department of Biochemistry, Genetics and Immunology, Faculty of Biology, University of Vigo, 36310 Vigo, Spain
*
Author to whom correspondence should be addressed.
Present address: Institute of Biomedicine, University of Gothenburg, 41390 Gothenburg, Sweden
Int. J. Mol. Sci. 2012, 13(11), 14401-14420; https://doi.org/10.3390/ijms131114401
Submission received: 1 August 2012 / Revised: 20 October 2012 / Accepted: 1 November 2012 / Published: 7 November 2012
(This article belongs to the Section Molecular Pathology, Diagnostics, and Therapeutics)

Abstract

:
Colorectal cancer is still a major health burden worldwide, and its diagnosis has not improved in recent years due to a lack of appropriate diagnostic serum markers. Aiming to find new diagnostic proteins, we applied the proteomic DIGE technology to analyze changes in the secretome before/after differentiation of the colon adenocarcinoma Caco-2 cell line, an accepted in vitro model to study colorectal tumorigenesis. When the secretomes from undifferentiated (tumor-like) and differentiated cells (resembling healthy enterocytes) were compared, we found 96 spots differentially expressed. After MS/MS analysis, 22 spots corresponding to 15 different proteins were identified. Principal component analysis demonstrated these 22 spots could serve as a discriminatory panel between the tumor-like and normal-like cells. Among the identified proteins, the translationally-controlled tumor protein (TCTP), the transforming growth factor-beta-induced protein ig-h3 (TGFβIp), and the Niemann-Pick disease type C2 protein (NPC2) are interesting candidates for future studies focused on their utility as serum biomarkers of colorectal cancer.

Graphical Abstract

1. Introduction

Colorectal cancer (CRC) represents globally the third leading cause of cancer-related mortality (after lung and breast cancer) [1], being one major health burden. Its development is a multi-step process that usually spans about 10 years, which should give an opportunity for early detection [2]. However, CRC diagnosis is usually made when cancer has spread to adjacent tissues due to its lack of symptoms and appropriate screening markers, since most of the molecules in use (CEA, CA-19.9, CA-72.4) show low specificity and/or sensitivity for the disease. Therefore, the finding of new and useful biomarkers for CRC would be of great relevance if early detection and even prevention could be achieved, especially through screening of a healthy population.
As one of the characteristics of an ideal tumor marker should be its tissue specificity, we aimed to find molecules produced in epithelial intestinal cells and secreted or shed into the surrounding tissue or the circulation. Therefore, we studied the secretome of the Caco-2 cells. This cell line was established from a moderately well-differentiated human colon adenocarcinoma. When cultured in vitro over confluence under standard culture conditions, it spontaneously differentiates into a cell type with remarkable intestinal enterocyte-like features, including brush borders with microvilli on their apical side, tight junctions, and enterocytic hydrolase activities [36]. This differentiation process provides a valuable research tool, as undifferentiated Caco-2 cells resemble those found in tumor tissues, whereas the differentiated ones lose the tumorigenic phenotype and are similar to healthy enterocytes [7]. Therefore, proteins found differently expressed in between those two cell types are firm candidates for further explorations in human healthy and tumor colorectal tissues. The subset of proteins occurring in conditioned media from cultured cells is defined as the “secretome” of those cells [8]. These proteins released by tumor cells in vitro may, to a certain extent, reflect the proteins released by tumors in vivo (i.e., the cancer secretome). Thus, analysis of tumor cell-derived secretomes may represent a feasible strategy for finding potential serum biomarkers for cancer [9,10].
The use of proteomics methods to analyze the secretome of Caco-2 cells before and after differentiation allows searching for a panel of potential biomarkers, instead of only one or few proteins, eventually enhancing both the sensitivity and specificity of the disease detection. In particular, for this study we chose an adaptation of the two-dimensional electrophoresis (2-DE) called differential in-gel electrophoresis (DIGE). This technique not only allows the separation of proteins on the basis of their isoelectric point and relative molecular mass, but to run up to two different samples and an internal standard in the same gel. The method is based on the differential resolution of the cyanine dyes (Cy2 or cyanine, Cy3 or indocarbocyanine, and Cy5 or indodicarbocyanine), covalently linked to lysine residues on the proteins. These fluorescent dyes have all similar charge and mass, and only a minimal amount is used to label the sample [11,12], hence they produce a very small and reproducible modification on the protein mass; besides, they compensate the original positive charge on the lysine residue bound with their own quaternary ammonium. Therefore, proteins will migrate mostly according to its original mass and net charge. The method has been described to have a sensitivity as low as 0.1 ng [13]. When an internal standard (pool of all samples analyzed, usually labeled with Cy2) is added the method becomes quantitative, as protein abundances can be normalized [11]. It also permits automated spot detection and alignment, decreasing the number of operator-related errors. Therefore, DIGE shows high sensitivity and reproducibility, with a wide dynamic range.
The DIGE technology has been already used in numerous studies. In CRC research there are several early examples as the work of Friedman et al.[14], who detected 52 proteins characteristic of tumor tissues, or the study of Alfonso et al.[15], where the authors found 41 proteins altered in tumor tissues and related to such important processes as transcription, cellular communication, or signal transduction. In our group, DIGE was applied to serum samples from CRC patients and healthy donors, in order to find potential biomarkers for the pathology [16]. DIGE has been also applied to in vitro studies with different cell lines, among them to the cellular proteome of Caco-2 cells [1719]. This has been also compared between proliferative and differentiated states through methodologies other than DIGE. In particular, the nucleus [20] and the plasma membrane [21] of those cells were compared to find proteins related with the differentiation process. Recently, a whole-cell approach was taken, and a comparison between the proteome of proliferating and differentiated cells revealed 53 proteins with differential regulation [6]. Interestingly, this study showed an upregulation in non-differentiated Caco-2 cells of proteins involved in cell growth or proliferation, and related to cancer, confirming the tumoral phenotype of these cells. Previous transcriptomic analyses had already shown that proliferating Caco-2 cells resemble cancer cells, whereas the differentiated phenotype was suitable as a model of the intestinal barrier [22,23].
Regarding the secretome of human CRC cell lines, it was studied in Smad4-deficient and Smad4-re-expressing derivatives of the SW480 cell line, finding more than 25 differential proteins including chaperones, proteases and protease inhibitors [24]. In a study of the cell lines Colo205 and SW480, the collapsin response mediator protein-2 was chosen as a potential CRC biomarker [9]. On the other hand, comparison of the primary cell line SW480 and its metastatic derivative SW620 yielded 145 differential proteins, from which the trefoil factor 3 and the growth/differentiation factor 15 were validated as potential biomarkers for CRC metastasis [25].
However, to date nobody has investigated the changes along the differentiation process induced on the proteins secreted by the Caco-2 cells. Therefore, we thought worth to study their secretome, as proteins secreted/shed by the undifferentiated cells, but not by the differentiated ones, could also be secreted/shed by intestinal tumor cells into the circulation after losing their “normal” phenotypes. This approach could identify a set of proteins that are potentially interesting serum biomarkers of the intestinal malignant transformation.

2. Results and Discussion

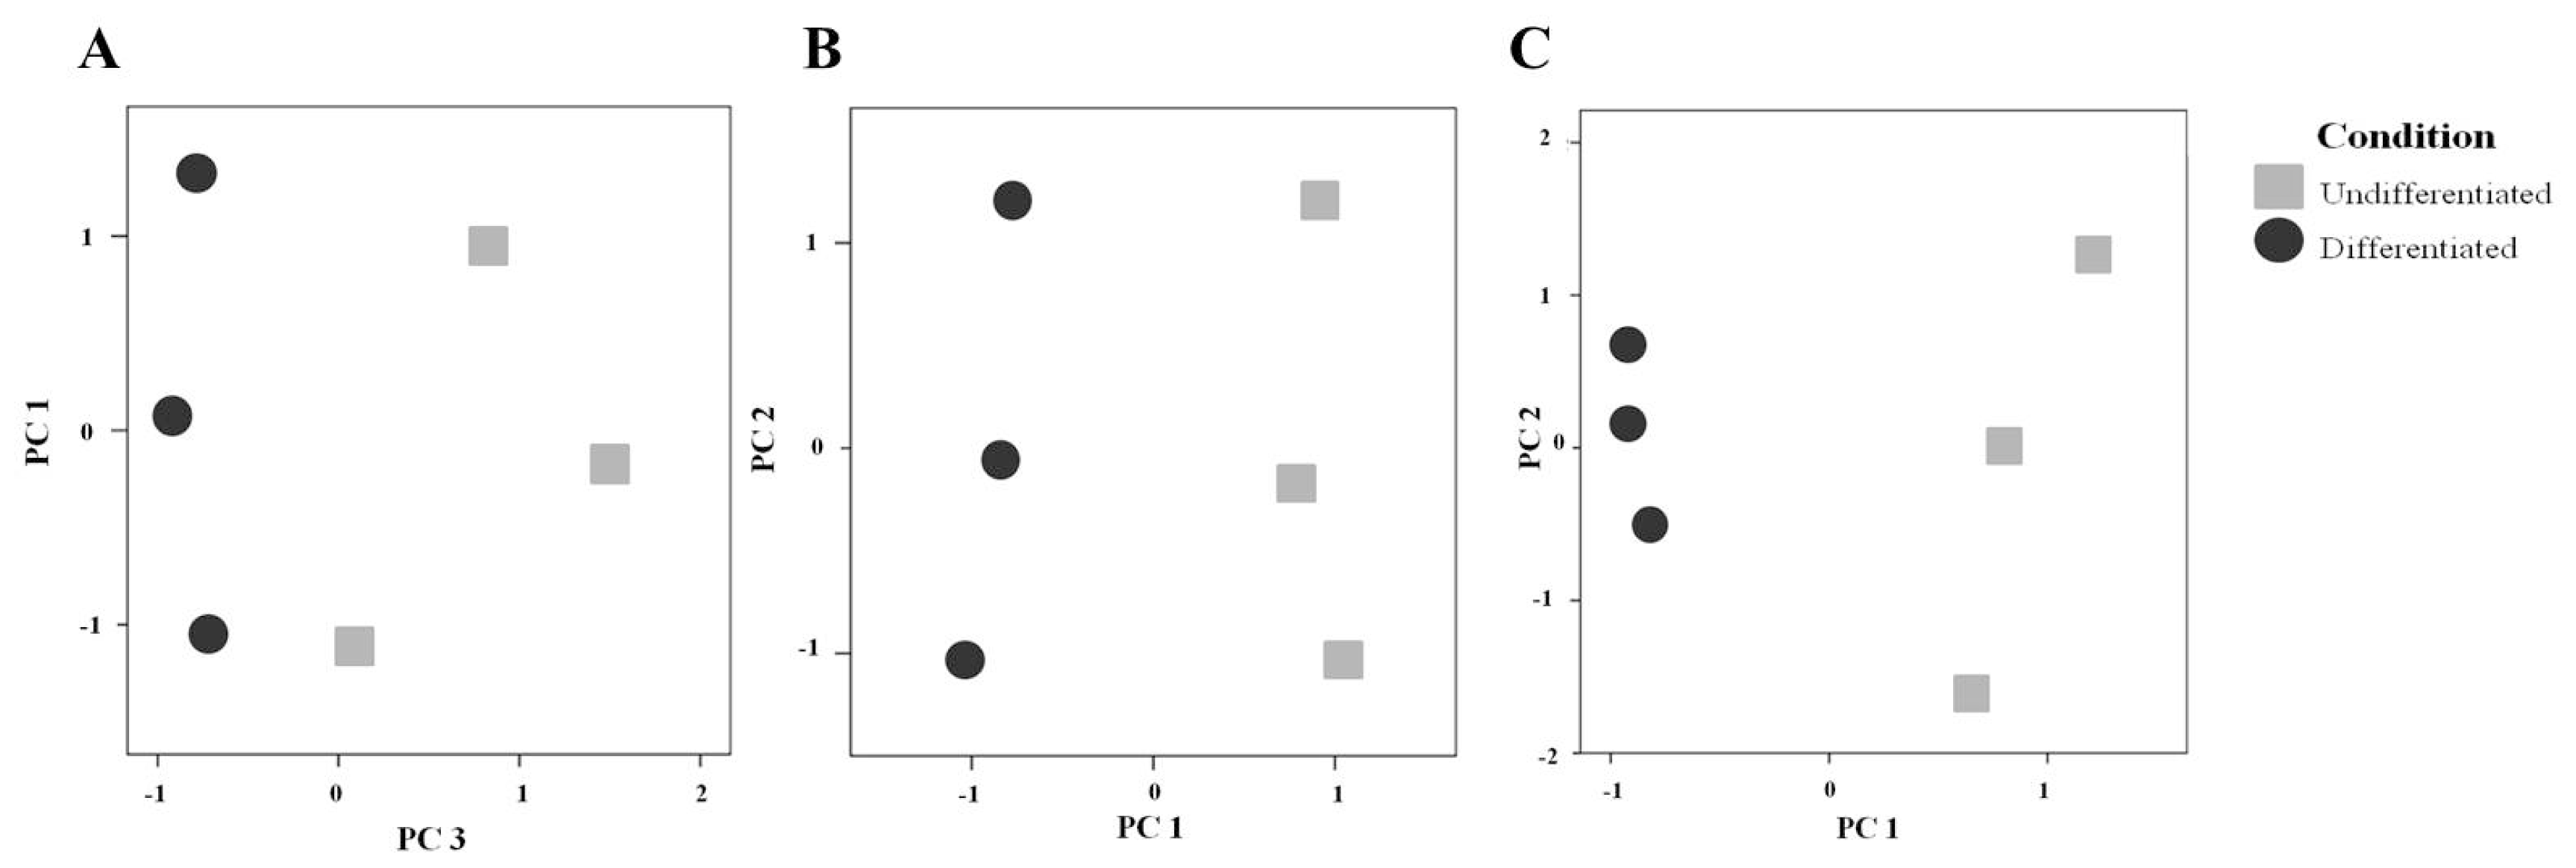
2.1. Differentiation of the Caco-2 Cell Line

In order to study the secretome of undifferentiated and differentiated cells, Caco-2 cell cultures were set up and allowed to differentiate as described before [3]. This was done in several parallel flasks, and repeated three times. The main advantage of this model, when compared with direct plasma or serum analyses, is that here only what the malignant cell (undifferentiated) or its counterpart (differentiated) secretes to the medium is detected, while in serum/plasma studies many detected proteins may not have been secreted by the malignant cells. On the other hand, the main drawback of this system is that cultured cells are serum-starved for 24 h, which induces stress on cells that become prone to spontaneous autolysis, resulting in non-specific release of intracellular proteins [26]. This could obscure the interpretation of results, though this phenomenon should affect both culture types and thus the non-specifically released proteins may not be detected as differential between them.
In the three experiments, we counted an average of 7.4 ± 1.6 million cells in the undifferentiated flasks, and 10.6 ± 2.2 million cells in the differentiated ones. When the secretome of these cells was obtained, the amount of protein recovered was 196.4 ± 10.4 μg for the undifferentiated cells, and 262.9 ± 17.1 μg for the differentiated ones. The secretome was visualized for both types of cells by monodimensional electrophoresis (Figure 1a) which demonstrates some differences in the secreted proteins patterns between undifferentiated and differentiated Caco-2 cells. To corroborate the differentiation process, we measured the specific activities of the enterocytic enzymes alkaline phosphatase and maltase after differentiation in three independent experiments, observing an average 6-fold and 14-fold increase, respectively (Figure 1b).

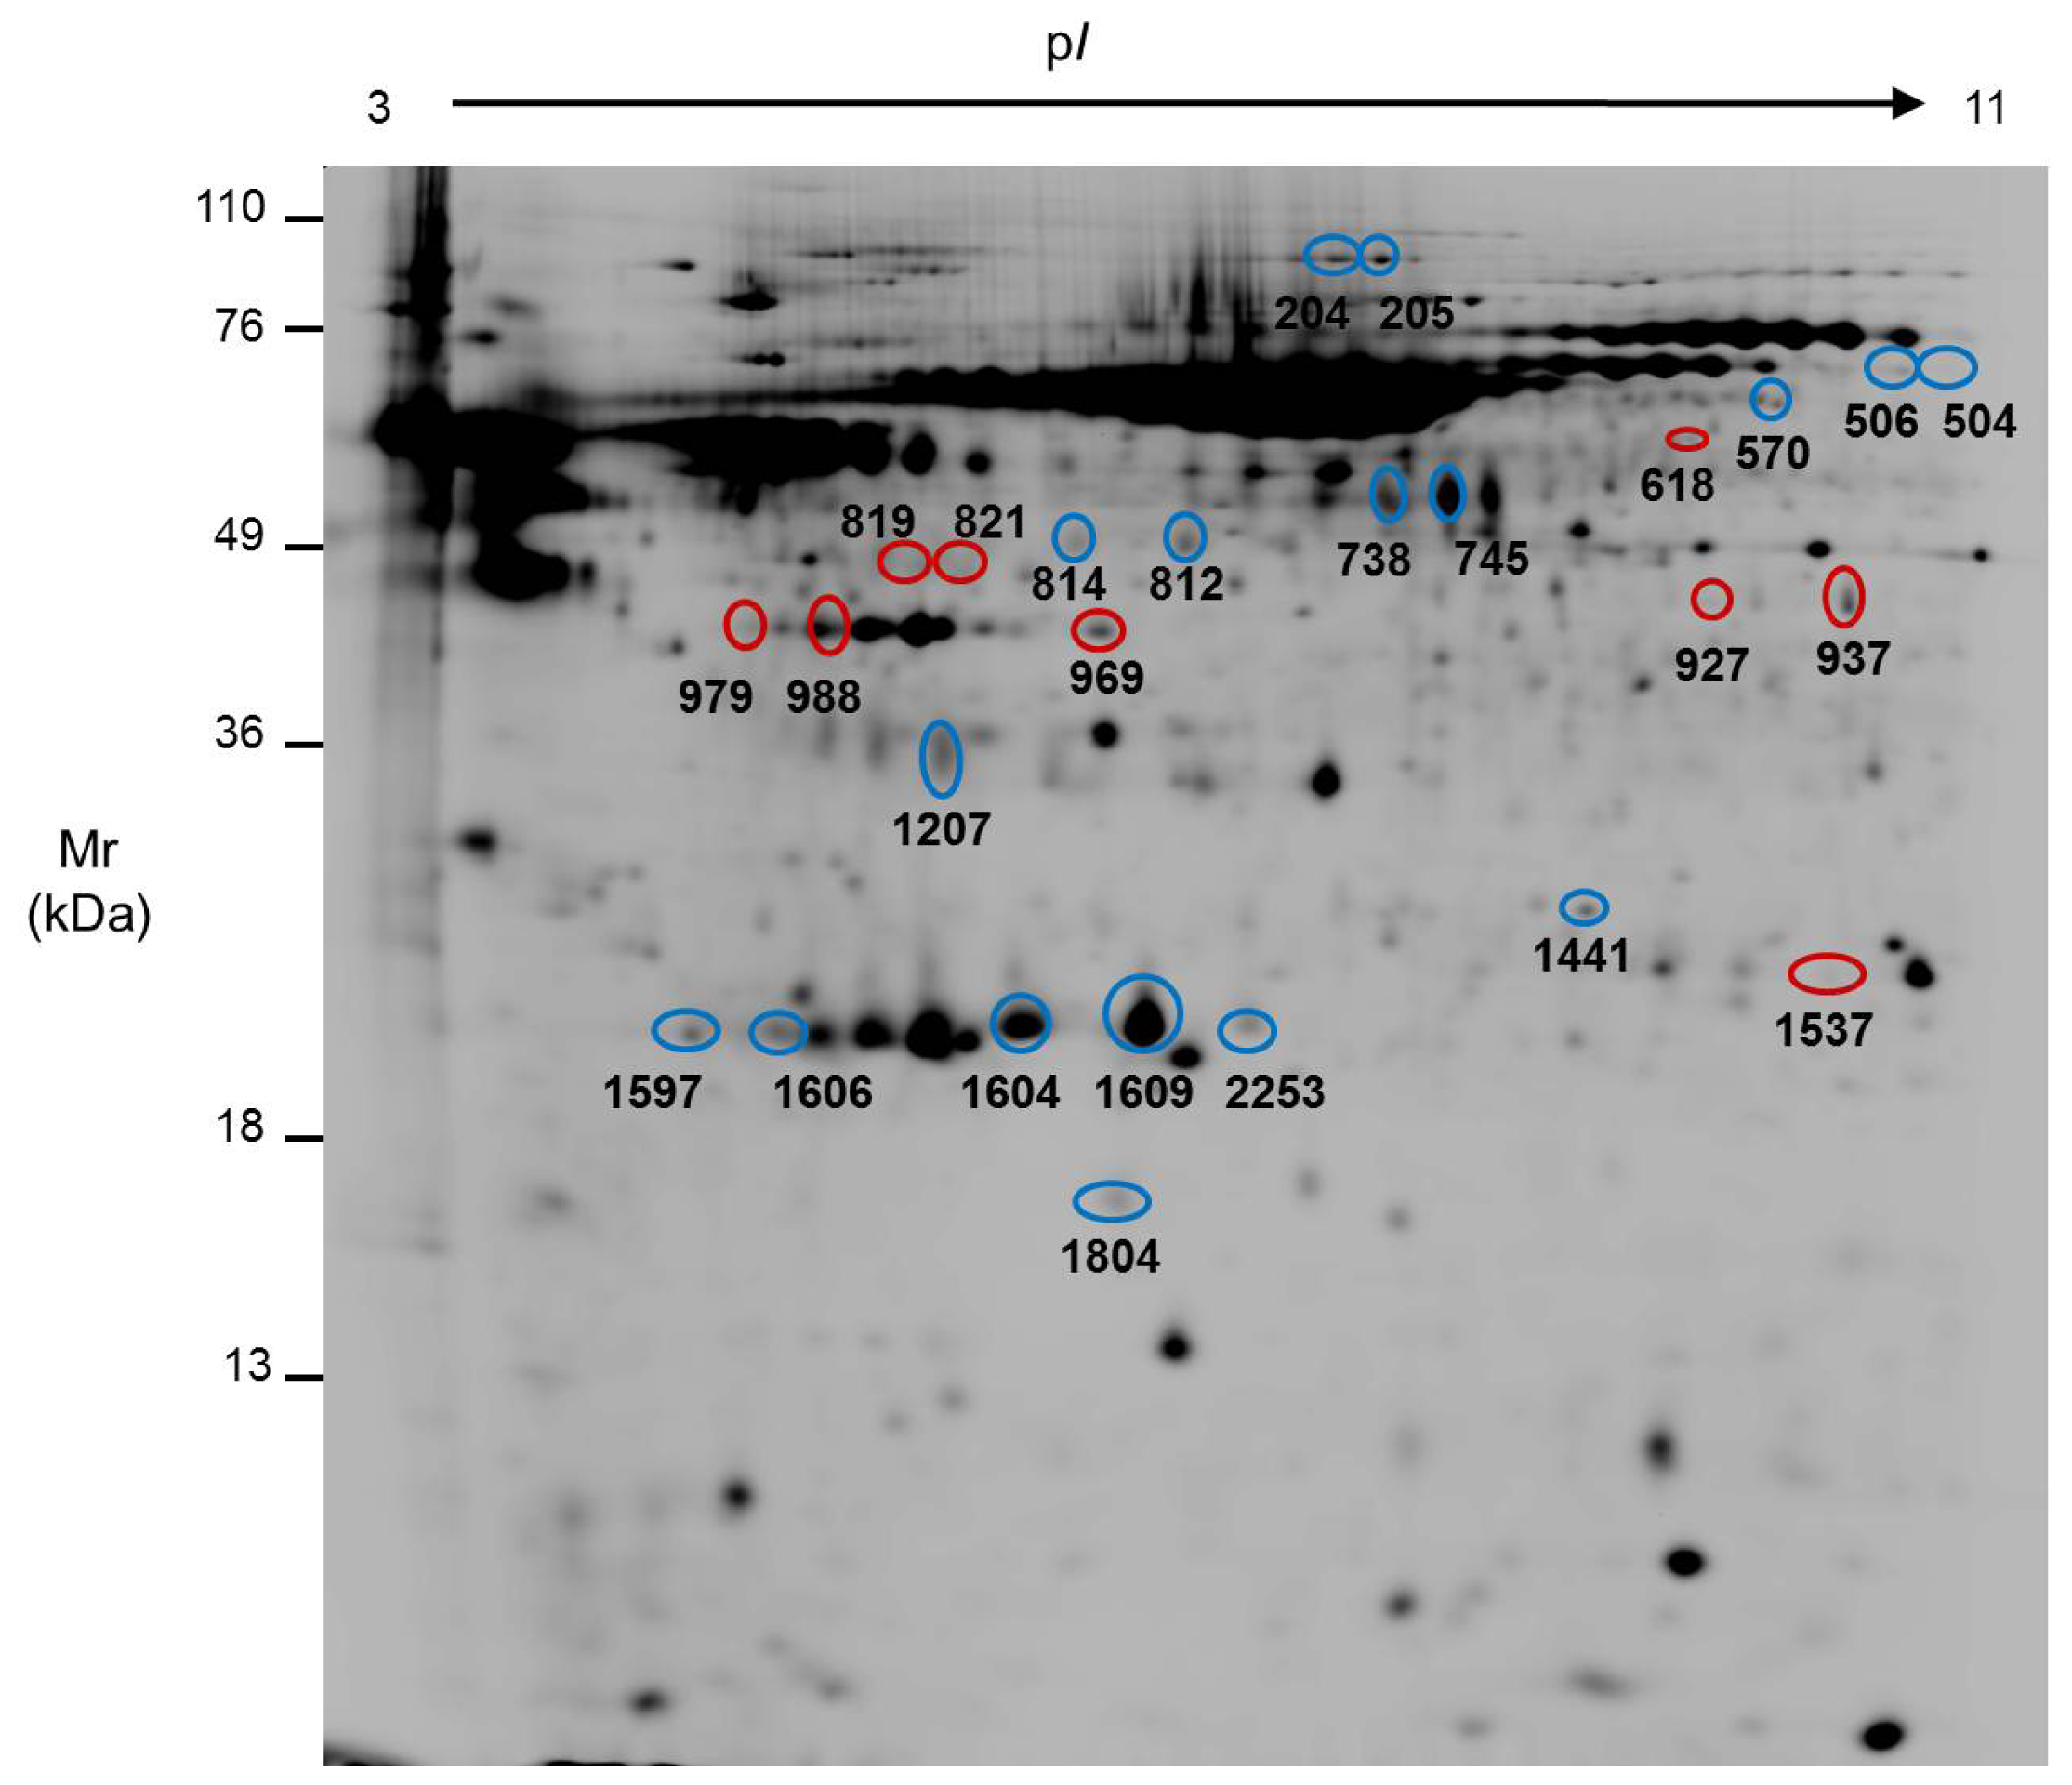
2.2. Comparison of the Secretome of Undifferentiated and Differentiated Caco-2 Cells

The DIGE technique was used for the analysis of the secretome of Caco-2 cells, before and after differentiation, in the three independent experiments. Following the DIGE experimental design, we combined one undifferentiated and one differentiated sample, plus a pooled internal standard, per gel. Therefore, we analyzed nine samples in three gels. In Figure 2, we show a representative image from one such gel. The samples were randomly distributed as stated in Table 1.
After acquiring the three images of each gel, the protein spots were detected and aligned by comparison with the internal standard. The number of spots detected and matched in each gel is shown in Table 1. More than 1600 distinct protein spots were detected in each gel. This result is in agreement with those described for other CRC cell lines. As an example, more than 1000 distinct spots have been detected in the secretome of SW480 cells [24], whereas the secretome of the cell line LIM1215 allowed detection of approximately 2000 spots by DIGE [27].
For the quantitative comparison, the abundance of each spot was made relative to the total amount of protein secreted by the number of live cells in the corresponding sample, and only the 919 spots detected in all the samples were considered. Applying the Mann-Whitney U test, we found 96 spots with significantly different abundance (p ≤ 0.05) in the secretome of Caco-2 undifferentiated and differentiated cells. From those spots, we were able to locate and cut 34 out of a preparative gel, and those were analyzed by mass spectrometry. Eventually, we identified the 26 spots highlighted in Figures 2 and 3, and summarized in Table 2. Four of them were identified as potential contaminants, and therefore not included in Table 2 (spot 812: mixture of human cytokeratin 1, keratin 9 and type I keratin 16; spots 819 and 821: bovine albumin; spot 1606: bovine apolipoprotein A–I). As an example of the variation in abundance, some of the identified spots are shown in Figure S1, where 3-D images have been drawn on the basis of the spot abundance after normalization. Noticeably, some of the proteins were identified in several different spots, probably due to their bearing different post-translational modifications.
Finally, we applied the multivariate test PCA on the spot abundances. When PCA was applied to the 919 spots detected in all samples, it allowed the discrimination of the secretome of the undifferentiated cells from that of the differentiated cells. The first three principal components (PCs) explained 85.5% of the variability between groups; PC3 was able to distinguish day 6 and day 20 samples (p ≤ 0.05 by Mann-Whitney U test) (Figure 4a). Interestingly, both PC1 and PC2 could separate the samples per gel, that is, samples run on the same gel obtained similar values for those PCs. This highlights the importance of using an internal standard to allow matching between different gels, and thus correcting for technical variations. PC1 and PC2 accounted for 70% of the variance, whereas PC3, responsible for the difference between sample groups, accounted for 15.5% of the variance. When the PCA was repeated with only the 96 spots found significantly altered after differentiation, we found that the first PC was significant and explained by 64% of the variance of the data, giving a neat separation between the cell states, as shown in Figure 4b. Even with the 22 identified spots, the first PC was significant and was able to explain 65% of the variance, separating samples from both undifferentiated and differentiated secretome, as shown in Figure 4c.
Among the proteins differently secreted by the Caco-2 cells before/after differentiation, we found enzymes involved in the glycoprotein metabolism (glucosidase II), carbohydrate metabolism (triose phosphate isomerase, NADP-dependent isocitrate dehydrogenase), energy metabolism (ATP synthase subunit beta, creatine kinase B), and detoxification (glutathione S-transferase omega-1), as well as lipid transport proteins (apolipoproteins A-I and A-IV, apolipoprotein E precursor) and proteins involved in hemostasis/tissue homeostasis (fibrinogen gamma chain). Considering the functions developed by those proteins, and the fact that alterations in their expression could be related to different physiological situations (as inflammation, starvation, exercise, etc.), they are likely to show low specificity as CRC biomarkers. Nevertheless, it is interesting to notice some of these proteins had been related before to the differentiation of Caco-2 cells, in particular by Stierum et al.[5] during the comparison of cellular lysates of Caco-2 cells before and after differentiation. In the case of the ATP synthase beta, these authors could not determine the direction of the change, while we found a higher amount (6.8 ratio) of the secreted form in undifferentiated cells. For the gluthathione S-transferase, Stierum et al. observed an up-regulation of the cytoplasmic form of the glutathione S-transferase A1, while we detected the form omega-1 with a 1.6 times higher amount in the secretome of undifferentiated cells. Higher secretion in the undifferentiated cells could be compatible with a smaller amount of protein retained in the cytoplasm in these cells, and therefore with increased intracellular expression in the differentiated cell lysates, as Stierum et al. reported. Another protein detected by these authors was the creatine kinase B, for which we found a higher amount of secretion in differentiated cells (ratio undifferentiated/differentiated = 0.3), while Stierum et al. found an upregulation followed by downregulation as the cells became differentiated. Finally, the triose phosphate isomerase was also identified in the lysates analyzed by Stierum et al., though its change was not determined. In our study, we found higher secretion of this enzyme in the differentiated cells.
In contrast to the proteins mentioned above, the translationally-controlled tumor protein, the transforming growth factor-beta-induced protein ig-h3, and the Niemann-Pick disease type C2 protein, seem to be the most interesting candidates as potential CRC biomarkers.
The translationally-controlled tumor protein (TCTP) was identified from one spot overexpressed in the secretome of undifferentiated cells, showing an average increase of 3-fold. This protein was first described in mouse tumor cells as a growth-related protein [28]. Despite its name, it is a highly conserved and ubiquitously expressed protein in all eukaryotes, highlighting its important role in the cell [29]. Although the TCTP functions are not well defined, previous studies demonstrated it is implicated in histamine release [30], calcium binding [31], and that it is anti-apoptotic [32]. Nowadays TCTP is described as a multifunctional protein that plays important roles in cell proliferation, immune response, tumorigenicity, and cell death, including apoptosis [29]. TCTP is secreted by different cell types, as macrophages [33] or human embryonic kidney cells [34]. Regarding CRC, the level of TCTP mRNA detected in three human colon carcinoma cell lines (SNUC2A, SNU-C4, and SNU-C5) suggests that a high TCTP mRNA expression in these cells could be related to the rapid cell growth and, therefore, a high potential of tumorigenesis [35]. Moreover, knockdown of TCTP inhibited proliferation, migration, and invasion activities in human colon adenocarcinoma LoVo cells [36]. Related to the cell line used on this work, Stierum et al.[5] observed the same trend on TCTP expression when comparing undifferentiated and differentiated Caco-2 cell lysates as we have now found in their secretome.
The transforming growth factor-beta-induced protein ig-h3 (TGFβIp) was identified from three different spots, all of them overexpressed in the undifferentiated Caco-2 cells. These different isoforms could be due to post-translational modifications, since at least 29 sites of vitamin K-dependent carboxylation have been described and annotated for this protein ( http://www.uniprot.org/uniprot/Q15582), as well as several phosphorylation sites ( http://www.phosphosite.org/proteinAction.do?id=3567117). TGFβIp, originally known as βig-h3, was first cloned as a TGF-β-induced gene on a human lung adenocarcinoma cell line [37]. It localizes to chromosome 5 (5q31) and consists of 17 exons that span around 34 kb [38]. The protein has 683 amino acids and contains a secretory signal. TGFβIp is not only induced by TGF-β, and other factors may be involved on its regulation. It appears in the extracellular matrix associated with collagen, fibronectin, laminin and glycosaminoglycans, and it supports the adhesion of many cell types by recruiting integrins [39]. This protein has been described both increased and decreased in tumors, but in particular it has shown an increased expression in CRC [4042]. TGFβIp could be involved in multiple aspects of tumorigenesis, including tumor progression, angiogenesis and metastasis, though its role is not yet clear. In colon cancer it has been demonstrated that ectopic expression of TGFβIp enhanced the aggressiveness and altered the metastatic properties of colon cancer cells in vivo, whereas inhibition of its expression dramatically reduced metastasis. Mechanistically, it appears to promote extravasation, a critical step in the metastatic dissemination of cancer cells [43]. Besides, TGFβIp levels on serum have been found to be elevated in pancreatic cancer [44].
The Niemann-Pick disease type C2 protein (NPC2) appeared as one spot with a 6-fold average elevation in the secretome of undifferentiated cells. NPC2 is a cholesterol-binding glycoprotein whose encoding gene is located in chromosome 14 [45]. It consists of a 151-amino acid sequence, and the mature protein has a molecular weight between 17 kDa and 20 kDa. NPC2 is highly conserved among major species, and it is present in fluids such as milk, epididymal fluid, bile, and plasma [4648]. NPC2 binds cholesterol with high affinity and was implicated in mediating intracellular cholesterol trafficking through the late endosomal/lysosomal compartment [49]. In addition, it has been shown that this protein plays an important role in the regulation of hematopoiesis [50] and immunity [51]. Recently, its implication in adipocyte differentiation [52] and fibroblast activation in disease pathogenesis [53] has been also described. To date there are no reports about any relationship with CRC, but an increased expression of the mRNA of this protein has been described in melanoma [54].
Noticeably, the proteins shown in Table 2 are either annotated in curated databases with a signal peptide, or can be predicted by computational methods to be secreted through non-classical pathways. The only exceptions are two proteins which nonetheless have been described in secretions by other authors. In particular, the creatine kinase B has been described in exosome-like vesicles released by intestinal epithelial cells [55] and in the conditioned medium of prostate cancer cell lines [56], whereas the glutathione S-transferase omega-1 has been described in the secretome of different cell lines including the colon cancer cells SW480 and SW620 [25].
Overall, the strategy we describe in the present study serves as a method for identifying proteins specifically altered in relation to colon tumorigenesis, and further studies are needed to validate their utility in serum as biomarkers for the disease.

3. Experimental Section

3.1. Cell Culture and Enterocytic Differentiation

The Caco-2 human colon adenocarcinoma cell line was purchased from the European Collection of Cell Cultures (ECACC No: 86010202). For routine growth we cultured them in 25 or 75 cm2 plastic flasks containing Dulbecco’s modified Eagle’s medium (DMEM) supplemented with 4.5 g/L glucose, 20% fetal calf serum (FCS), 100 units/mL of penicillin, 100 μg/mL of streptomycin, 2 mM l-glutamine, and 1% non-essential amino acids at 37 °C, in a 5%-CO2 humidified atmosphere. Cells were sub-cultured after reaching 90% confluence by treating them with a solution of 0.05% Trypsin/0.02% EDTA in PBS. The number of cells per flask was measured by counting them on a Neubauer chamber. Trypan blue was used as a stain to distinguish between dead and living cells.
For differentiation experiments, pre-confluent cultures were disrupted with trypsin, cells were seeded on 75 cm2 flasks at 12,000 cells/cm2. Medium was changed every day after 48 h of seeding. Considering the descriptions of Pinto et al.[3] and Rousset et al.[4], and the values of differentiation marker enzymes, we selected day 6 as the undifferentiated state and day 20 as the differentiated one.

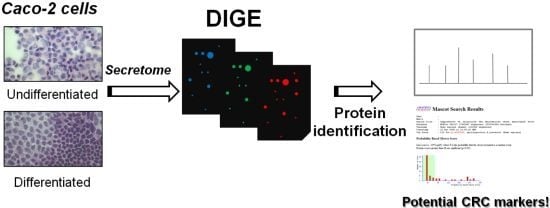
3.2. Enzymatic Assays

The process of enterocytic differentiation was evaluated through the assay of marker enzymes as the alkaline phosphatase and the maltase. For these assays, cells were harvested by scraping, washed with PBS, pelleted and re-suspended in ice-cold ultrapure water with protease inhibitors (Complete Mini tablets, Roche). Re-suspended pellets were placed on ice for 5 min, homogenized with a Potter-Elvehjem, and then frozen at −80 °C.
The alkaline phosphatase activity (EC 3.1.3.1) was measured with the method described by Engstrom [57]. As substrate we used 16 mM para-nitrophenyl phosphate in pH 9.8 50 mM sodium borax buffer plus 1 M MgCl2; 200 μL of substrate were mixed with 50 μL of sample and incubated at 37 °C for 30 min. The reaction was stopped by adding 0.6 mL of 0.25 M NaOH. The mixture was centrifuged at 700 g for 5 min and the optical density (OD) at 410 nm was measured.
The maltase activity (EC 3.2.1.20) was measured following the method of Dahlqvist [58], where maltose served as the substrate. For the assay, 40 μL of sample where incubated with 40 μL of 55 mM maltose in 0.1 M maleate buffer pH 6.0 for 1 h at 37 °C. The glucose generated from the maltose was measured using a commercial enzymatic test (Spinreact) based on the method described by Trinder [59,60].
Protein concentrations were determined using the Bradford microassay [61] and results were expressed as specific activity.

3.3. Secretome Collection and Preparation

To study the extracellular medium, cells were kept in FCS-free medium for 24 h before collection [62]. After 24 h, medium was collected and centrifuged at 600 g for 5 min, so that particles on suspension were discarded with the pellet. The medium was then dialyzed for 24 h against ultrapure water (cut-off: 12–14 kDa), freeze-dried on a Christ Alpha 2–4 equipment and kept at −80 °C.

3.4. SDS-PAGE

For monodimensional electrophoresis, 10 μg of total protein were separated in 10% (v/v) polyacrylamide (30% T, 2.6% C) denaturing minigels [63]. Gels were stained with Coomassie brilliant blue for protein visualization.

3.5. Differential In-Gel Electrophoresis (DIGE)

Dried medium was reconstituted on ultrapure water and cleaned using 2-D CleanUp Kit (GE-Healthcare). Pellets were diluted on lysis buffer (8 M urea, 2 M thiourea, 4% (w/v) CHAPS and 30 mM Tris) and the protein concentration was measured using a modified Bradford method [64]. An internal standard was prepared by pooling equivalent amounts of protein from each of the six samples included in the experiment. Stock solutions for the cyanine dyes were reconstituted in N,N′-dimethylformamide (DMF) keeping the proportion CyDye:DMF at 1:1.5 to obtain the working solution. Cy2 was used for labeling the internal standard, while Cy3 and Cy5 were randomized between undifferentiated and differentiated samples (Table 1). For each sample, 50 μg of protein were labeled with 200 pmol of the correspondent Cy dye in ice for 30 min. Labeling was terminated by adding 1 μL of 10 mM lysine and incubating 10 min in ice.
For the 2-DE separation, a mixture of the Cy2-, Cy3- and Cy5-labeled samples (150 μg), was applied on pH 3–11, 24-cm non-linear Immobiline Dry Strips (GE Healthcare) by cup loading. Isoelectric focusing (IEF) followed this program: 1 h at 120 V, 2 h at 500 V, 2 h at 1000 V, 16 h at 5000 V, and a final holding step of 500 V for no longer than 10 h using the Ettan IPGphor (GE Healthcare). After IEF, strips were equilibrated for 12 min with 6 M urea, 100 mM Tris, 30% (w/v) glycerol, 2% (w/v) SDS and 0.5% (w/v) DTT; then for 6 min with 6 M urea, 100 mM Tris, 30% (w/v) glycerol, 2% (w/v) SDS and 4.5% (w/v) IAA. The second dimension was run on 10% polyacrylamide gels (30% T; 2.6% C) for 17 h at 2 W/gel.

3.6. Image Acquisition and Computer Analysis of Electrophoretic Patterns

Three images per gel were acquired with the Typhoon 4900 Imager (GE Healthcare) with the appropriate excitation and emission wavelengths for each of the three dyes. Protein patterns for each sample were then analyzed with the software SameSpots (GE Healthcare). Abundances were given as normalized intensity values corrected by a factor consistent in the total protein quantity of the secretome (μg) divided by the number of cells (in millions) in it, which allowed us to compare the amount of protein secreted by each cell instead of just its proportion in the total pool of proteins.

3.7. Statistical and Computational Methods

In order to choose the spots which expression showed significant abundance variation, we applied the non-parametric Mann-Whitney U test. Multivariate studies were done through principal component analysis (PCA) as described before [65]. All analyses were performed with SPSS (release 16) and p values ≤ 0.05 were considered statistically significant.
For the proteins identified, we investigated if they had a classical signal peptide annotated in www.uniprot.org. Besides, we employed the Secretome 2.0 Server to predict secretion through a non-classical route [66].

3.8. Protein Identification by Mass Spectrometry

Selected spots were cut out from Coomassie-stained gels, reduced, alkylated and in-gel digested with 10 μg/mL trypsin in 25 mM ammonium bicarbonate at 37 °C overnight. Peptides were eluted with 5% (v/v) trifluoroacetic acid and 75% (v/v) acetonitrile. Samples were mixed with a matrix of 5 mg/mL α-cyano-4-hydroxycinnamic acid in 50% (v/v) acetonitrile. The mixture was analyzed by matrix-assisted laser desorption/ionization-time of flight (MALDI-TOF), in a 4800 Proteomics Analyzer (Applied Biosystems) by peptide mass fingerprinting (PMF). When proteins were not identified by this method, peptides were further fragmented (MALDI-TOF/TOF) and analyzed by sequence query (SQ). Database searching was done with the MASCOT Daemon search engine (Matrix Science) against the human nrNCBI database. Search parameters were stated as follows: enzyme trypsin; allowance of 1 missed cleavage; propionamide as fixed modification; methionine oxidation as variable modification; 50 ppm of peptide mass tolerance for PMF; 100 ppm peptide mass tolerance and 0.3 Da fragment mass tolerance for SQ. Protein hits were considered significant when the protein score was above the p ≤ 0.05 threshold, with at least two significant peptides.

4. Conclusions

Although gel-based proteomic techniques are being rapidly superseded by MS methods, the DIGE technology is still a powerful tool for comparative quantitative studies. In this work, it was applied to the analysis of the secretome of Caco-2 cells resembling tumoral and healthy enterocytes. From the 96 proteins differentially expressed in the tumor-like cells, we could identify 15 proteins, among which TCTP, TGFβIp and NPC2 seem to be promising candidates for serum studies of CRC detection. Further work will investigate whether these proteins show different levels in the serum of healthy individuals and CRC patients in different stages of the disease, probing the utility of these molecules as diagnostic markers for CRC.

Supplementary Information

ijms-13-14401-s001.pdf

Acknowledgments

This work was supported by grants from Xunta de Galicia and FEDER funding (10 PXIB 310 215 PR, CN2011/024). A.G.L. and A.M.R.P. were supported by the María Barbeito and the Angeles Alvariño programs (Xunta de Galicia).
  • Conflict of InterestThe authors declare no conflict of interest.

References

  1. Schnekenburger, M.; Diederich, M. Epigenetics offer new horizons for colorectal cancer prevention. Curr. Colorectal Cancer Rep 2012, 8, 66–81. [Google Scholar]
  2. Søreide, K.; Nedrebo, B.S.; Knapp, J.C.; Glomsaker, T.B.; Søreide, J.A.; Korner, H. Evolving molecular classification by genomic and proteomic biomarkers in colorectal cancer: Potential implications for the surgical oncologist. Surg. Oncol 2009, 18, 31–50. [Google Scholar]
  3. Pinto, M.; Robin-Leon, S.; Appay, M.D.; Kedinger, M.; Triadou, N.; Dussaulx, E.; Lacroix, B.; Simon-Assman, P.; Haffen, K.; Fogh, J.; et al. Enterocyte-like differentiation and polarization of the human colon carcinoma cell line Caco-2 in culture. Biol. Cell 1983, 47, 323–330. [Google Scholar]
  4. Rousset, M.; Laburthe, M.; Pinto, M.; Chevalier, G.; Rouyer-Fessard, C.; Dussaulx, E.; Trugnan, G.; Boige, N.; Brun, J.L.; Zweibaum, A. Enterocytic differentiation and glucose utilization in the human colon tumor cell line Caco-2: Modulation by forskolin. J. Cell Physiol 1985, 123, 377–385. [Google Scholar]
  5. Stierum, R.; Gaspari, M.; Dommels, Y.; Ouatas, T.; Pluk, H.; Jespersen, S.; Vogels, J.; Verhoeckx, K.; Groten, J.; van Ommen, B. Proteome analysis reveals novel proteins associated with proliferation and differentiation of the colorectal cancer cell line Caco-2. Biochim. Biophys. Acta 2003, 1650, 73–91. [Google Scholar]
  6. Buhrke, T.; Lengler, I.; Lampen, A. Analysis of proteomic changes induced upon cellular differentiation of the human intestinal cell line Caco-2. Dev. Growth. Differ 2011, 53, 411–426. [Google Scholar]
  7. Hauck, W.; Stanners, C.P. Control of carcinoembryonic antigen gene family expression in a differentiating colon carcinoma cell line, Caco-2. Cancer Res 1991, 51, 3526–3533. [Google Scholar]
  8. Volmer, M.W.; Radacz, Y.; Hahn, S.A.; Klein-Scory, S.; Stühler, K.; Zapatka, M.; Schmiegel, W.; Meyer, H.E.; Schwarte-Waldhoff, I. Tumor suppressor Smad4 mediates downregulation of the anti-adhesive invasion-promoting matricellular protein SPARC: Landscaping activity of Smad4 as revealed by a “secretome” analysis. Proteomics 2004, 4, 1324–1334. [Google Scholar]
  9. Wu, C.C.; Chien, K.Y.; Tsang, N.M.; Chang, K.P.; Hao, S.P.; Tsao, C.H.; Chang, Y.S.; Yu, J.S. Cancer cell-secreted proteomes as a basis for searching potential tumor markers: Nasopharyngeal carcinoma as a model. Proteomics 2005, 5, 3173–3182. [Google Scholar]
  10. Wu, C.C.; Chen, H.C.; Chen, S.J.; Liu, H.P.; Hsieh, Y.Y.; Yu, C.J.; Tang, R.; Hsieh, L.L.; Yu, J.S.; Chang, Y.S. Identification of collapsin response mediator protein-2 as a potential marker of colorectal carcinoma by comparative analysis of cancer cell secretomes. Proteomics 2008, 8, 316–332. [Google Scholar]
  11. Tonge, R.; Shaw, J.; Middleton, B.; Rowlinson, R.; Rayner, S.; Young, J.; Pognan, F.; Hawkins, E.; Currie, I.; Davison, M. Validation and development of fluorescence two-dimensional differential gel electrophoresis proteomics technology. Proteomics 2001, 1, 377–396. [Google Scholar]
  12. Alban, A.; David, S.O.; Bjorkesten, L.; Andersson, C.; Sloge, E.; Lewis, S.; Currie, I. A novel experimental design for comparative two-dimensional gel analysis: Two-dimensional difference gel electrophoresis incorporating a pooled internal standard. Proteomics 2003, 3, 36–44. [Google Scholar]
  13. Unlü, M.; Morgan, M.E.; Minden, J.S. Difference gel electrophoresis: A single gel method for detecting changes in protein extracts. Electrophoresis 1997, 18, 2071–2077. [Google Scholar]
  14. Friedman, D.B.; Hill, S.; Keller, J.W.; Merchant, N.B.; Levy, S.E.; Coffey, R.J.; Caprioli, R.M. Proteome analysis of human colon cancer by two-dimensional difference gel electrophoresis and mass spectrometry. Proteomics 2004, 4, 793–811. [Google Scholar]
  15. Alfonso, P.; Núñez, A.; Madoz-Gurpide, J.; Lombardia, L.; Sánchez, L.; Casal, J.I. Proteomic expression analysis of colorectal cancer by two-dimensional differential gel electrophoresis. Proteomics 2005, 5, 2602–2611. [Google Scholar]
  16. Rodríguez-Pineiro, A.M.; Rodríguez-Berrocal, F.J.; Páez de la Cadena, M. Detection of proteins altered in serum of patients with colorectal cancer by differential in-gel electrophoresis. Revista Real Academia Galega de Ciencias 2006, XXV, 5–25. [Google Scholar]
  17. Seike, M.; Kondo, T.; Fujii, K.; Yamada, T.; Gemma, A.; Kudoh, S.; Hirohashi, S. Proteomic signature of human cancer cells. Proteomics 2004, 4, 2776–2788. [Google Scholar]
  18. Corbo, C.; Orrù, S.; Gemei, M.; Noto, R.D.; Mirabelli, P.; Imperlini, E.; Ruoppolo, M.; Vecchio, L.D.; Salvatore, F. Protein cross-talk in CD133+ colon cancer cells indicates activation of the Wnt pathway and upregulation of SRp20 that is potentially involved in tumorigenicity. Proteomics 2012, 12, 2045–2059. [Google Scholar]
  19. Zeiser, J.J.; Klodmann, J.; Braun, H.P.; Gerhard, R.; Just, I.; Pich, A. Effects of Clostridium difficile Toxin A on the proteome of colonocytes studied by differential 2D electrophoresis. J. Proteomics 2011, 75, 469–479. [Google Scholar]
  20. Turck, N.; Richert, S.; Gendry, P.; Stutzmann, J.; Kedinger, M.; Leize, E.; Simon-Assmann, P.; Van Dorsselaer, A.; Launay, J.F. Proteomic analysis of nuclear proteins from proliferative and differentiated human colonic intestinal epithelial cells. Proteomics 2004, 4, 93–105. [Google Scholar]
  21. Pshezhetsky, A.V.; Fedjaev, M.; Ashmarina, L.; Mazur, A.; Budman, L.; Sinnett, D.; Labuda, D.; Beaulieu, J.F.; Ménard, D.; Nifant’ev, I.; et al. Subcellular proteomics of cell differentiation: Quantitative analysis of the plasma membrane proteome of Caco-2 cells. Proteomics 2007, 7, 2201–2215. [Google Scholar]
  22. Mariadason, J.M.; Arango, D.; Corner, G.A.; Arañes, M.J.; Hotchkiss, K.A.; Yang, W.; Augenlicht, L.H. A gene expression profile that defines colon cell maturation in vitro. Cancer Res 2002, 62, 4791–4804. [Google Scholar]
  23. Tremblay, E.; Auclair, J.; Delvin, E.; Levy, E.; Ménard, D.; Pshezhetsky, A.V.; Rivard, N.; Seidman, E.G.; Sinnett, D.; Vachon, P.H.; et al. Gene expression profiles of normal proliferating and differentiating human intestinal epithelial cells: A comparison with the Caco-2 cell model. J. Cell. Biochem 2006, 99, 1175–1186. [Google Scholar]
  24. Volmer, M.W.; Stühler, K.; Zapatka, M.; Schöneck, A.; Klein-Scory, S.; Schmiegel, W.; Meyer, H.E.; Schwarte-Waldhoff, I. Differential proteome analysis of conditioned media to detect Smad4 regulated secreted biomarkers in colon cancer. Proteomics 2005, 5, 2587–2601. [Google Scholar]
  25. Xue, H.; Lü, B.; Zhang, J.; Wu, M.; Huang, Q.; Wu, Q.; Sheng, H.; Wu, D.; Hu, J.; Lai, M. Identification of serum biomarkers for colorectal cancer metastasis using a differential secretome approach. J. Proteome Res 2010, 9, 545–555. [Google Scholar]
  26. Mbeunkui, F.; Metge, B.J.; Shevde, L.A.; Pannell, L.K. Identification of differentially secreted biomarkers using LC-MS/MS in isogenic cell lines representing a progression of breast cancer. J. Proteome Res 2007, 6, 2993–3002. [Google Scholar]
  27. Ji, H.; Greening, D.W.; Kapp, E.A.; Moritz, R.L.; Simpson, R.J. Secretome-based proteomics reveals sulindac-modulated proteins released from colon cancer cells. Proteomics Clin. Appl 2009, 3, 433–451. [Google Scholar]
  28. Yenofsky, R.; Cereghini, S.; Krowczynska, A.; Brawerman, G. Regulation of mRNA utilization in mouse erythroleukemia cells induced to differentiate by exposure to dimethyl sulfoxide. Mol. Cell. Biol 1983, 3, 1197–1203. [Google Scholar]
  29. Nagano-Ito, M.; Ichikawa, S. Biological effects of Mammalian translationally controlled tumor protein (TCTP) on cell death, proliferation, and tumorigenesis. Biochem. Res. Int 2012, 2012, 204960–204966. [Google Scholar]
  30. MacDonald, S.M.; Paznekas, W.A.; Jabs, E.W. Chromosomal localization of tumor protein, translationally-controlled 1 (TPT1) encoding the human histamine releasing factor (HRF) to 13q12→q14. Cytogenet. Cell. Genet 1999, 84, 128–129. [Google Scholar]
  31. Arcuri, F.; Papa, S.; Carducci, A.; Romagnoli, R.; Liberatori, S.; Riparbelli, M.G.; Sanchez, J.C.; Tosi, P.; del Vecchio, M.T. Translationally controlled tumor protein (TCTP) in the human prostate and prostate cancer cells: Expression, distribution, and calcium binding activity. Prostate 2004, 60, 130–140. [Google Scholar]
  32. Li, F.; Zhang, D.; Fujise, K. Characterization of fortilin, a novel antiapoptotic protein. J. Biol. Chem 2001, 276, 47542–47549. [Google Scholar]
  33. Teshima, S.; Rokutan, K.; Nikawa, T.; Kishi, K. Macrophage colony-stimulating factor stimulates synthesis and secretion of a mouse homolog of a human IgE-dependent histamine-releasing factor by macrophages in vitro and in vivo. J. Immunol 1998, 161, 6356–6366. [Google Scholar]
  34. Amzallag, N.; Passer, B.J.; Allanic, D.; Segura, E.; Théry, C.; Goud, B.; Amson, R.; Telerman, A. TSAP6 facilitates the secretion of translationally controlled tumor protein/histamine-releasing factor via a nonclassical pathway. Biol. Chem 2004, 279, 46104–46112. [Google Scholar]
  35. Chung, S.; Kim, M.; Choi, W.J.; Chung, J.K.; Lee, K. Expression of translationally controlled tumor protein mRNA in human colon cancer. Cancer Lett 2000, 156, 185–190. [Google Scholar]
  36. Ma, Q.; Geng, Y.; Xu, W.; Wu, Y.; He, F.; Shu, W.; Huang, M.; Du, H.; Li, M. The role of translationally controlled tumor protein in tumor growth and metastasis of colon adenocarcinoma cells. J. Proteome Res 2010, 9, 40–49. [Google Scholar]
  37. Skonier, J.; Neubauer, M.; Madisen, L.; Bennett, K.; Plowman, G.D.; Purchio, A.F. cDNA cloning and sequence analysis of beta ig-h3, a novel gene induced in a human adenocarcinoma cell line after treatment with transforming growth factor-beta. DNA Cell Biol 1992, 11, 511–522. [Google Scholar]
  38. Skonier, J.; Bennett, K.; Rothwell, V.; Kosowski, S.; Plowman, G.; Wallace, P.; Edelhoff, S.; Disteche, C.; Neubauer, M.; Marquardt, H. Beta ig-h3: A transforming growth factor-beta-responsive gene encoding a secreted protein that inhibits cell attachment in vitro and suppresses the growth of CHO cells in nude mice. DNA Cell Biol 1994, 13, 571–584. [Google Scholar]
  39. Thapa, N.; Lee, B.H.; Kim, I.S. TGFBIp/betaig-h3 protein: A versatile matrix molecule induced by TGF-beta. Int. J. Biochem. Cell Biol 2007, 39, 2183–2194. [Google Scholar]
  40. Kitahara, O.; Furukawa, Y.; Tanaka, T.; Kihara, C.; Ono, K.; Yanagawa, R.; Nita, M.E.; Takagi, T.; Nakamura, Y.; Tsunoda, T. Alterations of gene expression during colorectal carcinogenesis revealed by cDNA microarrays after laser-capture microdissection of tumor tissues and normal epithelia. Cancer Res 2001, 61, 3544–3559. [Google Scholar]
  41. Buckhaults, P.; Rago, C.; St Croix, B.; Romans, K.E.; Saha, S.; Zhang, L.; Vogelstein, B.; Kinzler, K.W. Secreted and cell surface genes expressed in benign and malignant colorectal tumors. Cancer Res 2001, 61, 6996–7001. [Google Scholar]
  42. Roessler, M.; Rollinger, W.; Palme, S.; Hagmann, M.L.; Berndt, P.; Engel, A.M.; Schneidinger, B.; Pfeffer, M.; Andres, H.; Karl, J.; et al. Identification of nicotinamide N-methyltransferase as a novel serum tumor marker for colorectal cancer. Clin. Cancer Res 2005, 11, 6550–6557. [Google Scholar]
  43. Ma, C.; Rong, Y.; Radiloff, D.R.; Datto, M.B.; Centeno, B.; Bao, S.; Cheng, A.W.; Lin, F.; Jiang, S.; Yeatman, T.J.; et al. Extracellular matrix protein betaig-h3/TGFBI promotes metastasis of colon cancer by enhancing cell extravasation. Genes Dev 2008, 22, 308–321. [Google Scholar]
  44. Chang, Y.T.; Wu, C.C.; Shyr, Y.M.; Chen, T.C.; Hwang, T.L.; Yeh, T.S.; Chang, K.P.; Liu, H.P.; Liu, Y.L.; Tsai, M.H.; et al. Secretome-based identification of ULBP2 as a novel serum marker for pancreatic cancer detection. PLoS One 2011, 6, e20029. [Google Scholar]
  45. Naureckiene, S.; Sleat, D.E.; Lackland, H.; Fensom, A.; Vanier, M.T.; Wattiaux, R.; Jadot, M.; Lobel, P. Identification of HE1 as the second gene of Niemann-Pick C disease. Science 2000, 290, 2298–2301. [Google Scholar]
  46. Larsen, L.B.; Ravn, P.; Boisen, A.; Berglund, L.; Petersen, T.E. Primary structure of EPV20, a secretory glycoprotein containing a previously uncharacterized type of domain. Eur. J. Biochem 1997, 243, 437–441. [Google Scholar]
  47. Kirchhoff, C.; Osterhoff, C.; Young, L. Molecular cloning and characterization of HE1, a major secretory protein of the human epididymis. Biol. Reprod 1996, 54, 847–856. [Google Scholar]
  48. Klein, A.; Amigo, L.; Retamal, M.J.; Morales, M.G.; Miquel, J.F.; Rigotti, A.; Zanlungo, S. NPC2 is expressed in human and murine liver and secreted into bile: Potential implications for body cholesterol homeostasis. Hepatology 2006, 43, 126–133. [Google Scholar]
  49. Storch, J.; Xu, Z. Niemann-Pick C2 (NPC2) and intracellular cholesterol trafficking. Biochim. Biophys. Acta 2009, 1791, 671–678. [Google Scholar]
  50. Heo, K.; Jariwala, U.; Woo, J.; Zhan, Y.; Burke, K.A.; Zhu, L.; Anderson, W.F.; Zhao, Y. Involvement of Niemann-Pick type C2 protein in hematopoiesis regulation. Stem Cells 2006, 24, 1549–1555. [Google Scholar]
  51. Schrantz, N.; Sagiv, Y.; Liu, Y.; Savage, P.B.; Bendelac, A.; Teyton, L. The Niemann-Pick type C2 protein loads isoglobotrihexosylceramide onto CD1d molecules and contributes to the thymic selection of NKT cells. J. Exp. Med 2007, 204, 841–852. [Google Scholar]
  52. Csepeggi, C.; Jiang, M.; Frolov, A. Somatic cell plasticity and Niemann-Pick type C2 protein: Adipocyte differentiation and function. J. Biol. Chem 2010, 285, 30347–30354. [Google Scholar]
  53. Csepeggi, C.; Jiang, M.; Kojima, F.; Crofford, L.J.; Frolov, A. Somatic cell plasticity and Niemann-Pick type C2protein. J. Biol. Chem 2011, 286, 2078–2087. [Google Scholar]
  54. McDonald, S.L.; Edington, H.D.; Kirkwood, J.M.; Becker, D. Expression analysis of genes identified by molecular profiling of VGP melanomas and MGP melanoma-positive lymph nodes. Cancer Biol. Ther 2004, 3, 110–120. [Google Scholar]
  55. Van Niel, G.; Raposo, G.; Candalh, C.; Boussac, M.; Hershberg, R.; Cerf-Bensussan, N.; Heyman, M. Intestinal epithelial cells secrete exosome-like vesicles. Gastroenterology 2001, 121, 337–349. [Google Scholar]
  56. Pang, B.; Zhang, H.; Wang, J.; Chen, W.Z.; Li, S.H.; Shi, Q.G.; Liang, R.X.; Xie, B.X.; Wu, R.Q.; Qian, X.L.; et al. Ubiquitous mitochondrial creatine kinase is overexpressed in the conditioned medium and the extract of LNCaP lineaged androgen independent cell lines and facilitates prostate cancer progression. Prostate 2009, 69, 1176–1187. [Google Scholar]
  57. Engstrom, L. Alkaline and acid phosphatase. In Preparative Centrifugation. A Practical Approach; Rickwood, D., Hames, B.D., Eds.; IRL Press: Oxford, UK, 1992; p. 375. [Google Scholar]
  58. Dahlqvist, A. Assay of intestinal disaccharidases. Scand. J. Clin. Lab. Invest 1984, 44, 169–172. [Google Scholar]
  59. Trinder, P. Determination of blood glucose using an oxidase-peroxidase system with a non-carcinogenic chromogen. J. Clin. Pathol 1969, 22, 158–161. [Google Scholar]
  60. Trinder, P. Determination of blood glucose using 4-amino phenazone as oxygen acceptor. J. Clin. Pathol 1969, 22, 246. [Google Scholar]
  61. Bradford, M.M. A rapid and sensitive method for the quantitation of microgram quantities of protein utilizing the principle of protein-dye binding. Anal. Biochem 1976, 72, 248–254. [Google Scholar]
  62. Beyer, E.; Ivleva, T.; Artykova, G.; Wiederschain, G. Change of isoforms’ spectra of alpha-l-fucosidase from human skin fibroblasts in intracellular storage of non hydrolyzable substances. Biochim. Biophys. Acta 1995, 1270, 7–11. [Google Scholar]
  63. Laemmli, U.K. Cleavage of structural proteins during the assembly of the head of bacteriophage T4. Nature 1970, 227, 680–685. [Google Scholar]
  64. Ramagli, L.S.; Rodriguez, V.S. Quantitation of microgram amounts of protein in two-dimensional polyacrylamide gel electrophoresis sample buffer. Electrophoresis 1985, 6, 559–563. [Google Scholar]
  65. Rodríguez-Piñeiro, A.M.; Rodríguez-Berrocal, F.J.; Páez de la Cadena, M. Improvements in the search for potential biomarkers by proteomics: Application of principal component and discriminant analyses for two-dimensional maps evaluation. J. Chromatogr. B 2007, 849, 251–260. [Google Scholar]
  66. Bendtsen, J.D.; Jensen, L.J.; Blom, N.; Von Heijne, G.; Brunak, S. Feature-based prediction of non-classical and leaderless protein secretion. Protein Eng. Des. Sel 2004, 17, 349–356. [Google Scholar]
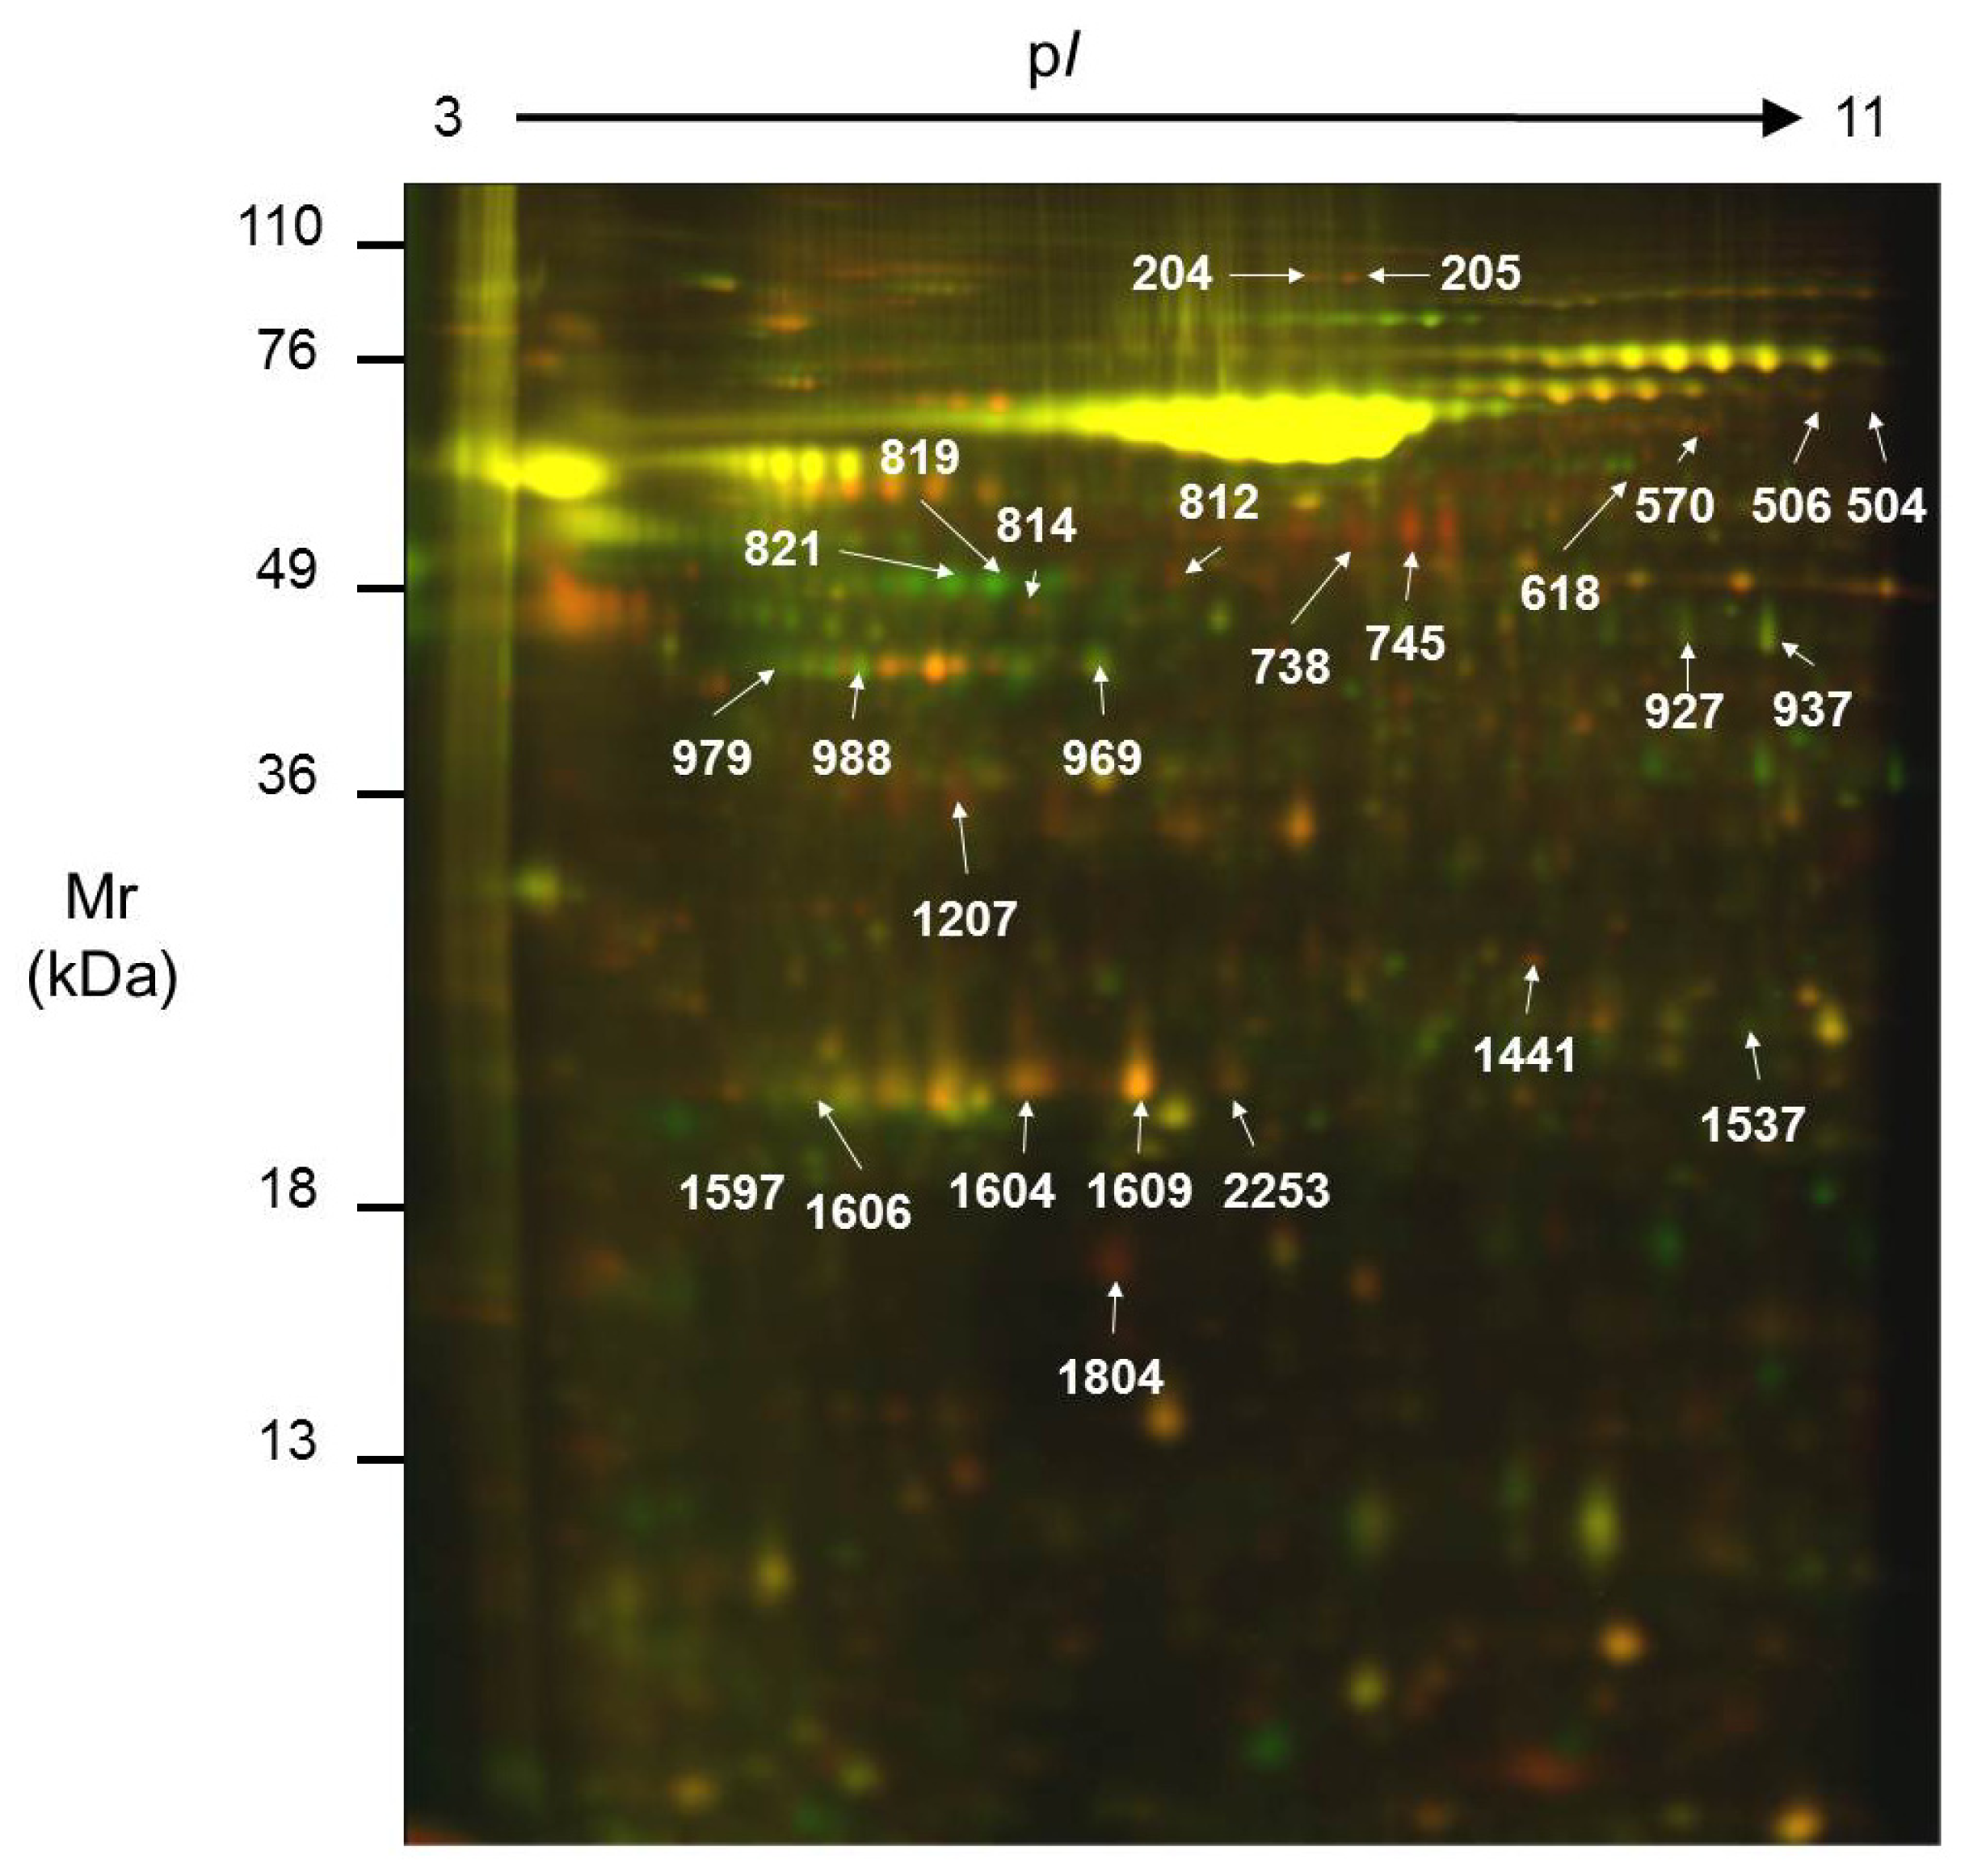
Figure 1. (a) Monodimensional protein pattern detected by Coomassie staining of the secretome of undifferentiated (UD, left) and differentiated (D, right) Caco-2 cells; Mr: relative molecular mass; (b) Specific activity of the enzymes alkaline phosphatase (AP, clear bars) and maltase (M, dark bars), known markers of enterocytic differentiation.
Ijms 13 14401f1
Figure 2. Representative Differential In-Gel Electrophoresis (DIGE) analytical gel where the secretome of an undifferentiated Caco-2 culture has been labeled with Cy5 (red spots) and the secretome from a differentiated culture with Cy3 (green spots). Yellow areas represent overlapping spots. The spots identified are labeled with the spot number. Mr: relative molecular mass; pI: isoelectric point.
Ijms 13 14401f2
Figure 3. Representative 2-D map where the spots with significant variation due to Caco-2 differentiation identified by MS are highlighted. The spot numbers correspond to those shown in Table 2. Blue circles indicate higher expression and red circles lower expression in undifferentiated (tumor-like) cells. Mr: relative molecular mass; pI: isoelectric point.
Ijms 13 14401f3
Figure 4. (a) Plot of the most relevant principal components (PCs) found when analyzing the abundance of all the protein spots detected by DIGE in the secretome of undifferentiated and differentiated Caco-2 cells. These cell states can be differentiated by PC3 (X axis), reflecting a characteristic protein pattern before and after differentiation. The Y axis (PC1; same results found for PC2) groups the samples on the basis of the gel were they ran, indicating a technical contribution; (b) Separation given by principal component analysis (PCA) only on the spots that were significantly different between the cell states; (c) Separation of cell states given by PCA only on the 22 identified spots.
Ijms 13 14401f4
Table 1. Number of protein spots detected in the three replicates of undifferentiated and differentiated Caco-2 cells.
GelNo. Spots DetectedNo. Spots Matched* LabelSample
Gel 122542254Cy2Standard
Cy5UD1
Cy3D3

Gel 216321164Cy2Standard
Cy5UD2
Cy3D1

Gel 320231463Cy2Standard
Cy5D2
Cy3UD3
*Number of spots matched to gel 1, used as template as it contains the higher number of spots; Sample: UD, undifferentiated; D, differentiated.
Table 2. Proteins that showed a significant variation in the Caco-2 secretome associated with the differentiation process.
Spot No.IDNamepIMr (kDa)Int. UD (mean ± SD)Int. D (mean ± SD)RatioFunctionLocalizationMethodProtein ScoreThresholdCoverage (%)
204Q14697Glucosidase II subunit alpha5.7107.2184.36 ± 113.3961.32 ± 17.733.0N-glycoprotein metabolismER; Pred. sec.PMF2496634
205Q14697Glucosidase II subunit alpha5.7107.2126.37 ± 61.3532.18 ± 7.263.9N-glycoprotein metabolismER; Pred. sec.PMF2756637
504Q15582Transforming growth factor-betainduced protein ig-h37.774.730.31 ± 3.7215.50 ± 2.202.0Cellular adhesionSecretedSQ1076621
506Q15582Transforming growth factor-betainduced protein ig-h37.774.765.28 ± 17.5731.04 ± 3.542.1Cellular adhesionSecretedPMF776625
570Q15582Transforming growth factor-betainduced protein ig-h37.774.760.17 ± 10.5222.14 ± 6.582.7Cellular adhesionSecretedSQ2115629
618P23141Liver carboxylesterase15.956.524.86 ± 10.1658.72 ± 19.930.4DetoxificationER; Pred. sec.PMF916634
738P10619Cathepsin A6.051.9959.27 ± 685.01229.14 ± 142.674.2CarboxipeptidaseLysosome; Pred. sec.SQ1046616
745P06576ATP synthase subunit beta5.356.52445.77 ± 2596.37360.55 ± 231.076.8ATP synthesisMitochondria; Pred. sec.SQ1155627
814P02679Fibrinogen gamma chain5.546.8141.99 ± 34.5954.12 ± 23.492.6Hemostasis/acute phase responseSecretedSQ976614
927Q6FHQ6NADPdependent isocitrate dehydrogenase6.546.980.32 ± 6.07201.39 ± 91.200.4Carbohydrate metabolismCytosol; Pred. Sec.SQ2246623
937Q6FHQ6NADPdependent isocitrate dehydrogenase6.546.9242.59 ± 91.94569.91 ± 255.380.4Carbohydrate metabolismCytosol; Pred. Sec.PMF2056650
969P12277Creatine kinase B5.342.9253.51 ± 103.76918.55 ± 495.430.3Energy metabolismCytosolPMF2526656
979P06727Apolipoprotein A-IV5.345.462.39 ± 32.05321.76 ± 235.620.2Lipid transportSecretedPMF2156649
988P06727Apolipoprotein A-IV5.345.4206.98 ± 52.20723.07 ± 303.910.3Lipid transportSecretedSQ1306634
1207P02649Apolipoprotein E precursor5.736.3354.49 ± 32.66167.01 ± 85.652.1Lipid transportSecretedPMF2156660
1441P78417Glutathione S-transferase omega-16.227.8103.79 ± 13.3665.54 ± 33.381.6Glutathione TransferenceCytosolSQ895617
1537P60174Triose phosphate isomerase6.526.863.43 ± 22.22162.21 ± 95.920.4Carbohydrate metabolismCytosol; Pred. sec.PMF1416660
1597Q5W0H4Translationallycontrolled tumor protein5.122.8152.49 ± 38.0445.49 ± 8.913.4Calcium binding and microtubule stabilizationCytosol; Pred. sec.SQ826635
1604P02647Apolipoprotein A-I5.528.91935.86 ± 793.28943.66 ± 494.742.1Lipid transportSecretedPMF1916667
1609P02647Apolipoprotein A-I5.528.94306.10 ± 2751.701567.04 ± 913.342.8Lipid transportSecretedPMF2706681
1804P61916Niemann-Pick disease type C2 protein5.316.6437.13 ± 260.6168.25 ± 49.706.4Cholesterol bindingSecretedSQ1016630
2253P02647Apolipoprotein A-I5.528.9302.18 ± 178.79118.77 ± 34.882.5Lipid transportSecretedPMF686637
ID: accession number in UniProt; pI: theoretical isoelectric point; Mr: theoretical relative molecular mass; Int: intensity; UD: undifferentiated; D: differentiated; Ratio: average abundance in undifferentiated over differentiated cells; ER: endoplasmic reticulum; Pred. Sec.: Potentially secreted proteins, either containing a classical signal peptide, or predicted by the Secretome 2.0 Server ( http://www.cbs.dtu.dk/services/SecretomeP/) to be secreted via a non-classical route; PMF: peptide mass fingerprint; SQ: sequence query; Threshold: lowest protein score value for a positive protein identification (p = 0.05); Coverage: percentage of the protein sequence covered by the assigned peptides.

