Structure and Dynamics of Reentrant Nematics: Any Open Questions after Almost 40 Years?

Abstract
:1. Introduction
2. History
3. Experimental Investigations
4. Theoretical Scenarios for Reentrancy
5. Computer Simulations
5.1. Confined Mesogens
5.1.1. Model
5.1.2. Results
6. Conclusions
Acknowledgments
References and Notes
- Lehmann, O. Über fliessende Krystalle. Z. Phys. Chem 1889, 4, 462–472. [Google Scholar]
- Schenk, R. Kristallinische Flüssigkeiten und Flüssige Kristalle; Engelmann: Leipzig, Germany, 1905. [Google Scholar]
- Vorländer, D. Kristallinische Flüssige Substanzen; Enke: Stuttgart, Germany, 1908. [Google Scholar]
- Friedel, G. Lesétats mésomorphes de la matière. Ann. Phys 1922, 18, 273–274. [Google Scholar]
- Coles, H; Morris, S. Liquid-crystal lasers. Nat. Photonics 2010, 4, 676–685. [Google Scholar]
- Strzelecka, TE; Davidson, MW; Rill, RL. Multiple liquid crystal phases of DNA at high concentrations. Nature 1988, 331, 457–460. [Google Scholar]
- Nakata, M; Zanchetta, G; Chapman, BD; Jones, CD; Cross, JO; Pindak, R; Bellini, T; Clark, NA. End-to-end stacking and liquid crystal condensation of 6- to 20-base pair DNA duplexes. Science 2007, 318, 1276–1279. [Google Scholar]
- Vollrath, F; Knight, DP. Liquid crystalline spinning of spider silk. Nature 2001, 410, 541–548. [Google Scholar]
- Woltman, SJ; Jay, GD; Crawford, GP. Liquid-crystal materials find a new order in biomedical applications. Nat. Mater 2007, 6, 929–938. [Google Scholar]
- Goodby, JW; Saez, IM; Cowling, SJ; Görtz, V; Draper, M; Hall, AW; Sia, S; Cosquer, G; Lee, SE; Raynes, EP. Transmission and amplification of information and properties in nanostructured liquid crystals. Angew. Chem. Int. Ed 2008, 47, 2754–2787. [Google Scholar]
- Cladis, PE. New liquid-crystal phase diagram. Phys. Rev. Lett 1975, 35, 48–51. [Google Scholar]
- Mazza, MG; Greschek, M; Valiullin, R; Kärger, J; Schoen, M. Entropy-driven enhanced self-diffusion in confined reentrant supernematics. Phys. Rev. Lett 2010, 105, 227802. [Google Scholar]
- Mazza, MG; Greschek, M; Valiullin, R; Schoen, M. Role of stringlike, supramolecular assemblies in reentrant supernematic liquid crystals. Phys. Rev. E Stat. Nonlin. Soft Matter Phys 2011, 83, 051704. [Google Scholar]
- Derouane, EG; André, JM; Lucas, AA. A simple van der waals model for molecule-curved surface interactions in molecular-sized microporous solids. Chem. Phys. Lett 1987, 137, 336–340. [Google Scholar]
- Yashonath, S; Santikary, P. Diffusion of sorbates in zeolites y and a: novel dependence on sorbate size and strength of sorbate-zeolite interaction. J. Phys. Chem 1994, 98, 6368–6376. [Google Scholar]
- Ratna, BR; Shashidhar, R; Rao, KV. Experimental studies on the electrical conductivity of two reentrant nematogens. Mol. Cryst. Liq. Cryst 1981, 74, 143–147. [Google Scholar]
- Figueirinhas, JL; Cruz, C; Ribeiro, AC; Huu Tinh, N. NMR study of molecular order in a liquid crystal with smectic Ad and reentrant nematic mesophases. A comparative study with models for the SmAd phase. Mol. Cryst. Liq. Cryst 1992, 212, 263–270. [Google Scholar]
- Cladis, PE; Bogardus, RK; Daniels, WB; Taylor, G. High-Pressure Investigation of the Reentrant Nematic—Bilayer-Smectic-A Transition. Phys. Rev. Lett 1977, 39, 720–723. [Google Scholar]
- Cladis, PE; Bogardus, RK; Aadsen, D. High-pressure investigation of the reentrant nematic bilayer smectic-a transition. Phys. Rev. A 1978, 18, 2292. [Google Scholar]
- Hardouin, F; Sigaud, G; Achard, MF; Gasparoux, H. Enantiotropic nematic reentrant behavior at atmospheric pressure in a pure compound. Phys. Lett. A 1979, 71, 347–349. [Google Scholar]
- Huu Tinh, N; Gasparoux, H. New series exhibiting pure enantiotropic nematic reentrant compounds at atmospheric pressure. Mol. Cryst. Liq. Cryst. Lett 1979, 49, 287–291. [Google Scholar]
- Sigaud, G; Huu Tinh, N; Hardouin, F; Gasparoux, H. Occurence of reentrant nematic and reentrant smectic a phases in mesogenic series. Mol. Cryst. Liq. Cryst 1981, 69, 81–102. [Google Scholar]
- Hardouin, F; Sigaud, G; Achard, MF; Gasparoux, H. Measurements in a pure compound exhibiting an enantiotropic reentrant nematic behavior at atmospheric pressure. Solid State Comm 1979, 30, 265–269. [Google Scholar]
- Shashidhar, R; Ratna, BR; Surendranath, V; Raja, VN; Prasad, SK; Nagabhushan, C. Experimental studies on a triply reentrant mesogen. J. Physique Lett 1985, 46, 445–450. [Google Scholar]
- Huu Tinh, N; Hardouin, F; Destrade, C; Levelut, AM. A re-entrant polymorphism N SA SC Nre. J. Physique Lett 1982, 43, 33–37. [Google Scholar]
- Huu Tinh, N; Gasparoux, H; Malthete, J; Destrade, C. Molecular aspect and polymorphism in polar rod-like mesogens. Mol. Cryst. Liq. Cryst 1984, 114, 19–41. [Google Scholar]
- Indekeu, JO; Berker, AN. Molcular tail length, dipole pairings, and multiple reentrance mechanisms of liquid crystals. Physica 1986, 140A, 368–375. [Google Scholar]
- Cladis, PE. A one hundred year perspective of the reentrant nematic phase. Mol. Cryst. Liq. Cryst 1988, 165, 85–121. [Google Scholar]
- Diele, S; Pelzl, G; Latif, I; Demus, D. X-ray investigations of a reentrant nematic phase formed of terminal-nonpolar compounds. Mol. Cryst. Liq. Cryst 1983, 92, 27–33. [Google Scholar]
- Pelzl, G; Latif, I; Diele, S; Novak, M; Demus, D; Sackmann, H. Reentrant nematic phases in binary systems of terminal-nonpolar compounds. Mol. Cryst. Liq. Cryst 1986, 139, 333–351. [Google Scholar]
- Guillon, D; Cladis, PE; Stamatoff, J. X-ray study and microscopic study of the reentrant nematic phase. Phys. Rev. Lett 1978, 41, 1598–1601. [Google Scholar]
- Miyajima, S; Akaba, K; Chiba, T. Proton NMR study of pure liquid crystal exhibiting re-entrant phase transition. Solid State Commun 1984, 49, 675–678. [Google Scholar]
- Dong, RY. Proton spin relaxation in a reentrant nematic liquid crystal mixture. Mol. Cryst. Liq. Cryst 1981, 64, 205–210. [Google Scholar]
- Dong, RY. NMR study of alloys exhibiting a reentrant nematic phase. J. Chem. Phys 1981, 75, 2621–2625. [Google Scholar]
- Dong, RY. Frequency dependence study of the proton spin relaxation in the re-entrant nematic phase. J. Chem. Phys 1982, 76, 5659–5661. [Google Scholar]
- Sebastião, PJ; Ribeiro, AC; Nguyen, HT; Noack, F. Molecular dynamics in a liquid crystal with reentrant mesophases. J. Phys. II Fr 1995, 5, 1707–1724. [Google Scholar]
- Bharatam, J; Bowers, CR. Characterization of phase transition and dynamics in reentrant namatic liquid crystals by xenon-129 nuclear magnetic resonance. J. Phys. Chem. B 1999, 103, 2510–2515. [Google Scholar]
- Dong, RY; Richards, GM; Lewis, JS; Tomchuck, E; Bock, E. Spectral density of motion in a reentrant nematic by deuterium NMR. Mol. Cryst. Liq. Cryst 1987, 144, 33–42. [Google Scholar]
- Shen, X; Dong, RY. A comparative study of dynamics in the nematic and reentrant-nematic phases of 6OCB/8OCB mixture by deuteron nuclear magnetic resonance relaxation. J. Chem. Phys 1998, 108, 9177–9185. [Google Scholar]
- Dong, RY; Carvalho, A; Sebastião, PJ; Nguyen, HT. Deuteron NMR stud of molecular dynamics in a compoun exhibiting a reentrant nematic phase. Phys. Rev. E 2000, 62, 3679–3686. [Google Scholar]
- Vaz, NAP; Yaniv, Z; Doane, JW. 2H NMR measurements of the molecular orientational ordering in a reentrant liquid-crystalline mixture. Chem. Phys. Lett 1983, 98, 354–358. [Google Scholar]
- Cladis, PE. The re-entrant nematic, enhanced smectic a phases and molecular composition. Mol. Cryst. Liq. Cryst 1981, 67, 177–192. [Google Scholar]
- Emsley, JW; Luckhurst, GR; Parsons, PJ; Timini, BA. Chain orientational order and the re-entrant nematic phase A duterium N.M.R. study of 4-n-hexyloxy-d13-4-n-octyloxy-d17-4[prime]-cyanobiphenyl and their re-entrant mixture. Mol. Phys 1985, 56, 767–774. [Google Scholar]
- Dong, RY; Lewis, JS; Tomchuk, E; Bock, E. DMR study of molecular order in a reentrant nematic liquid crystal. Mol. Cryst. Liq. Cryst 1985, 122, 35–40. [Google Scholar]
- Nayeem, A; Freed, JH. ESR study of the dynamic molecular structure of a reentrant nematic liquid crystal. J. Phys. Chem 1989, 93, 6539–6550. [Google Scholar]
- Nozaki, R; Bose, TK; Yagihara, S. Dielectric relaxation of a reentrant nematic-liquid-crystal mixture by time-domain reflectometry. Phys. Rev. A 1992, 46, 7733–7737. [Google Scholar]
- Yethiraj, A; Burnell, EE; Dong, RY. The smectic potential in a liquid crystal with a reentrant nematic phase: NMR of solutes. Chem. Phys. Lett 2007, 441, 245–249. [Google Scholar]
- Das, MK; Prasad, A. Rotational viscosity measurement of a binary mixture showing both induced smectic and re-entrant nematic phases. Mol. Cryst. Liq. Cryst 2011, 540, 162–168. [Google Scholar]
- Bhattacharya, S; Letcher, SV. Flow behavior of an ordered, reentrant, nematic liquid crystal. Phys. Rev. Lett 1980, 44, 414–417. [Google Scholar]
- Jadżyn, J; Czechowski, G. Pre-transitional temperature behaviour of the shear viscosity of freely flowing thermotropic liquid crystals. Phase Transitions 2007, 80, 665–673. [Google Scholar]
- Prost, J; Barois, P. Polymorphism in polar mesogens II. Theoretical aspects. J. Chim. Phys 1983, 80, 65–81. [Google Scholar]
- Prost, J. The smectic state. Adv. Phys 1984, 33, 1–46. [Google Scholar]
- Berker, AN; Walker, JS. Frustrated spin-gas model for doubly reentrant liquid crystals. Phys. Rev. Lett 1981, 47, 1469–1472. [Google Scholar]
- Indekeu, JO; Berker, AN. Quadruple reentrance (nematic-smectic-Ad-nematic-smectic-Adnematic-smectic-A1) from the frustrated spin-gas model of liquid crystals. Phys. Rev. A 1986, 33, 1158–1162. [Google Scholar]
- Huu Tinh, N; Hardouin, F; Destrade, C. Trois phénomènes rentrants dans un produit pur mésogène. J. Phys. Fr 1982, 43, 1127–1131. [Google Scholar]
- Netz, RR; Berker, AN. Smectic-C order, in-plane domains, and nematic reentrance in a microscopic model of liquid crystals. Phys. Rev. Lett 1992, 68, 333–336. [Google Scholar]
- Kortan, AR; Känel, HV; Birgeneau, RJ; Litster, JD. High-resolution X-ray-scattering study of the nematic-smectic A-reentrant nematic transitions in 8OCB/6OCB mixtures. Phys. Rev. Lett 1981, 47, 1206–1209. [Google Scholar]
- Guillon, D; Cladis, PE; Aadsen, D; Daniels, WB. X-ray investigation of the smectic A reentrant nematic transition under pressure (CBOOA). Phys. Rev. A 1980, 21, 658–665. [Google Scholar]
- Longa, L; de Jeu, WH. Microscopic one-particle description of reentrant behavior in nematic liquid crystals. Phys. Rev. A 1982, 26, 1632–1647. [Google Scholar]
- McMillan, WL. Simple molecular model for the smectic a phase of liquid crystals. Phys. Rev. A 1971, 4, 1238–1246. [Google Scholar]
- Luckhurst, GR; Timini, BA. A molecular theory of re-entrant polymorphism in pure liquid crystals. Mol. Cryst. Liq. Cryst 1981, 64, 253–259. [Google Scholar]
- Ferrarini, A; Luckhurst, GR; Nordio, PL; Spolaore, E. The influence of association and isomerization on re-entrant nematic and smectic a polymorphism. Mol. Phys 1996, 89, 1087–1103. [Google Scholar]
- Dowell, F. Reentrant nematic and multiple smectic-a liquid crystals: Intrachain flexibility constraints. Phys. Rev. A 1987, 36, 5046–5058. [Google Scholar]
- Bose, TR; Ghose, D; Mukherjee, CD; Saha, J; Roy, MK; Saha, M. Role of end chains in the reentrant behavior of a nonpolar system. Phys. Rev. A 1991, 43, 4372–4377. [Google Scholar]
- Gubbins, KE; Moore, JD. Molecular modeling of matter: Impact and prospects in engineering. Ind. Eng. Chem. Res 2010, 49, 3026–3046. [Google Scholar]
- de Miguel, E; Martín del Río, E. Computer simulation of nematic reentrance in a simple molecular model. Phys Rev Lett 2005, 95, 217802:1–217802:4. [Google Scholar]
- Schoen, M; Klapp, SHL. Nanoconfined Fluids Soft Matter Between Two and Three Dimensions; Wiley-VCH: Hoboken, NY, USA, 2007. [Google Scholar]
- Schoen, M; Günther, G. Phase transitions in nanoconfined fluids: Synergistic coupling between soft and hard matter. Soft Matter 2010, 6, 5832–5838. [Google Scholar]
- Schoen, M. Fluid bridges confined between chemically nanopatterned solid substrates. Phys. Chem. Chem. Phys 2008, 10, 223–256. [Google Scholar]
- Martínez-Haya, B; Cuetos, A; Lago, S; Rull, LF. A novel orientation-dependent potential model for prolate mesogens. J Chem Phys 2004, 122, 024908:1–024908:8. [Google Scholar]
- A spherocilinder is defined as a cylinder of length L and diameter σ capped at both ends with hemispheres of diameter σ. Thus, the total length of the spherocilinder is L + σ.
- Vega, C; Lago, S. A fast algorithm to evaluate the shortest distance between rods. Comput. Chem 1994, 18, 55–59. [Google Scholar]
- Sonin, AA. The Surface Physics of Liquid Crystals; Gordon and Breach Publishers: London, UK, 1995. [Google Scholar]
- Jérôme, B. Surface effects and anchoring in liquid crystals. Rep. Prog. Phys 1991, 54, 391–451. [Google Scholar]
- Ilnytskyi, JM; Wilson, MR. A domain decomposition molecular dynamics program for the simulation of flexible molecules of spherically-symmetrical and nonspherical sites. II. Extension to nvt and npt ensembles. Comput. Phys. Commun 2002, 148, 43–58. [Google Scholar]
- de Gennes, PG. Short range order effects in the isotropic phase of nematics and cholesterics. Mol. Cryst. Liq. Cryst 1971, 12, 193–214. [Google Scholar]
- Pardowitz, H; Hess, S. On the theory of irreversible processes in molecular liquids and liquid crystals, nonequilibrium phenomena associated with the second and fourth rank alignment tensors. Physica A 1980, 100, 540–562. [Google Scholar]
- Maier, W; Saupe, A. Eine einfache molekular-statistische Theorie der nematischen kristallinflüssigen Phase. Teil I. Z. Naturforsch 1959, 14a, 882–889. [Google Scholar]
- Maier, W; Saupe, A. Eine einfache molekular-statistische Theorie der nematischen kristallinflüssigen Phase. Teil II. Z. Naturforsch 1960, 15a, 287–292. [Google Scholar]
- Eppenga, R; Frenkel, D. Monte carlo study of the isotropic and nematic phases of infinitely thin hard platelets. Mol. Phys 1984, 52, 1303–1334. [Google Scholar]

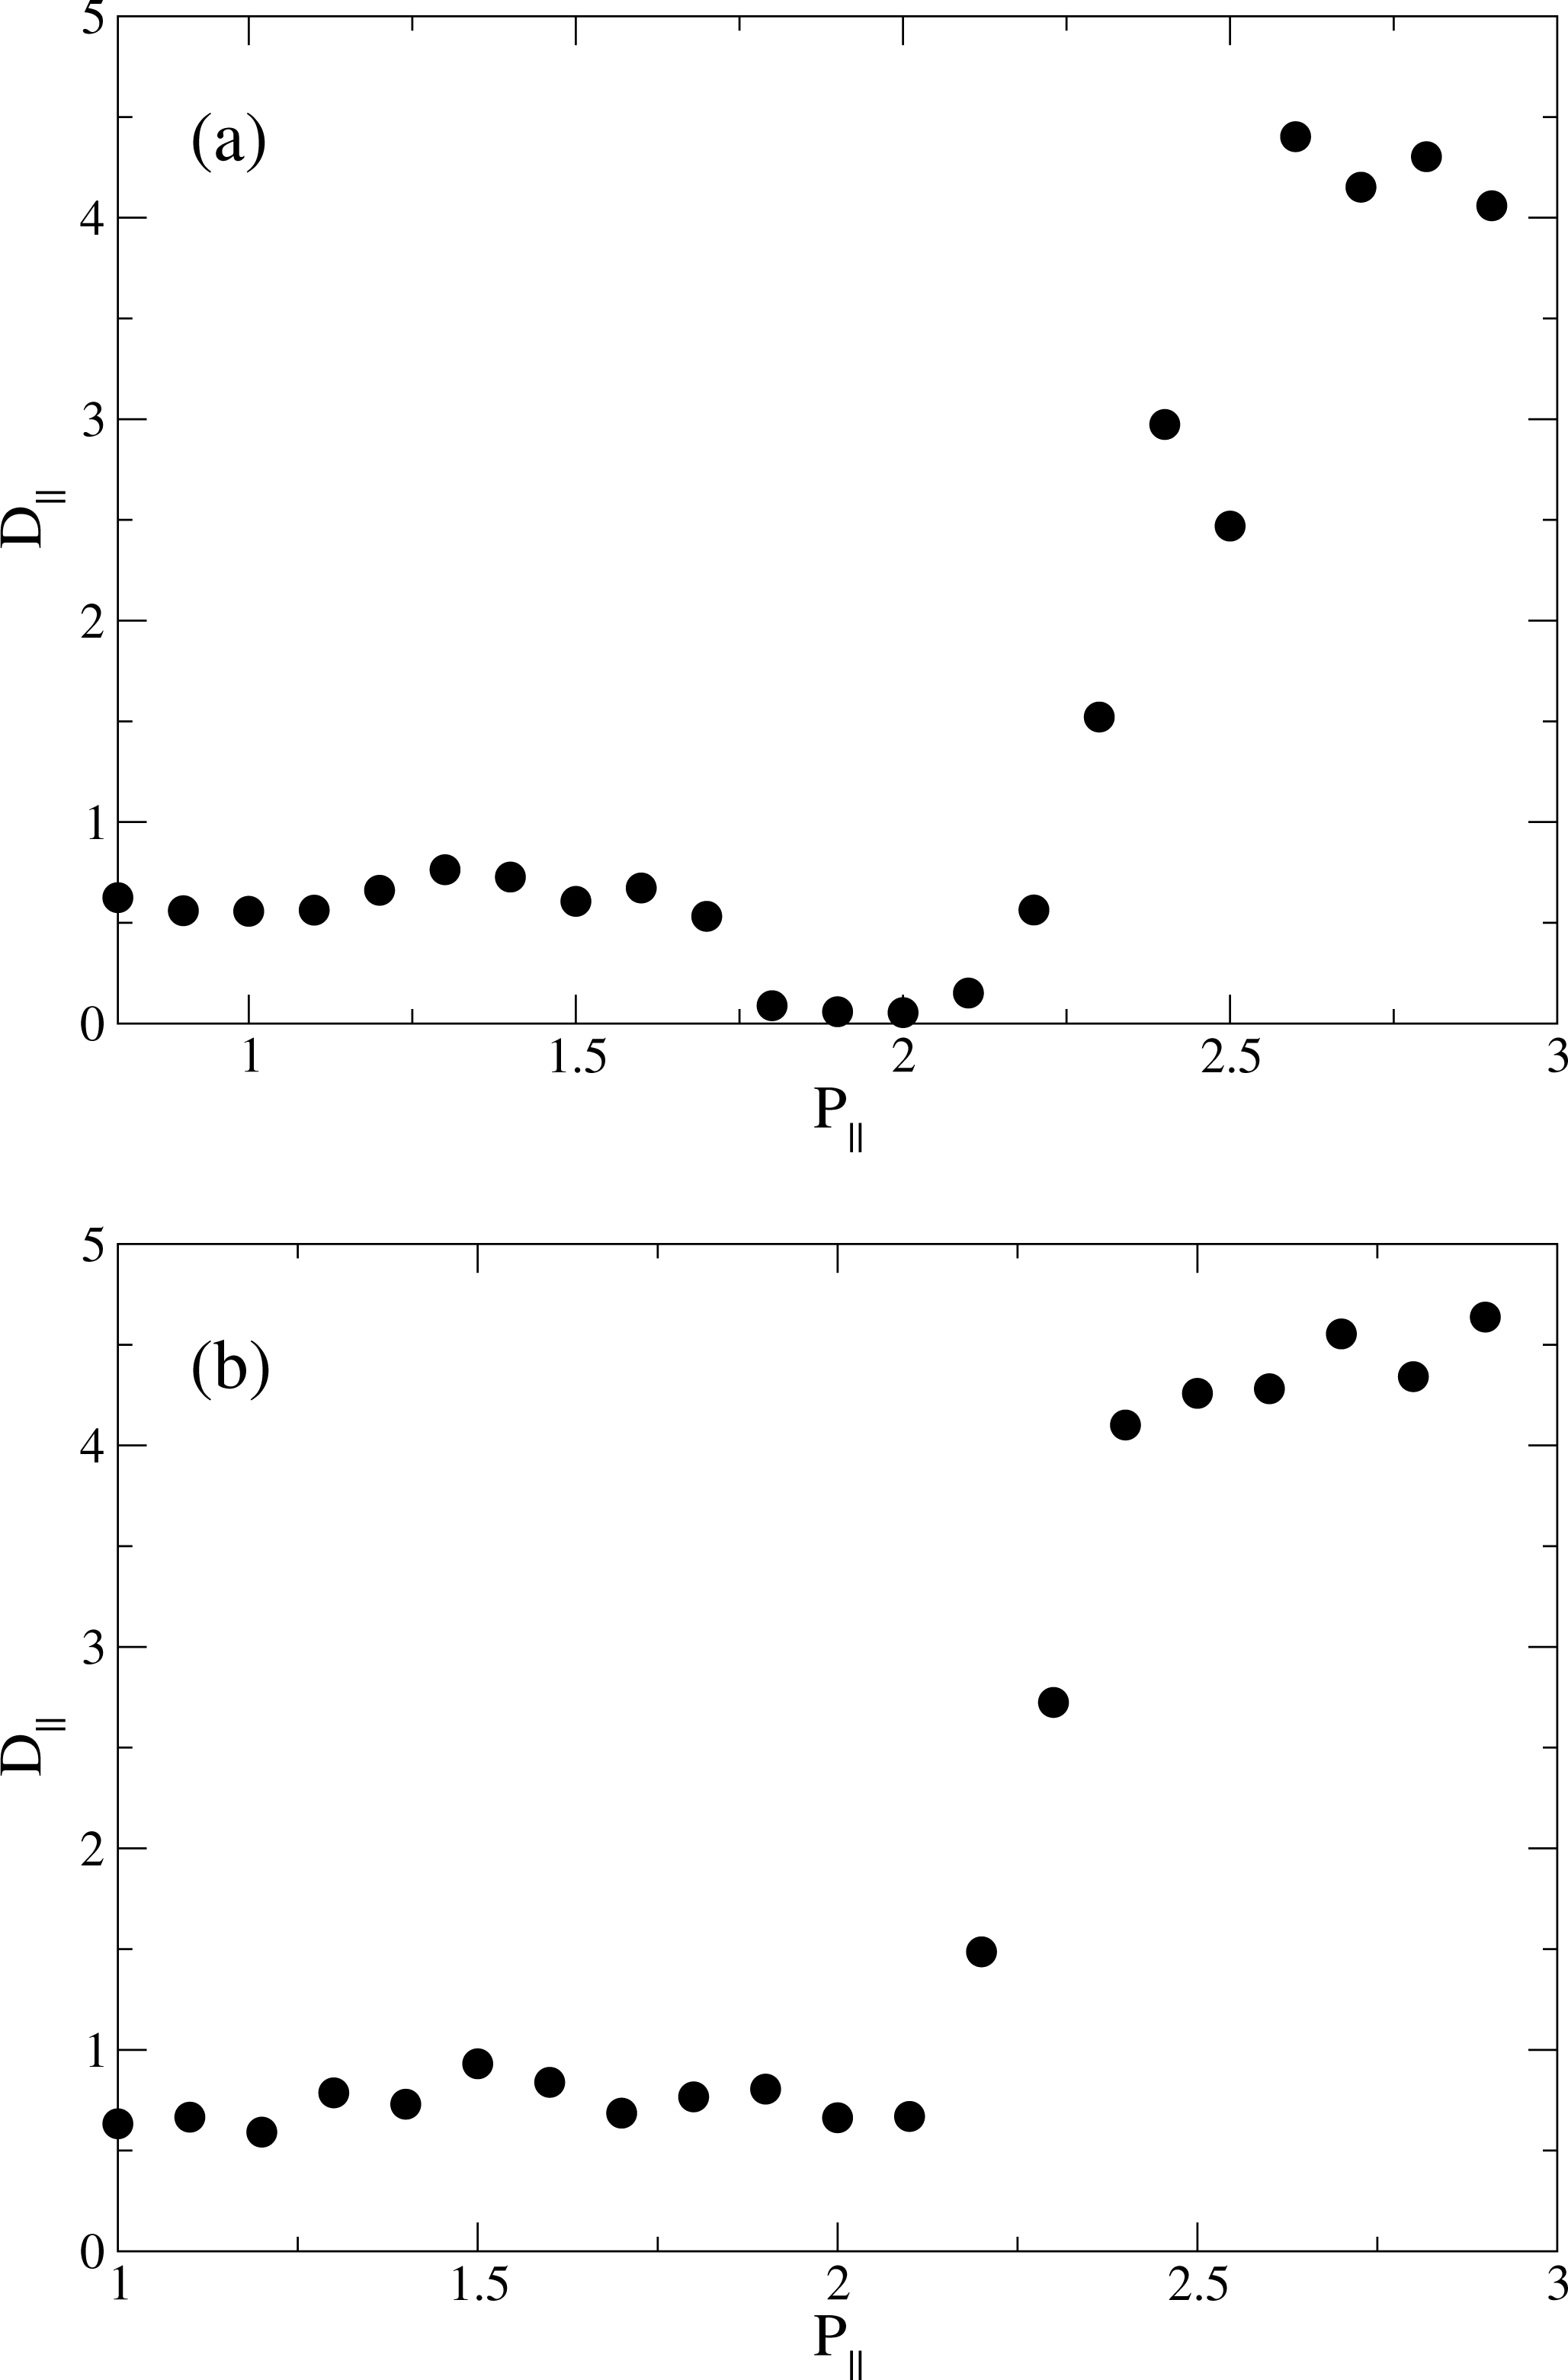
 ) and smectic order parameter Λ (
 ) as functions of pressure P‖ at (a) T = 4.0; and (b) at T = 6.0.
) and smectic order parameter Λ (
) as functions of pressure P‖ at (a) T = 4.0; and (b) at T = 6.0.
) as functions of pressure P‖ at (a) T = 4.0; and (b) at T = 6.0.
) and smectic order parameter Λ (
) as functions of pressure P‖ at (a) T = 4.0; and (b) at T = 6.0.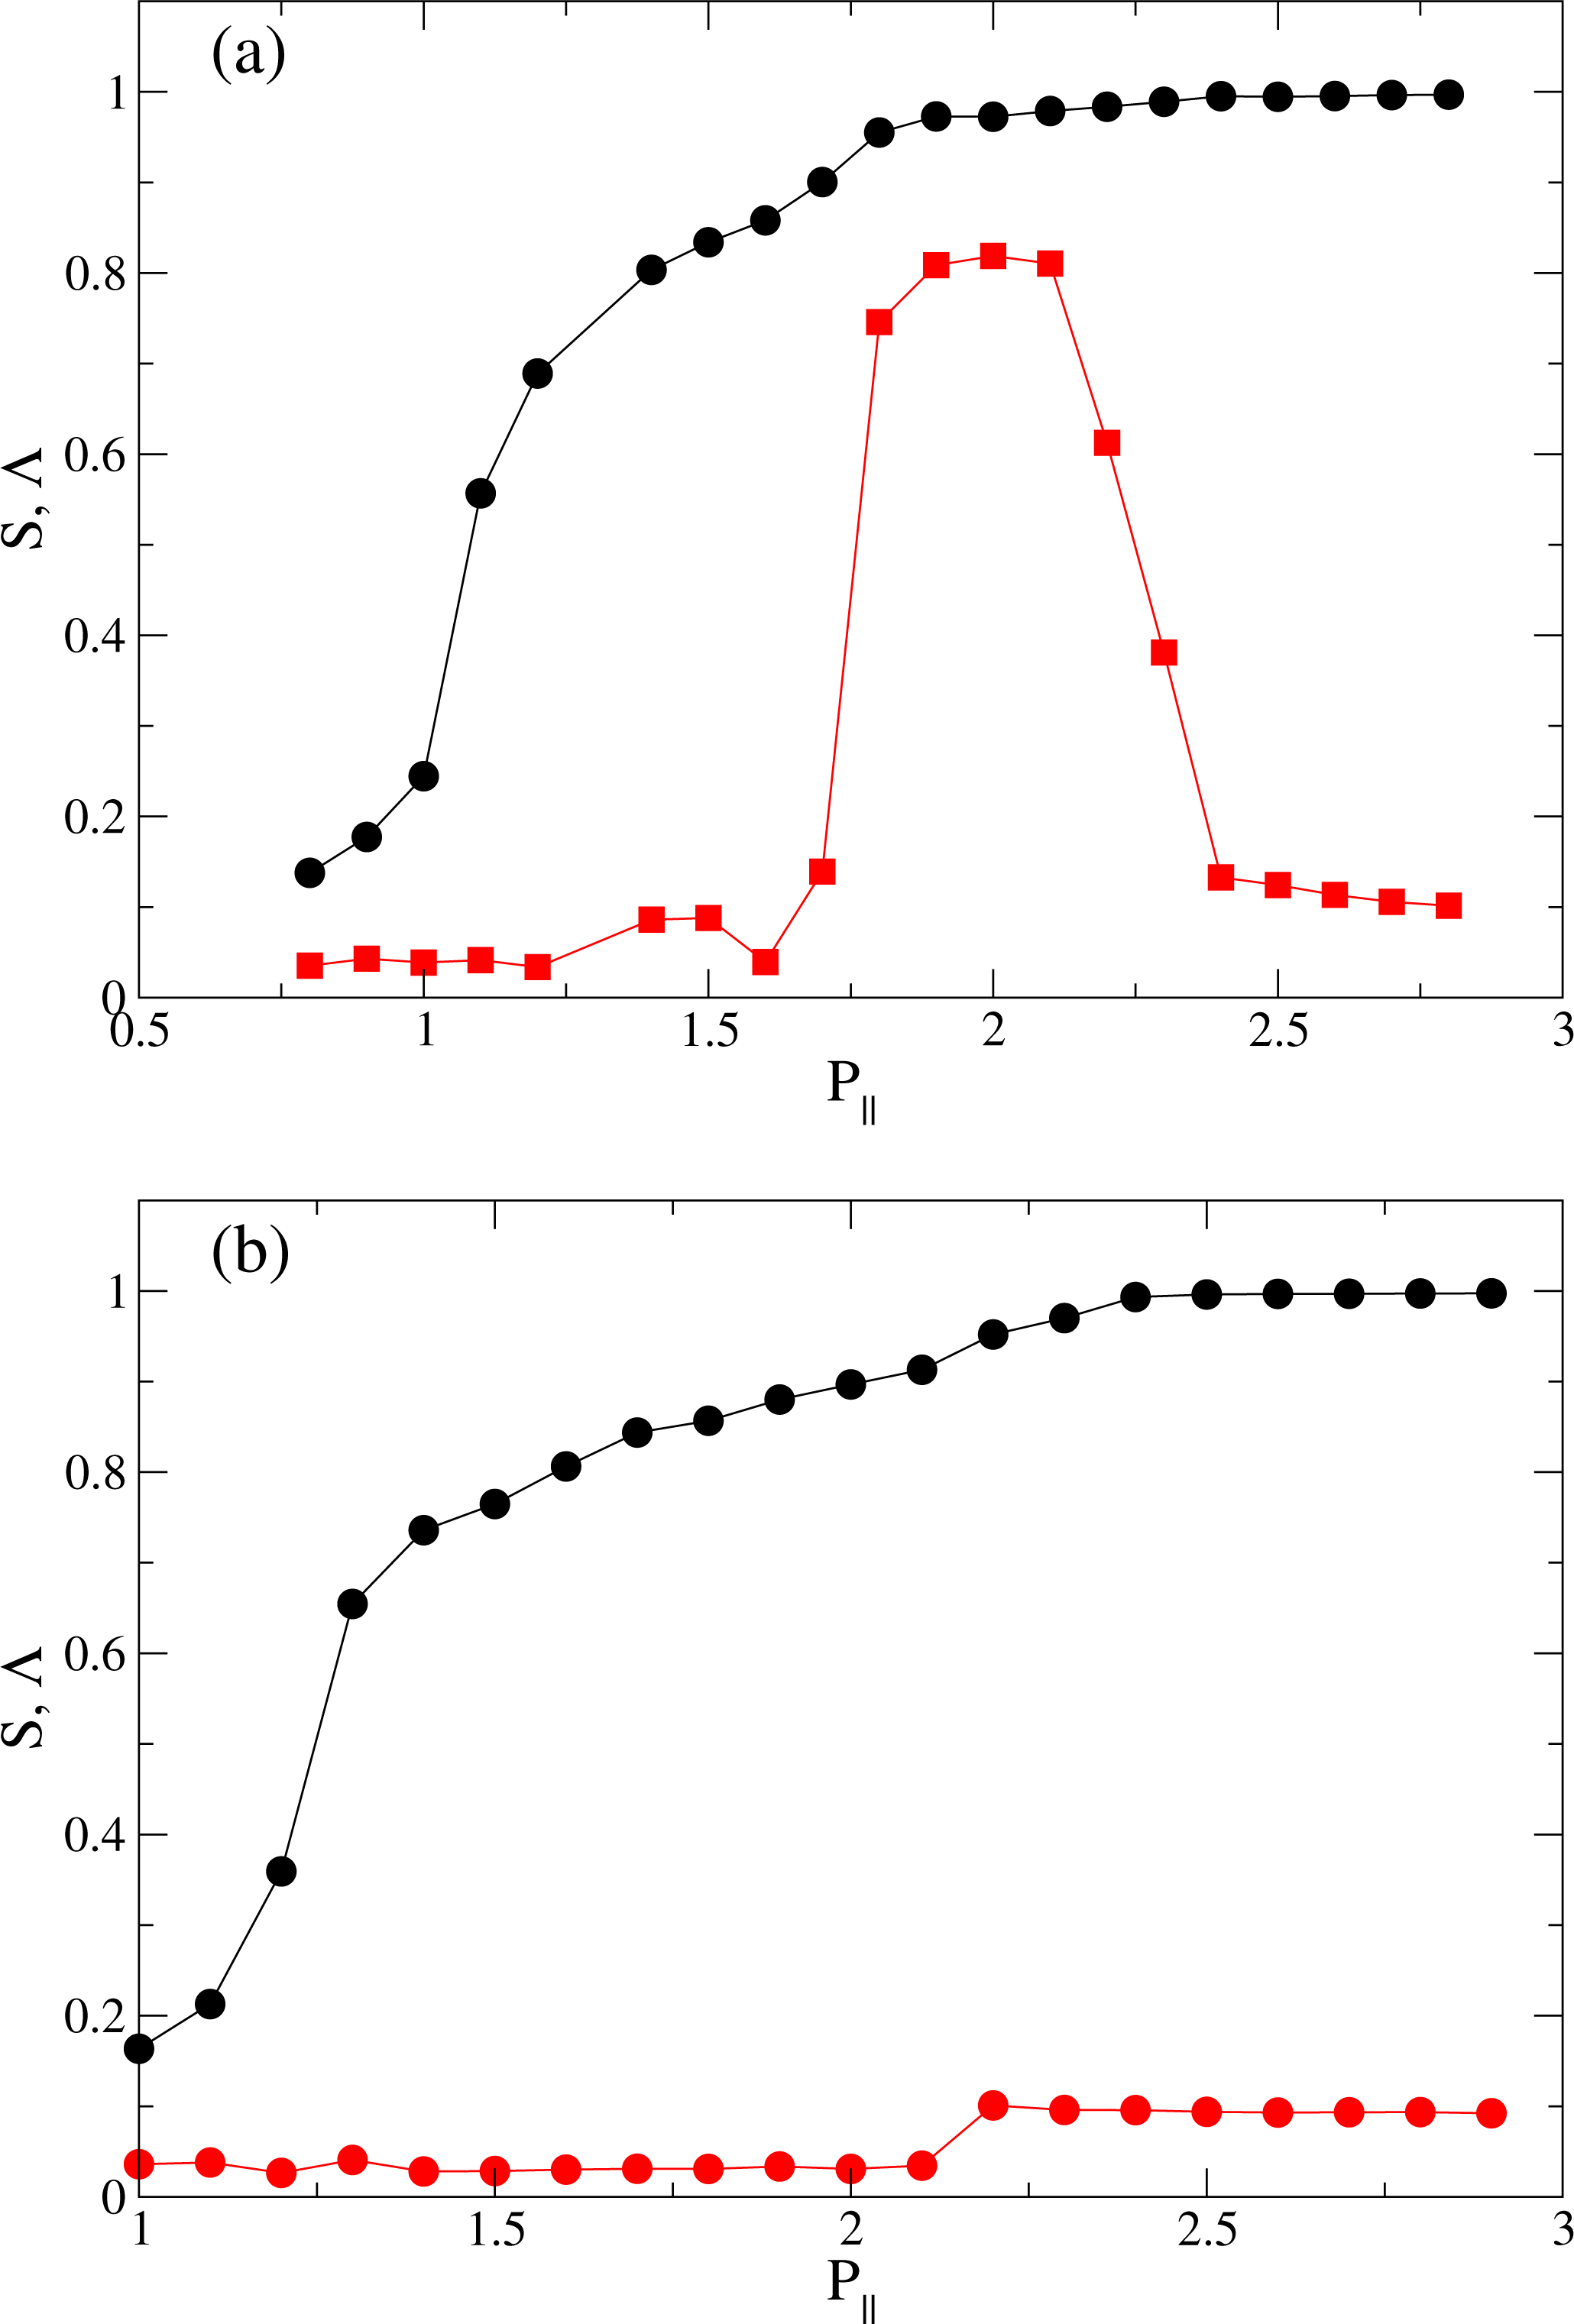


© 2011 by the authors; licensee MDPI, Basel, Switzerland. This article is an open-access article distributed under the terms and conditions of the Creative Commons Attribution license (http://creativecommons.org/licenses/by/3.0/).
Share and Cite
Mazza, M.G.; Schoen, M. Structure and Dynamics of Reentrant Nematics: Any Open Questions after Almost 40 Years? Int. J. Mol. Sci. 2011, 12, 5352-5372. https://doi.org/10.3390/ijms12085352
Mazza MG, Schoen M. Structure and Dynamics of Reentrant Nematics: Any Open Questions after Almost 40 Years? International Journal of Molecular Sciences. 2011; 12(8):5352-5372. https://doi.org/10.3390/ijms12085352
Chicago/Turabian StyleMazza, Marco G., and Martin Schoen. 2011. "Structure and Dynamics of Reentrant Nematics: Any Open Questions after Almost 40 Years?" International Journal of Molecular Sciences 12, no. 8: 5352-5372. https://doi.org/10.3390/ijms12085352