Article

Genetic Variation in Safflower (Carthamus tinctorious L.) for Seed Quality-Related Traits and Inter-Simple Sequence Repeat (ISSR) Markers

1
Department of Agronomy and Plant Breeding, College of Agriculture, Shahid Bahonar University of Kerman, Kerman 76169133, Iran
2
Department of Agronomy and Plant Breeding, College of Agriculture, Isfahan University of Technology, Isfahan 8415683111, Iran
*
Author to whom correspondence should be addressed.
Int. J. Mol. Sci. 2011, 12(4), 2664-2677; https://doi.org/10.3390/ijms12042664
Submission received: 3 March 2011 / Revised: 6 April 2011 / Accepted: 6 April 2011 / Published: 19 April 2011
(This article belongs to the Section Biochemistry)

Abstract

:
Safflower (Carthamus tinctorious L.) is an oilseed crop that is valued as a source of high quality vegetable oil. The genetic diversity of 16 safflower genotypes originated from different geographical regions of Iran and some with exotic origin were evaluated. Eight different seed quality-related traits including fatty acid composition of seed oil (stearic acid, palmitic acid, oleic acid and linoleic acid), the contents of, oil, protein, fiber and ash in its seeds, as well as 20 inter-simple sequence repeat (ISSR) polymorphic primers were used in this study. Analysis of variance showed significant variation in genotypes for the seed quality-related traits. Based on ISSR markers, a total of 204 bands were amplified and 149 bands (about 70%) of these were polymorphic. Cluster analysis based on either biochemical or molecular markers classified the genotypes into four groups, showing some similarities between molecular and biochemical markers for evaluated genotypes. A logical similarity between the genotype clusters based on molecular data with their geographical origins was observed.

1. Introduction

Safflower (Carthamus tinctorius L.) is believed to have been domesticated somewhere in the Fertile Crescent region over 4000 years ago [1,2]. Knowles [2], proposed seven diversity centers for safflower germplasm evolution including the Far East, India-Pakistan, the Middle East, Egypt, Sudan, Ethiopia and Europe. The Middle East center was sub-divided into three gene pools of Iran-Afghanistan, Israel-Jordan-Iraq-Syria, and Turkey [1]. Recently, the Near Eastern origin of safflower was supported by Chapman et al. [3]. Safflower lines native to each “center” are considerably similar in height, branching, spines, flower color and head size, whereas consistent morphological variations are retained between the centers [4]. Normal types of the whole seed contain 27–32% oil, 5–8% moisture, 14–15% protein, 2–7% ash, and 32–34% crude fiber [5,6]. Safflower is one of the crops with the greatest variability of fatty acid in its seed oil composition [7,8]. Safflower oil contains the saturated fatty acids of palmitic (C16:0) and stearic (C18:0) and the unsaturated fatty acids of oleic (C18:1), linoleic (C18:2) and linolenic (C18:3) [8,9]. Conventional safflower seed oil has a fatty acid profile made up of 6–8% palmitic acid, 2–3% stearic acid, 16–20% oleic acid, and 71–75% linoleic acid [10].
The efficiency of assessment of genetic diversity to be used in a breeding program will be improved if combined biochemical and molecular marker data are used [11,12]. Safflower genotypes have indicated considerable diversity across different geographical regions of the world [2]. The fatty acid composition of seed oil varies remarkably both between and within species, with fatty acids altering in both chain length and degrees of desaturation. Genetic variation for fatty acid composition is vital for genetic improvement of the oil quality in oilseed crops [10].
Various markers—morphological, biochemical, and molecular—are used to assess plant genetic diversity. With the advent of DNA markers, possessing the advantages of higher polymorphism and independent of environment and plant growth stage, they have been widely employed for the assessment of genetic diversity [13]. Inter-simple sequence repeat (ISSR) is a DNA based marker with primers designed based upon dinucleotide, tetranucleotide or pentanucleotide repeats [14]. ISSR markers, with the advantages of simplicity, acceptable stability and high reproducibility, have been successfully used in genetic variation studies, gene mapping, germplasm identification and fingerprinting construction [12,15,16]. ISSR markers are more specific than RAPD markers, because of their longer SSR-based primers with higher primer annealing temperature, enabling amplifications of more reproducible bands [17]. The ability to reveal genetic variation among different genotypes may be more directly related to the number of polymorphisms detected with each marker technique rather than a function of which technique is employed [18]. Genetic variation in safflower has been studied using agro-morphological traits [1921], biochemical traits in seed [22,23] and molecular markers including EST-SSR [24] AFLP [25], ISSR [2628], and RAPD [29,30]. Moreover, genetic purity of safflower hybrids was estimated using EST-SSR markers in safflower [31]
Although, molecular markers have already been used either alone [2527], or together with agro-morphological traits [28,30], to assess the genetic diversity in safflower, the relationships between molecular markers and seed quality-related traits are lacking in this oilseed crop. The objectives of this study were to assess the genetic variation of C. tinctorius genotypes with native and exotic origins using molecular markers and seed quality-related biochemical traits and to compare the results obtained by these two methods.

2. Results and Discussion

2.1. Seed Quality-Related Traits

The results of analysis of variance showed a significant difference among safflower genotypes for protein, oil, ash, fiber and fatty acid contents of seed (Table 1).
Seed oil content of the genotypes ranged from 21% in Wht-ISF to 33.5% in Mex.2-138 (Table 2). Regarding protein content, K21 (25.6%) and Mex.13-216 (13.5%) possessed the highest and the lowest protein content, respectively.
Palmitic acid of safflower genotypes ranged from 6.49% in Mex.13-216 to 11.07% in ISF14 (Table 3). Mean of stearic acid content (%) varied from 1.43 in Mex.13-216 to 2.94 in GE62918 genotype (Table 2). With considering the breeding aims in decreasing these two saturated fatty acids, using Mex.13-216 genotype could be recommended. Oleic acid content showed the highest variation in the studied genotypes. Oleic acid ranged from 14.1 (ISF14) to 35.26% (Mex.22-191) (Table 2). Linoleic acid content varied from 55.8% belonging to Mex.22-191 to 75.5% belonging to A2 genotype (Table 2). The ranges of 2–4%, 6–8%, 16–20% and 70–75% for stearic acid, palmitic acid, oleic acid and linoleic acid for safflower cultivars have been reported by other workers [3234]. These discrepancies in protein, oil and fatty acid composition of seed of the safflower genotypes reported here and elsewhere were mainly due to the genes and environmental effects that could jointly influence these traits in safflower [4]. Further research to resolve these discrepancies is needed to understand the direction of gene effects on the one hand, and the knowledge of interplay between the genes and environments on the other.
Seed ash content of the genotypes ranged from 3.10% belonging to ISF28 to 0.92% belonging to Mex.13-216 (Table 2). The safflower genotypes also varied significantly for fiber content ranging from 33% in Mex.17–45 to 42.4% in K21 (Table 2). The high variation observed for the biochemical traits of the seed of safflower genotypes could be attributed to the influences of these traits by genotype, environment and their interactions [33].
Calculation of genetic coefficient of variation revealed that the highest and the lowest of genetic variations belong to seed ash and fiber content, respectively (Table 2). Based on phenotypic coefficient of variation, the highest and the lowest values belonged to oleic acid content (%) and fiber content (%), respectively (Table 2). This result showed that fiber content is the least environmentally affected seed quality trait.
Pearson correlation coefficient was calculated for the seed quality-related traits (Table 3). The highest negative relationship was observed between oleic acid and linoleic acid content (r = −0.98 **). The negative association between oleic acid and linoleic acid was also reported in safflower by Fernandez-Martinez et al. [32], and Mahasi et al. [29]. A negative significant correlation was observed between oil content and stearic acid (r = −0.50 *). This result is in agreement with that of Johnson et al. [34], who observed a significant and negative correlation between stearic acid and oil content (%) in safflower genotypes. Palmitic acid correlated with oleic acid significantly and negatively (r = −0.51 *). A positive significant correlation (r = 0.54 *) was observed between protein content and palmitic acid. Strong positive relationship was found between protein content and ash content (r = 0.66 **). Protein content and fiber content was also correlated significantly (r = 0.54 *). Revealing the relationships between seed quality-related traits could help in planning effective breeding strategies for simultaneous improvement of these traits in safflower.
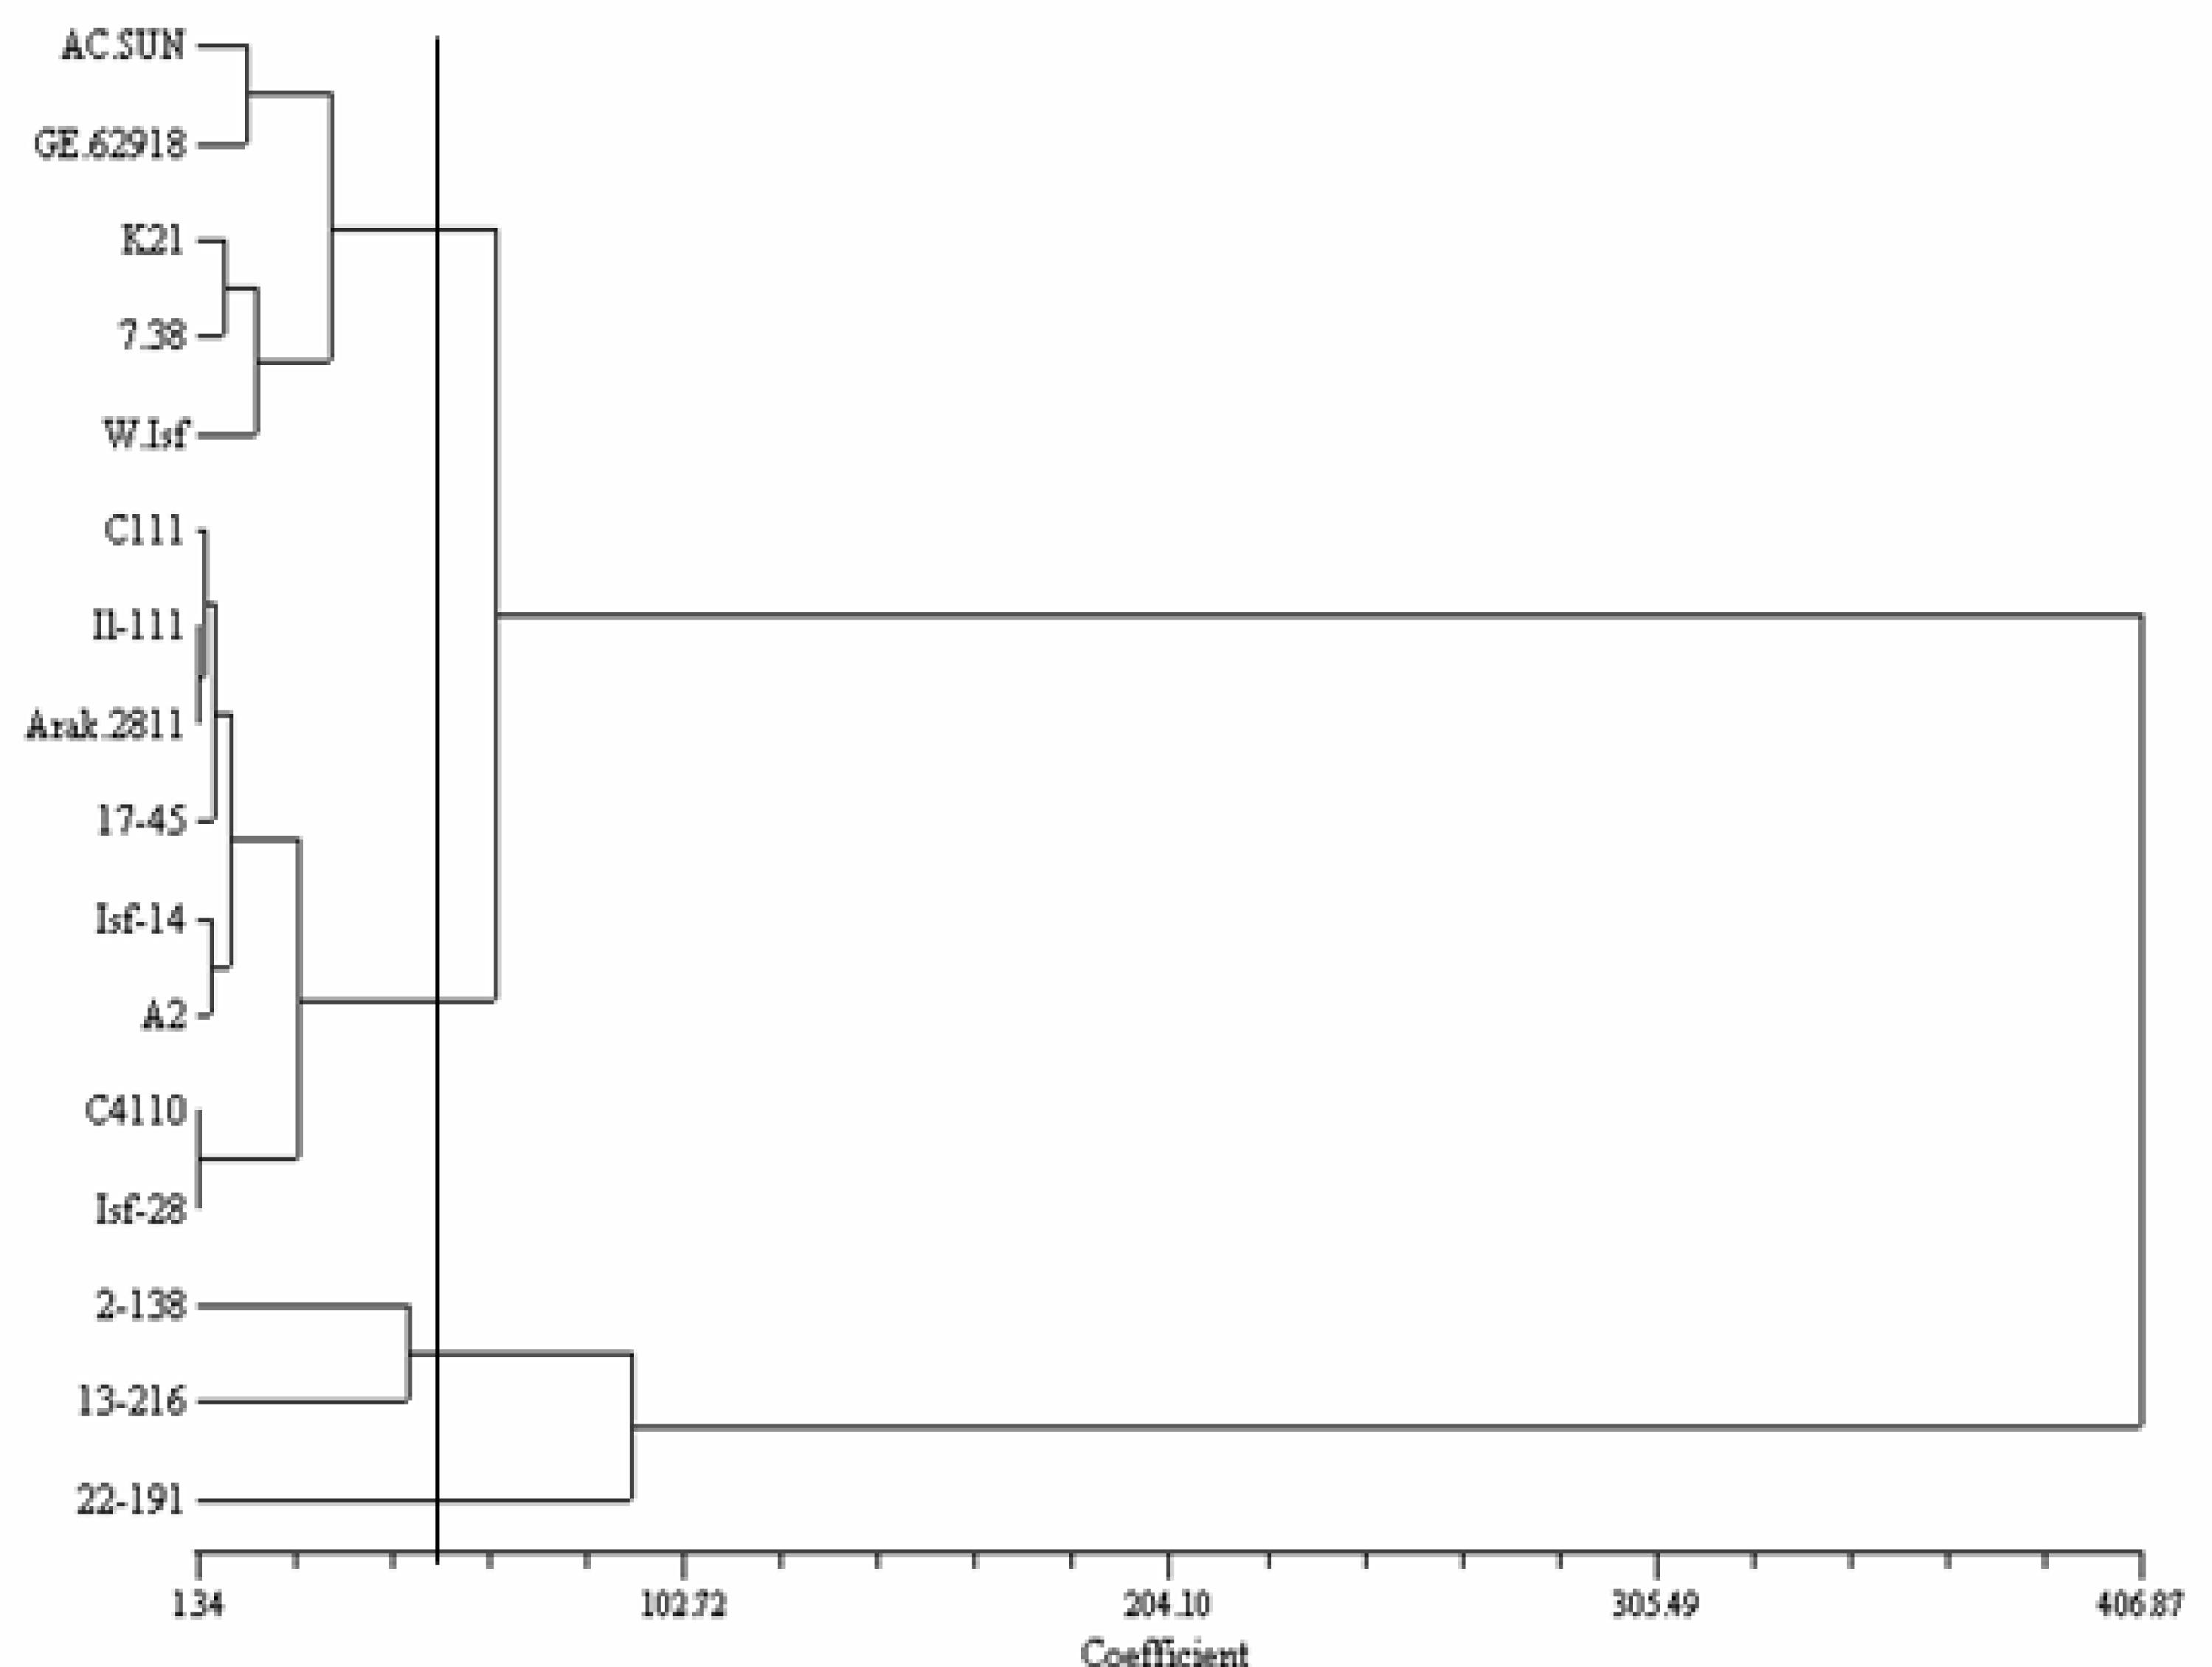
Clustering based on seed quality-related traits divided the genotypes into four groups (Figure 1). Group 1 includes GE62918 from Germany, AC-Sunset from Canada, Mex.7–38 from Mexico and two Iranian lines (K21 and Wht-ISF). Group 2 was the largest group and includes 5 Iranian lines (IL.111, Arak-2811, ISF14 and A2) and a Mexican cultivar (Mex.17-45). Group 3 only possesses two Mexican cultivars (Mex. 2-138 and Mex.13-216). Group 4 includes a Mexican cultivar (Mex.22-191).
There was a broad genetic variation among safflower genotypes for fatty acids, oil and protein content. These variations in the seed quality-related traits imply a considerable potential of the studied genotypes for safflower improvement. Also, the present study showed oleic type genotypes including Mex.7-38 and Mex.22-191 (Table 3). An Iranian line (A2) originated from a cold climate of Iran (Azarbayjan province) has an elevated linoleic content (75.5%). This finding might be related to the impact of temperature and geographical origin in the diversity of fatty acid contents [33]. Genetic variation for fatty acids and biochemical traits was also reported in safflower by other studies [8,22,34]. Variation of unsaturated fatty acids in safflower oil points out the possibility of improving oil quality through the breeding programs [10]. Although, genotypes from different geographical regions clustered in a same group (Figure 1), two Mexican genotypes created a separate cluster. Moreover, Mex.22-191, as an oleic type genotype, separated from the other genotypes. Considering the results of cluster analysis, genotypes from distant clusters, could be used to produce superior hybrid with elevated seed quality-related traits. In this study, a clear relationship between diversity patterns and geographical origin was not revealed. The lack of relationship of the genotypic clusters for seed quality-related traits with the geographical origins was also reported by others [11].

2.2. ISSR Analysis

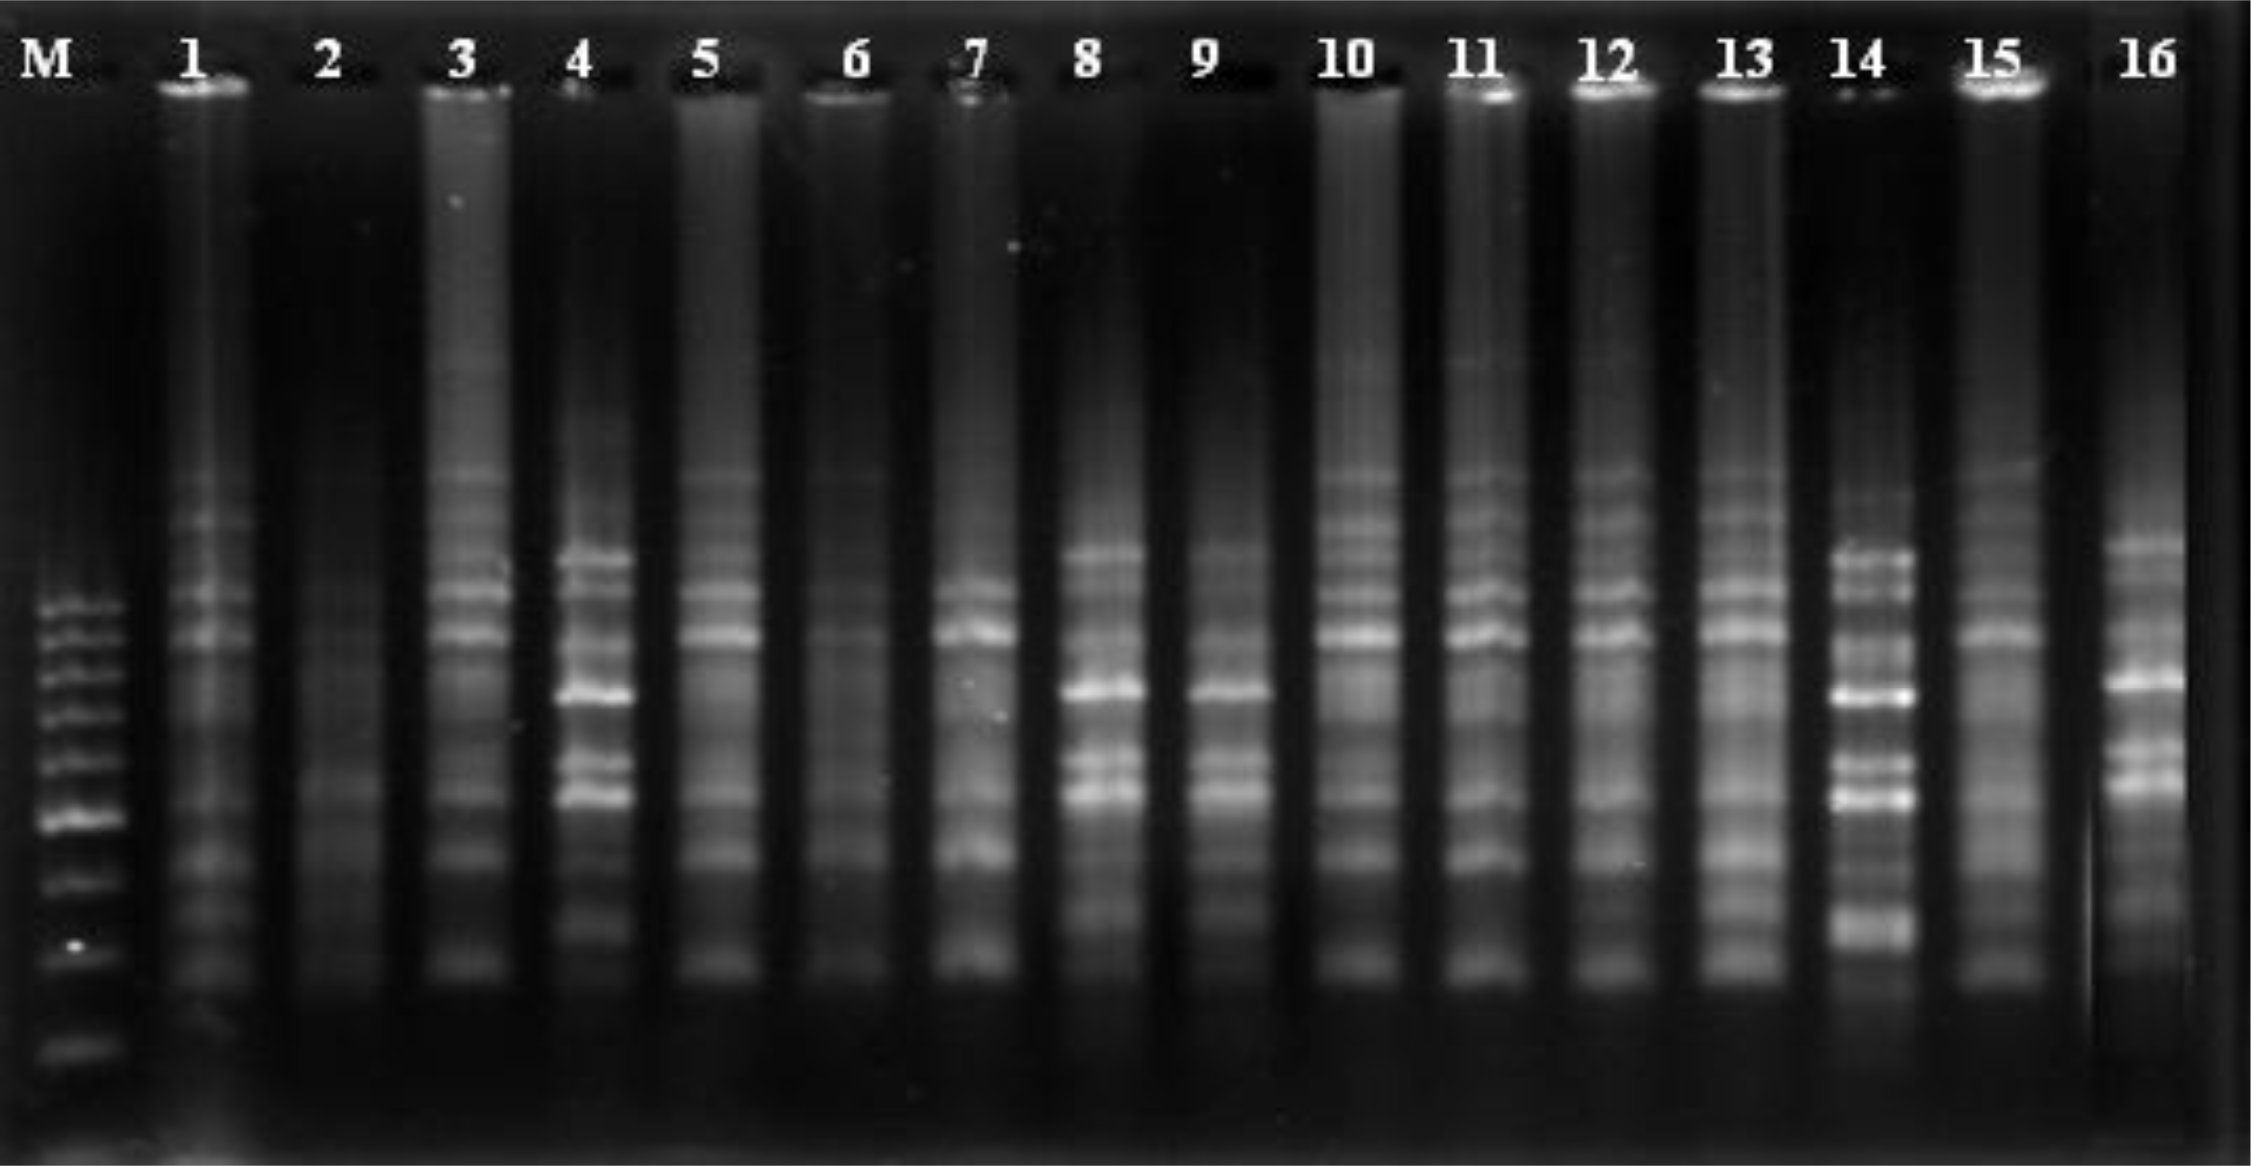
Out of 30 ISSR primers used, 20 showed polymorphism. Figure 2 shows the polymorphic fingerprinting pattern of the 16 safflower genotypes generated by ISSR primer number 16.
A total of 204 bands were scored for 20 ISSR primers (Table 4). With an average of 10.2 bands per primer, a total of 204 bands generated and 149 bands (73%) of these were polymorphic. Total generated band ranged from 5 to 16 and the polymorphic bands of the primers ranged from 3 to14 bands. The mean of polymorphic bands for (GA)n, (AC)n, (AG)n, (CT)n, (TCC)5, (TCC)7 and (TG)n primers was 12, 11, 10.4, 9.3, 8.5 and 8, respectively. The mean of polymorphism for (CT)n, (AC)n, (TCC)7, (TCC)5 and (TG)n was 83%, 76.5%, 69.5%, 58.66% and 50%, respectively. Two motif primers of (CT)n, (AC)n and (AG)
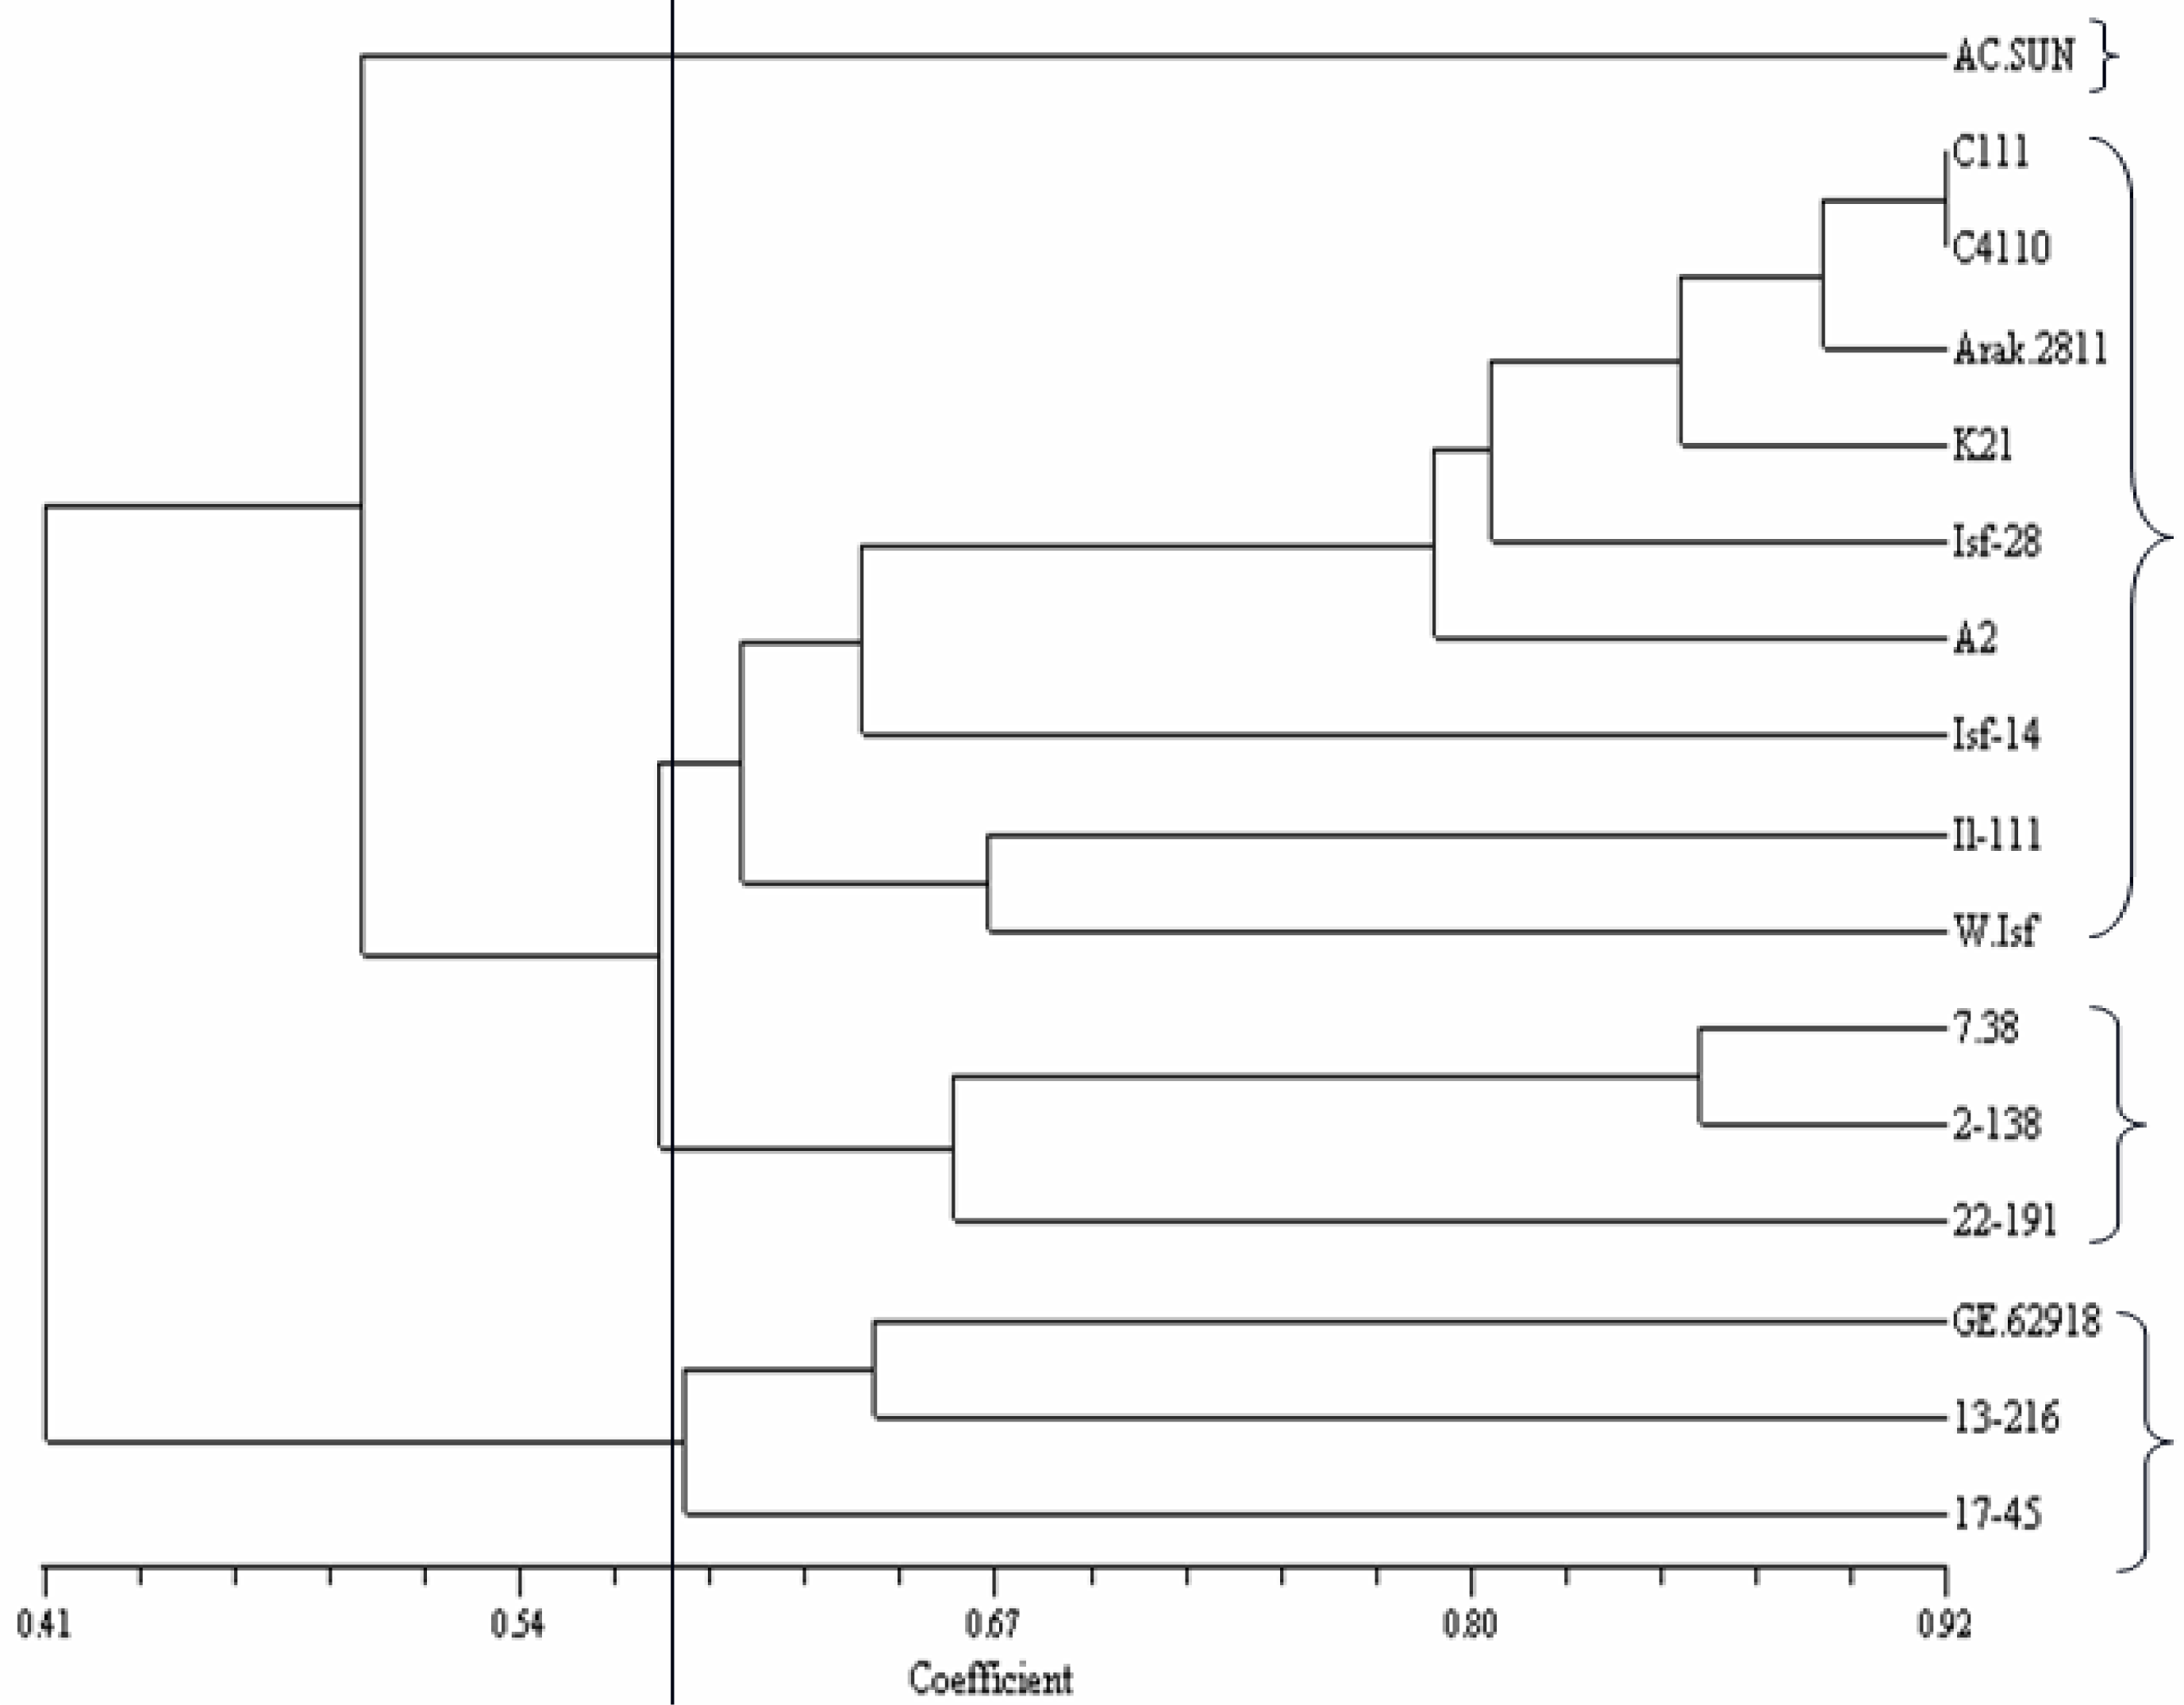
n types produced the highest mean of polymorphism. The un-weighted pair-group method with arithmetic mean (UPGMA) cluster analysis showed that 16 safflower genotypes were grouped into four marker-based groups (Figure 3). Cluster 1 comprises AC-Sunset, a Canadian genotype. Cluster 2 includes 9 Iranian lines from different geographical regions that compromised from Northern, Western and Central regions of Iran. Cluster 3 possessed 3 Mexican genotypes includes Mex.7-38, Mex.2-138 and Mex.22-191. Finally, cluster 4 contains 2 Mexican genotypes (Mex.13-216 and Mex.17-45) accompanied with GE62918 from Germany.
Principal coordinate analysis (PCoA) for displaying the relationships among the safflower genotypes was performed. The first three principal coordinates explained 75.56% of the total variation, with 59.82% explained by the first, 9.48% by the second and 6.25 by the third at the DNA sequence level (Table 5).
The ISSR primers used in this study revealed an acceptable genomic variation among the selected genotypes. The relationships between the genetic distances estimated based on seed quality traits and molecular markers was not statistically significant (r = 0.13).
Analysis of molecular variance (AMOVA) revealed a non-significant difference between two groups of genotypes (native vs. exotic). AMOVA for ISSR data also indicated significant variations within the genotypic groups.
Similar to seed quality-related traits, high molecular genetic variation was observed which is in agreement with the observation of high efficiency of ISSR marker in detecting genetic variation in safflower by Yang et al. [27]. Assessment of genetic diversity, based on both molecular markers and seed quality-related traits including biochemical traits and fatty acid composition, has only been employed in a few tree species [12,13].
In this study, the most polymorphic bands was related to (CT)n, (AC)n, and (AG)n primers. Similar to our results, Yang et al. [27], has reported that (AC)n and (CT)n ISSR primers produced the highest polymorphic bands in safflower. In this study, (GT)n primers have not produced any band, this finding was in agreement with Yang et al. [27]. On the other hand, in rice Blair et al. [15], have reported that (GT)n primers have produced a high frequency of banding pattern because of additional nucleotide in 5′ terminal sequence. Because of the high frequency of polymorphic band generated by (GA)n, (CT)n and (AC)n primers, it can be deduced that these motifs have a significant contribution in the safflower genome.
The cluster analysis based on ISSR data showed that there was a considerable agreement between geographic origin and their genomic similarities. However, in viewpoint of molecular clustering, similarities in genotypes that grouped in the same cluster could also arise because of sharing a common parentage, convergent evolution and selection. According to Figure 3, GE62918 (from Germany) and AC-Sunset (from Canada) have clustered in a same group with two Mexican cultivars. They could probably have originated from a common ancestor or probability of being duplicates [11]. A non-significant correlation between seed quality-related traits and ISSR markers in the Mantel test [35] suggested there was a slight similarity between these clusterings. This could be due to the exchange of plant material across the regions during the evolution of safflower [11]. Another reason could be that ISSR markers detect polymorphism in coding and non-coding regions of genome, but seed quality-related traits are the results of expressed sections of the genome [11].
Although some work based on morphological traits has been conducted to assess genetic variation in safflower genotypes, the results are still ambiguous, because phenotypic traits are affected by developmental stages and environmental conditions. On the other hand, ISSR markers overcome those disadvantages to a certain extent. The results of the present study are consistent with those of Yang et al. [27], who emphasized that ISSR, is an effective marker system for detecting genetic diversity among safflower genotypes and provides useful information about the phylogenic relationships.

3. Materials and Methods

3.1. Plant Materials and Growth Conditions

Sixteen safflower (C. tinctorious) genotypes including 9 with native and 7 with exotic origins were used (Table 6). Field experiment was conducted at Research Farm of Isfahan University of Technology, Isfahan, Iran (51°32′ E and 32°32′ N, 1630 m) in 2008. A randomized complete block design with three replications was used. Each plot consisted of three rows 40 cm apart and 5.5 m in length. Fertilizers were applied prior to sowing at a rate of 50 kg N ha−1 and 30 kg P ha−1, and additional side dressing of 50 kg N ha−1 was applied at the early flowering stage.

3.2. Oil Extraction

Seeds of the entries were dried at 60 °C for 4 h, using a ventilated oven, up to a moisture content of about 5%, and were then ground with a blender. Ten grams of ground seeds were used to extract the oil, using petroleum ether for 6 h in a Soxhlet system according to the American Oil Chemists’ Society (AOCS) method [36], and then the oil content as a percentage was calculated for each sample.

3.3. Fatty Acid Composition

The fatty acid composition of the oil samples was determined by gas chromatography (AOCS Ce 1–62; AOCS 1993) method. The oil sample of each experimental unit (plot) was converted to its fatty acid methyl esters (FAME). Oil samples (0.2 mL) were dissolved in hexane and transesterified with sodium methylate (0.1 M). Analyzes of FAMEs were carried out using an Agilent 6890 model gas chromatograph (Agilent Technologies, Palo Alto, CA, USA) equipped with a with a split-injection port, flame ionizing detector (FID) and a fused silica capillary column (HP-88, 100 m × 0.25 mm i.d.; film thickness = 0.2 μm). The samples (1.0 μL) were injected in split mode (split ratio 1:50). The initial oven temperature was set at 150 °C for 1 min, elevated at a rate of 5 °C min−1 to 190 °C for 2 min, and then ramped at 5 °C min−1 to the final 240 °C for 8 min. The injector temperature was set at 250 °C and the detector temperature was set at 280 °C. Nitrogen with at a flow rate of 1.5 mL min−1 was used as the carrier gas. Peak identification was performed by comparing the relative retention times with those of a commercial standard mixture of FAME. The fatty acid content of palmitic (C16:0), stearic (C18:0), oleic (C18:1), linoleic (C18:2) and linolenic (C18:3) were determined using a computing integrator and showed as the percentage of the oil.
The fatty acid content of myristic (C14:0), palmitic (C16:0), stearic (C18:0), oleic (C18:1), linoleic (C18:2), and linolenic (18:3) were determined. Only the trace amount of myristic and linolenic acids were detected and hence were not further considered. The relative percentage of each fatty acid was determined by integration of each peak in the chromatogram.

3.4. Seed Protein, Fiber and Ash Contents

Protein (%), fiber (%) and ash (%) contents of seeds from each sample were estimated using near-infrared reflectance spectroscopy (NIR) (model 8200, Perten Instruments AB, Sweden). Forty-eight samples (three field replications of the genotypes) were scanned three times.

3.5. ISSR Analysis

Genomic DNA was extracted from 25–30 plants from young leaves of each genotype following the protocol of Murray and Thompson [37]. DNA was quantified electrophoretically using lambda standard DNA on 0.7% agarose gel. Thirty ISSR primers were used in this study. PCR reaction was performed using 15 μL PCR mixtures containing 1.5 μL of 10× buffer (0.1 M of Tris-HCL, pH 8.3, 0.5 m KCl), 2 Mm MgCl2, 200 μM dNTPs, 2 μL each primer (10 pM concentration), 2 μL of DNA template (30 ng) and 1 U Taq DNA polymerase. From a total of 30 primers used, 20 capable of producing repeatable and polymorphic bands were used for PCR amplification (Table 1), using Peqlab Primus 96 advanced thermal cycler (Peqlab, Erlangen, Germany). DNA thermal cycler was programmed by 40 cycles of 1 min at 94 °C, 1 min at particular annealing temperature for each primer and 2 min at 72 °C, then a final extension of 7 min at 72 °C. The products of amplified PCR were separated by electrophoresis on 1.4% agarose gels using gel electrophoresis equipped with Biometra Model PS9009TC power supply at 50 W for 2 h in 1× TBE buffer.
Gels were stained with ethidium bromide (0.5 mg/mL). DNA banding patterns were visualized using Biometra gel documentation Model S2.
The ISSR bands were scored as presence (1) or absence (0) for each of 16 genotypes with the 20 primers. The binary matrix was subjected to statistical analyses by NTSYS-pc, version 2.5 [38]. Jaccard’s similarity coefficient was employed to compute pair wise genetic similarities. The corresponding dendrogram was constructed by applying un-weighted pair-group method with arithmetic mean (UPGMA). Number of polymorphic bands and percentage of polymorphism were calculated for each primer.
For achieving the association between seed quality traits and molecular distances of genotypes, the relationships between two matrices was assessed using the Mantel test [35]. Principal coordinate analysis (PCoA) was performed for showing the relationships among the genotypes [38]. Analysis of molecular variance (AMOVA) was performed to estimate variance components for ISSR data, partitioning the variation into within and among two types of genotypic origins (exotic and native) using Arliquin 2.0 software [39].

3.6. Statistical Analysis

The analysis of variance (ANOVA) of data for seed quality-related traits was performed using General Linear Model of SAS program [40]. Mean comparisons were conducted using the Fisher’s least significant difference (LSD0.05) test. Clustering of genotypes based on seed quality-related traits and molecular markers was carried out using UPGMA method [38]. The means of each trait were used for cluster analysis. Euclidean distance was used for cluster analysis with the unweighted pair group arithmetic means method (UPGMA) by using NTSYS-pc software version 2.02. PCoA was carried out with NTSYS_pc statistical package, version 2.02 [38]. Cluster and principal coordinate analysis were performed to assess patterns of diversity among genotypes and to select the most distant genotypes from each group based on molecular markers.

4. Conclusions

This is the first published report on the assessment of genetic diversity in a field crop using both molecular markers and seed quality-related traits. In summary, our results showed significant variation among the genotypes of safflower for most of the biochemical traits studied. The findings of high genetic variation for both seed quality-related traits and polymorphism at DNA level reveal that seed quality traits can be efficiently improved by the selection programs in safflower. Cluster analysis based on ISSR markers divided the genotypes into four distinct groups possessing logical similarity with their geographical origin.

Acknowledgments

This work was partially funded by Center of Excellence for Oilseed Crops at Isfahan University of Technology, Isfahan, Iran.

References

  1. Ashri, A. Evaluation of the germplasm collection of safflower (Carthamus tinctorius L.) V. Distribution and regional divergence for morphological characters. Euphytica 1975, 24, 651–659. [Google Scholar]
  2. Knowles, PF. Centers of plant diversity and conservation of crop germplasm: Safflower. Econ. Bot 1969, 23, 324–329. [Google Scholar]
  3. Chapman, MA; Hvala, J; Strever, J; Burke, JM. Population genetic analysis of safflower (Carthamus tinctorius; Asteraceae) reveals a Near Eastern origin and five centers of diversity. Am. J. Bot 2010, 97, 831–840. [Google Scholar]
  4. Knowles, PF; Ashri, A. Safflower Carthamus Tinctorius (Compositae). In Evolution of Crop Plants, 2nd ed; Smartt, J, Simmonds, NW, Harlow, K, Eds.; Longman: Harlow, UK, 1995; pp. 47–50. [Google Scholar]
  5. Weiss, EA. Oil Seed Crops, 2nd ed; Blackwell Science Ltd: Oxford, UK, 2000; p. 364. [Google Scholar]
  6. Gecgel, U; Demirci, M; Esendal, E. Seed yield, oil content and fatty acids composition of safflower (Carthamus tinctorius L.) varieties sown in spring and winter. Int. J. Nat. Eng. Sci 2007, 1, 11–15. [Google Scholar]
  7. Singh, RJ. Genetic Resources, Chromosome Engineering and Crop Improvement; CRC Press Inc: Boca Raton, FA, USA, 2007; p. 320. [Google Scholar]
  8. Camas, N; Cirak, C; Esendal, E. Seed yield, oil content and fatty acid composition of safflower (Carthamus tinctorius L.) grown in northern Turkey conditions. J. Fac. Agric., OMU 2007, 22, 98–104. [Google Scholar]
  9. Dajue, L; Mundel, HH. Safflower (Carthamus tinctorius L.); IPGRI: Rome, Italy, 1996; p. 83. [Google Scholar]
  10. Hamdan, YAS; Perez-Vich, B; Fernandez-Martinez, JM; Velasco, L. Inheritance of very high linoleic acid content and its relationship with nuclear male sterility in safflower. Plant Breed 2008, 127, 507–509. [Google Scholar]
  11. Khan, MA; von Witzke-Ehbrecht, S; Maass, BL; Becher, HC. Relationships among different geographical groups, agro-morphology, fatty acid composition and RAPD marker diversity in safflower (Carthamus tinctorius). Genet. Resour. Crop Evol 2008, 56, 19–30. [Google Scholar]
  12. Basha, SD; Francis, G; Makkar, HSP; Becker, K; Sujatha, M. A comparative study of biochemical traits and molecular markers for assessment of genetic relationships between Jatropha curcas L. germplasm from different countries. Plant Sci 2009, 176, 812–823. [Google Scholar]
  13. Li, P; Yangdong, W; Chen, Y; Zhang, SH. Genetic diversity and association of ISSR markers with the eleostearic content in tung tree (Vernicia fordii). Afr. J. Biotechnol 2009, 8, 4782–4788. [Google Scholar]
  14. Godwin, ID; Aitken, EAB; Smith, W. Application of inter simple sequence repeat (ISSR) markers to plant genetics. Electrophoresis 1997, 18, 1524–1528. [Google Scholar]
  15. Blair, MW; Panaud, O; Mccouch, SR. Inter-simple sequence repeat (ISSR) amplification for analysis of microsatellite motif frequency and fingerprinting in rice (Oryza sativa L.). Theor. Appl. Genet 1999, 98, 780–792. [Google Scholar]
  16. Jin, Z; Li, J. ISSR analysis on genetic diversity of endangered relic shrub Sinocalycanthus chinensis. Chin J. Appl. Ecol 2007, 18, 247–253. [Google Scholar]
  17. Pivoriene, O; Pasakinskiene, I; Brazauskas, G; Lideikyte, L; Jensen, LB; Lubberstedt, T. Inter-simple sequence repeat (ISSR) loci mapping in the genome of perennial ryegrass. Biologia 2008, 54, 17–21. [Google Scholar]
  18. Paterson, AH; Tanksley, SD; Sorrells, ME. DNA markers in plant improvement. Adv. Agron 1991, 46, 39–90. [Google Scholar]
  19. Dwiedi, S; Upadhyaya, HD; Hegde, MD. Development of core collection in safflower (Carthamus tinctorius L.) germplasm. Genet. Resour. Crop Evol 2005, 52, 821–830. [Google Scholar]
  20. Jaradat, AA; Shahid, M. Patterns of phenotypic variation in a germplasm collection of Carthamus tinctorius L. from the Middle East. Genet. Resour. Crop Evol 2006, 2, 129–140. [Google Scholar]
  21. Pascual-Villalobos, MJ; Alburquerque, N. Genetic variation of a safflower germplasm collection grown as a winter crop in southern Spain. Euphytica 1996, 92, 327–332. [Google Scholar]
  22. Rojas, R; Ruso, J; Osorio, J; Haro, A; Fernandez-Martinez, JM. Variability in protein and hull content of the seed of a world collection of safflower. Sesame Safflower Newsl 1993, 8, 122–126. [Google Scholar]
  23. Han, Y; Li, D. Evaluation of safflower (Carthamus tinctorious L.) germplasm-analysis in fatty acid composition of seeds of domestic and exotic safflower varieties. Bot. Res 1992, 6, 28–35. [Google Scholar]
  24. Chapman, MA; Hvala, J; Strever, J; Marvienko, M; Kozik, A; Michelmore, RW; Tang, S; Knapp, SJ; Burke, JM. Development, polymorphism, and cross-taxon utility of EST-SSR markers from safflower (Carthamus tinctorius L.). Theor. Appl. Genet 2009, 120, 85–91. [Google Scholar]
  25. Seghal, D; Raina, N. Genotyping safflower (Carthamus tinctorius L.) cultivars by DNA fingerprints. Euphytica 2005, 146, 67–76. [Google Scholar]
  26. Ash, GJ; Raman, R; Crump, NS. An investigation of genetic variation in Carthamus lanatus in New South Wales, Australia, using intersimple sequence repeats (ISSR) analysis. Weed Res 2003, 43, 208–213. [Google Scholar]
  27. Yang, YX; Wu, W; Zheng, YL; Chen, L; Liu, RJ; Huang, CY. Genetic diversity and relationships among safflower (Carthamus tinctorius L.) analyzed by inter-simple-sequence repeats (ISSRS). Genet. Resour. Crop Evol 2007, 54, 1043–1051. [Google Scholar]
  28. Sabzalian, MR; Mirlohi, A; Saeidi, G; Rabbani, MT. Genetic variation among populations of wild safflower, Carthamus oxyacanthus analyzed by agro-morphological traits and ISSR markers. Genet. Resour. Crop Evol 2009, 56, 1057–1064. [Google Scholar]
  29. Mahasi, MJ; Wachira, FN; Pathak, RS; Riungu, TC. Genetic polymorphism in exotic safflower (Carthamus tinctorius L.) using RAPD markers. J. Plant Breed. Crop Sci 2009, 1, 8–12. [Google Scholar]
  30. Amini, F; Saeidi, G; Arzani, A. Study of genetic diversity in safflower genotypes using agro-morphological traits and RAPD markers. Euphytica 2008, 163, 21–30. [Google Scholar]
  31. Naresh, V; Yamini, KN; Rajendrakumar, P; Kumar, VD. EST-SSR marker-based assay for the genetic purity assessment of safflower hybrids. Euphytica 2009, 170, 347–353. [Google Scholar]
  32. Fernandez-Martinez, JM; Rio, M; Haro, A. Survey of safflower (Carthamus tinctorius L.) germplasm for variants in fatty acid composition and other seed characters. Euphytica 1993, 69, 115–122. [Google Scholar]
  33. Cosge, B; Gurbuz, B; Kiralan, M. Oil content and fatty acid composition of some safflower (Carthamus tinctorius L.) varieties sown in spring and winter. Int. J. Nat. Eng. Sci 2007, 1, 11–15. [Google Scholar]
  34. Johnson, RC; Bergman, JW; Flynn, CR. Oil and meal characteristics of core and non-core safflower accessions from the USDA collection. Genet. Resour. Crop Evol 1999, 46, 611–618. [Google Scholar]
  35. Mantel, N. The detection of disease clustering and a generalized regression approach. Cancer Res 1967, 27, 209–220. [Google Scholar]
  36. American Oil Chemists’ Society (AOCS). Official Methods and Recommended Practices of the American Oil Chemists’ Society, 4th ed.; Method Ce 1–62; AOCS: Champaign, IL, USA, 1993. [Google Scholar]
  37. Murray, MG; Thampson, WF. Rapid isolation of high molecular weight plant DNA. Nucl. Acid Res 1998, 8, 4321–4325. [Google Scholar]
  38. Rohlf, M. NTSYSPC Numerical Taxonomy and Multivariate Analysis System, Version 202; Department of Ecology and Evaluation: State University of New York, NY, USA, 1998. [Google Scholar]
  39. Excoffer, L; Smouse, PE; Quattro, JM. Analysis of molecular variance inferred from metric distances among DNA haplotypes: Application to human mitochondrial DNA restriction sites. Genetics 1992, 131, 479–491. [Google Scholar]
  40. SAS Institute. SAS/STAT User’ Guide; Institute, Inc.: Cary, NC, USA, 1999. [Google Scholar]
Figure 1. UPGMA-based dendrogram showing genetic relationship among 16 safflower genotypes based on seed quality-related traits.
Ijms 12 02664f1
Figure 2. ISSR agarose gel profile of 16 safflower genotypes using primer number 16 (as described in Table 2). Numbers on the top of wells correspond to the genotypic number listed in Table 6.
Ijms 12 02664f2
Figure 3. UPGMA-based dendrogram showing genetic relationship among 16 safflower genotypes based on Jaccard’ s similarity estimates obtained for ISSR markers.
Ijms 12 02664f3
Table 1. Analysis of variance for seed quality-related traits in safflower genotypes.
Source of variationMean Squares
dfC16:0C18:0C18:1C18:2Oil (%)Protein (%)Ash (%)Fiber (%)
Replication20.89 *0.25 **34.4189.911.063.06 *0.0010.47
Genotype155.09 **1.31 **155.7 **196.6 **31.69 **38.07 **1.40 **22.16 **
Residual300.230.0345.6290.090.750.7070.142.00
* and ** significant at P < 0.05 and P < 0.01, respectively.
Fatty acids: palmitic (C16:0), stearic (C18:0), oleic (C18:1), linoleic (C18:2).
Table 2. Mean comparisons of the seed quality-related traits in safflower genotypes.
GenotypeC16:0 C18:0C18:1C18:2Oil (%)Protein (%)Ash (%)Fiber (%)
AC-Sunset7.901.5219.5071.5629.3622.802.7039.83
GE629187.292.9418.2070.5625.5420.101.8041.10
C1119.612.6015.9572.6127.3718.502.5141.40
C411010.372.0315.4272.1127.6523.702.8039.70
ISF1411.071.5014.173.9629.7225.461.8035.00
A28.202.5713.7875.5426.5023.302.7139.00
K218.832.9020.8667.8030.6225.602.5042.36
ISF2810.522.3015.571.5831.0620.303.1037.40
IL.1119.081.8115.6473.4525.0818.011.9338.83
Wht-ISF8.432.8022.7965.7120.9519.101.7535.30
Arak-28117.702.0414.9775.4327.3018.402.437.3
Mex.7-387.962.9335.2853.8326.8121.302.6438.50
Mex.2-1389.471.5626.5962.3733.5022.402.3039.03
Mex.22-1917.301.8635.2655.8232.6517.551.0334.80
Mex.13-2166.491.4329.4262.6631.5013.500.9235.02
Mex.17-458.302.4018.7770.833114.301.0033.01
LSD0.011.080.4115.1621.31.951.880.853.17
Genotypic variance1.620.4236.6835.510.3112.450.426.72
Phenotypic variance1.690.4351.8865.510.5612.680.467.38
Genotypic CV (%)14.524.529.158.7111.2417.3630.336.82
Phenotypic CV (%)14.824.934.6911.811.3517.2631.757.13
† Fatty acids: palmitic (C16:0), stearic (C18:0), oleic (C18:1), linoleic (C18:2).
Table 3. Correlation coefficients for seed quality-related traits of 16 safflower genotypes.
C16:0C18:0C18:1C18:2Oil (%)Protein (%)Ash (%)Fiber (%)
C16:01
C18:0−0.171
C18:1−0.51 *−0.021
C18:20.39−0.05−0.98 **1
Oil0.05−0.50 *0.29−0.261
Protein0.54 *0.09−0.270.19−0.031
Ash0.48 *0.23−0.390.31−0.160.66 **1
Fiber0.130.34−0.250.21−0.170.54 **0.67 **1
* and ** significant at P < 0.05 and P < 0.01, respectively.
Fatty acids: palmitic (C16:0), stearic (C18:0), oleic (C18:1), linoleic (C18:2).
Table 4. ISSR primers, number of fragments, number of polymorphic fragments and percentage of polymorphism generated in the safflower genotypes.
PrimerSequencesTotal Number of FragmentsNumber of Polymorphic FragmentsPolymor-Phism (%)
13′-C(AG)8-5′161487
23′-(CCT)7H*V*H*-5′9777
33′-YC(AG)8-5′11981
43′-C(CA)8-5′10770
53′-GY(CA)8-5′121191
63′-CY(GA)8-5′131184
73′-GY(GA)8-5′9778
83′-YR-(CCT)5-5′11981
93′-(CCT)5H*V*H-5′8562
103′-GR(TC)8-5′121191
113′-(CCT)7B*D*B*-5′8562
123′-(CA)7D*B*D*-5′9555
133′-GY(CA)8-5′111090
143′-(CCT)5D*B*D*-5′9333
153′-C(GA)8-5′5360
163′-TY(GA)8-5′141285
173′-Y(AG)8-5′12325
183′-G(TC)8-5′8675
193′-GY(AG)8-5′9777
203′-TR(GT)8-5′8450
Total20414973
Average10.27.45
R = A/T, Y = G/C, B = T/G/C, D = A/T/G, H = A/T/C, V = 3A/G/C.
Table 5. Eigenvalue, explained variance and cumulative in the principal coordinate analysis (PCoA) used to classify 16 safflower genotypes by ISSR markers.
Principal CoordinateEigenvalueExplained Variance (%)Cumulative Variance (%)
19.5759.8259.82
21.519.4869.30
31.016.2575.56
Table 6. Safflower genotypes used in this study.
EntryGenotypeOrigin
1C111Selected line from Kouse landrace
2C4110Selected line from Kouse landrace
3ISF14Selected line from Isfahan landrace
4A2Selected line from Azarbayjan landrace
5K21Selected line from Kordestan landrace
6ISF28Selected line from Isfahan landrace
7IL.111Selected line from Auromyeh landrace
8Wht-ISFSelected line from Isfahan landrace
9Arak-2811Selected line from Markazy landrace
10AC-SunsetCanada
11GE62918Germany
12Mex.7-38Mexico
13Mex.2-138Mexico
14Mex.22-191Mexico
15Mex.13-216Mexico
16Mex.17-45Mexico

