Structural Determinants of CX-4945 Derivatives as Protein Kinase CK2 Inhibitors: A Computational Study

Abstract
:1. Introduction
2. Materials and Methods
2.1. Data Sets
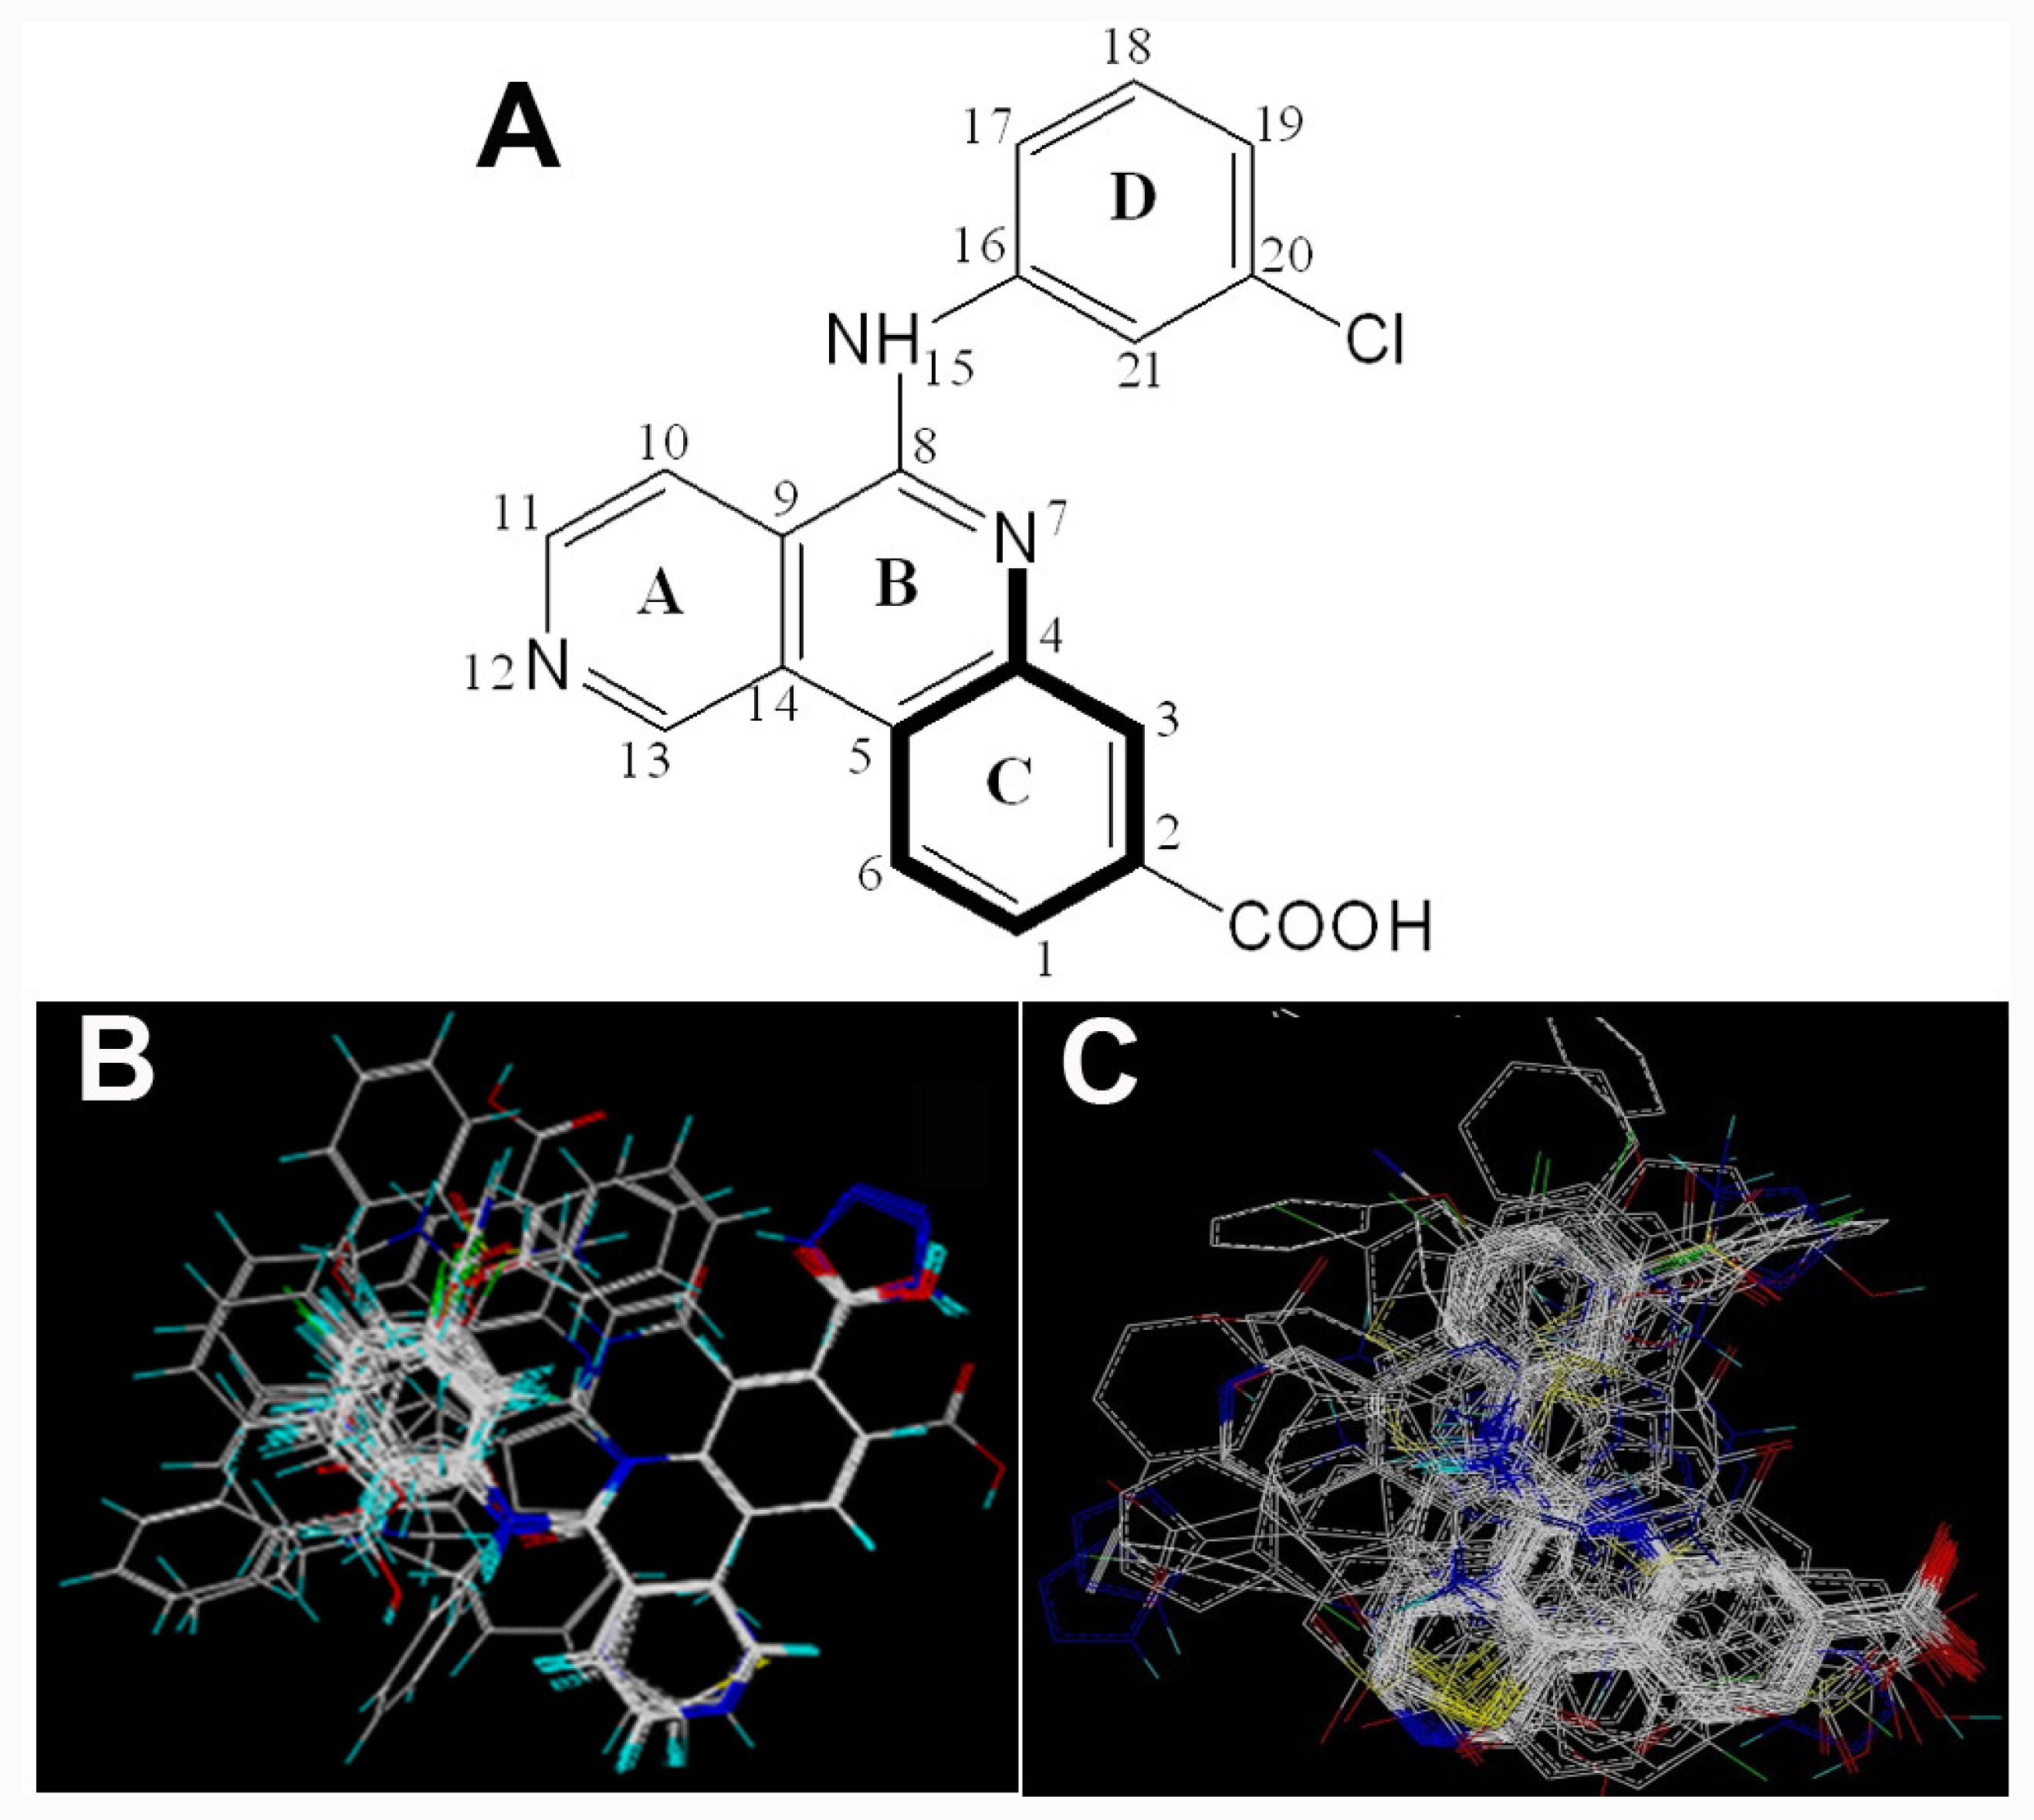
2.2. Conformational Sampling and Alignment
2.3. CoMFA and CoMSIA 3D-QSAR Models
2.4. Molecular Dynamics
3. Results and Discussion
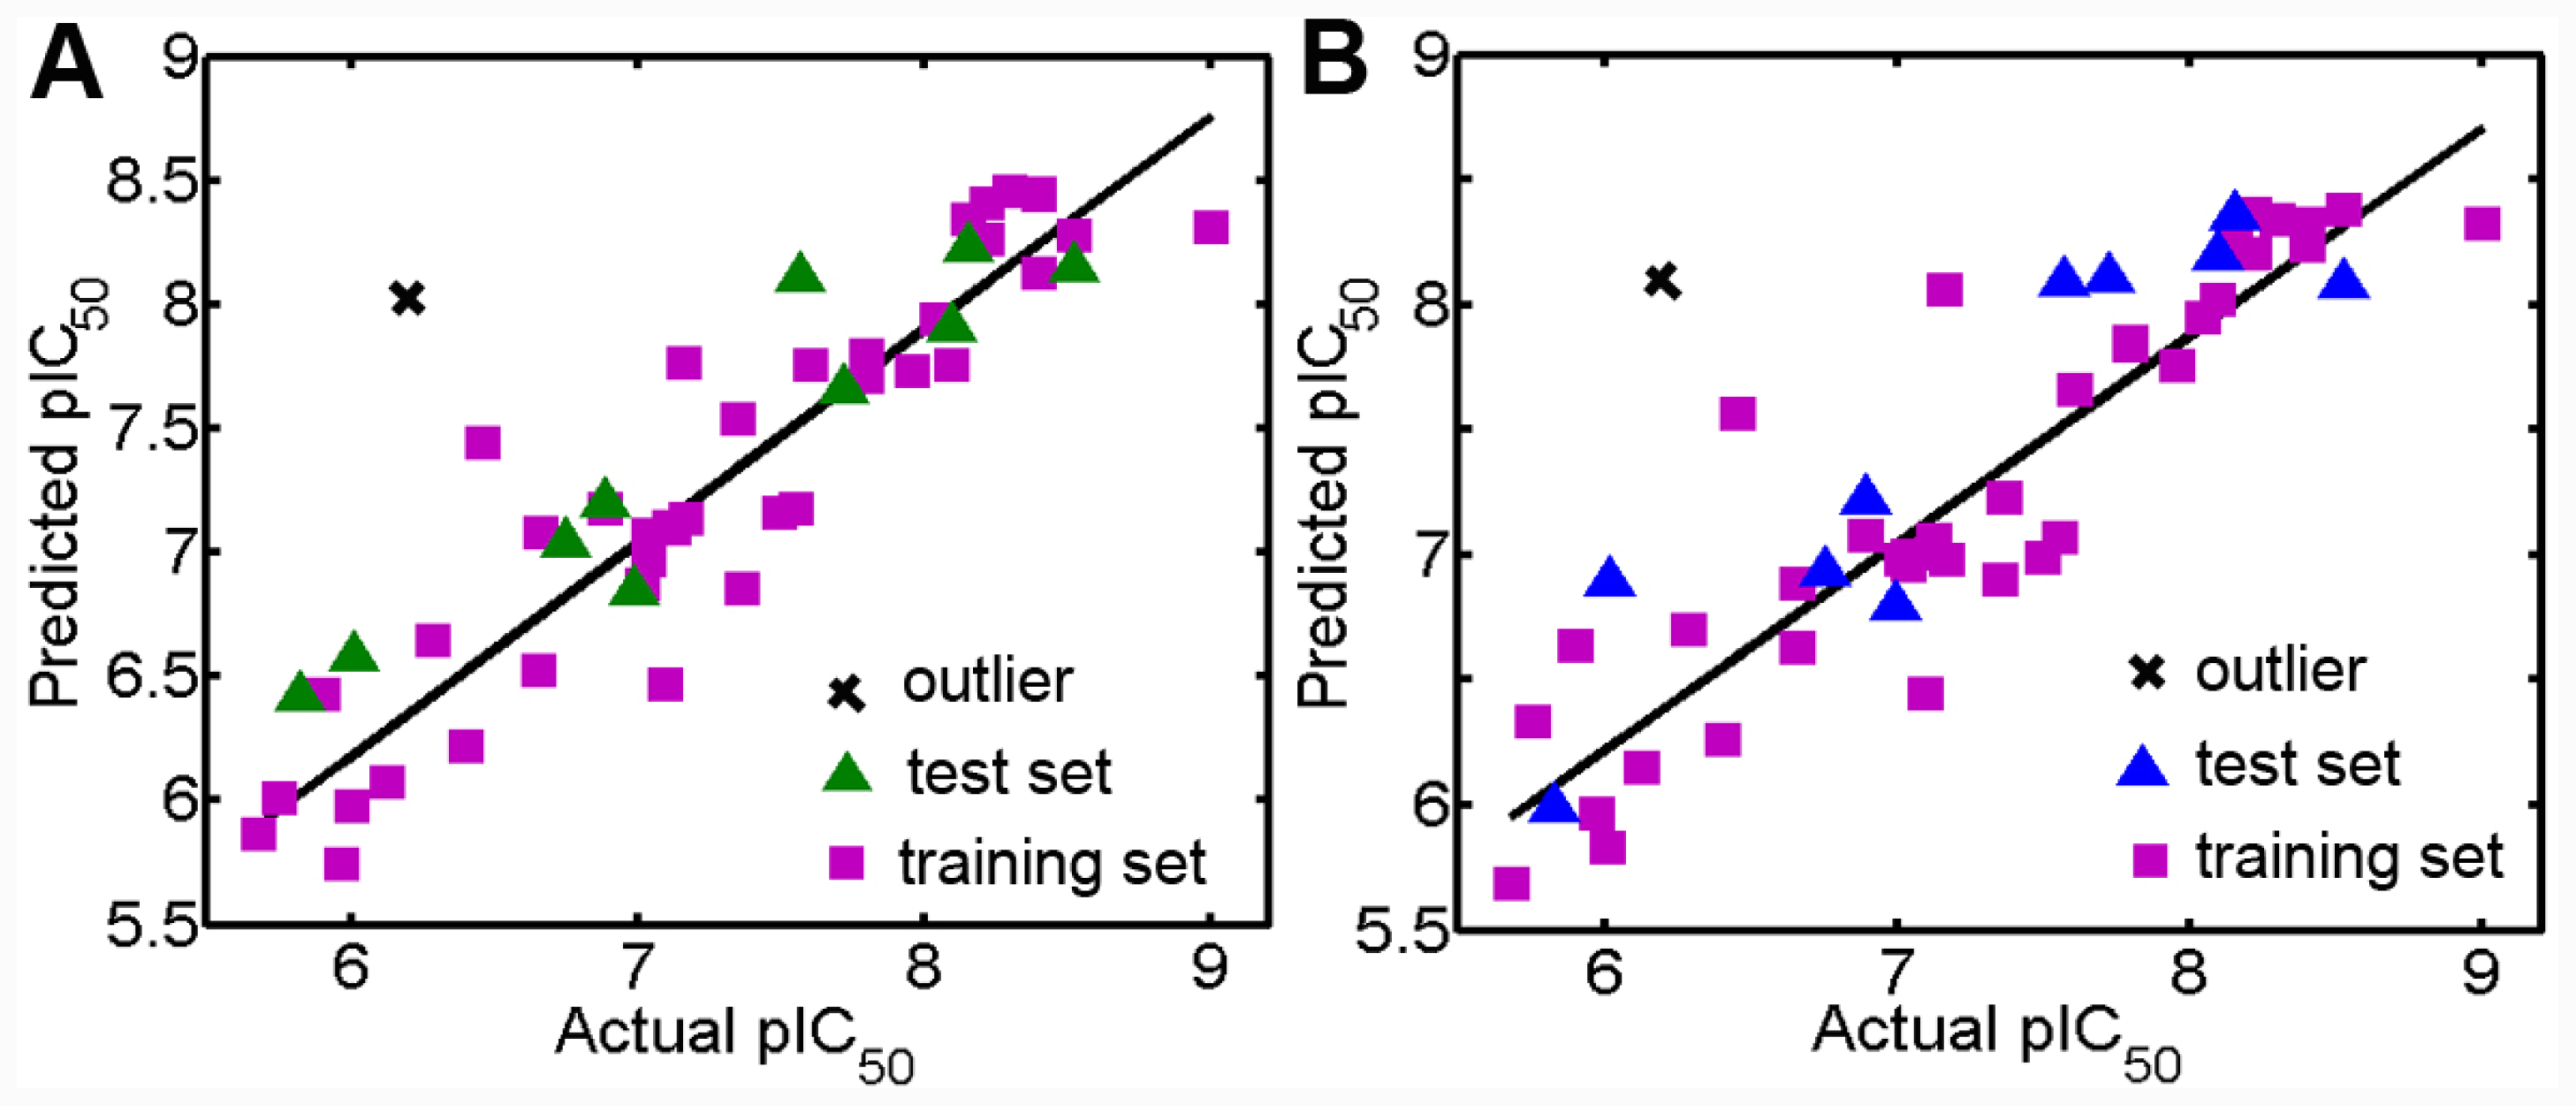
3.1. Validation of the 3D QSAR Models
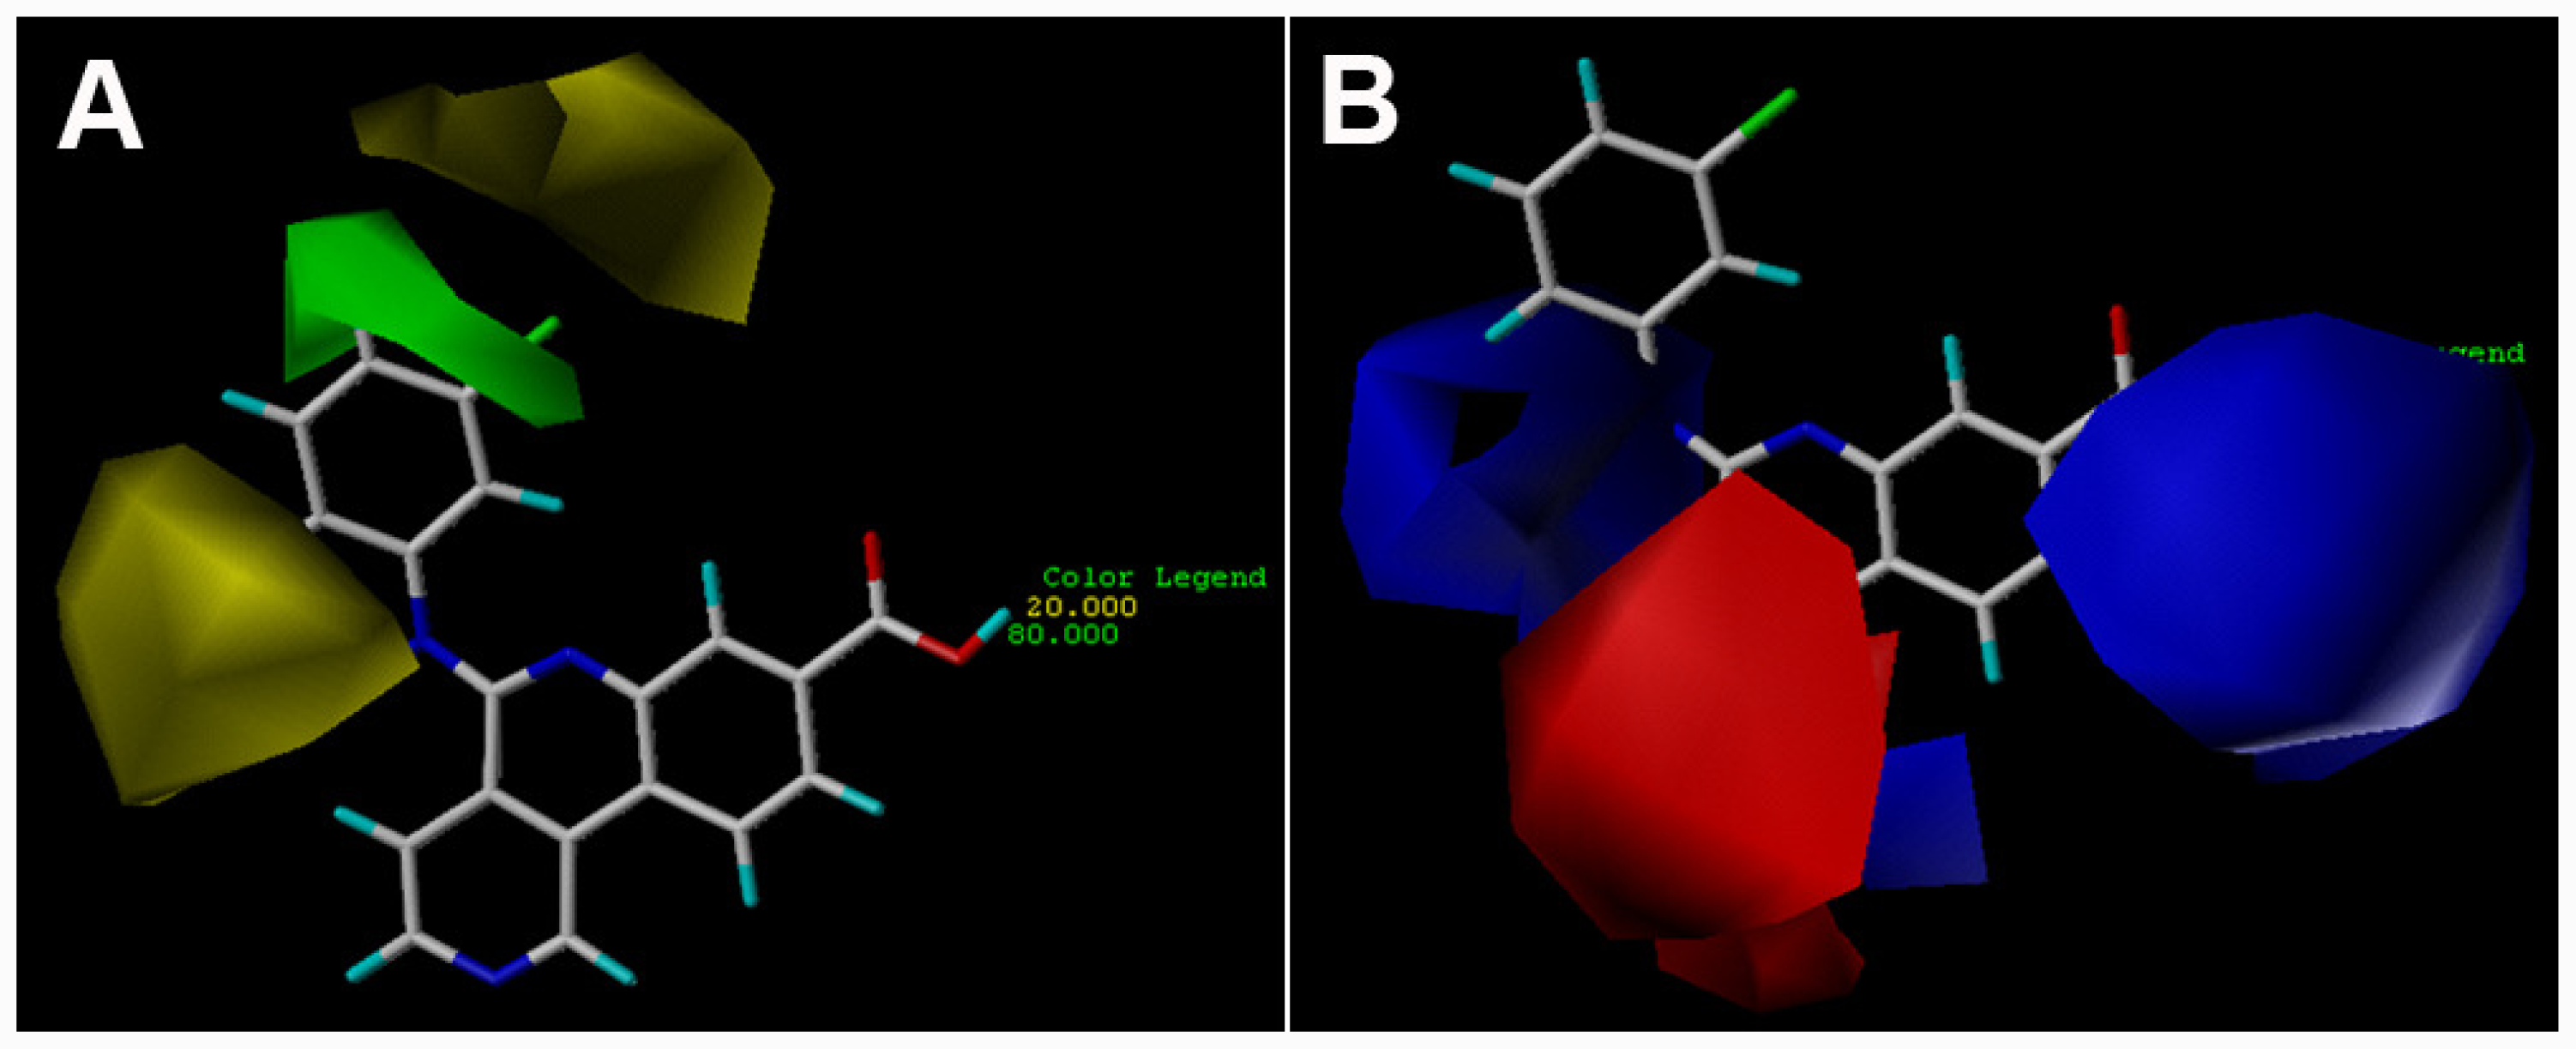
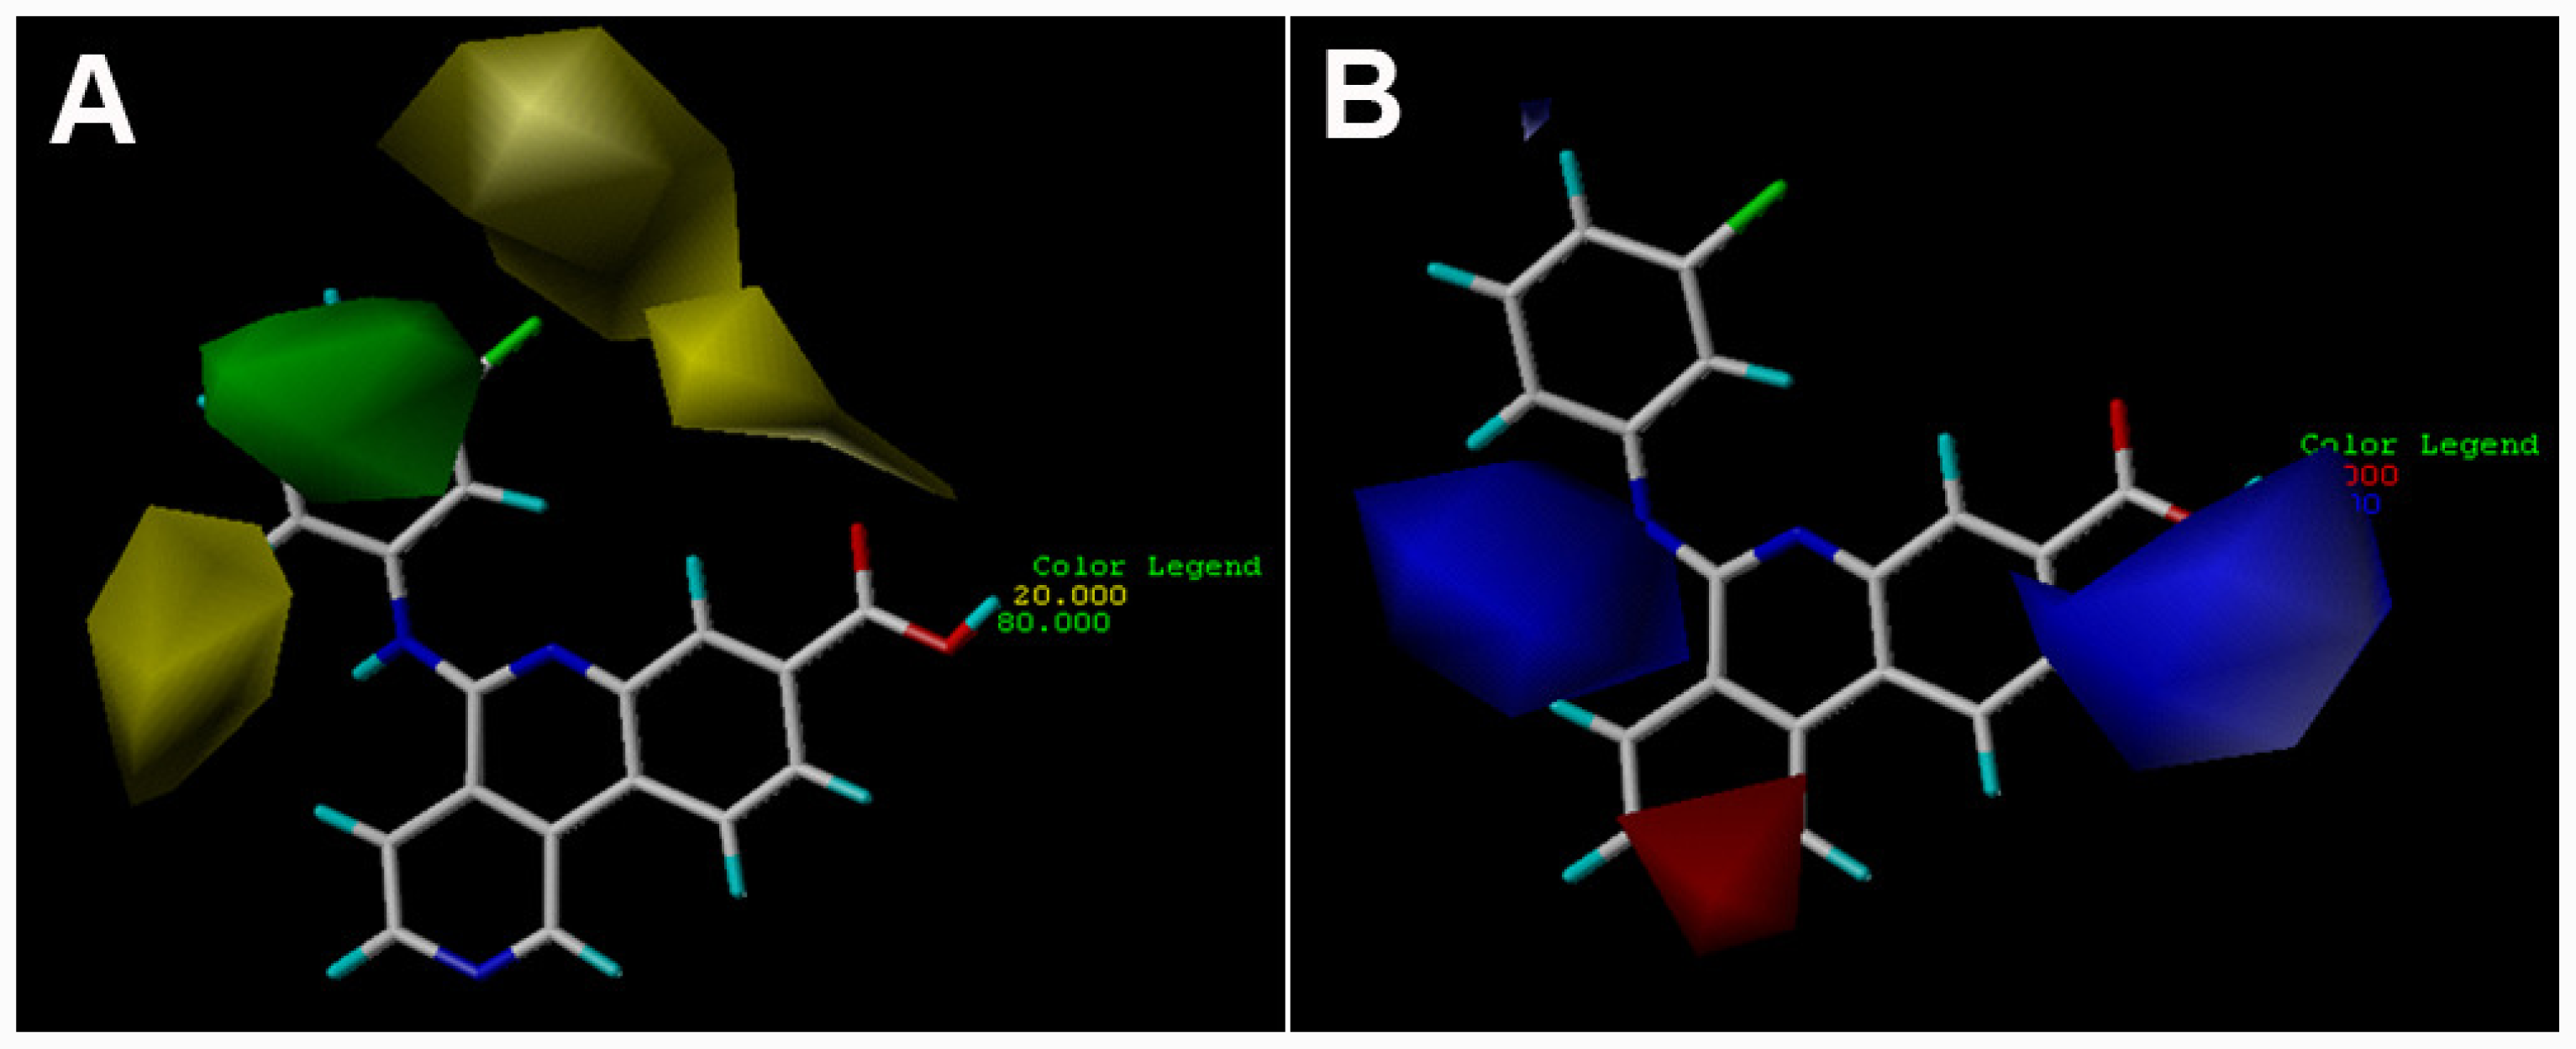
3.2. 3D-QSAR Contour Maps
 ) is more active than compound 24 (with
 group at the same location).
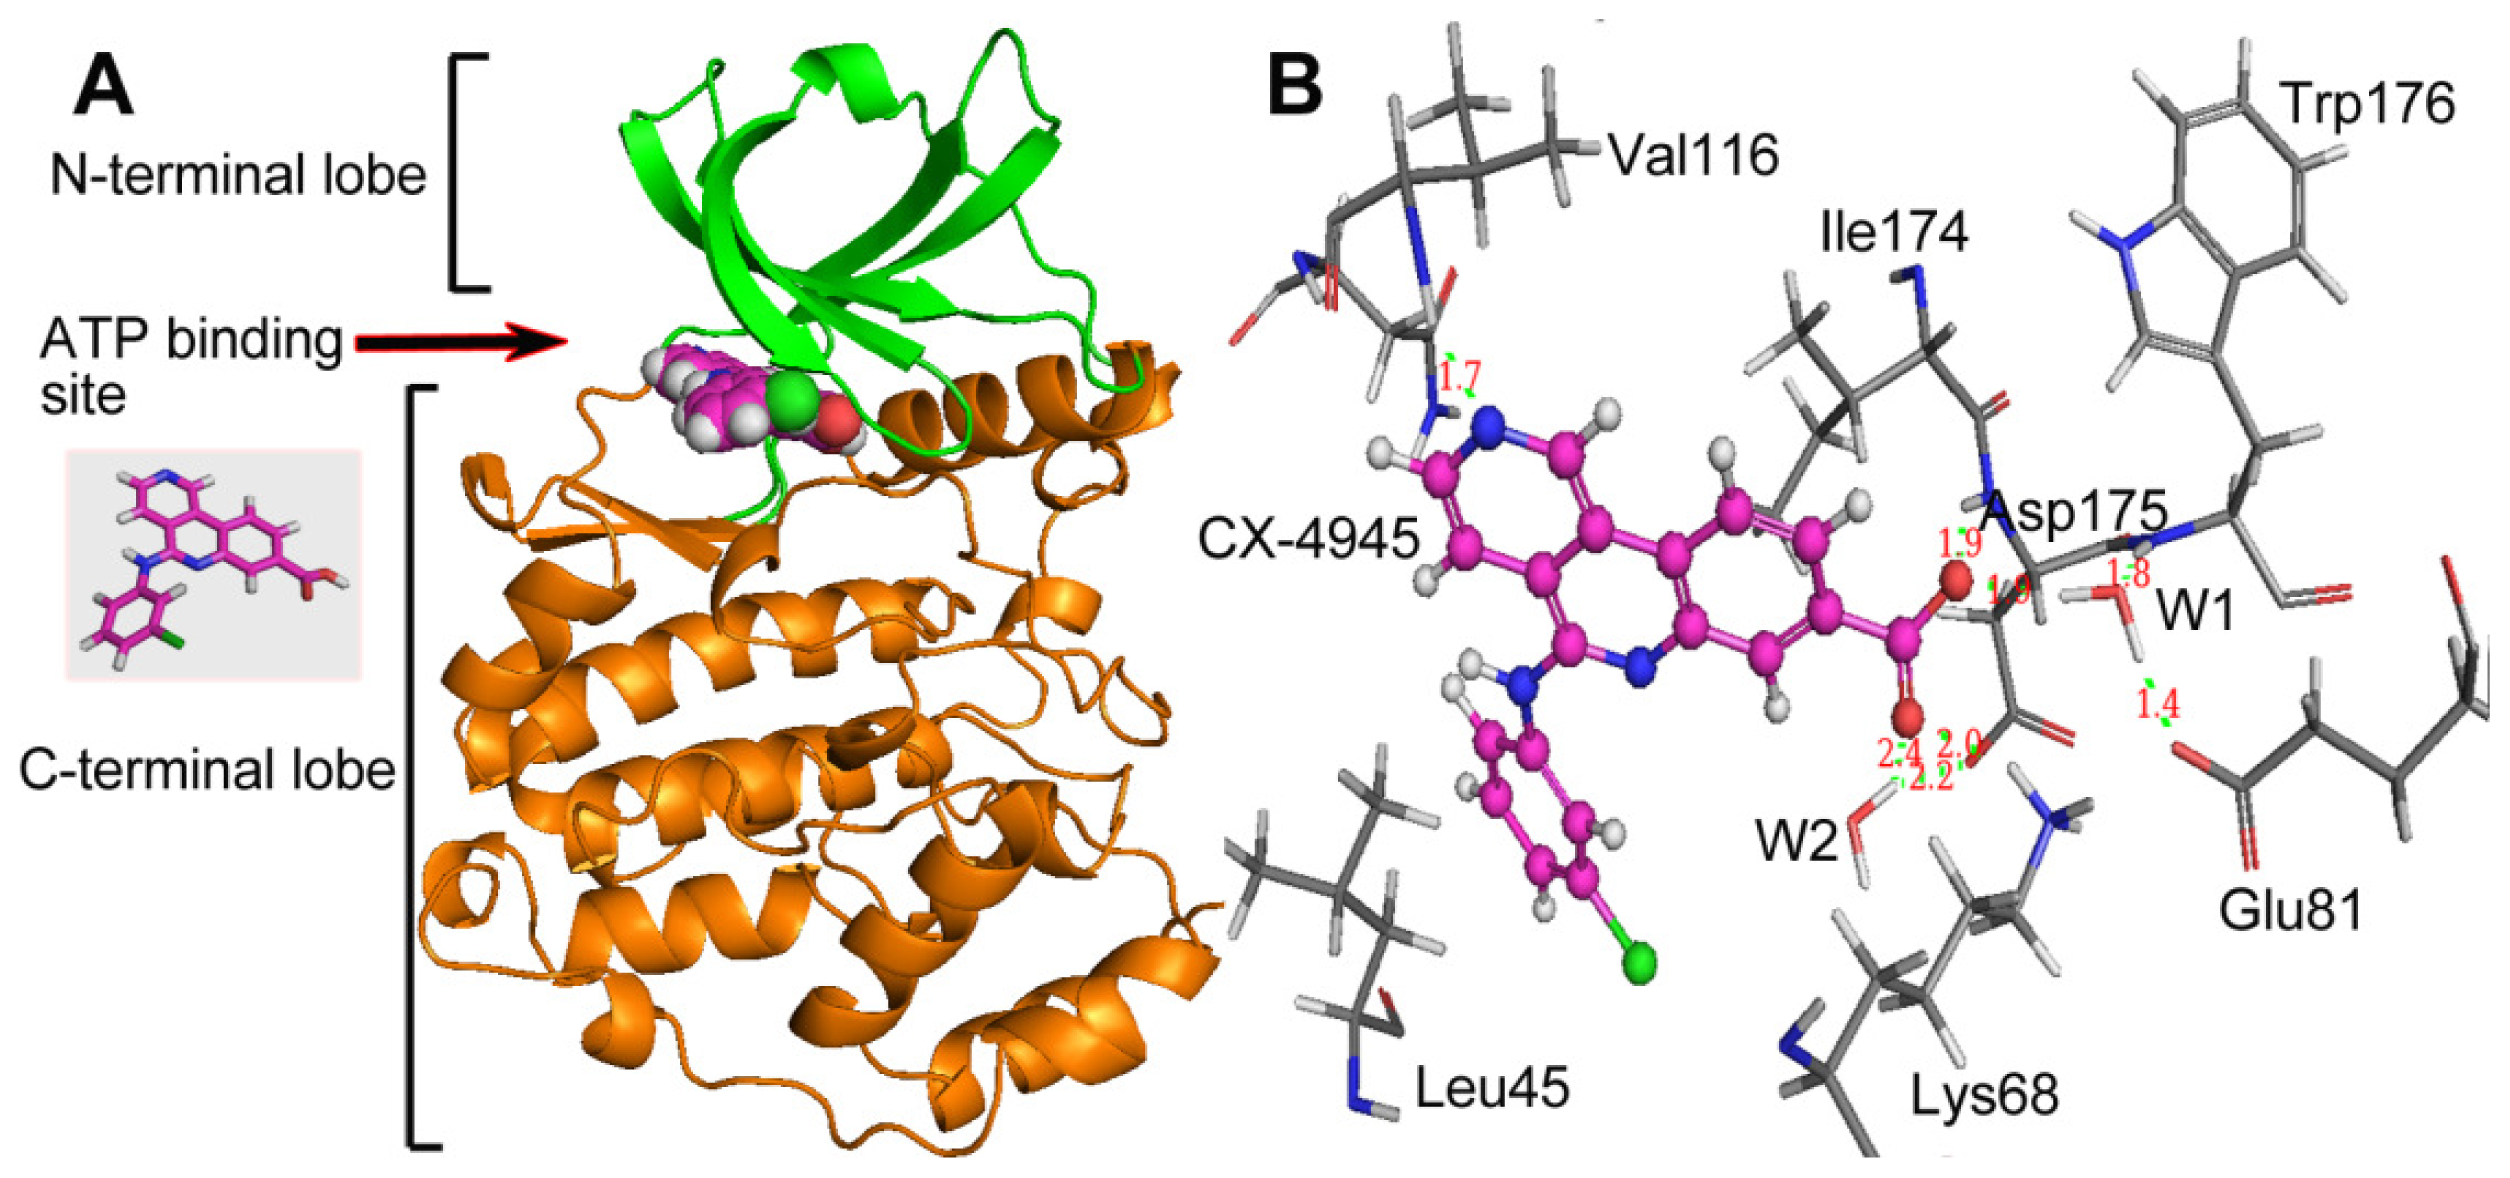
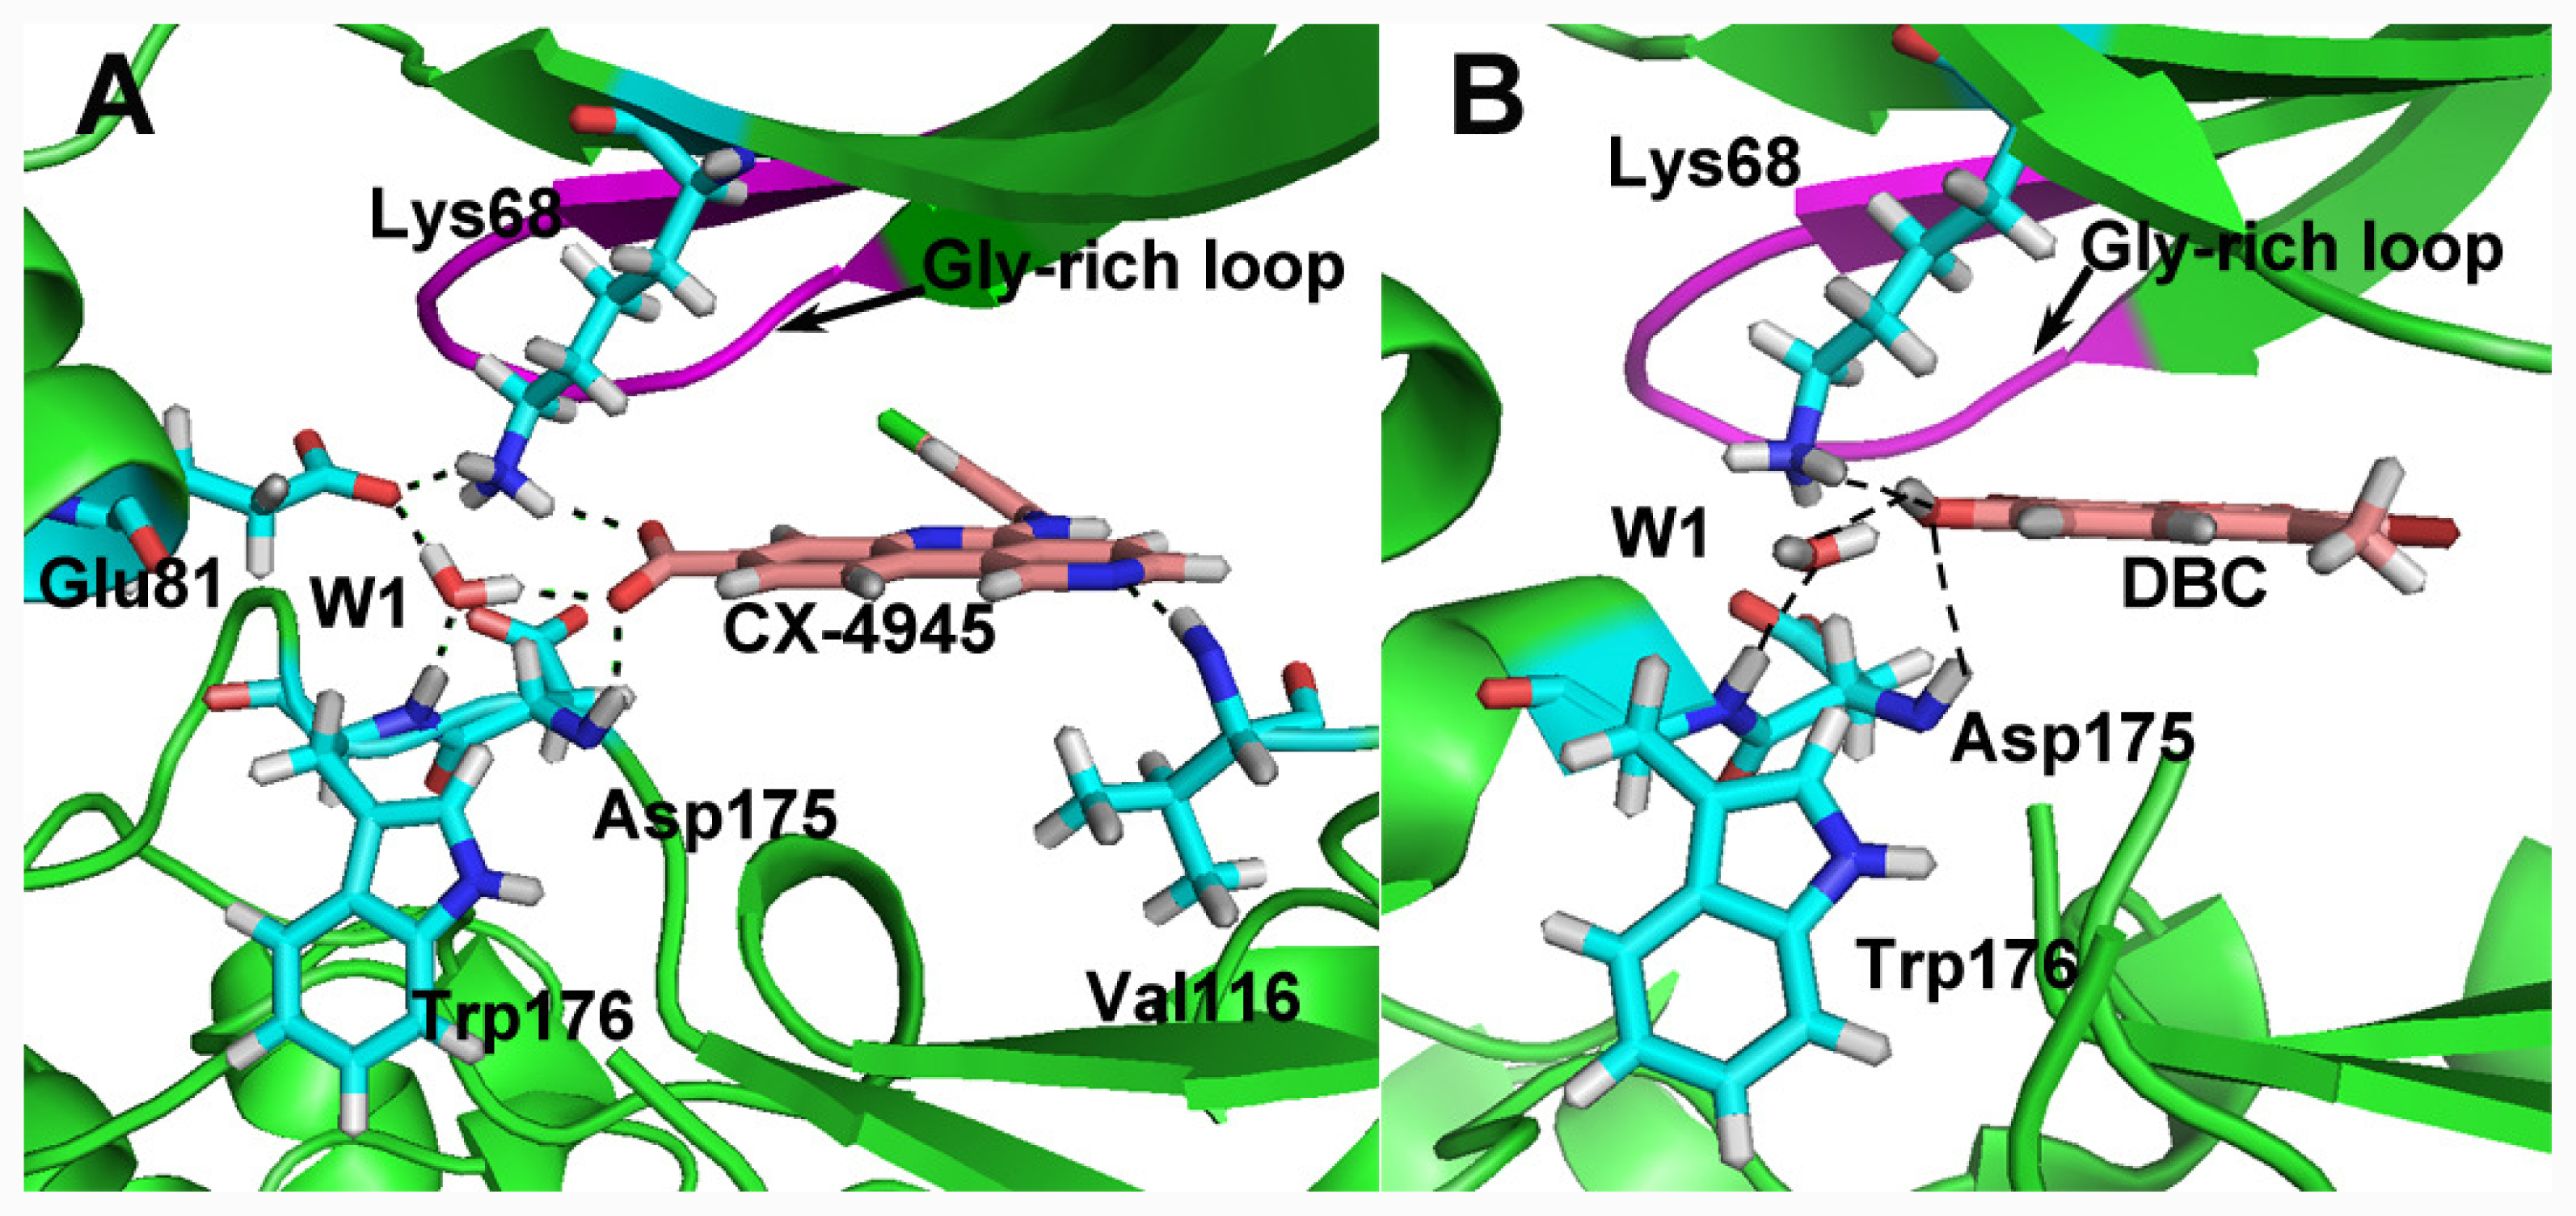
3.3. Docking Analysis and Comparison with 3D Contour Maps
3.4. Comparison with Binding Modes of 3,8-Dibromo-7-hydroxy-4-methylchromen-2-one (DBC)
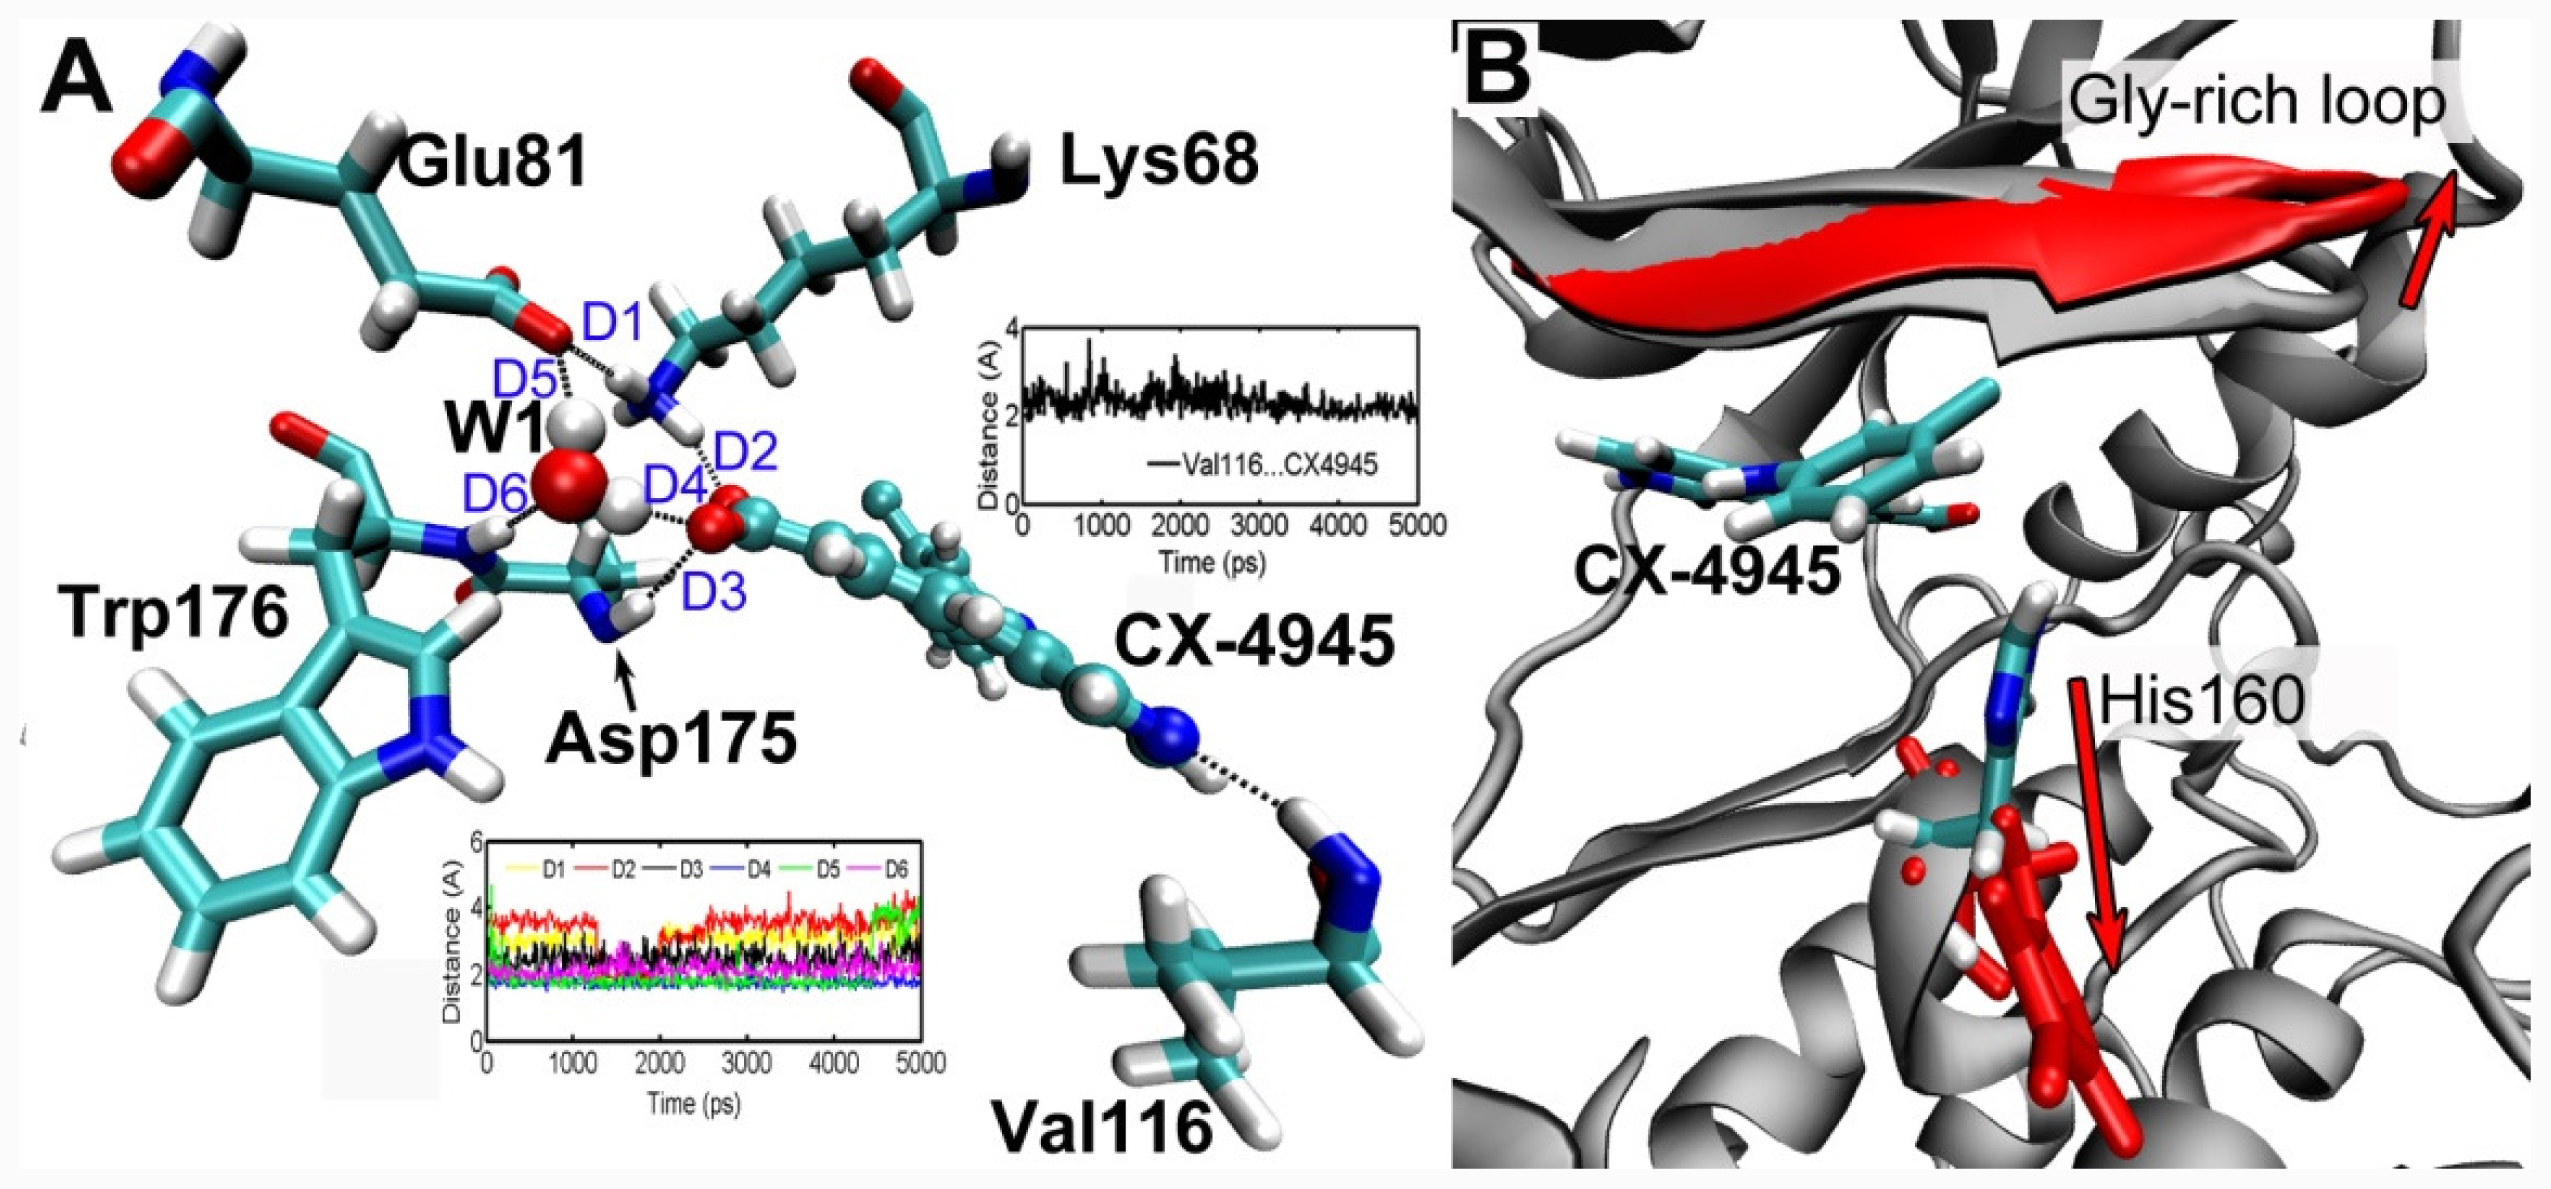
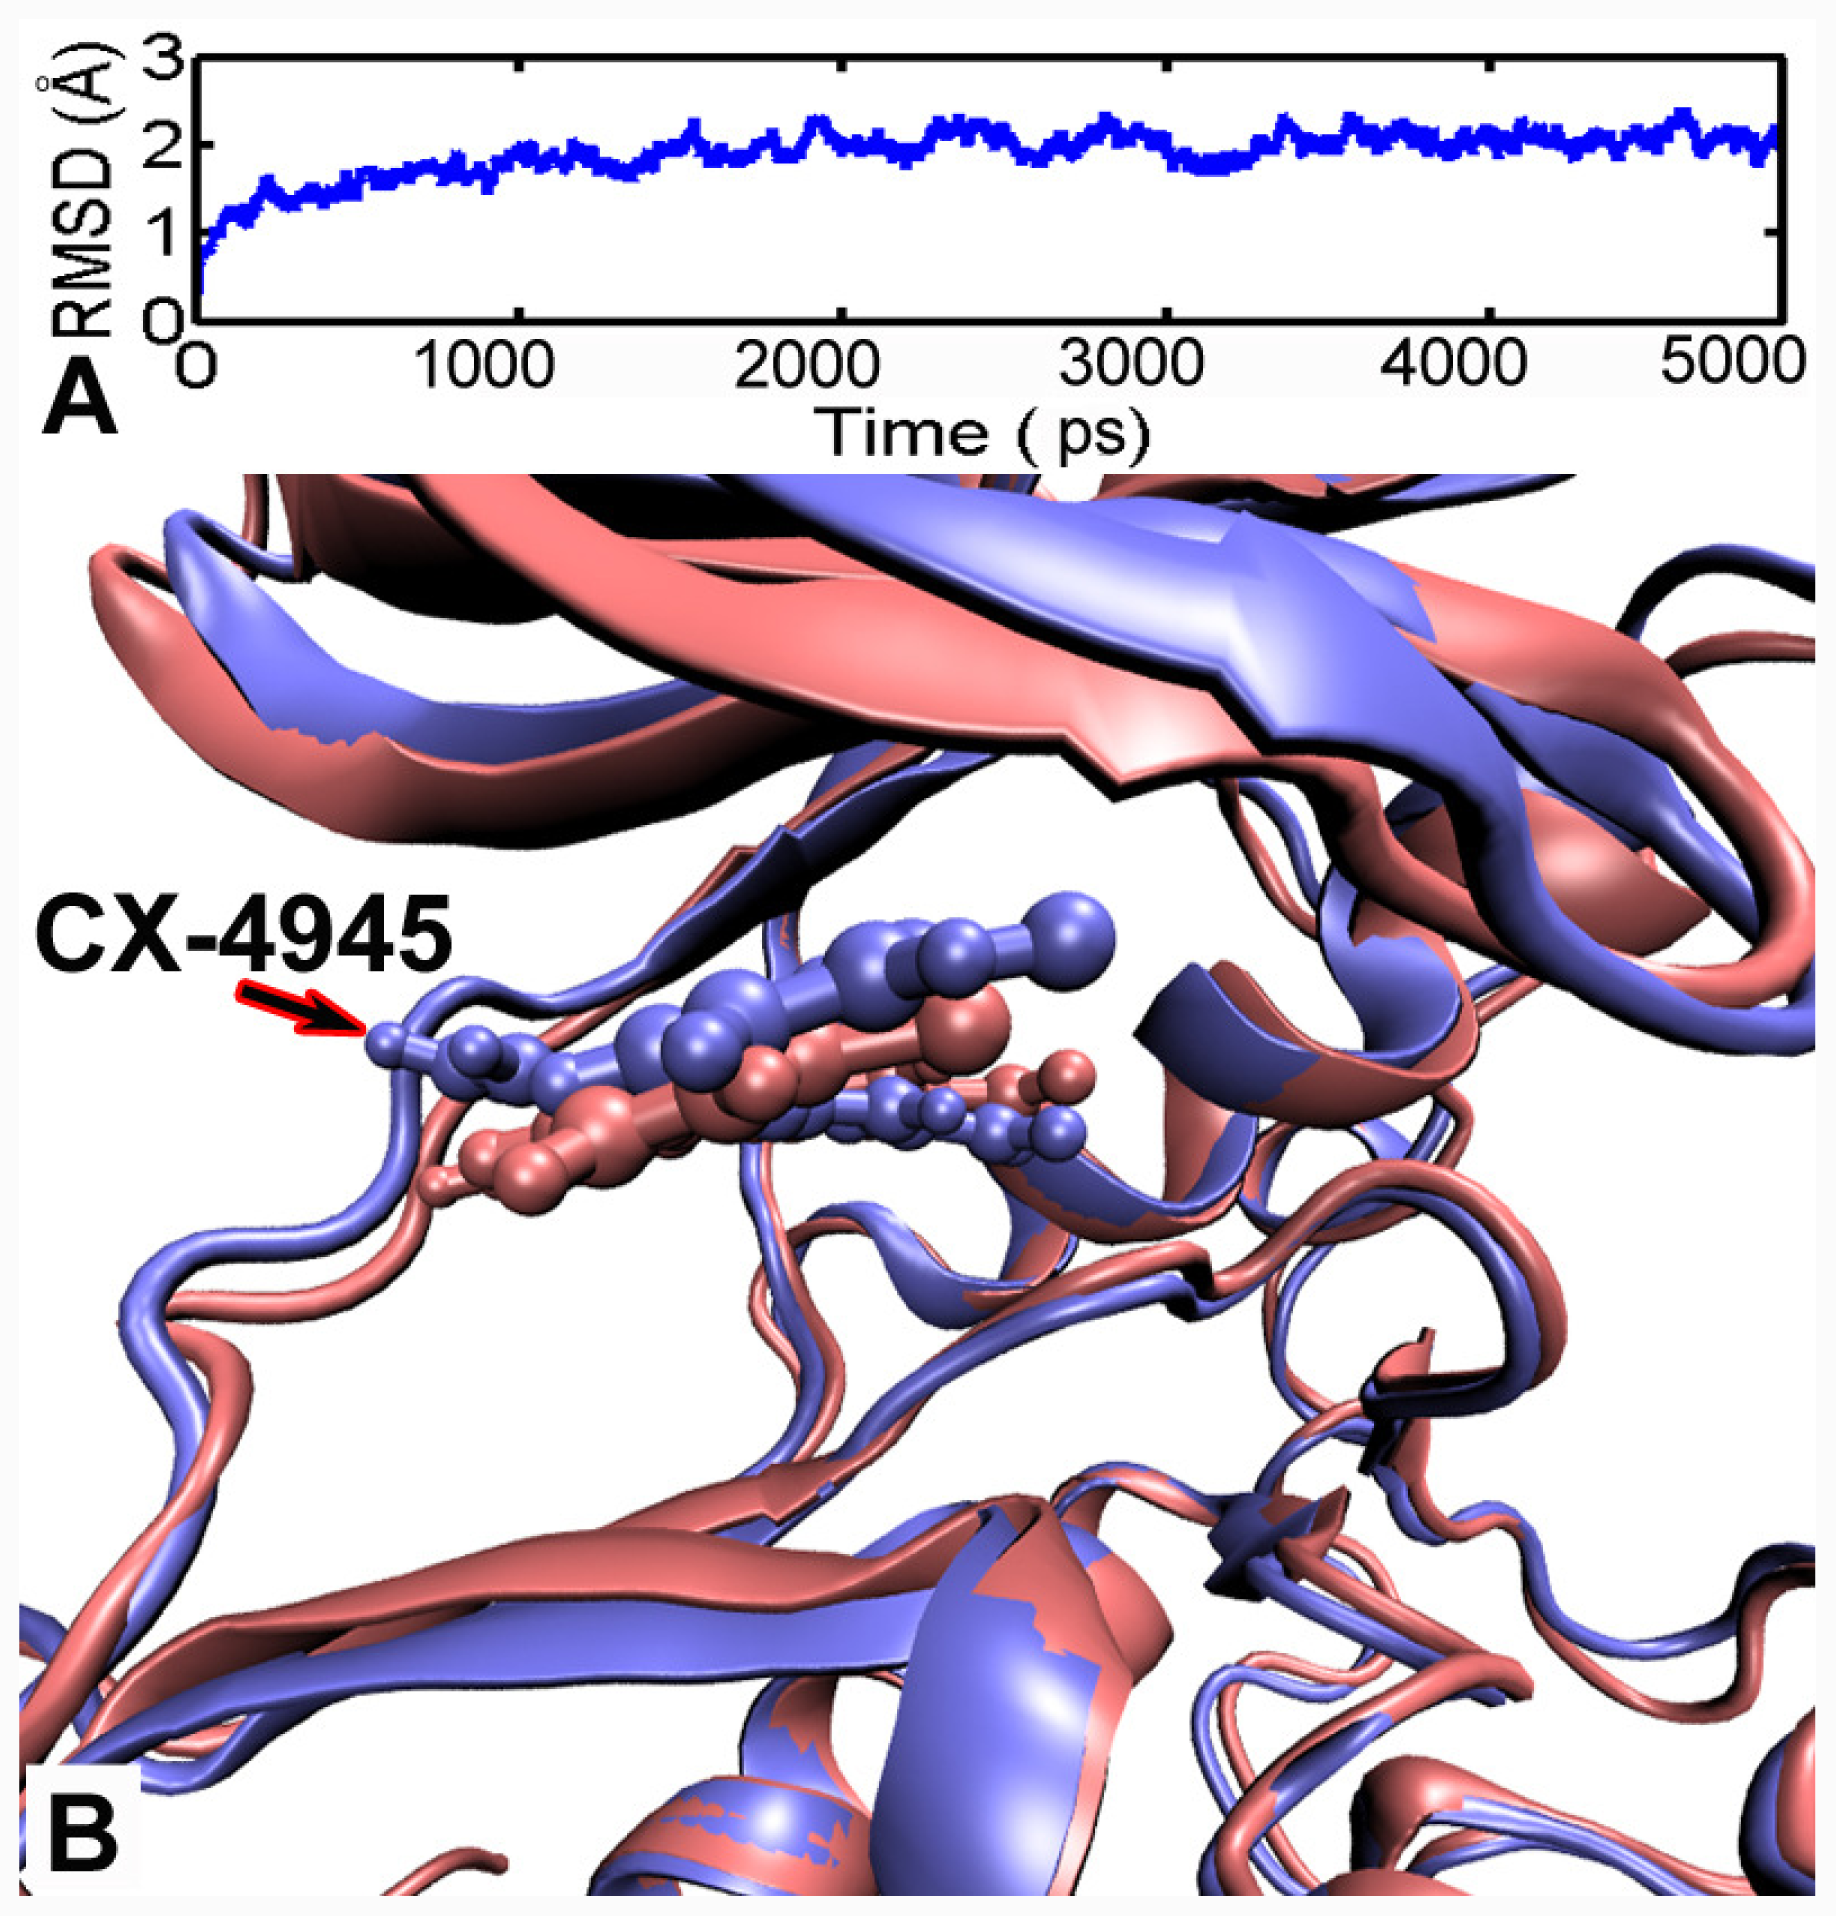
3.5. MD Simulations Analysis
4. Conclusion
Acknowledgments
References
- Duncan, JS; Litchfield, DW. Too much of a good thing: the role of protein kinase CK2 in tumorigenesis and prospects for therapeutic inhibition of CK2. Biochim. Biophys. Acta 2007, 1784, 33–47. [Google Scholar]
- Meggio, F; Pinna, LA. One-thousand-and-one substrates of protein kinase CK2? FASEB J 2003, 17, 349–368. [Google Scholar]
- Pagano, MA; Cesaro, L; Meggio, F; Pinna, LA. Protein kinase CK2: a newcomer in the “druggable kinome”. Biochem. Soc. Trans 2006, 34, 1303–1306. [Google Scholar]
- Guerra, B; Issinger, OG. Protein kinase CK2 in human diseases. Curr. Med. Chem 2008, 15, 1870–1886. [Google Scholar]
- Unger, GM; Davis, AT; Slaton, JW; Ahmed, K. Protein kinase CK2 as regulator of cell survival: implications for cancer therapy. Curr. Cancer Drug Targets 2004, 4, 77–84. [Google Scholar]
- Sarno, S; Salvi, M; Battistutta, R; Zanotti, G; Pinna, LA. Features and potentials of ATP-site directed CK2 inhibitors. Biochim. Biophys. Acta 2005, 1754, 263–270. [Google Scholar]
- Sarno, S; Pinna, LA. Protein kinase CK2 as a druggable target. Mol. Biosyst 2008, 4, 889–894. [Google Scholar]
- Pagano, MA; Bain, J; Kazimierczuk, Z; Sarno, S; Ruzzene, M; Di Maira, G; Elliott, M; Orzeszko, A; Cozza, G; Meggio, F; Pinna, LA. The selectivity of inhibitors of protein kinase CK2: an update. Biochem. J 2008, 415, 353–365. [Google Scholar]
- Sarno, S; deMoliner, E; Ruzzene, M; Pagano, MA; Battistutta, R; Bain, J; Fabbro, D; Schoepfer, J; Elliott, M; Furet, P; et al. Biochemical and three-dimensional-structural study of the specific inhibition of protein kinase CK2 by [5-oxo-5,6-dihydroindolo-(1,2-a)quinazolin-7-yl]-acetic acid (IQA). Biochem. J 2003, 374, 639–646. [Google Scholar]
- Meggio, F; Pagano, MA; Moro, S; Zagotto, G; Ruzzene, M; Sarno, S; Cozza, G; Bain, J; Elliott, M; Deana, AD; et al. Inhibition of protein kinase CK2 by condensed polyphenolic derivatives. An in vitro and in vivo study. Biochemistry 2004, 43, 12931–12936. [Google Scholar]
- Prudent, R; Cochet, C. New protein kinase CK2 inhibitors: jumping out of the catalytic box. Chem. Biol 2009, 16, 112–120. [Google Scholar]
- Morshed, MN; Muddassar, M; Pasha, FA; Cho, SJ. Pharmacophore identification and validation study of CK2 inhibitors using CoMFA/CoMSIA. Chem. Biol. Drug Des 2009, 74, 148–158. [Google Scholar]
- Wang, X; Yang, W; Xu, X; Zhang, H; Li, Y; Wang, Y. Studies of benzothiadiazine derivatives as hepatitis C virus NS5B polymerase inhibitors using 3D-QSAR, molecular docking and molecular dynamics. Curr. Med. Chem 2010, 17, 2788–2803. [Google Scholar]
- Cramer, RD; Patterson, DE; Bunce, JD. Comparative molecular field analysis (CoMFA). 1: effect of shape on binding of steroids to carrier proteins. J. Acoust. Soc. Am 1988, 110, 5959–5967. [Google Scholar]
- Klebe, G; Abraham, U; Mietzner, T. Molecular similarity indices in a comparative analysis (CoMSIA) of drug molecules to correlate and predict their biological activity. J. Med. Chem 1994, 37, 4130–4146. [Google Scholar]
- Siddiqui-Jain, A; Drygin, D; Streiner, N; Chua, P; Pierre, F; O’Brien, S; Bliesath, J; Omori, M; Huser, N; Ho, C; et al. CX-4945, an orally bioavailable selective inhibitor of protein kinase CK2, inhibits prosurvival and angiogenic signaling and exhibits anti-tumor efficacy. Cancer Res 2010, 70, 10288–10298. [Google Scholar]
- Pierre, F; Chua, PC; O’Brien, SE; Siddiqui-Jain, A; Bourbon, P; Haddach, M; Michaux, J; Nagasawa, J; Schwaebe, MK; Stefan, E; et al. Discovery and SAR of 5-(3-Chlorophenylamino)benzo[c][2,6]naphthyridine-8-carboxylic acid (CX-4945), the first clinical stage inhibitor of protein kinase CK2 for the treatment of cancer. J. Med. Chem 2011, 54, 635–654. [Google Scholar]
- Cramer, RD, III; Patterson, DE; Bunce, JD. Recent advances in comparative molecular field analysis (CoMFA). Prog. Clin. Biol. Res 1989, 291, 161–165. [Google Scholar]
- Vriend, G. WHAT IF: a molecular modeling and drug design program. J. Mol. Graph 1990, 8, 52–56. [Google Scholar]
- Hilal, SH; Karickhoff, SW; Carreira, LA. A rigorous test for SPARC’s chemical reactivity models: estimation of more than 4300 ionization pKas. Quant Struct Act Relatsh 1995, 14, 348–355. [Google Scholar]
- Case, DA; Darden, T; Cheatham, TE, III; Simmerling, C; Wang, J; Duke, RE; Luo, R; Crowley, M; Walker, RC; Zhang, W; et al. AMBER 10; University of California: San Francisco, CA, USA, 2008. [Google Scholar]
- Wang, J; Wolf, RM; Caldwell, JW; Kollman, PA; Case, DA. Development and testing of a general amber force field. J. Comput. Chem 2004, 25, 1157–1174. [Google Scholar]
- Jakalian, A; Jack, DB; Bayly, CI. Fast, efficient generation of high-quality atomic charges. AM1-BCC model: II. Parameterization and validation. J. Comput. Chem 2002, 23, 1623–1641. [Google Scholar]
- Duan, Y; Wu, C; Chowdhury, S; Lee, MC; Xiong, G; Zhang, W; Yang, R; Cieplak, P; Luo, R; Lee, T; et al. A point-charge force field for molecular mechanics simulations of proteins based on condensed-phase quantum mechanical calculations. J. Comput. Chem 2003, 24, 1999–2012. [Google Scholar]
- Jorgensen, WL; Chandrasekhar, J; Madura, JD; Klein, ML. Comparison of simple potential functions for simulating liquid water. J. Chem. Phys 1983, 79, 926–935. [Google Scholar]
- Essmann, U; Perera, L; Berkowitz, ML; Darden, T. A smooth particle mesh ewald method. J. Chem. Phys 1995, 103, 8577–9593. [Google Scholar]
- Buolamwini, JK; Assefa, H. CoMFA and CoMSIA 3D QSAR and docking studies on conformationally-restrained cinnamoyl HIV-1 integrase inhibitors: Exploration of a binding mode at the active site. J. Med. Chem 2002, 45, 841–852. [Google Scholar]
- Boeckler, F; Ohnmacht, U; Lehmann, T; Utz, W; Hubner, H; Gmeiner, P. CoMFA and CoMSIA investigations revealing novel insights into the binding modes of dopamine D3 receptor agonists. J. Med. Chem 2005, 48, 2493–2508. [Google Scholar]
- Gohlke, H; Schwarz, S; Gundisch, D; Tilotta, MC; Weber, A; Wegge, T; Seitz, G. 3D QSAR analyses-guided rational design of novel ligands for the (α4)2(β2)3 nicotinic acetylcholine receptor. J. Med. Chem 2003, 46, 2031–2048. [Google Scholar]
- Borges, F; Roleira, F; Milhazes, N; Santana, L; Uriarte, E. Simple coumarins and analogues in medicinal chemistry: occurrence, synthesis and biological activity. Curr. Med. Chem 2005, 12, 887–916. [Google Scholar]
- Lacy, A; O’Kennedy, R. Studies on coumarins and coumarin-related compounds to determine their therapeutic role in the treatment of cancer. Curr. Pharm. Des 2004, 10, 3797–3811. [Google Scholar]


| No. | Structure | IC50 (μM) | pIC50 | |||||
|---|---|---|---|---|---|---|---|---|
| 1 |  | 0.08 | 7.097 | |||||
 | ||||||||
| No. |  | R2 | IC50 (μM) | pIC50 | ||||
| 2 | –CO–NH– | –COOH | 2.1 | 5.678 | ||||
| 3 † | –CO–N((CH2)3OH)– | –COOH | 1.5 | 5.824 | ||||
| 4 | –(C–O(CH2)3OH)=N– | –COOH | 0.99 | 6.004 | ||||
| 5 | –(C–NH(CH2)3OH)=N– | –COOH | 0.75 | 6.125 | ||||
 | ||||||||
| No. | –NR3R4 | R2 | IC50 (μM) | pIC50 | ||||
| 6 | –NH–(CH2)2OH | –COOH | 1.26 | 5.900 | ||||
| 7 † | –NH–(CH2)2NMe2 | –COOH | 0.102 | 6.991 | ||||
| 8 | –Pyrrolidino | –COOH | 1.780 | 5.750 | ||||
| 9 | –NH–phenyl | –COOH | 0.092 | 7.036 | ||||
| 10 | –NMe–phenyl | –COOH | 1.070 | 5.971 | ||||
| 11 † | –NH–(2–Me–phenyl) | –COOH | 0.970 | 6.013 | ||||
| 12 | –NH–phenyl | –C-(1H-tetrazol-5-yl) | 0.096 | 7.018 | ||||
| 13 | –NH–(CH2)2Ph | –COOH | 0.516 | 6.287 | ||||
| 14 | –NH–(4–F–phenyl) | –COOH | 0.219 | 6.660 | ||||
| 15 | –NH–(3–F–phenyl) | –COOH | 0.068 | 7.168 | ||||
| 16 † | –NH–(4–Cl–phenyl) | –COOH | 0.178 | 6.750 | ||||
| 17 | –NH–(3–Cl–phenyl) | –COOH | 0.032 | 7.495 | ||||
| 18 | –NH–(3–MeO–phenyl) | –COOH | 0.077 | 7.114 | ||||
| 19 | –NH–(3–acetylenyl–phenyl) | –COOH | 0.028 | 7.553 | ||||
| 20 | –NH–(3–(PhO)–phenyl) | –COOH | 0.395 | 6.403 | ||||
| 21 † | –NH–(3–(CONHMe)–phenyl) | –COOH | 0.129 | 6.889 | ||||
| 22 | –NH–(3–Cl–phenyl) | –C-(1H-tetrazol-5-yl) | 0.129 | 6.889 | ||||
| 23 | –NH–(3–F–phenyl) | –C-(1H-tetrazol-5-yl) | 0.075 | 7.125 | ||||
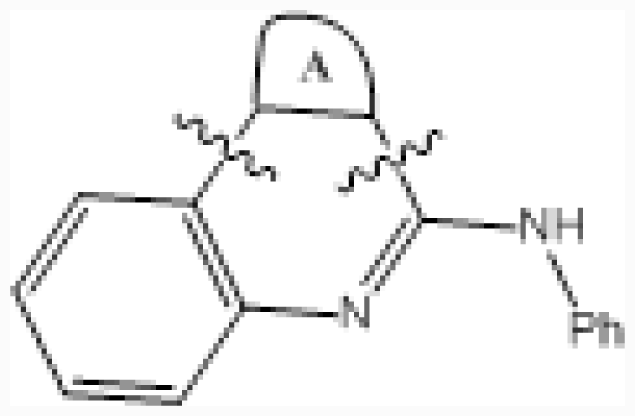 | ||||||||
| No. | A ring | IC50 (μM) | pIC50 | |||||
| 24 |  | 0.092 | 7.036 | |||||
| 25 | 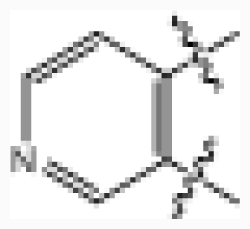 | 0.006 | 8.222 | |||||
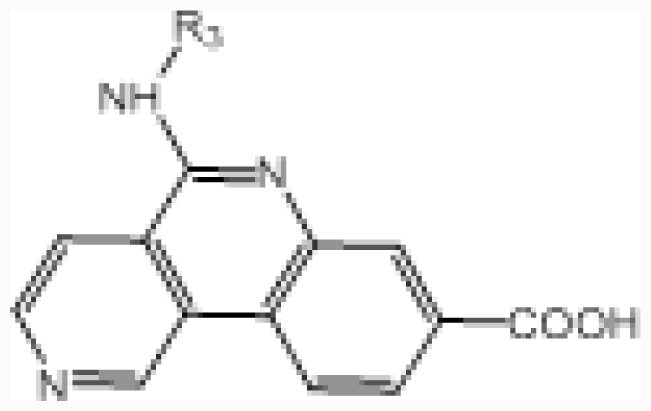 | ||||||||
| No. | R3 | IC50 (μM) | pIC50 | |||||
| 26 | –(CH2)2NMe | 0.025 | 7.602 | |||||
| 27 † | –cyclopentyl | 0.027 | 7.569 | |||||
| 28 | –OMe | 0.008 | 8.097 | |||||
| 29 | –cyclopropyl | 0.016 | 7.796 | |||||
| 30 | –(CH2)2O-i-Pr | 0.011 | 7.959 | |||||
| 31 | –(CH2)phenyl | 0.009 | 8.046 | |||||
| 32 † | –(CH2)2phenyl | 0.003 | 8.523 | |||||
| 33 | –(CH2)3phenyl | 0.016 | 7.796 | |||||
| 34 | –(3-MeO-phenyl) | 0.004 | 8.398 | |||||
| 35 | –(3-Cl,4-F-phenyl) | 0.004 | 8.398 | |||||
| 36 | –(3-F-phenyl) | 0.005 | 8.301 | |||||
| 37 † | –(2-Cl-phenyl) | 0.008 | 8.097 | |||||
| 38 | –(3-Cl-phenyl) | 0.001 | 9.000 | |||||
| 39 | –(4-Cl-phenyl) | 0.007 | 8.155 | |||||
| 40 | –(3-acetylenyl-phenyl) | 0.003 | 8.523 | |||||
| 41 | –(3-CN-phenyl) | 0.004 | 8.398 | |||||
| 42 | –(4-(PhO)-phenyl) | 0.069 | 7.161 | |||||
| 43 † | –(3-(PhO)-phenyl) | 0.019 | 7.721 | |||||
| 44 | –(3-(SO2NH2)-phenyl) | 0.043 | 7.367 | |||||
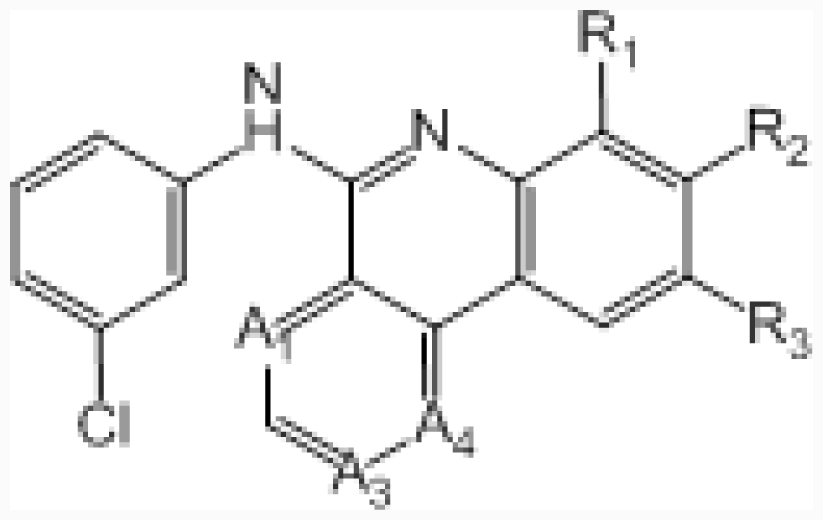 | ||||||||
| No. | A1 | A3 | A4 | R1 | R2 | R3 | IC50 (μM) | pIC50 |
| 45 | –CH= | –N= | –CH= | –H | –C-(1H-tetrazol-3-yl) | –H | 0.045 | 7.347 |
| 46 ‡ | –CH= | –N= | –CH= | –H | –CONH2 | –H | 0.417 | 6.380 |
| 47 | –CH= | –N= | –CH= | –Me | –COOH | –H | 0.006 | 8.222 |
| 48 | –CH= | –N= | –CH= | –H | –H | –COOH | 0.350 | 6.456 |
| 49 | –N= | –CH= | –N= | –H | –COOH | –H | 0.220 | 6.658 |
| 50 † | –N= | –N= | –CH= | –H | –COOH | –H | 0.007 | 8.155 |
| Parameters | Ligand-based alignment | Docking-based alignment | ||
|---|---|---|---|---|
| CoMFA | CoMSIA | CoMFA | CoMSIA | |
| Rcv2 | 0.618 | 0.681 | 0.562 | 0.545 |
| ONC | 3 | 3 | 4 | 5 |
| SEP | 0.567 | 0.518 | 0.616 | 0.637 |
| Rncv2 | 0.860 | 0.828 | 0.877 | 0.791 |
| SEE | 0.343 | 0.380 | 0.326 | 0.187 |
| F value | 71.892 | 56.197 | 62.523 | 173.161 |
| Rpred2 | 0.892 | 0.843 | 0.556 | 0.580 |
| Field contribution | ||||
| Steric | 0.423 | 0.180 | 0.668 | 0.151 |
| Electrostatic | 0.567 | 0.820 | 0.332 | 0.246 |
| Hydrophobic | - | - | - | 0.321 |
| Acceptor | - | - | - | 0.282 |
© 2011 by the authors; licensee MDPI, Basel, Switzerland. This article is an open-access article distributed under the terms and conditions of the Creative Commons Attribution license (http://creativecommons.org/licenses/by/3.0/).
Share and Cite
Liu, H.; Wang, X.; Wang, J.; Wang, J.; Li, Y.; Yang, L.; Li, G. Structural Determinants of CX-4945 Derivatives as Protein Kinase CK2 Inhibitors: A Computational Study. Int. J. Mol. Sci. 2011, 12, 7004-7021. https://doi.org/10.3390/ijms12107004
Liu H, Wang X, Wang J, Wang J, Li Y, Yang L, Li G. Structural Determinants of CX-4945 Derivatives as Protein Kinase CK2 Inhibitors: A Computational Study. International Journal of Molecular Sciences. 2011; 12(10):7004-7021. https://doi.org/10.3390/ijms12107004
Chicago/Turabian StyleLiu, Hongbo, Xia Wang, Jian Wang, Jinghui Wang, Yan Li, Ling Yang, and Guohui Li. 2011. "Structural Determinants of CX-4945 Derivatives as Protein Kinase CK2 Inhibitors: A Computational Study" International Journal of Molecular Sciences 12, no. 10: 7004-7021. https://doi.org/10.3390/ijms12107004