3D-QSAR and Molecular Docking Studies on Fused Pyrazoles as p38α Mitogen-Activated Protein Kinase Inhibitors

Abstract
:1. Introduction
2. Materials and Methods
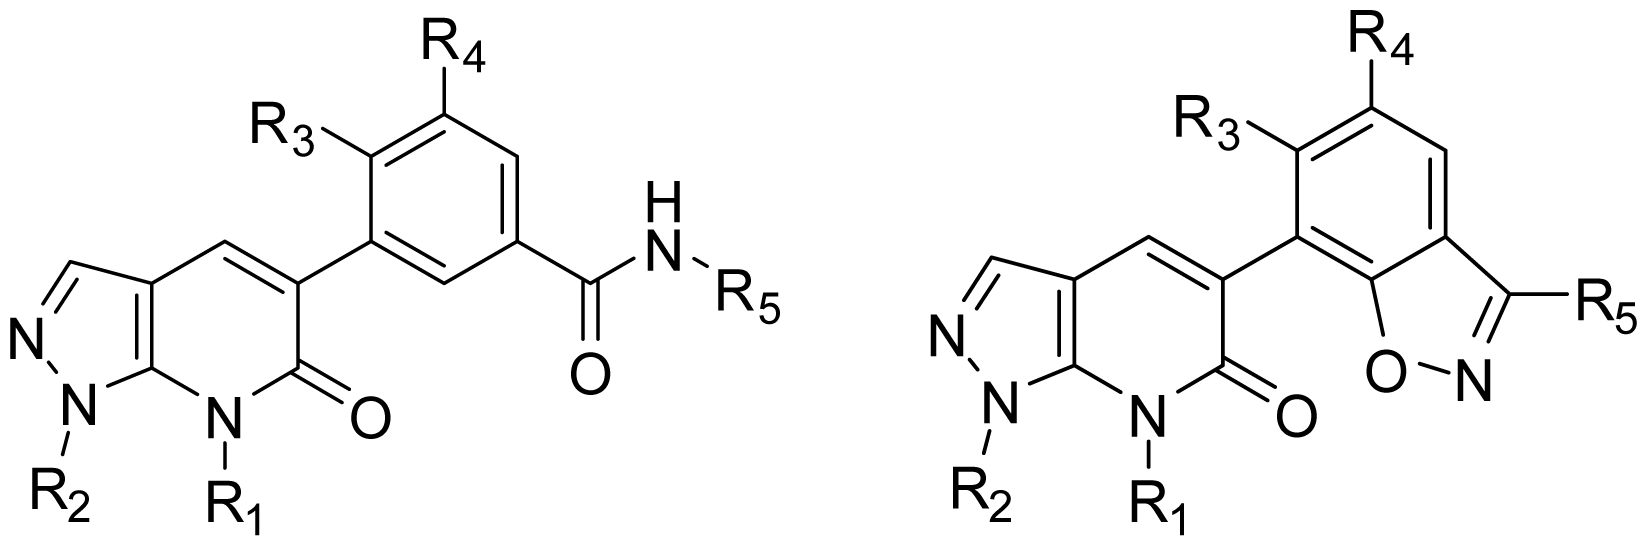
2.1. Dataset for Analysis
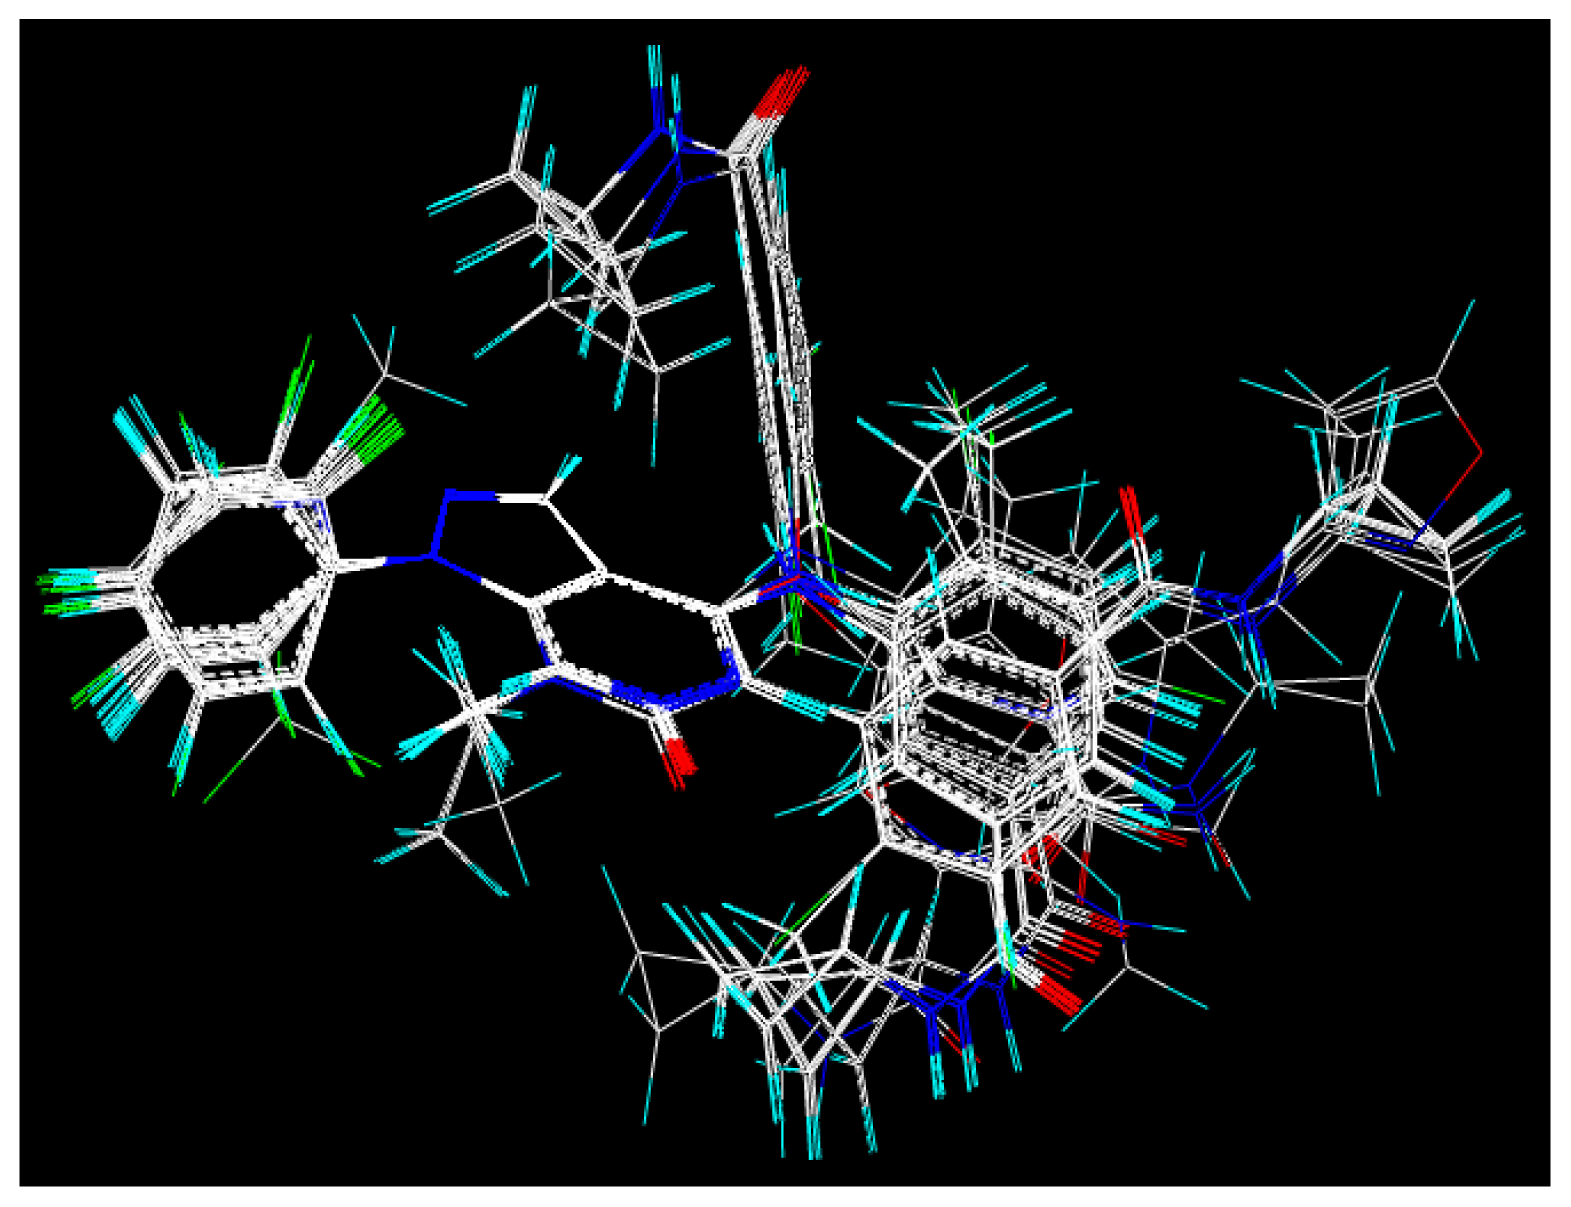
2.2. Molecular Modeling and Alignment
2.3. CoMFA and CoMSIA Setup
2.4. Regression Analysis and Models Validation
2.5. Predictive Correlation Co-Efficient (r2pred)
2.6. Molecular Docking
3. Results and Discussion
3.1. CoMFA and CoMSIA Analysis
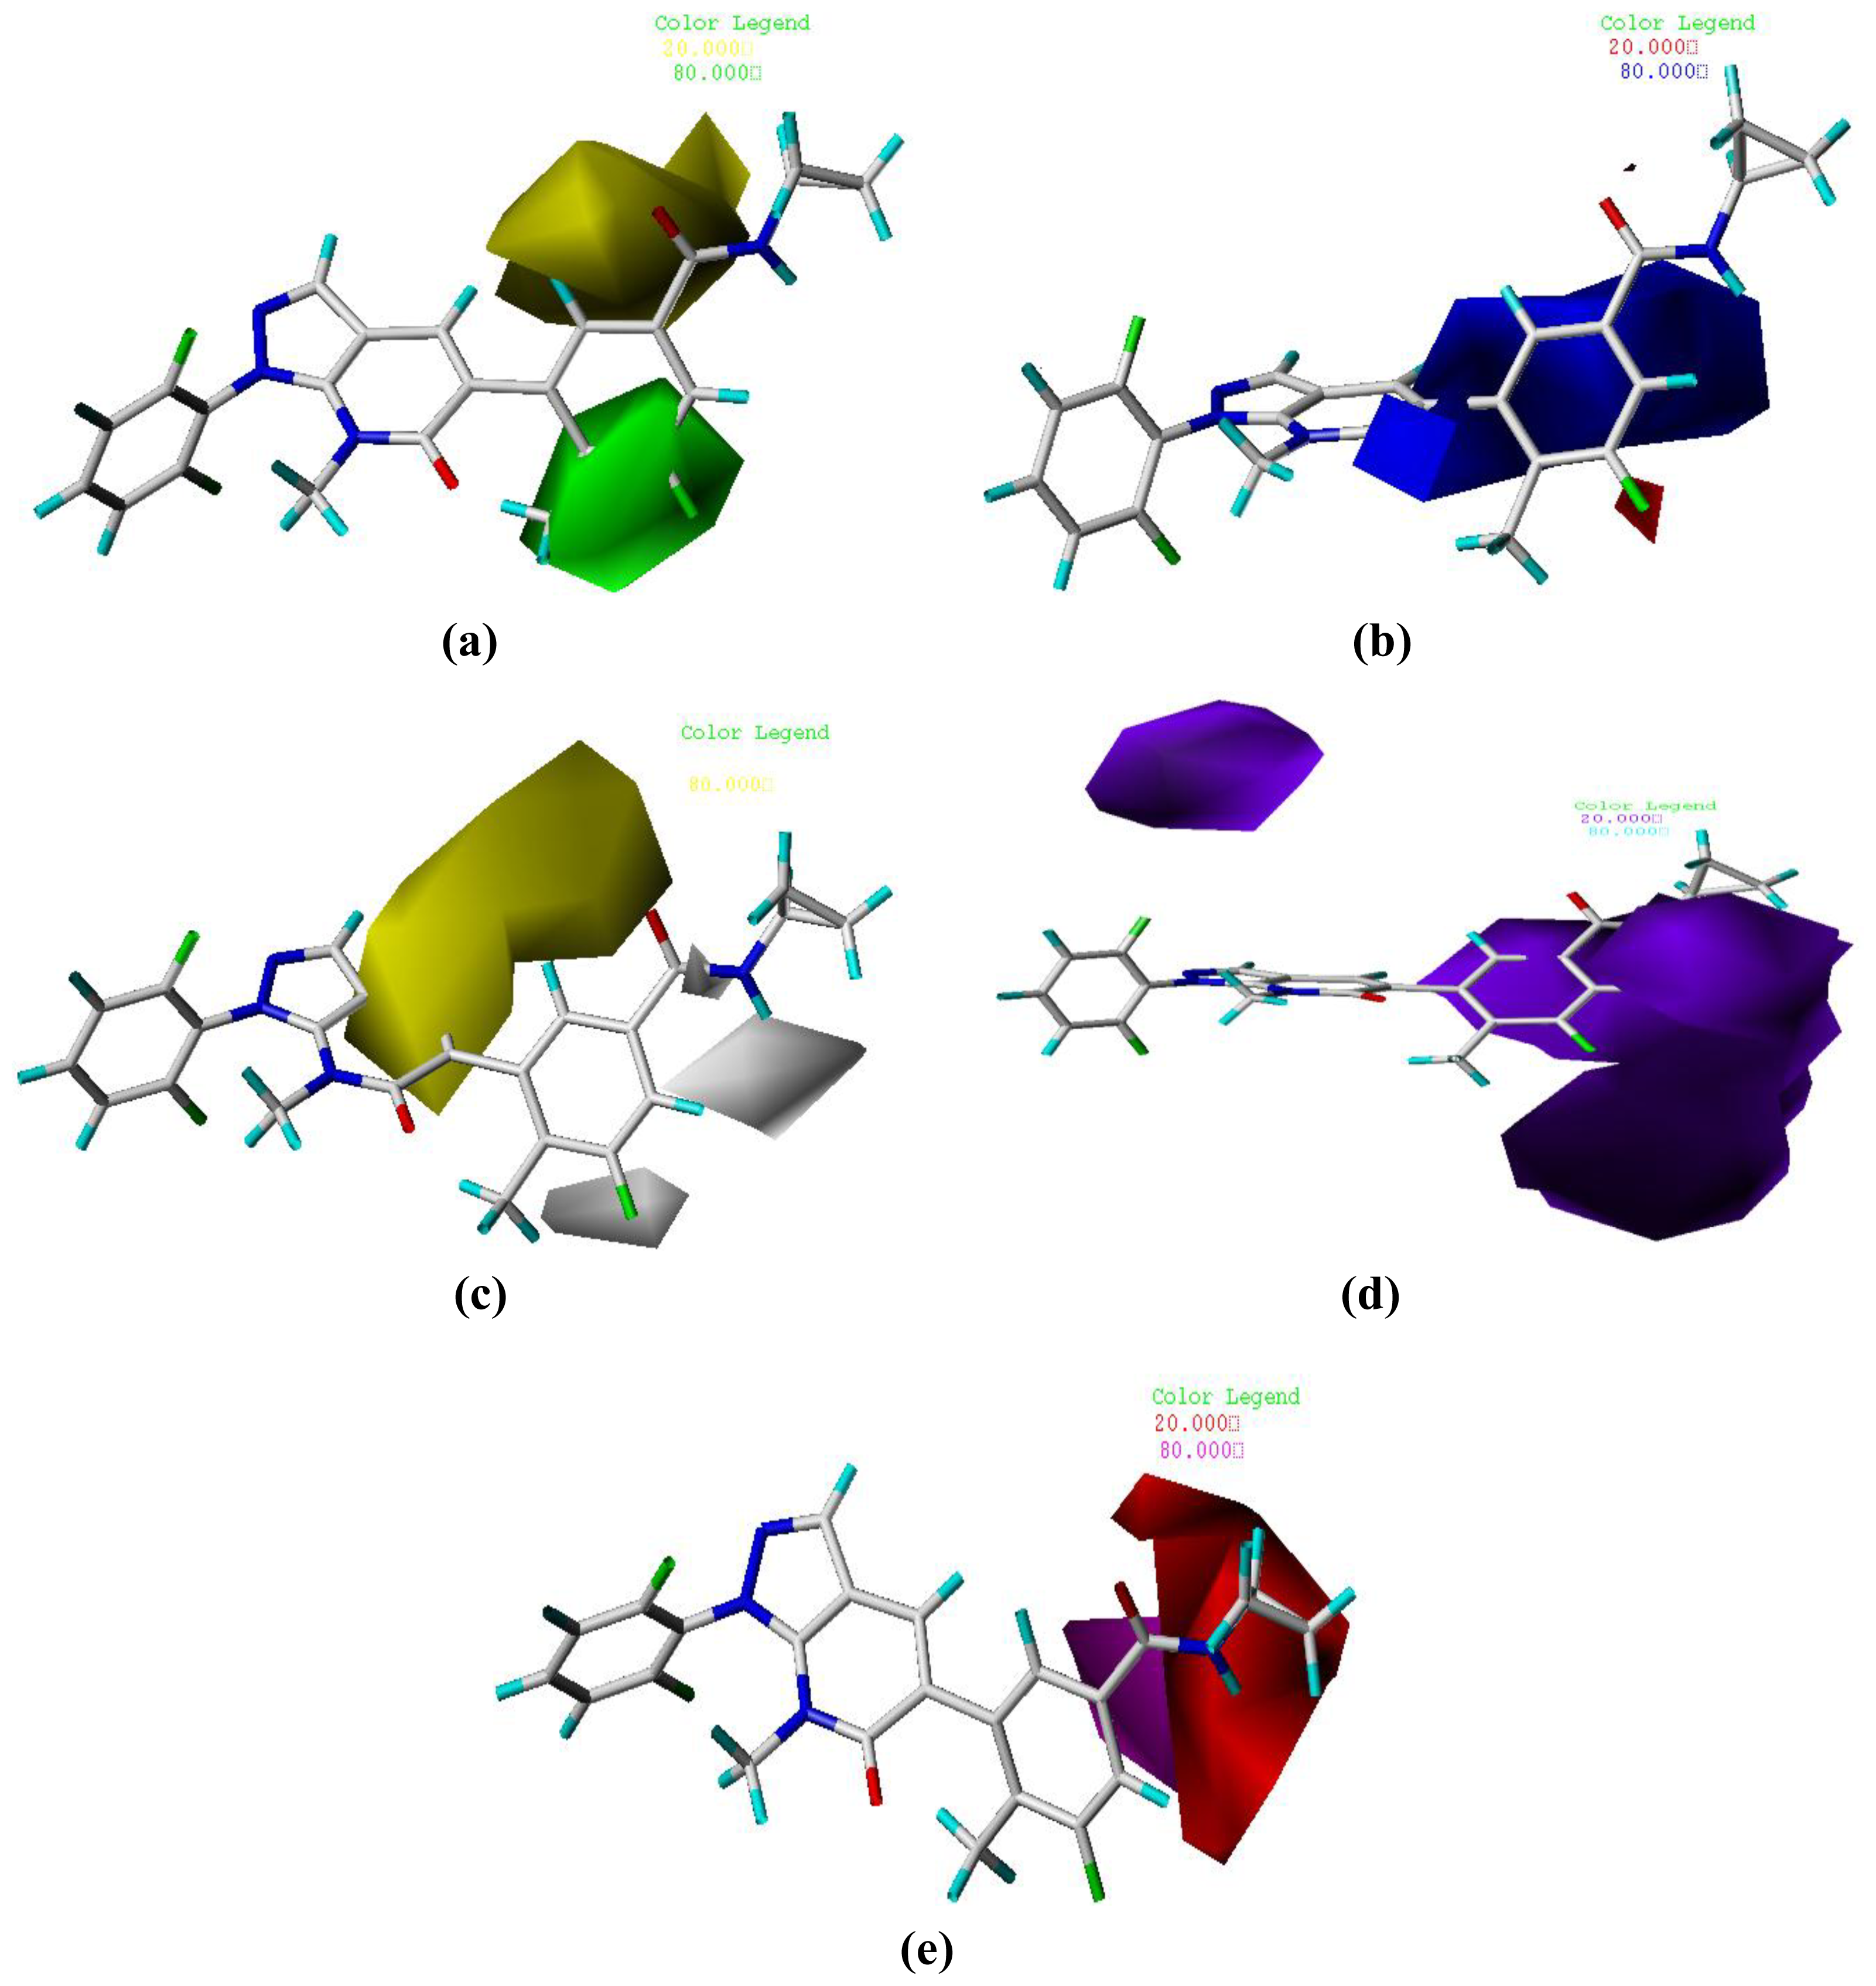
3.2. Graphical Interpretation of CoMFA and CoMSIA
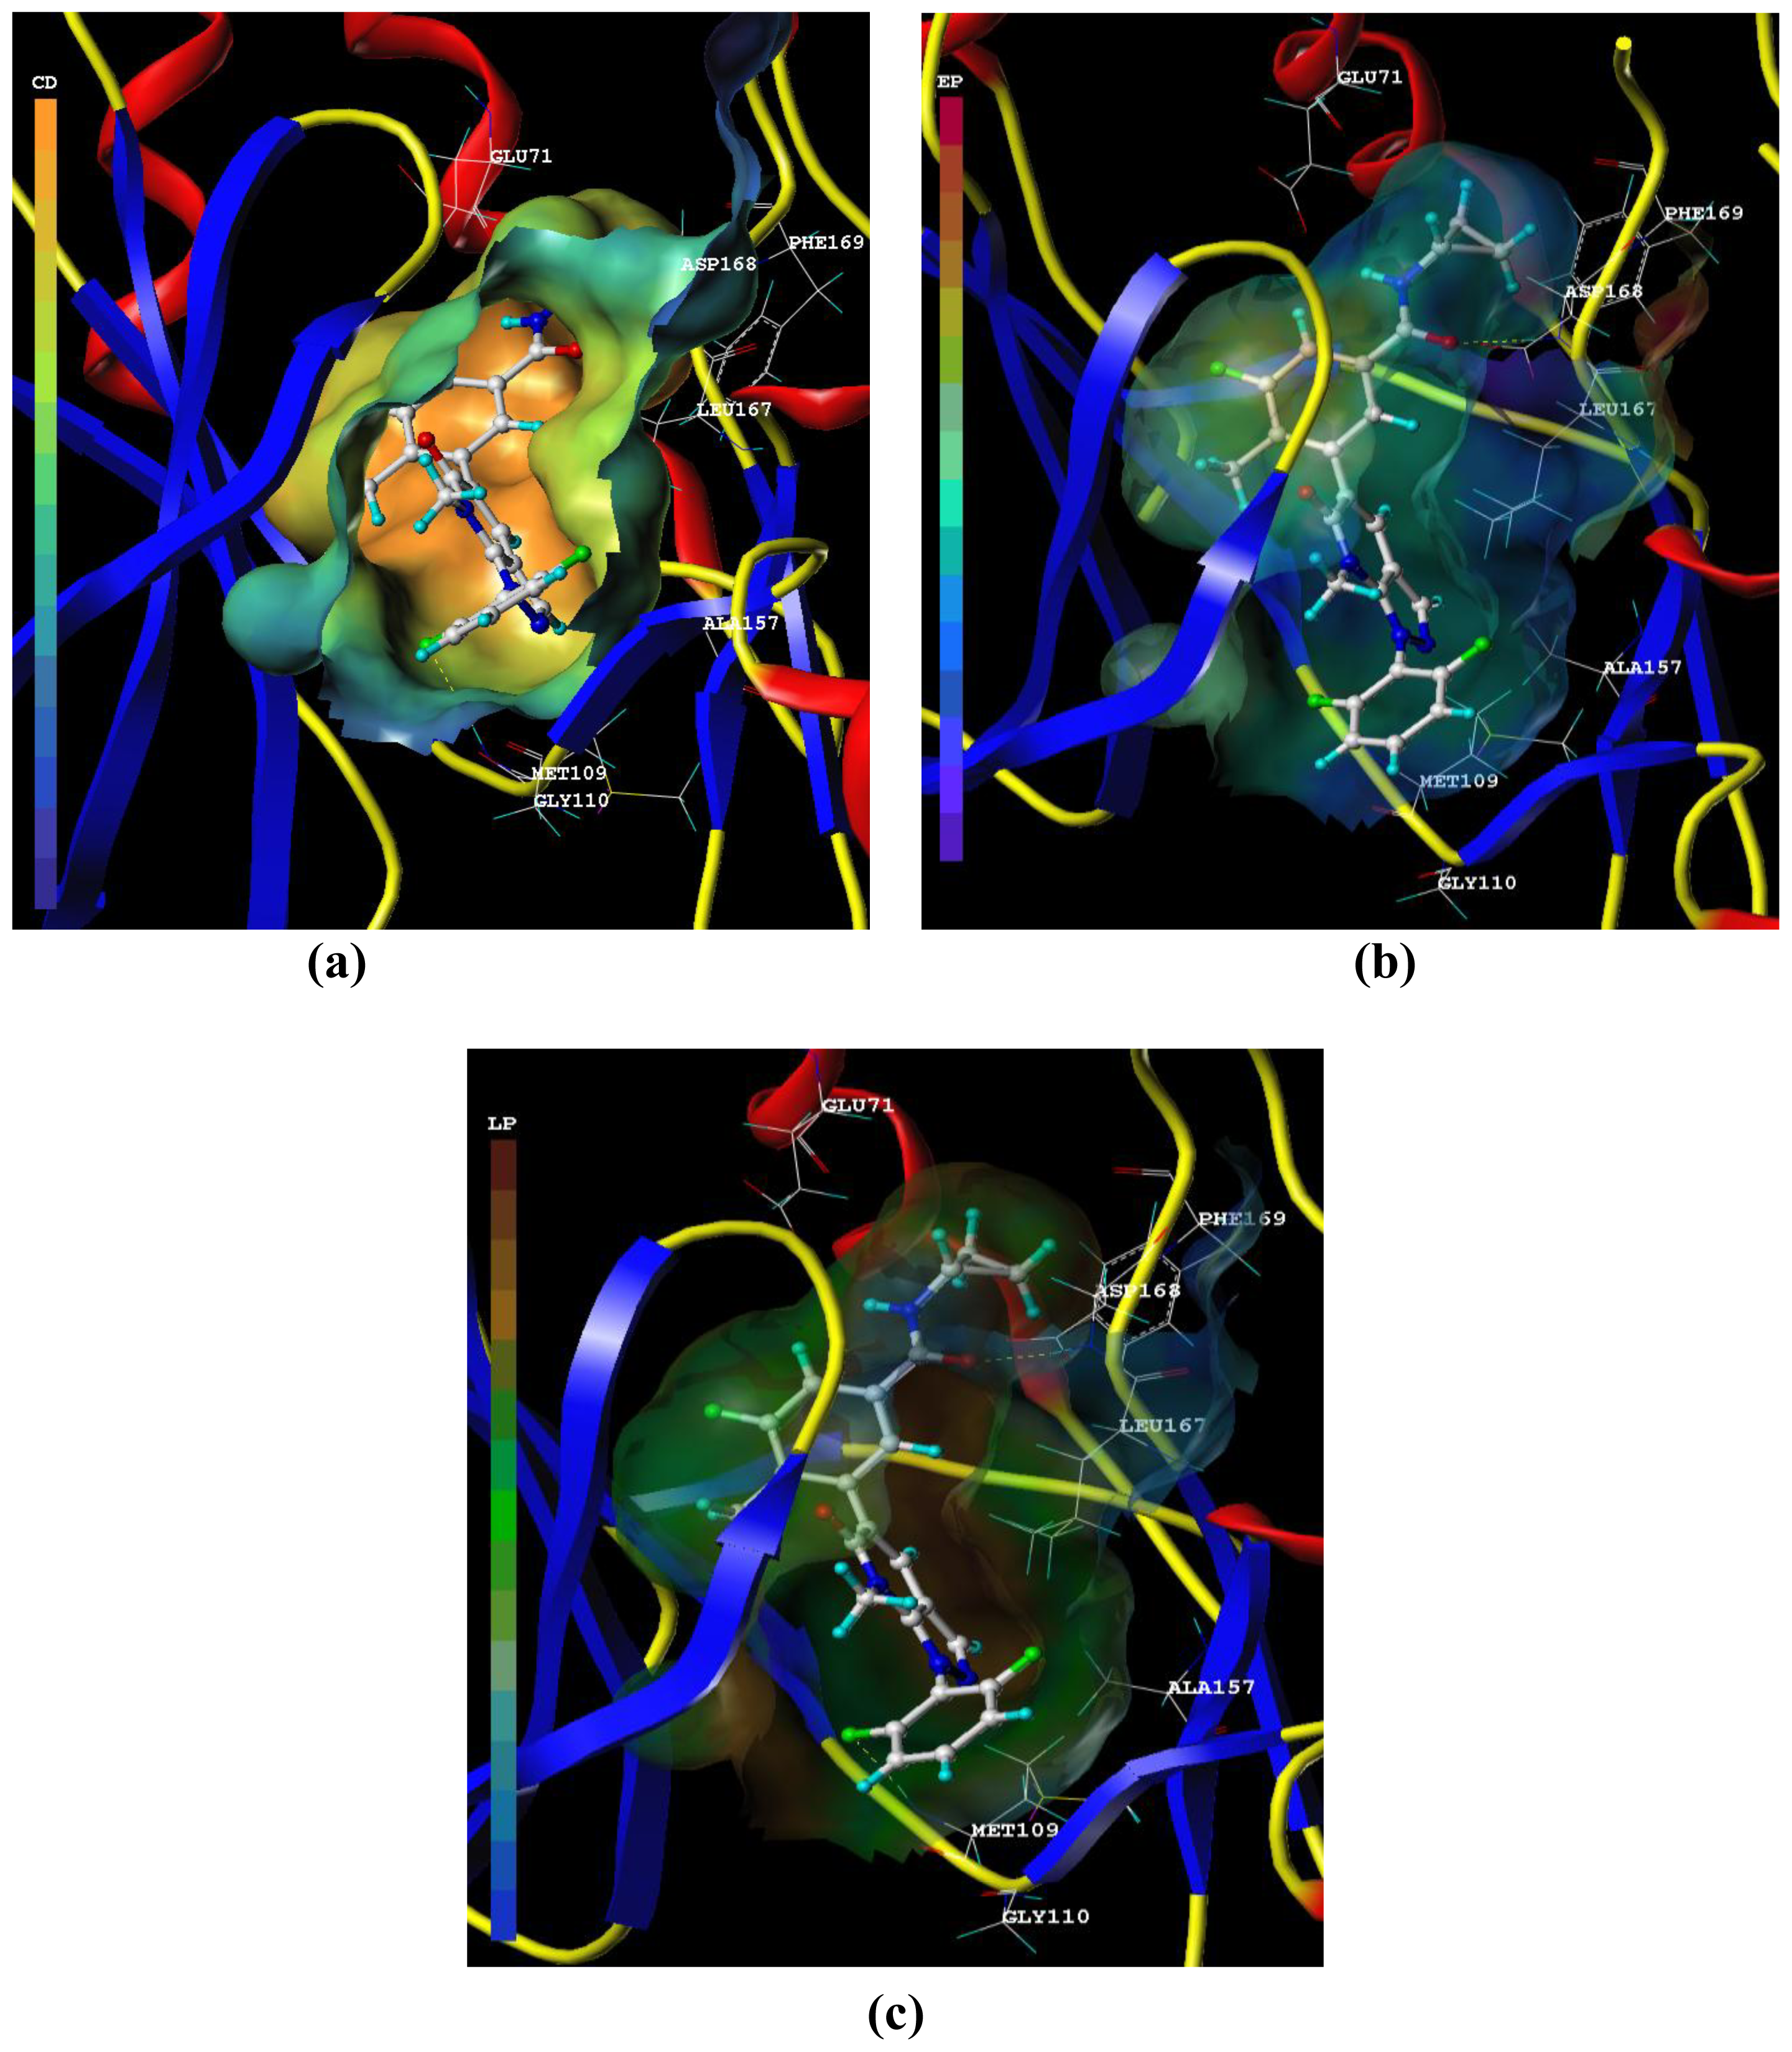
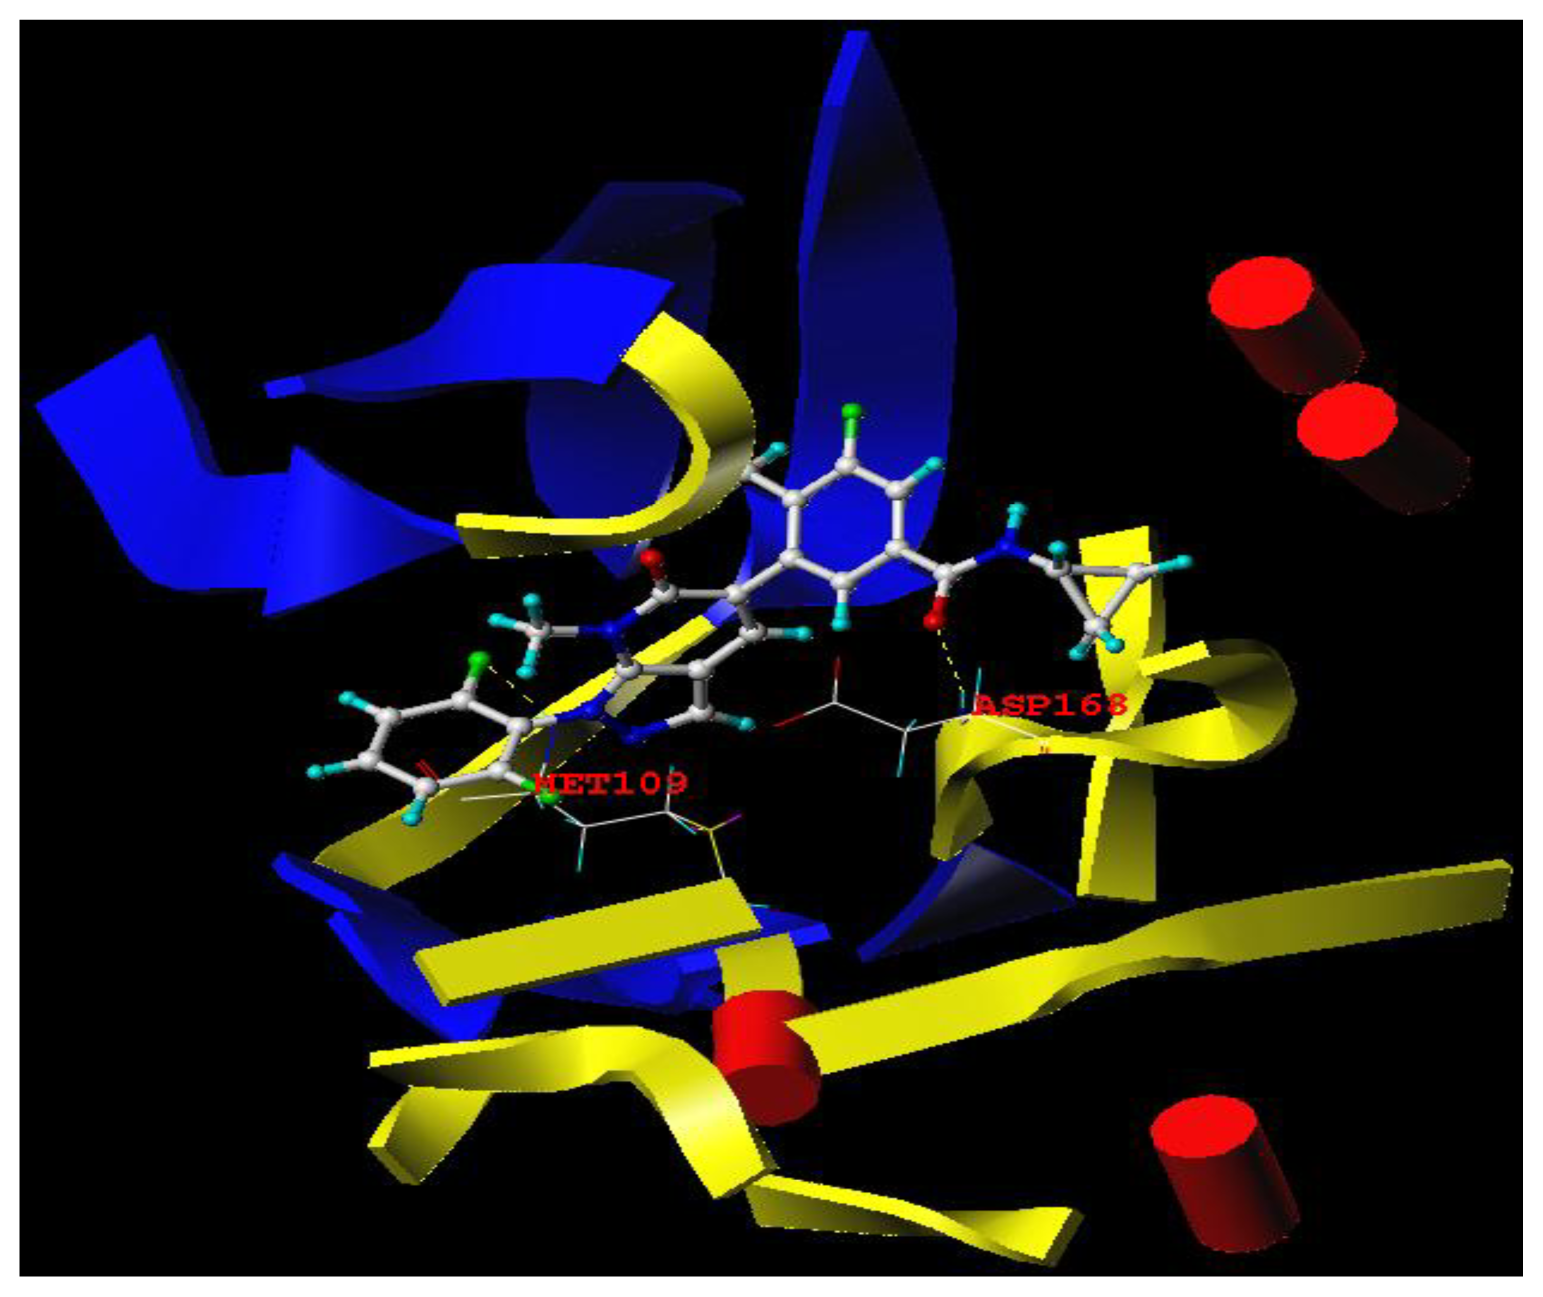
3.3. Docking Analysis
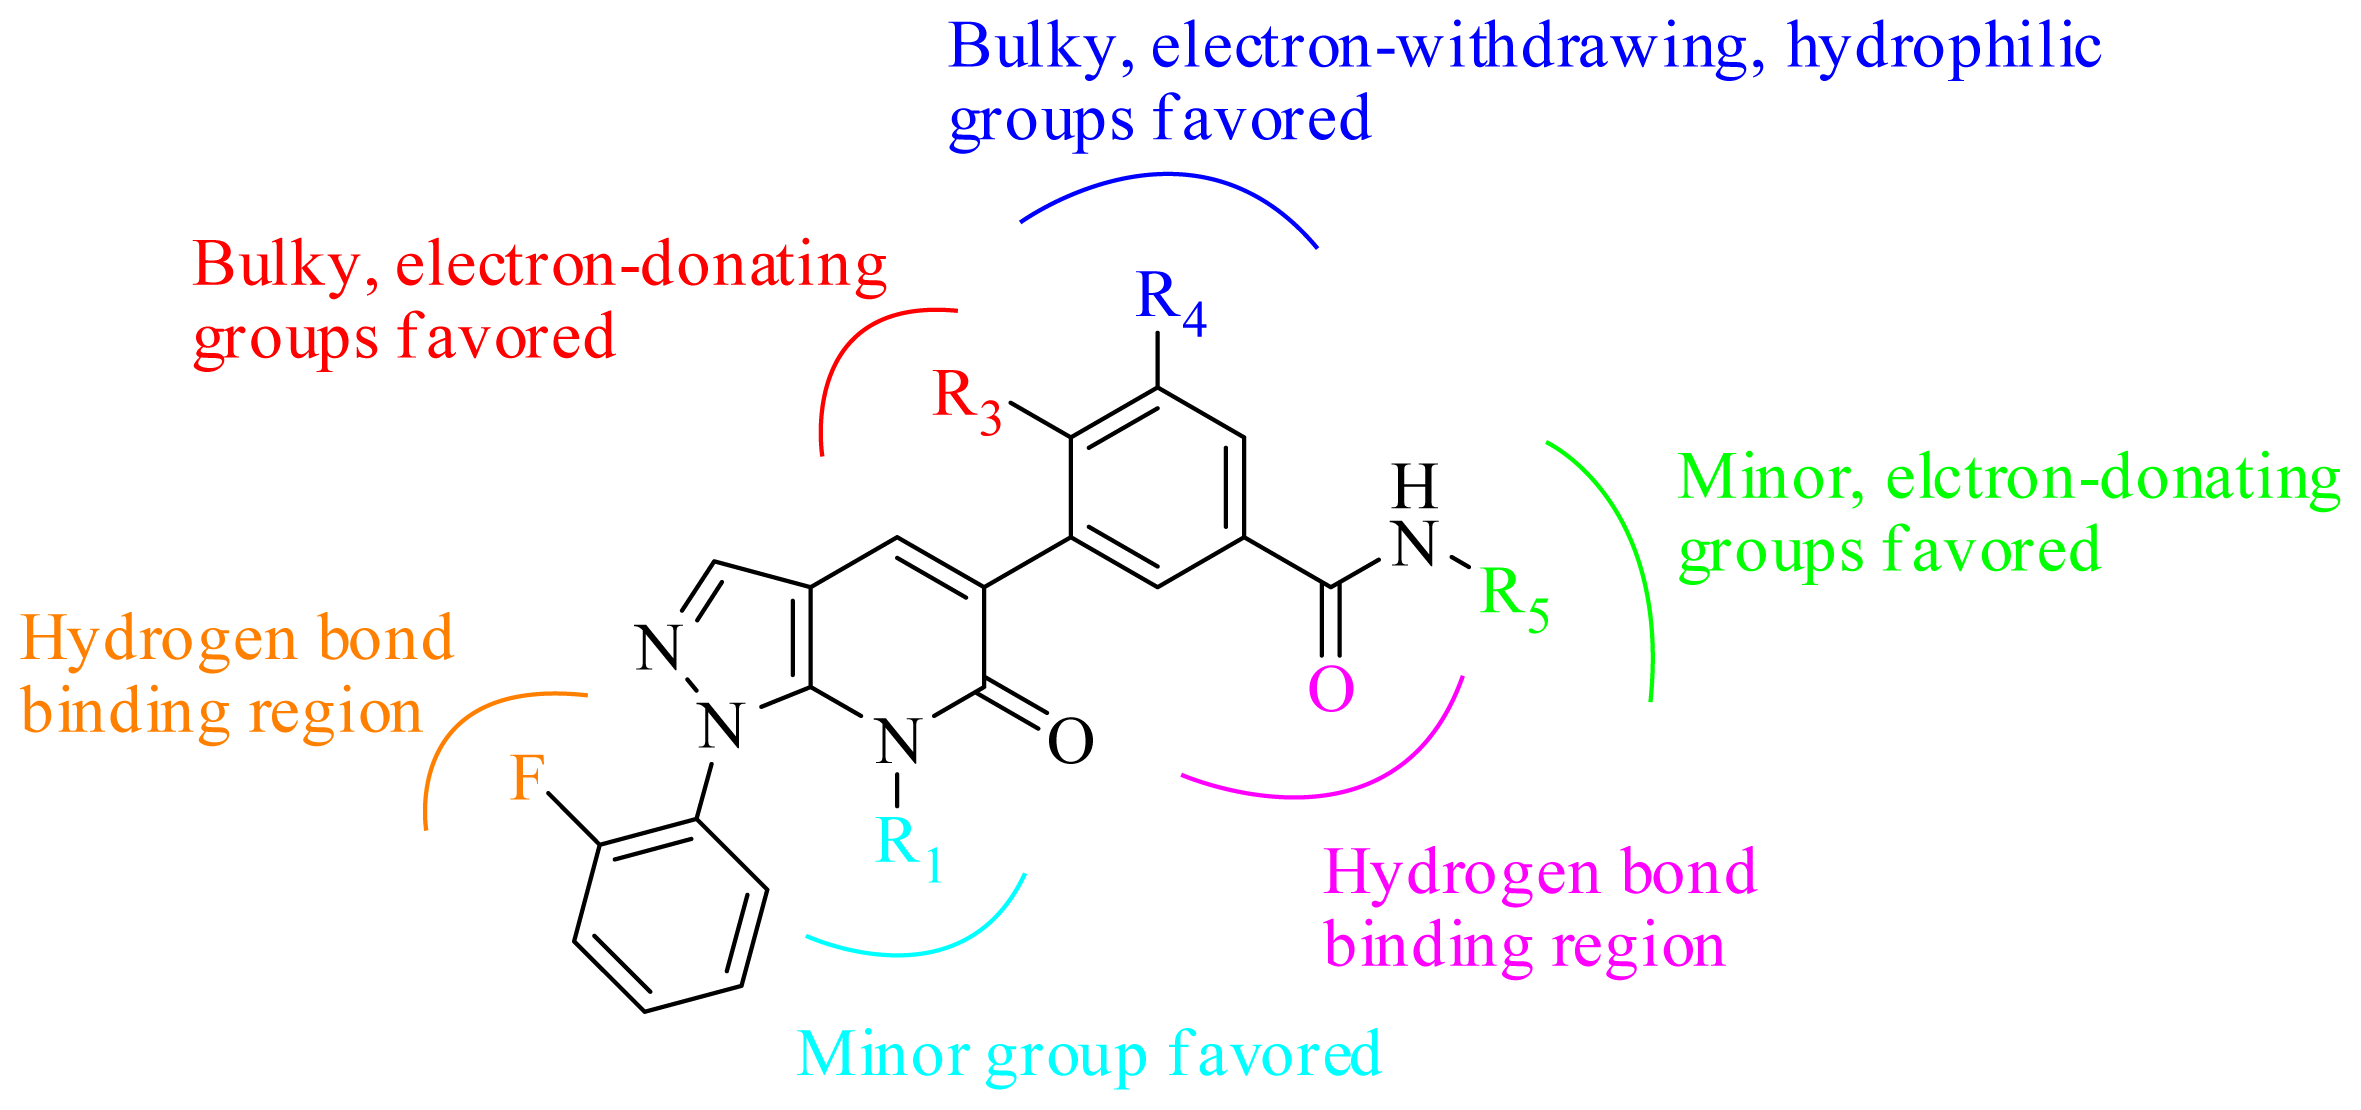
3.4. Summary of the Structure-Activity Relationship
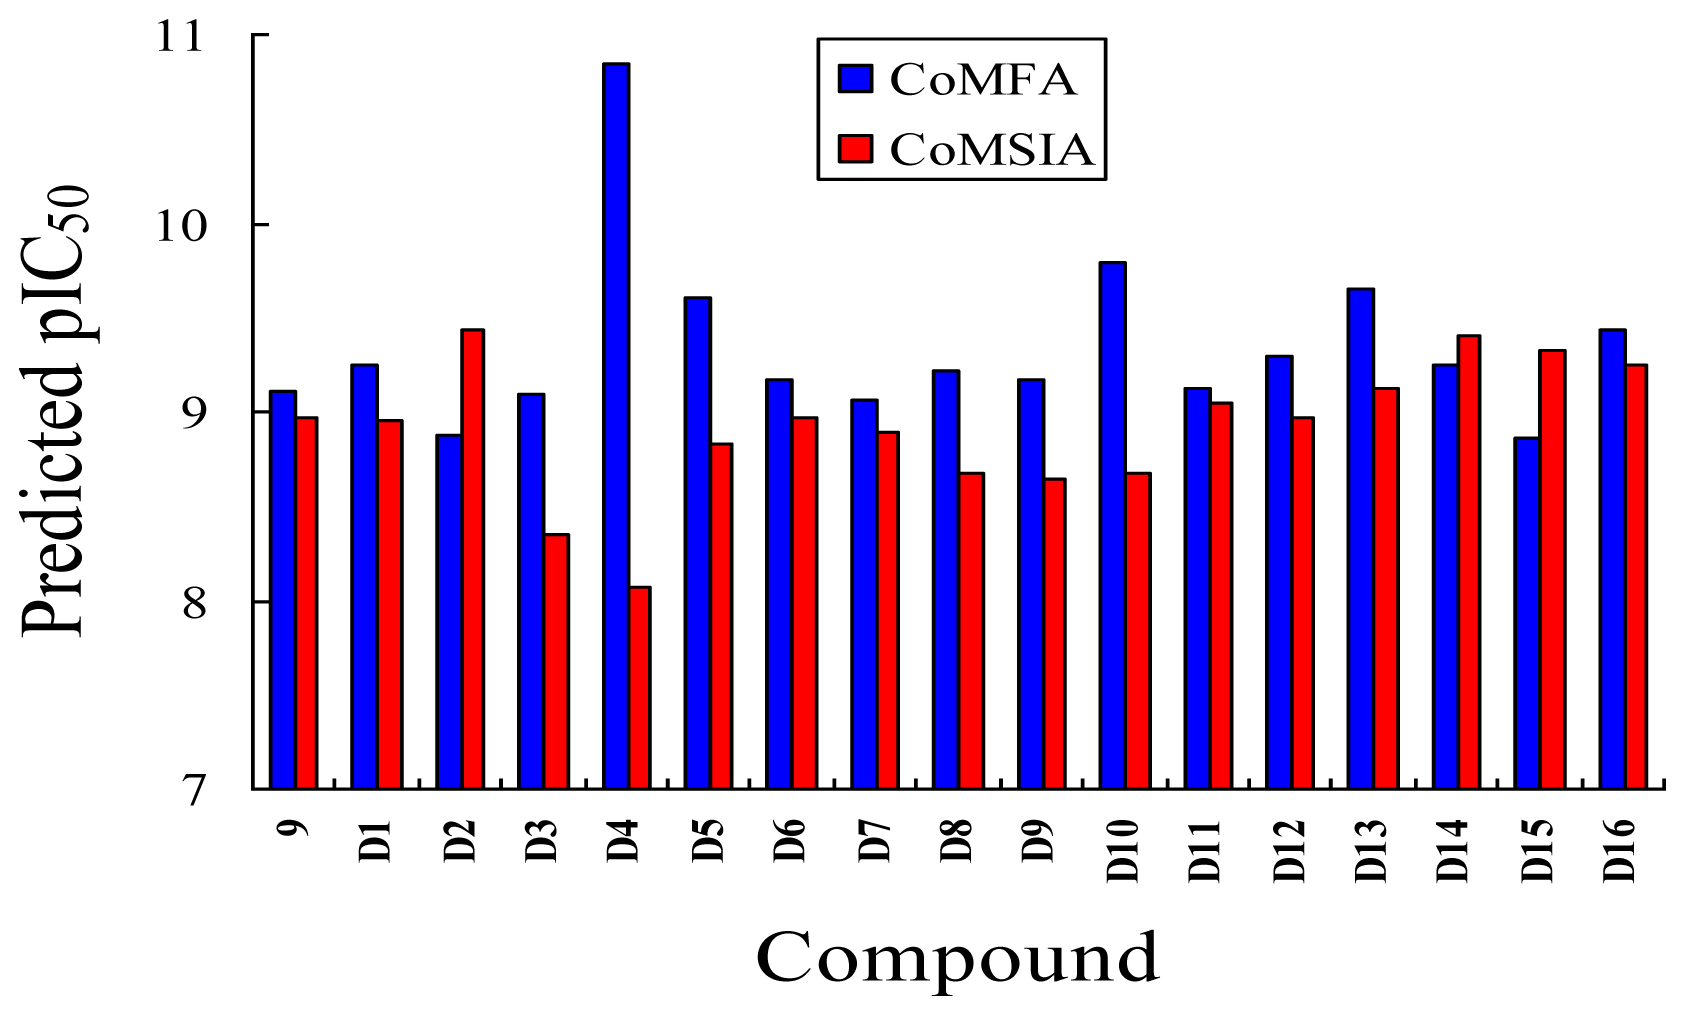
3.5. Design for New Inhibitors
4. Conclusion
Acknowledgements
References
- Pettus, LH; Wurz, RP; Xu, S; Herberich, B; Henkle, B; Liu, Q; McBride, HJ; Mu, S; Plant, MH; Saris, CJM; Sherman, L; Wong, LM; Chmait, S; Lee, MR; Mohr, C; Hsieh, F; Tasker, AS. Discovery and evaluation of 7-alkyl-1,5-bis-aryl-pyrazolopyridinones as highly potent, selective, and orally efficacious inhibitors of p38α mitogen-activated protein kinase. J. Med. Chem 2010, 53, 2973–2985. [Google Scholar]
- Wurz, RP; Pettus, LH; Henkle, B; Sherman, L; Plant, M; Miner, K; McBride, HJ; Wong, LM; Saris, CJM; Lee, MR; Chmait, S; Mohr, C; Hsieh, F; Tasker, AS. Part2: Structure-activity relationship (SAR) investigations of fused pyrazoles as potent, selective and orally available inhibitors of p38α mitogen-activated protein kinase. Bioorg. Med. Chem. Lett 2010, 20, 1680–1684. [Google Scholar]
- Wurz, RP; Pettus, LH; Xu, S; Henkle, B; Sherman, L; Plant, M; Miner, K; McBride, H; Wong, LM; Saris, CJM; Lee, MR; Chmait, S; Mohr, C; Hsieh, F; Tasker, AS. Part 1: Structure-activity relationship (SAR) investigations of fused pyrazoles as potent, selective and orally available inhibitors of p38α mitogen-activated protein kinase. Bioorg. Med. Chem. Lett 2009, 19, 4724–4728. [Google Scholar]
- Hynes, J, Jr; Dyckman, AJ; Lin, S; Wrobleski, ST; Wu, H; Gillooly, KM; Kanner, SB; Lonial, H; Loo, D; McIntyre, KW; Pitt, S; Shen, DR; Shuster, DJ; Yang, S; Zhang, R; Behnia, K; Zhang, H; Marathe, PH; Doweyko, AM; Tokarski, JS; Sack, JS; Pokross, M; Kiefer, SE; Newitt, JA; Barrish, JC; Dodd, J; Schieven, GL; Leftheris, K. Design, synthesis, and anti-inflammatory properties of orally active 4-(phenylamino)-pyrrolo[2,1-f][1,2,4]triazine p38α mitogen-activated protein kinase inhibitors. J. Med. Chem 2008, 51, 4–16. [Google Scholar]
- Pettus, LH; Xu, S; Cao, G-Q; Chakrabarti, PP; Rzasa, RM; Sham, K; Wurz, RP; Zhang, D; Middleton, S; Henkle, B; Plant, MH; Saris, CJM; Sherman, L; Wong, LM; Powers, DA; Tudor, Y; Yu, V; Lee, MR; Syed, R; Hsieh, F; Tasker, AS. 3-Amino-7-phthalazinylbenzoisoxazoles as a novel class of potent, selective, and orally available inhibitors of p38α mitogen-activated protein kinase. J. Med. Chem 2008, 51, 6280–6292. [Google Scholar]
- Laufer, SA; Hauser, DRJ; Domeyer, DM; Kinkel, K; Liedtke, AJ. Design, synthesis, and biological evaluation of novel tri- and tetrasubstituted imidazoles as highly potent and specific ATP-mimetic inhibitors of p38α mitogen-activated protein kinase: Focus on optimized interactions with the enzyme’s surface-exposed front region. J. Med. Chem 2008, 51, 4122–4149. [Google Scholar]
- Koch, P; Jahns, H; Schattel, V; Goettert, M; Laufer, S. Pyridinylquinoxalines and pyridinylpyridopyrazines as lead compounds for novel p38α mitogen-activated protein kinase inhibitors. J. Med. Chem 2010, 53, 1128–1137. [Google Scholar]
- Thaher, BA; Koch, P; Schattel, V; Laufer, S. Role of the hydrogen bonding heteroatom-lys53 interaction between the p38α mitogen-activated protein (MAP) kinase and pyridinyl-substituted 5-membered heterocyclic ring inhibitors. J. Med. Chem 2009, 52, 2613–2617. [Google Scholar]
- Lumeras, W; Caturla, F; Vidal, L; Esteve, C; Balague, C; Orellana, A; Dominguez, M; Roca, R; Huerta, JM; Godessart, N; Vidal, B. Design, synthesis, and structure-activity relationship of aminopyridine N-oxides, a novel scaffold for the potent and selective inhibition of p38α mitogen-activated protein kinase. J. Med. Chem 2009, 52, 5531–5545. [Google Scholar]
- Hauser, DRJ; Scior, T; Domeyer, DM; Kammerer, B; Laufer, SA. Synthesis, biological testing, and binding mode prediction of 6,9-diarylpurin-8-ones as p38α MAP kinase inhibitors. J. Med. Chem 2007, 50, 2060–2066. [Google Scholar]
- Peifer, C; Kinkel, K; Abadleh, M; Schollmeyer, D; Laufer, S. From five- to six- membered rings: 3,4-diarylquinolinone as lead for novel p38α MAP kinase inhibitors. J. Med. Chem 2007, 50, 1213–1221. [Google Scholar]
- Sybyl 8.1; Tripos Inc: St. Louis, MO, USA, 2008. Available online: http://www.tripos.com (accessed on 11 September 2010).
- Yang, Z; Sun, P. 3D-QSAR study of potent inhibitors of phosphodiesterase-4 using a CoMFA approach. Int. J. Mol. Sci 2007, 9, 714–722. [Google Scholar]
- Sun, J; Cai, S; Yan, N; Mei, H. Docking and 3D-QSAR studies of influenza neuraminidase inhibitors using three-dimensional holographic vector of atomic interaction field analysis. Eur. J. Med. Chem 2010, 45, 1008–1014. [Google Scholar]
- Zhang, N; Zhong, R. Docking and 3D-QSAR studies of 7-hydroxycoumarin derivatives as CK2 inhibitors. Eur. J. Med. Chem 2010, 45, 292–297. [Google Scholar]
- Zhou, Z; Wang, Y; Bryant, SH. QSAR models for predicting cathepsin B inhibition by small molecules continuous and binary QSAR model to classify cathepsin B inhibition activities of small molecules. J. Mol. Grap. Model 2010, 28, 714–727. [Google Scholar]
- Sivan, SK; Manga, V. Molecular docking and 3D-QSAR studies on triazolinone and pyridazinone, non-nucleoside inhibitor of HIV-1 reverse transcriptase. J. Mol. Model 2010, 16, 1169–1178. [Google Scholar]
- Song, Q-L; Sun, P-H; Chen, W-M. Exploring 3D-QSAR for ketolide derivatives as antibacterial agents using CoMFA and CoMSIA. Lett. Drug Des. Discov 2010, 7, 149–159. [Google Scholar]
- Morshed, MN; Muddassar, M; Pasha, FA; Cho, SJ. Pharmacophore identification and validation study of CK2 inhibitors using CoMFA/CoMSIA. Chem. Biol. Drug Des 2009, 74, 148–158. [Google Scholar]
- Zeng, H; Cao, R; Zhang, H. Combined 3D-QSAR modeling and molecular docking study on quinoline derivatives as inhibitors of P-selectin. Chem. Biol. Drug Des 2009, 74, 596–610. [Google Scholar]
- Roy, K; Pau, S. Docking and 3D-QSAR studies of acetohydroxy acid synthase inhibitor sulfonylurea derivatives. J. Mol. Model 2010, 16, 951–964. [Google Scholar]
- Srivastava, V; Gupta, SP; Siddiqi, MI; Mishra, BN. 3D-QSAR studies on quinazoline antifolate thymidylate synthase inhibitors by CoMFA and CoMSIA models. Eur. J. Med. Chem 2010, 45, 1560–1571. [Google Scholar]


 | |||||
|---|---|---|---|---|---|
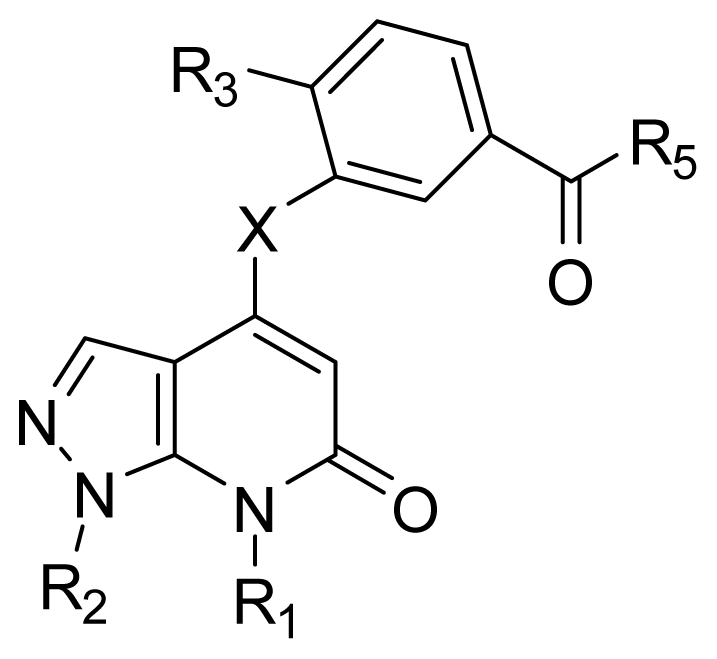
| Compound No. | Substituent | ||||
| R1 | R2 | R3 | R4 | R5 | |
| 1 | Me | 2-Me-Ph | Me | H | Cyclopropyl |
| 2 | Me | 2-Cl-Ph | Me | H | Cyclopropyl |
| 3 | Me | 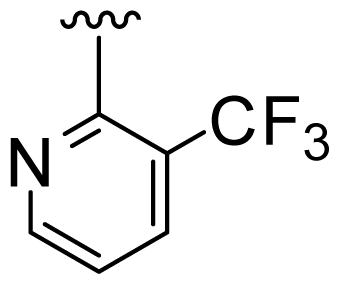 | Me | H | Cyclopropyl |
| 4 | Me | 2,4-Di-F-Ph | Me | H | Cyclopropyl |
| 5 | Me | 2,5-Di-F-Ph | Me | H | Cyclopropyl |
| 6 | Me | 2,6-Di-F-Ph | Me | H | Cyclopropyl |
| 7 | Et | 2,4-Di-F-Ph | Me | H | Cyclopropyl |
| 8 | Me | 2,6-Di-F-Ph | Cl | H | Cyclopropyl |
| 9 | Me | 2,6-Di-F-Ph | Me | F | Cyclopropyl |
| 10 | Me | 2,6-Di-F-Ph | Me | H | H |
| 11 | Me | 2,6-Di-F-Ph | Me | H | 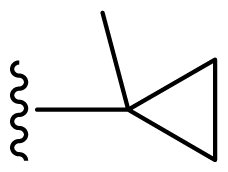 |
| 12 | Me | 2,6-Di-F-Ph | Me | H | 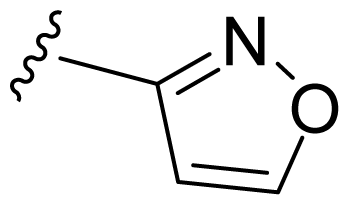 |
| 13 | Me | 2,6-Di-F-Ph | Me | H | Methylamino |
 | |||
|---|---|---|---|
| Compound No. | Substituent | ||
| R1 | R2 | R3 | |
| 14 | Me | 3-F-Ph |  |
| 15 | Me | 2,6-Di-F-Ph | 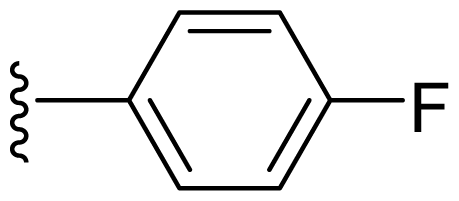 |
| 16 | Me | 2,4-Di-F-Ph | 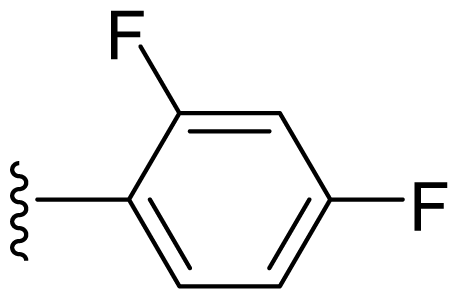 |
| 17 | Me | 2,5-Di-F-Ph | 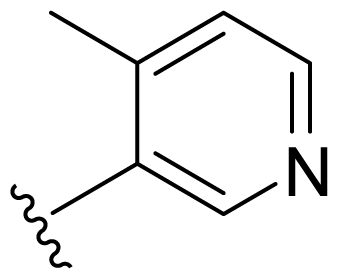 |
 | |||||
|---|---|---|---|---|---|
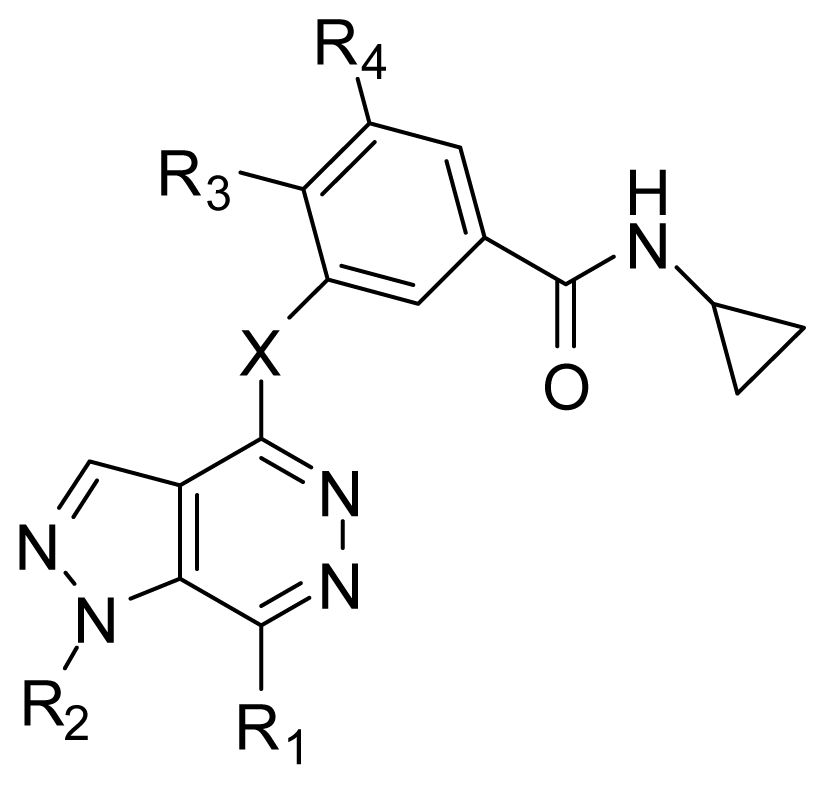
| Compound No. | Substituent | ||||
| R1 | R2 | X | R3 | R5 | |
| 18 | Me | 2,4-Di-F-Ph | NH | Me | NH2 |
| 19 | Me | 2,5-Di-F-Ph | NH | Me | NH2 |
| 20 | Me | 2,4-Di-F-Ph | NH | Me | NHOMe |
| 21 | Me | 2,4-Di-F-Ph | NH | Me | Cyclopropylamino |
| 22 | Me | 2,4-Di-F-Ph | NH | Me | t-butylamino |
| 23 | Me | 2,4-Di-F-Ph | NH | Me | OH |
| 24 | Me | 3-F-Ph | NH | Me | Cyclopropylamino |
| 25 | Me | 3-F-Ph | O | Me | Cyclopropylamino |
| 26 | Me | 4-F-Ph | NH | Cl | Cyclopropylamino |
| 27 | Et | 4-F-Ph | NH | Me | Cyclopropylamino |
| 28 | Et | 4-F-Ph | NH | Cl | Cyclopropylamino |
| 29 | Et | 4-F-Ph | O | Me | Cyclopropylamino |
| 30 | Et | 2,4-Di-F-Ph | NH | Cl | Cyclopropylamino |
| 31 | Me | 2,4-Di-F-Ph | O | Me | Cyclopropylamino |
| 32 | Me | 2,5-Di-F-Ph | NH | Me | Cyclopropylamino |
| 33 | Me | 2,5-Di-F-Ph | NH | Cl | Cyclopropylamino |
| 34 | Me | 2,5-Di-F-Ph | O | Me | Cyclopropylamino |
| 35 | Me | 2,5-Di-F-Ph | O | Cl | Cyclopropylamino |
| 36 | Me | 2,6-Di-F-Ph | NH | Me | Cyclopropylamino |
| 37 | Me | 2,6-Di-F-Ph | NH | Cl | Cyclopropylamino |
| 38 | Me | 2,6-Di-F-Ph | NH | F | Cyclopropylamino |
| 39 | Me | 2,6-Di-F-Ph | O | Me | Cyclopropylamino |
 | |||||
|---|---|---|---|---|---|
| Compound No. | Substituent | ||||
| R1 | R2 | X | R3 | R4 | |
| 40 | H | 2-Cl-Ph | NH | Cl | H |
| 41 | H | 3-F-Ph | NH | Me | H |
| 42 | H | 3-F-Ph | NH | Cl | H |
| 43 | H | 4-F-Ph | NH | Cl | H |
| 44 | H | 2,4-Di-F-Ph | NH | Me | H |
| 45 | H | 2,4-Di-F-Ph | NH | Cl | H |
| 46 | H | 2,4-Di-F-Ph | O | Me | H |
| 47 | H | 2,4-Di-F-Ph | O | Cl | H |
| 48 | H | 2,5-Di-F-Ph | NH | Cl | H |
| 49 | H | 2,6-Di-F-Ph | NH | Me | H |
| 50 | H | 2,6-Di-F-Ph | NH | Cl | H |
| 51 | H | 2,6-Di-F-Ph | O | Me | H |
| 52 | Me | 4-F-Ph | NH | Me | H |
| 53 | Me | 4-F-Ph | NH | Cl | H |
| 54 | Me | 4-F-Ph | O | Me | H |
| 55 | Me | 2,4-Di-F-Ph | NH | Me | H |
| 56 | Me | 2,4-Di-F-Ph | NH | Me | F |
| 57 | Me | 2,4-Di-F-Ph | NH | Cl | H |
| 58 | Me | 2,4-Di-F-Ph | O | Me | H |
| 59 | Me | 2,6-Di-F-Ph | NH | Cl | H |
| Compd. No. | Experimental | CoMFA | CoMSIA | ||
|---|---|---|---|---|---|
| Pred. | Res. | Pred. | Res. | ||
| 1 | 8.721 | 8.777 | −0.056 | 8.957 | −0.236 |
| 2* | 9.046 | 8.778 | 0.268 | 8.905 | 0.141 |
| 3 | 8.638 | 8.682 | −0.044 | 8.764 | −0.126 |
| 4* | 8.638 | 8.572 | 0.066 | 8.858 | −0.220 |
| 5 | 8.721 | 8.639 | 0.082 | 8.790 | −0.069 |
| 6 | 8.854 | 8.995 | −0.141 | 8.879 | −0.025 |
| 7 | 9.222 | 8.929 | 0.293 | 8.920 | 0.302 |
| 8 | 8.959 | 9.010 | −0.051 | 8.841 | 0.118 |
| 9 | 9.097 | 9.111 | −0.014 | 8.972 | 0.125 |
| 10* | 8.824 | 9.006 | −0.182 | 8.873 | −0.049 |
| 11 | 8.770 | 8.972 | −0.202 | 8.903 | −0.133 |
| 12 | 9.000 | 8.839 | 0.161 | 8.868 | 0.132 |
| 13 | 8.699 | 8.742 | −0.043 | 8.826 | −0.127 |
| 14 | 6.000 | 6.004 | −0.004 | 5.830 | 0.170 |
| 15 | 6.000 | 6.067 | −0.067 | 6.266 | −0.266 |
| 16* | 6.000 | 5.862 | 0.138 | 6.340 | −0.340 |
| 17 | 6.353 | 6.362 | −0.009 | 6.273 | 0.080 |
| 18 | 8.585 | 8.533 | 0.052 | 8.637 | −0.052 |
| 19* | 8.432 | 8.568 | −0.136 | 8.566 | −0.134 |
| 20 | 8.959 | 9.046 | −0.087 | 9.152 | −0.193 |
| 21 | 8.495 | 8.396 | 0.099 | 7.804 | 0.691 |
| 22 | 6.570 | 6.573 | −0.003 | 6.795 | −0.225 |
| 23 | 6.000 | 5.986 | 0.014 | 6.047 | −0.047 |
| 24 | 8.482 | 8.521 | −0.040 | 8.435 | 0.047 |
| 25 | 8.071 | 8.248 | −0.177 | 8.566 | −0.495 |
| 26 | 8.824 | 8.695 | 0.129 | 8.728 | 0.096 |
| 27* | 8.398 | 8.617 | −0.219 | 8.565 | −0.167 |
| 28 | 8.921 | 8.985 | −0.064 | 8.840 | 0.081 |
| 29 | 8.398 | 8.533 | −0.135 | 8.608 | −0.210 |
| 30 | 8.959 | 9.075 | −0.116 | 8.800 | 0.159 |
| 31 | 8.108 | 8.106 | 0.002 | 8.519 | −0.411 |
| 32* | 8.538 | 8.362 | 0.176 | 8.617 | −0.079 |
| 33 | 8.959 | 8.696 | 0.263 | 8.676 | 0.283 |
| 34* | 8.215 | 8.192 | 0.023 | 8.449 | −0.234 |
| 35 | 8.482 | 8.504 | −0.022 | 8.732 | −0.250 |
| 36 | 8.721 | 8.606 | 0.115 | 8.674 | 0.047 |
| 37 | 8.959 | 8.939 | 0.020 | 8.735 | 0.224 |
| 38 | 8.721 | 8.996 | −0.275 | 8.744 | −0.023 |
| 39 | 8.854 | 8.546 | 0.308 | 8.543 | 0.311 |
| 40 | 8.796 | 8.622 | 0.174 | 8.529 | 0.267 |
| 41* | 8.337 | 8.287 | 0.050 | 8.220 | 0.117 |
| 42* | 8.301 | 8.519 | −0.218 | 8.450 | −0.149 |
| 43 | 8.071 | 8.410 | −0.339 | 8.459 | −0.388 |
| 44 | 7.921 | 8.132 | −0.211 | 8.232 | −0.311 |
| 45 | 8.482 | 8.419 | 0.063 | 8.463 | 0.019 |
| 46 | 8.000 | 7.795 | 0.205 | 7.956 | 0.044 |
| 47 | 7.444 | 7.754 | −0.310 | 7.946 | −0.502 |
| 48 | 8.678 | 8.714 | −0.036 | 8.588 | 0.090 |
| 49 | 8.770 | 8.761 | 0.009 | 8.680 | 0.090 |
| 50* | 8.854 | 8.887 | −0.033 | 8.635 | 0.219 |
| 51 | 8.523 | 8.612 | −0.089 | 8.140 | 0.383 |
| 52 | 8.387 | 8.182 | 0.205 | 8.225 | 0.162 |
| 53 | 8.638 | 8.409 | 0.229 | 8.457 | 0.181 |
| 54 | 8.114 | 7.849 | 0.265 | 7.968 | 0.146 |
| 55* | 8.569 | 8.513 | 0.056 | 8.649 | −0.080 |
| 56 | 8.000 | 8.387 | −0.387 | 8.627 | −0.627 |
| 57 | 8.796 | 8.648 | 0.148 | 8.605 | 0.191 |
| 58* | 8.201 | 8.444 | −0.243 | 8.269 | −0.068 |
| 59 | 8.770 | 8.681 | 0.089 | 8.489 | 0.281 |
| PLS Statistics | CoMFA | CoMSIA |
|---|---|---|
| r2cva | 0.725 | 0.609 |
| r2b | 0.961 | 0.905 |
| ONCc | 6 | 6 |
| SEEd | 0.178 | 0.279 |
| F valuee | 160.943 | 61.672 |
| r2predf | 0.953 | 0.929 |
| Field contribution | ||
| Steric | 0.534 | 0.159 |
| Electrostatic | 0.466 | 0.137 |
| Hydrophobic | - | 0.202 |
| H-bond Donor | - | 0.310 |
| H-bond Acceptor | - | 0.192 |
 | ||||||
|---|---|---|---|---|---|---|
| No. | Substituent | Predicted pIC50 | ||||
| R1 | R3 | R4 | R5 | CoMFA | CoMSIA | |
| D1 | Me | CH2OOCCH3 | COOH | Et | 9.253 | 8.961 |
| D2 | Me | CH2OOCCH3 | CONH2 | Et | 8.881 | 9.438 |
| D3 | Me | C(CH3)3 | COOH | Et | 9.093 | 8.343 |
| D4 | Me | OC(CH3)3 | SO3H | Et | 10.845 | 8.064 |
| D5 | Me | CH2OOCCH3 | SO3H | Et | 9.604 | 8.835 |
| D6 | Me | C(CH3)3 | SO3H | Et | 9.171 | 8.970 |
| D7 | H | C(CH3)3 | COOH | Me | 9.056 | 8.885 |
| D8 | Me | OC(CH3)3 | NO2 | Et | 9.210 | 8.667 |
| D9 | Me | OCH(CH3)2 | NO2 | Et | 9.168 | 8.638 |
| D10 | Me | CH2OOCCH3 | NO2 | Et | 9.792 | 8.668 |
| D11 | Me | OC(CH3)3 | CN | Et | 9.129 | 9.052 |
| D12 | Me | OCH(CH3)2 | CN | Et | 9.288 | 8.966 |
| D13 | Me | C(CH3)3 | CN | Et | 9.651 | 9.121 |
| D14 | H | C(CH3)3 | CF3 | Et | 9.245 | 9.408 |
| D15 | H | OC(CH3)3 | CF3 | Et | 8.857 | 9.328 |
| D16 | Me | C(CH3)3 | CF3 | Et | 9.430 | 9.250 |
© 2010 by the authors; licensee Molecular Diversity Preservation International, Basel, Switzerland. This article is an open-access article distributed under the terms and conditions of the Creative Commons Attribution license (http://creativecommons.org/licenses/by/3.0/).
Share and Cite
Lan, P.; Huang, Z.-J.; Sun, J.-R.; Chen, W.-M. 3D-QSAR and Molecular Docking Studies on Fused Pyrazoles as p38α Mitogen-Activated Protein Kinase Inhibitors. Int. J. Mol. Sci. 2010, 11, 3357-3374. https://doi.org/10.3390/ijms11093357
Lan P, Huang Z-J, Sun J-R, Chen W-M. 3D-QSAR and Molecular Docking Studies on Fused Pyrazoles as p38α Mitogen-Activated Protein Kinase Inhibitors. International Journal of Molecular Sciences. 2010; 11(9):3357-3374. https://doi.org/10.3390/ijms11093357
Chicago/Turabian StyleLan, Ping, Zhi-Jian Huang, Jun-Rong Sun, and Wei-Min Chen. 2010. "3D-QSAR and Molecular Docking Studies on Fused Pyrazoles as p38α Mitogen-Activated Protein Kinase Inhibitors" International Journal of Molecular Sciences 11, no. 9: 3357-3374. https://doi.org/10.3390/ijms11093357