Article

Differential Proteomics Identification of HSP90 as Potential Serum Biomarker in Hepatocellular Carcinoma by Two-dimensional Electrophoresis and Mass Spectrometry

1
Chengdu Medical College, Chengdu 610083, Sichuan Province, China
2
West China Hospital, Sichuan University, Chengdu 610041, Sichuan Province, China
*
Author to whom correspondence should be addressed.
Int. J. Mol. Sci. 2010, 11(4), 1423-1433; https://doi.org/10.3390/ijms11041423
Submission received: 11 January 2010 / Revised: 14 March 2010 / Accepted: 17 March 2010 / Published: 31 March 2010
(This article belongs to the Special Issue Biomarkers)

Abstract

:
The aim of the current study is to identify the potential biomarkers involved in Hepatocellular carcinoma (HCC) carcinogenesis. A comparative proteomics approach was utilized to identify the differentially expressed proteins in the serum of 10 HCC patients and 10 controls. A total of 12 significantly altered proteins were identified by mass spectrometry. Of the 12 proteins identified, HSP90 was one of the most significantly altered proteins and its over-expression in the serum of 20 HCC patients was confirmed using ELISA analysis. The observations suggest that HSP90 might be a potential biomarker for early diagnosis, prognosis, and monitoring in the therapy of HCC. This work demonstrates that a comprehensive strategy of proteomic identification combined with further validation should be adopted in the field of cancer biomarker discovery.

1. Introduction

Hepatocellular carcinoma (HCC) is the most common primary liver cancer, the fifth most common cancer and the third leading cause of cancer-related death in the world [1,2]. The incidence of HCC is rising around the world with few exceptions. There is a distinct geographical variation in the incidence of HCC, with 81% of cases occurring in the developing world and 54% of these occurring in China [3]. Current curative options can be applied to a paucity of patients, and in general, the prognosis of HCC is dismal due to underlying cirrhosis as well as to poor tumor response to chemotherapeutic regimes [4,5]. Currently, there is an urgent need to devise critical tools for the early diagnosis of and the monitoring of disease progression. Among these tools, validated biomarkers are viewed as the most important; therefore there is a critical need to discover new specific biomarkers in HCC.
Proteomic analysis is currently considered to be a powerful tool for global evaluation of protein expression, and proteomics has been widely applied in analysis of diseases, especially in the field of cancer research [69]. Biomarker discovery and validation is a central application in current proteomic research to improve the diagnosis, treatment monitoring and prognosis of many kinds of cancer [69]. It has been thought that the association between protein alterations and malignancy—analysis of the cancer proteome—could be more informative and advantageous than genomics or transcriptomics alone, because there are also factors relating to molecular changes in translation, post-translational modification and intracellular mislocalization involved in tumor initiation and growth [10,11]. Two-dimensional gel electrophoresis (2-DE) is an established technology for the separation of proteins. Despite a number of limitations, the resolution of 2-DE gels is impressive, rendering this technology still a preferred tool in many proteomics studies [12,13]. 2-DE gels can also give both qualitative and quantitative analysis and has been applied to proteomic studies in several human cancers, such as colorectal cancer, breast cancer, lung cancer, gastric cancer, prostate cancer, pancreatic cancer, etc. [1419].
Plasma/serum peptides or proteins that are biological indicators are known as biomarkers. Serological biomarker detection promises noninvasive and financially reasonable screening for early cancer with a high potential of positive impact on survival and quality of life and therefore the potential to greatly enhance screening acceptance [9,20]. Alphafetoprotein (AFP), the only clinically available serum marker, has been widely used for serological diagnosis of human HCC. However, the measurement of AFP is not an ideal method for screening individuals at risk of developing HCC due to its poor sensitivity and specificity [2124]. Therefore, the search is still ongoing to improve early and specific detection and disease monitoring. In the present study, 2-DE and MALDI-TOF MS were employed to investigate protein expression alterations between HCC and control serum samples. The aim of our study was to identify novel tumor-associated molecules for potential biomarkers using 2-DE based differential proteomics.

2. Materials and Methods

2.1. Serum Sample Collection

Blood samples were collected from 20 patients with HCC consulted for medical care without any previous treatment and 20 healthy donors under fasting conditions. Patients were admitted for HCC surgery, and the HCC was confirmed by pathohistology after surgery. The age range of the healthy donors matched that of the patients. Blood drawn from both donors and patients was allowed to coagulate at room temperature for 10 min and then centrifuged at 3,000 g for 10 min. Serum were then stored at −80 °C. Written informed consent of all patients and blood donors was documented, and anonymity was maintained by tracing the patients through their clinical history number. The project was approved by the Scientific and Ethical Committee of the Chendu Medical Collegue, China.

2.2. Serum High-Abundance Protein Depletion

Serum samples from 10 HCC patients and 10 healthy controls were processed to deplete the top-6 (albumin, IgG, IgA, antitrypsin, transferrin, and haptoglobin) high abundance proteins using the Agilent Multiple Affinity Removal System (Agilent Technologies, Palo Alto, CA) with previously published protocols [25,26]. Samples were processed according to the manufacturer’s instructions. For each sample, a low abundance fraction was collected, and buffer was exchanged into 10 mM Tris-HCl (pH 7.4) using 5,000 Da molecular weight cut-off spin concentrators (Agilent Technologies, Palo Alto, CA). Protein concentration was measured by bicinchoninic acid (BCA) protein assay.

2.3. Two-dimensional Gel Electrophoresis

All reagents and apparatus used have been described in detail elsewhere [27,28]. Two hundred microliters of serum was mixed with 400 μL of ice-cold acetone (−20 °C) and centrifuged at 10,000 g at 4 °C for 10 min. The pellet was mixed with 10 μL of a solution containing 10% sodium dodecyl (SDS) (w/v) and 2.3% dithioerythritol (DTE) (w/v). The sample was heated to 95 °C for 5 min, then diluted to 60 μL with a solution containing 8 M urea, 4% 3-[(3-cholamidopropyl)dimethylammonio]-1-propanesulfonic acid (CHAPS) (w/v), 40 mM Tris, 65 mM DTE, and a trace of bromphenol blue. The whole final diluted CSF sample corresponding to 50 μg was loaded in a cup at the cathodic end of the immobilized pH gradient (IPG) strips. 2-DE was performed as described previously [2932]. IEF was performed on rehydrated 18 cm Immobiline Drystrip gels, pH 3–10 NL following the manual of Amersham Biosciences. Vertical acrylamide-bisacrylamide gradient gels (9–16% T, 2.6% C) were used for 2D electrophoresis.

2.4. Image Analysis

Image analysis was performed using PDQuest 2D-analysis software (Bio-Rad, Hercules, CA). Spot intensity was quantified automatically by calculation of spot volume after normalization of the image by taking the ratio of intensity of one spot to the total spots, and expressed as a fractional intensity. Only those spots with 3.5-fold (t test, P < 0.05) or more changes in expression intensity were selected for MALDI-TOF-MS analysis.

2.5. Tryptic Digestion

Protein spots of interest were excised and destained with 25 mM ammonium bicarbonate, 50% ACN. Gels were then dried completely by centrifugal lyophilization. In-gel digestion was performed with 0.01 μg/μL trypsin in 25 mM ammonium bicarbonate for 15 h at 37 °C. Each spot was digested overnight in 12.5 ng/mL trypsin in 0.1 M NH4HCO3. The peptides were extracted three times with 50% ACN, 0.1% TFA. The extracts were pooled and dried completely by centrifugal lyophilization.

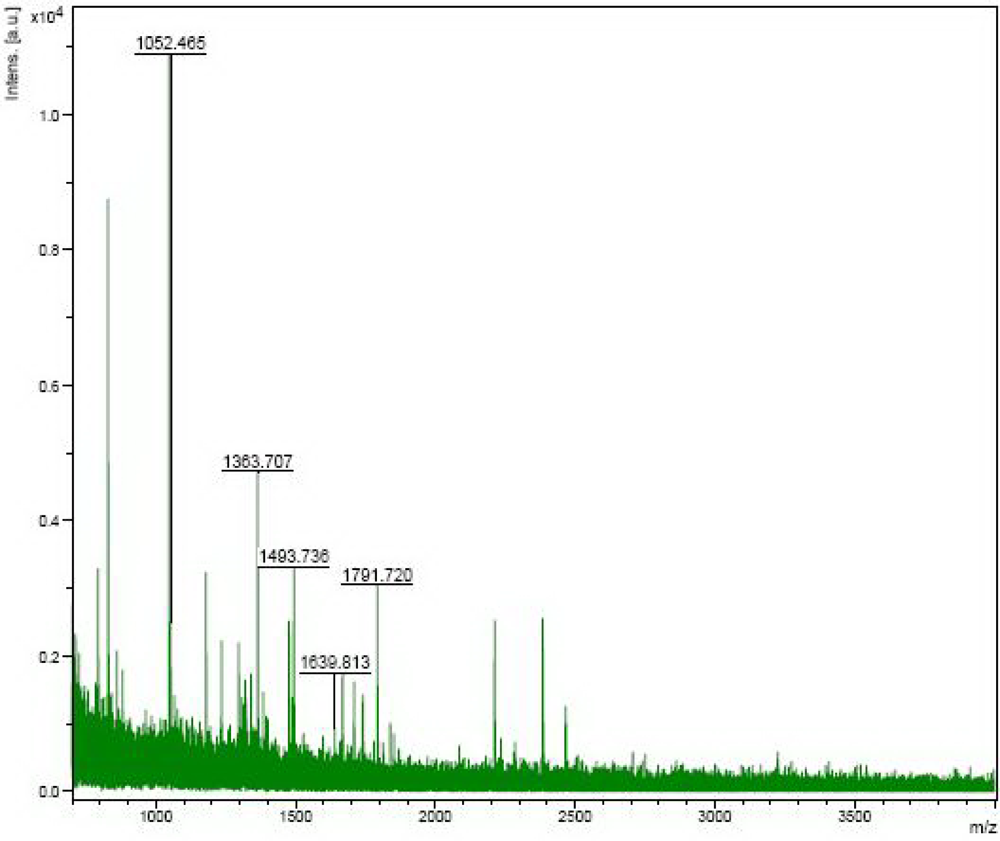
2.6. Protein Identification by MALDI-TOF

MALDI-TOF MS analysis of the samples was carried out on a mass spectrometer Autoflex (Bruker Daltonics) in a positive ion reflector mode. The ion acceleration voltage was 20 kV. Each spectrum was internally calibrated with the masses of two trypsin autolysis products. For PMF identification, the tryptic peptide mass maps were transferred with the MS BioToolsTM program (Bruker Daltonics) using MASCOT software (Matrix Science). Then the National Center for Biotechnology nonredundant (NCBInr) database was searched with human as the taxonomy. Up to one missed tryptic cleavage was considered and a mass accuracy of 100 ppm was used for all the tryptic-mass searches.

2.7. ELISA for HSP90

Human HSP90 ELISA kits (Adlitteram Diagnostic Laboratories) were used according to the manufacturer’s instructions to detect serum HSP90 levels. Briefly, 100 μL of a standard was dispensed into each of eight wells, and 100 μL of specimens, including 20 serum samples of HCC patients and 20 serum samples of normal controls, were dispensed into plate wells. After dispensing 50 μL of enzyme conjugate reagent into each well, the solutions were gently mixed for 15 s. Then, the plate was incubated at 37 °C for 60 min. After removal of the mixture from the incubator, the microtiter wells were rinsed with deionized water and emptied five times. Then, the wells were sharply stricken onto absorbent paper to remove residual water droplets. Subsequently, 50 μL of color A and color B Reagent was added to each well, and the solutions were incubated at 37 °C for 15 min. The reaction was stopped with the addition of 50 μL of stop solution into each well and gently mixed for 30 s. It is important that all the blue color changes completely to yellow in each well and that the optical density is read at 450 nm within 30 min in a microtiter plate reader.

3. Results

3.1. Differential Protein Expression in HCC Patients Included in the Study

The protein expression profiles in the serum of HCC and healthy controls were obtained by 2-DE. Gel images and representative 2-DE maps were unambiguously matched by the PD-Quest software, and displayed well-resolved and reproducible profiles for both HCC and normal healthy controls. Aprroximately 500–800 protein spots were detected by Coomassie brilliant blue staining in a single 2-DE gel. The quantity of each spot in a gel was normalized as a percentage of the total quantity of all spots in the gel. In comparison with 2-DE patterns, differentially expressed proteins were defined as statistically meaningful on the basis of 3.5-fold up-regulation and 3.5-fold down-regulation in HCC patients compared with healthy controls or more changes in expression intensity (P < 0.05). According to these crtiteria, 35 spots were selected and analyzed using MALDI-TOF-MS. A total of 12 proteins from the 35 spots were identified (Table 1). One of the proteins, HSP90, was found to show the most significant differences in expression between HCC (129.0 ± 4.583) and normal healthy controls (18.33 ± 1.453) (P < 0.0001). HSP90 was up-regulated more than 7-fold in the serum of HCC when compared with the normal healthy controls (Figure 1), and the representative map of mass spectrometry was shown in Figure 2. Redundancy of proteins that appeared in the database under different names and accession numbers was eliminated. If more than one protein was identified in one spot, the single protein member with the highest protein score (top rank) was singled out from the multiprotein family.

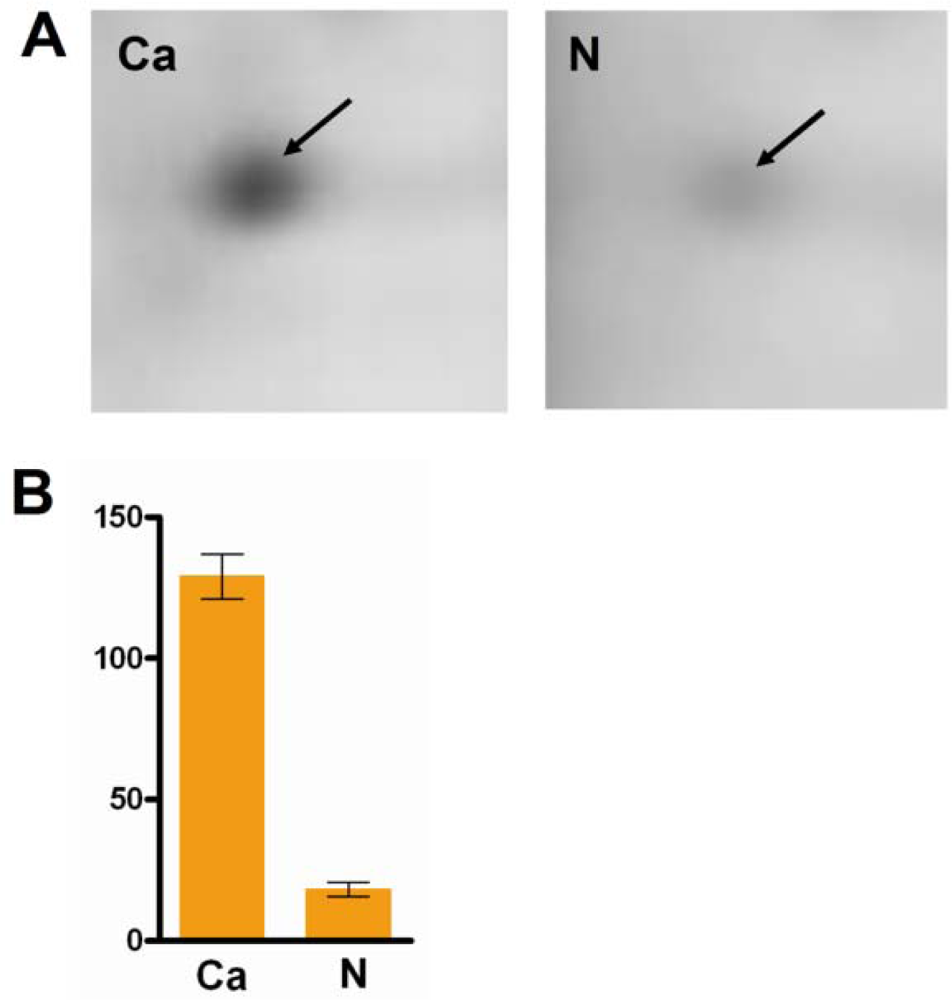
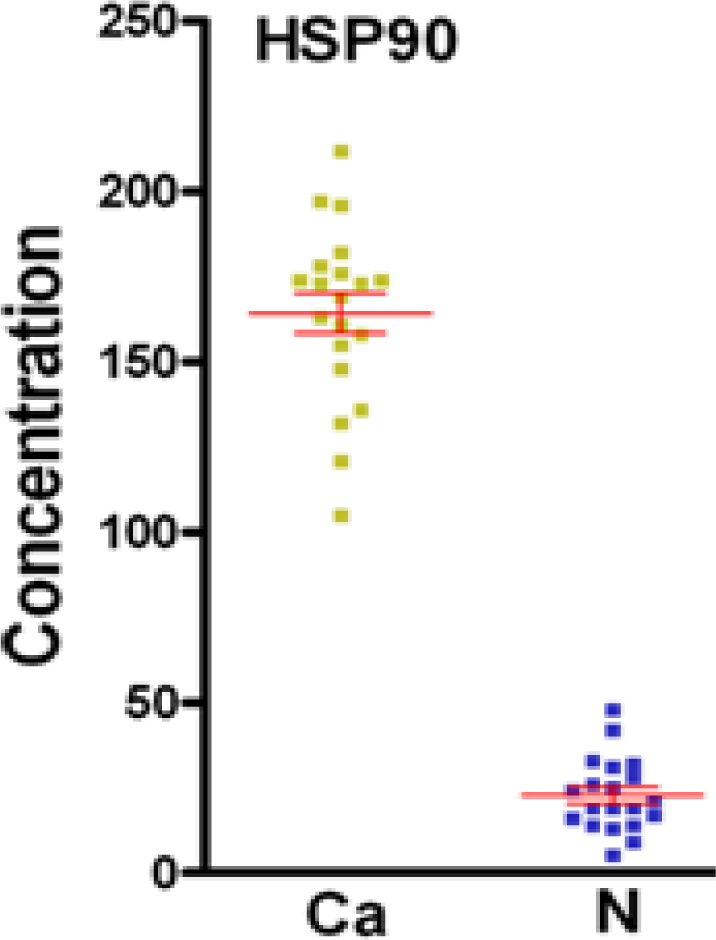
3.2. Validation of the Significantly Differentially-Expressed Protein HSP90 by ELISA

Using a commercially available ELISA kit for HSP90 protein, the serum levels of the HSP90 protein was quantified in all 40 individual serum samples (the 20 HCC patients and 20 normal healthy controls) by enzyme-linked immunosorbent assay in order to validate its potential as a candidate biomarker. As shown in Figure 3, the t-test showed that HSP90 in serum levels of HCC patients (164.7 ± 6.566 ng/mL) was significantly elevated when compared with the healthy controls (22.7 ± 2.728 ng/mL) (P < 0.0001), which correlates with the 2-DE results.

4. Conclusions

Biomarker searching and tumor profiling in HCC has been intensively carried out in recent years by using DNA microarray technology [3336]. In general, there have been many discrepancies in the deregulated genes reported by those publications, indicating a high variability in the results depending on the type of platform used (oligos, cDNA, etc.) and the type of samples. At the moment, there are no clear candidates for biomarkers of tumor progression or early stages in HCC derived from genomic studies. Because the functional molecules in cells are proteins, proteome analysis is believed to have an advantage over cDNA microarray for clinical use. Proteomics provides the complementary information to that obtained from mRNA profiling by microarray [37,38]. Proteomic researches could lead to the molecular characterization of cellular events associated with cancer progression, cellular signaling, and developmental stages [39,40]. Proteomic researches of clinical cancer samples have led to the identification of cancer-specific protein biomarkers, which could provide a basis for developing new methods for early diagnosis and early detection [41].
In the present study, we compared the global protein profiles between the serum of HCC patients and normal controls using a 2-DE and MALDI-TOF-MS approach. This approach makes no assumptions about known or unknown molecules, allowing the process to be independent of any presupposed hypotheses. A total of 12 differentially expressed proteins were identified, most of which were involved in the biological process, including cell transformation, protein folding, cell proliferation and apoptosis, and so on, which usually play important roles in the malignant initiation and development. Of the 12 identified proteins, seven proteins were up-regulated and five proteins were down-regulated in the serum of HCC. HSP90 shows one of the most significant changes between the serum of HCC and normal controls, and the mass spectrometric identification of HSP90 was also reliable. After showing significant elevation of HSP90 in the serum of HCC patients when compared with the serum of normal healthy controls, the result was validated by ELISA to test the levels of HSP90 in the serum of HCC patients and healthy controls. The results showed that the mean serum level of HSP90 in HCC patients was significant higher than in normal healthy controls, which correlated with the 2-DE results.
Hsp90 is an essential chaperon for function and integrity of a wide range of oncogenic client proteins [42]. Hsp90 is 2-fold to 10-fold overexpressed in tumors, compared with normal tissues [43]. With respect to HCC, Hsp90 overexpression has been described and is associated with a poor prognosis [44]. Recently, several studies have found that the molecular chaperone Hsp90 constitutes a relevant therapeutic target in various types of cancer [45,46]. Oncogenic transcription factors and signaling intermediates have been identified as Hsp90 client proteins, including hypoxia-inducible-factor-1(HIF-1), signal transducer and activator of transcription-3 (STAT3), intracellular kinases (Akt, Erk), and growth-factor receptors [47]. It has been demonstrated that HSP90 controls the folding and activity of numerous bona fide oncoproteins to which malignant cells become addicted, and hence it safeguards the dysregulated expression of these proteins and their mutational status [48]. Hsp90 up-regulation in combination with cyclin-dependent kinase 4 (CDK4) activity, has been predicted to contribute to HCC development [44]. Therefore, HSP90 inhibition is anticipated to surpass targeted therapies that exclusively attack one oncoprotein, the function of which might be compensated via collateral pathways [4547].
The finding of the current study suggested that HSP90 expression has potential clinical impact. However, the sample size in the current study is relatively small, indicating that the proteomic data need to be confirmed in a study employing a great number of patients and healthy controls in the future. Moreover, more patient-centered and much larger sample numbers are required. Such an approach is in concordance with the conclusions of the Worldwide Strategic Consensus Conference on Biomarker Research; that biomarker research efficiently translates any finds into reduced mortality and morbidity from disease [4951]. However, biomarkers are known to have the potential to dramatically alter options and strategies of diagnosis and treatment, and consequently a complex process with multiple steps of further analyses is necessary for translating our pilot proteomic observations into clinical applications in the future.

References and Notes

  1. Parkin, DM. Global cancer statistics in the year 2000. Lancet Oncol 2001, 2, 533–543. [Google Scholar]
  2. Cha, C; DeMatteo, RP; Blumgart, LH. Surgery and ablative therapy for hepatocellular carcinoma. J. Clin. Gastroenterol 2002, 35, S130–S137. [Google Scholar]
  3. Shariff, MI; Cox, IJ; Gomaa, AI; Khan, SA; Gedroyc, W; Taylor-Robinson, SD. Hepatocellular carcinoma: current trends in worldwide epidemiology, risk factors, diagnosis and therapeutics. Expert Rev. Gastroenterol Hepatol 2009, 3, 353–367. [Google Scholar]
  4. Müller, C. Hepatocellular carcinoma-rising incidence, changing therapeutic strategies. Wien Med. Wochenschr 2006, 156, 404–409. [Google Scholar]
  5. Mazzanti, R; Gramantieri, L; Bolondi, L. Hepatocellular carcinoma: Epidemiology and clinical aspects. Mol. Aspects Med 2008, 29, 130–143. [Google Scholar]
  6. Pandey, A; Mann, M. Proteomics to study genes and genomes. Nature 2000, 405, 837–846. [Google Scholar]
  7. Alessandro, R; Fontana, S; Kohn, E; De Leo, G. Proteomic strategies and their application in cancer research. Tumori 2005, 91, 447–455. [Google Scholar]
  8. Koomen, JM; Haura, EB; Bepler, G; Sutphen, R; Remily-Wood, ER; Benson, K; Hussein, M; Hazlehurst, LA; Yeatman, TJ; Hildreth, LT; Sellers, TA; Jacobsen, PB; Fenstermacher, DA; Dalton, WS. Proteomic contributions to personalized cancer care. Mol. Cell. Proteomics 2008, 7, 1780–1794. [Google Scholar]
  9. Peng, XQ; Wang, F; Geng, X; Zhang, WM. Current advances in tumor proteomics and candidate biomarkers for hepatic cancer. Expert Rev. Proteomics 2009, 6, 551–561. [Google Scholar]
  10. Petricoin, EF; Zoon, KC; Kohn, EC; Barrett, JC; Liotta, LA. Clinical proteomics: Translating benchside promise into bedside reality. Nat. Rev. Drug. Discov 2002, 1, 683–695. [Google Scholar]
  11. Li, Z; Zhao, X; Bai, S; Wang, Z; Chen, L; Wei, Y; Huang, C. Proteomics identification of cyclophilin a as a potential prognostic factor and therapeutic target in endometrial carcinoma. Mol. Cell. Proteomics 2008, 7, 1810–1823. [Google Scholar]
  12. Sagynaliev, E; Steinert, R; Nestler, G; Lippert, H; Knoch, M; Reymond, MA. Web-based data warehouse on gene expression in human colorectal cancer. Proteomics 2005, 5, 3066–3078. [Google Scholar]
  13. Rabilloud, T. Two-dimensional gel electrophoresis in proteomics: Old, old fashioned, but it still climbs up the mountains. Proteomics 2002, 2, 3–10. [Google Scholar]
  14. Mathivanan, S; Lim, JW; Tauro, BJ; Ji, H; Moritz, RL; Simpson, RJ. Proteomic analysis of A33-immunoaffinity-purified exosomes released from the human colon tumor cell line LIM1215 reveals a tissue-specific protein signature. Mol. Cell. Proteomics 2010, 9, 197–208. [Google Scholar]
  15. Schulz, DM; Böllner, C; Thomas, G; Atkinson, M; Esposito, I; Höfler, H; Aubele, M. Identification of differentially expressed proteins in triple-negative breast carcinomas using DIGE and mass spectrometry. J. Proteome Res 2009, 8, 3430–3438. [Google Scholar]
  16. Hongsachart, P; Huang-Liu, R; Sinchaikul, S; Pan, FM; Phutrakul, S; Chuang, YM; Yu, CJ; Chen, ST. Glycoproteomic analysis of WGA-bound glycoprotein biomarkers in sera from patients with lung adenocarcinoma. Electrophoresis 2009, 30, 1206–1220. [Google Scholar]
  17. Cho, HJ; Baek, KE; Park, SM; Kim, IK; Choi, YL; Cho, HJ; Nam, IK; Hwang, EM; Park, JY; Han, JY; Kang, SS; Kim, DC; Lee, WS; Lee, MN; Oh, GT; Kim, JW; Lee, CW; Yoo, J. RhoGDI2 expression is associated with tumor growth and malignant progression of gastric cancer. Clin. Cancer Res 2009, 15, 2612–2619. [Google Scholar]
  18. Vellaichamy, A; Sreekumar, A; Strahler, JR; Rajendiran, T; Yu, J; Varambally, S; Li, Y; Omenn, GS; Chinnaiyan, AM; Nesvizhskii, AI. Proteomic interrogation of androgen action in prostate cancer cells reveals roles of aminoacyl tRNA synthetases. PLoS One 2009, 4, e7075. [Google Scholar]
  19. Ono, M; Matsubara, J; Honda, K; Sakuma, T; Hashiguchi, T; Nose, H; Nakamori, S; Okusaka, T; Kosuge, T; Sata, N; Nagai, H; Ioka, T; Tanaka, S; Tsuchida, A; Aoki, T; Shimahara, M; Yasunami, Y; Itoi, T; Moriyasu, F; Negishi, A; Kuwabara, H; Shoji, A; Hirohashi, S; Yamada, T. Prolyl 4-hydroxylation of alpha-fibrinogen: A novel protein modification revealed by plasma proteomics. J. Biol. Chem 2009, 284, 29041–29049. [Google Scholar]
  20. Roessler, M; Rollinger, W; Mantovani-Endl, L; Hagmann, ML; Palme, S; Berndt, P; Engel, AM; Pfeffer, M; Karl, J; Bodenmüller, H; Rüschoff, J; Henkel, T; Rohr, G; Rossol, S; Rösch, W; Langen, H; Zolg, W; Tacke, M. Identification of PSME3 as a novel serum tumor marker for colorectal cancer by combining two-dimensional polyacrylamide gel electrophoresis with a strictly mass spectrometry-based approach for data analysis. Mol. Cell. Proteomics 2006, 5, 2092–2101. [Google Scholar]
  21. Sun, Y; Mi, W; Cai, J; Ying, W; Liu, F; Lu, H; Qiao, Y; Jia, W; Bi, X; Lu, N; Liu, S; Qian, X; Zhao, X. Quantitative proteomic signature of liver cancer cells: Tissue transglutaminase 2 could be a novel protein candidate of human hepatocellular carcinoma. J. Proteome Res 2008, 7, 3847–3859. [Google Scholar]
  22. Fujiyama, S; Tanaka, M; Maeda, S; Ashihara, H; Hirata, R; Tomita, K. Tumor markers in early diagnosis, follow-up and management of patients with hepatocellular carcinoma. Oncology 2002, 62, 57–63. [Google Scholar]
  23. Spangenberg, HC; Thimme, R; Blum, HE. Serum markers of hepatocellular carcinoma. Semin. Liver Dis 2006, 26, 385–390. [Google Scholar]
  24. Marrero, JA. Hepatocellular carcinoma. Curr. Opin. Gastroenterol 2003, 19, 243–249. [Google Scholar]
  25. Chromy, BA; Gonzales, AD; Perkins, J; Choi, MW; Corzett, MH; Chang, BC; Corzett, CH; McCutchen-Maloney, SL. Proteomic analysis of human serum by two-dimensional differential gel electrophoresis after depletion of high-abundant proteins. J. Proteome Res 2004, 3, 1120–1127. [Google Scholar]
  26. Corzett, TH; Fodor, IK; Choi, MW; Walsworth, VL; Chromy, BA; Turteltaub, KW; McCutchen-Maloney, SL. Statistical analysis of the experimental variation in the proteomic characterization of human plasma by two-dimensional difference gel electrophoresis. J. Proteome Res 2006, 5, 2611–2619. [Google Scholar]
  27. Hochstrasser, DF; Frutiger, S; Paquet, N; Bairoch, A; Ravier, F; Pasquali, C; Sanchez, JC; Tissot, JD; Bjellqvist, B; Vargas, R. Human liver protein map: A reference database established by microsequencing and gel comparison. Electrophoresis 1992, 13, 992–1001. [Google Scholar]
  28. Zimmermann-Ivol, CG; Burkhard, PR; Le Floch-Rohr, J; Allard, L; Hochstrasser, DF; Sanchez, JC. Fatty acid binding protein as a serum marker for the early diagnosis of stroke: A pilot study. Mol. Cell. Proteomics 2004, 3, 66–72. [Google Scholar]
  29. Görg, A; Obermaier, C; Boguth, G; Weiss, W. Recent developments in two-dimensional gel electrophoresis with immobilized pH gradients: Wide pH gradients up to pH 12, longer separation distances and simplified procedures. Electrophoresis 1999, 20, 712–717. [Google Scholar]
  30. Görg, A; Obermaier, C; Boguth, G; Harder, A; Scheibe, B; Wildgruber, R; Weiss, W. The current state of two-dimensional electrophoresis with immobilized pH gradients. Electrophoresis 2000, 21, 1037–1053. [Google Scholar]
  31. Stasyk, T; Morandell, S; Bakry, R; Feuerstein, I; Huck, CW; Stecher, G; Bonn, GK; Huber, LA. Quantitative detection of phosphoproteins by combination of two-dimensional difference gel electrophoresis and phosphospecific fluorescent staining. Electrophoresis 2005, 26, 2850–2854. [Google Scholar]
  32. Huang, HL; Stasyk, T; Morandell, S; Dieplinger, H; Falkensammer, G; Griesmacher, A; Mogg, M; Schreiber, M; Feuerstein, I; Huck, CW; Stecher, G; Bonn, GK; Huber, LA. Biomarker discovery in breast cancer serum using 2-D differential gel electrophoresis / MALDI-TOF/TOF and data validation by routine clinical assays. Electrophoresis 2006, 27, 1641–1650. [Google Scholar]
  33. Sung, WK; Lu, Y; Lee, CW; Zhang, D; Ronaghi, M; Lee, CG. Deregulated direct targets of the hepatitis B virus (HBV) protein, HBx, identified through chromatin immunoprecipitation and expression microarray profiling. J. Biol. Chem 2009, 284, 21941–21954. [Google Scholar]
  34. Kanda, M; Nomoto, S; Okamura, Y; Nishikawa, Y; Sugimoto, H; Kanazumi, N; Takeda, S; Nakao, A. Detection of metallothionein 1G as a methylated tumor suppressor gene in human hepatocellular carcinoma using a novel method of double combination array analysis. Int. J. Oncol 2009, 35, 4774–4783. [Google Scholar]
  35. Motallebipour, M; Enroth, S; Punga, T; Ameur, A; Koch, C; Dunham, I; Komorowski, J; Ericsson, J; Wadelius, C. Novel genes in cell cycle control and lipid metabolism with dynamically regulated binding sites for sterol regulatory element-binding protein 1 and RNA polymerase II in HepG2 cells detected by chromatin immunoprecipitation with microarray detection. FEBS J 2009, 276, 187818–187890. [Google Scholar]
  36. Chau, BN; Diaz, RL; Saunders, MA; Cheng, C; Chang, AN; Warrener, P; Bradshaw, J; Linsley, PS; Cleary, MA. Identification of SULF2 as a novel transcriptional target of p53 by use of integrated genomic analyses. Cancer Res 2009, 69, 1368–1374. [Google Scholar]
  37. Wilkins, MR; Sanchez, JC; Gooley, AA; Appel, RD; Humphery-Smith, I; Hochstrasser, DF; Williams, KL. Progress with proteome projects: Why all proteins expressed by a genome should be identified and how to do it. Biotechnol. Genet. Eng. Rev 1996, 13, 19–50. [Google Scholar]
  38. Anderson, L; Seilhamer, J. A comparison of selected mRNA and protein abundances in human liver. Electrophoresis 1997, 18, 533–537. [Google Scholar]
  39. Hanash, SM. Biomedical applications of two-dimensional electrophoresis using immobilized pH gradients: Current status. Electrophoresis 2000, 21, 1202–1209. [Google Scholar]
  40. Reymond, MA; Sanchez, JC; Hughes, GJ; Gunther, K; Riese, J; Tortola, S; Peinado, MA; Kirchner, T; Hohenberger, W; Hochstrasser, DF; Kockerling, F. Standardized characterization of gene expression in human colorectal epithelium by two-dimensional electrophoresis. Electrophoresis 1997, 18, 2842–2848. [Google Scholar]
  41. Zhou, G; Li, H; DeCamp, D; Chen, S; Shu, H; Gong, Y; Flaig, M; Gillespie, JW; Hu, N; Taylor, PR; Emmert-Buck, MR; Liotta, LA; Petricoin, EF, III; Zhao, Y. 2D differential in-gel electrophoresis for the identification of esophageal scans cell cancer-specific protein markers. Mol. Cell. Proteomics 2002, 1, 117–124. [Google Scholar]
  42. Isaacs, JS; Xu, W; Neckers, L. Heat shock protein 90 as a molecular target for cancer therapeutics. Cancer Cell 2003, 3, 213–217. [Google Scholar]
  43. Gooljarsingh, LT; Fernandes, C; Yan, K; Zhang, H; Grooms, M; Johanson, K; Sinnamon, RH; Kirkpatrick, RB; Kerrigan, J; Lewis, T; Arnone, M; King, AJ; Lai, Z; Copeland, RA; Tummino, PJ. A biochemical rationale for the anticancer effects of Hsp90 inhibitors: Slow, tight binding inhibition by geldanamycin and its analogues. Proc. Natl. Acad. Sci. USA 2006, 103, 7625–7630. [Google Scholar]
  44. Pascale, RM; Simile, MM; Calvisi, DF; Frau, M; Muroni, MR; Seddaiu, MA; Daino, L; Muntoni, MD; De Miglio, MR; Thorgeirsson, SS; Feo, F. Role of HSP90, CDC37, and CRM1 as modulators of P16(INK4A) activity in rat liver carcinogenesis and human liver cancer. Hepatology 2005, 42, 1310–1319. [Google Scholar]
  45. Lang, SA; Moser, C; Fichnter-Feigl, S; Schachtschneider, P; Hellerbrand, C; Schmitz, V; Schlitt, HJ; Geissler, EK; Stoeltzing, O. Targeting heat-shock protein 90 improves efficacy of rapamycin in a model of hepatocellular carcinoma in mice. Hepatology 2009, 49, 523–532. [Google Scholar]
  46. Breinig, M; Caldas-Lopes, E; Goeppert, B; Malz, M; Rieker, R; Bergmann, F; Schirmacher, P; Mayer, M; Chiosis, G; Kern, MA. Targeting heat shock protein 90 with non-quinone inhibitors: A novel chemotherapeutic approach in human hepatocellular carcinoma. Hepatology 2009, 50, 102–112. [Google Scholar]
  47. Zhang, H; Burrows, F. Targeting multiple signal transduction pathways through inhibition of Hsp90. J. Mol. Med 2004, 82, 488–499. [Google Scholar]
  48. Pearl, LH; Prodromou, C; Workman, P. The Hsp90 molecular chaperone: An open and shut case for treatment. Biochem. J 2008, 410, 439–453. [Google Scholar]
  49. Ma, Y; Peng, J; Huang, L; Liu, W; Zhang, P; Qin, H. Searching for serum tumor markers for colorectal cancer using a 2-D DIGE approach. Electrophoresis 2009, 30, 2591–1599. [Google Scholar]
  50. Hinestrosa, MC; Dickersin, K; Klein, P; Mayer, M; Noss, K; Slamon, D; Sledge, G; Visco, FM. Shaping the future of biomarker research in breast cancer to ensure clinical relevance. Nat. Rev. Cancer 2007, 7, 309–315. [Google Scholar]
  51. Ma, Y; Peng, J; Liu, W; Zhang, P; Huang, L; Gao, B; Shen, T; Zhou, Y; Chen, H; Chu, Z; Zhang, M; Qin, H. Proteomics identification of desmin as a potential oncofetal diagnostic and prognostic biomarker in colorectal cancer. Mol. Cell. Proteomics 2009, 8, 1878–1890. [Google Scholar]
Figure 1. Cropped 2-DE gel images of HSP90 in the serum of hepatocellular carcinoma patients and normal healthy controls. HSP90 was shown the most significant differences in expression between HCC (129.0 ± 4.583) and normal healthy controls (18.33 ± 1.453) (P < 0.0001). It was up-regulated more than 7-fold in the serum of HCC when compared with the normal healthy controls. Ca, carcinoma; N, normal healthy controls.
Ijms 11 01423f1
Figure 2. Results of HSP90 as the representative protein identified using MALDI-TOF-MS.
Ijms 11 01423f2
Figure 3. Levels of the potential biomarker HSP90 in the serum of 20 HCC patients and 20 normal healthy controls groups as measured by ELISA assay. The t-test showed that HSP 90 in serum levels of HCC patients (164.7 ± 6.566 ng/mL) were significantly elevated when compared with the healthy controls (22.7 ± 2.728 ng/mL) (P < 0.0001).
Ijms 11 01423f3
Table 1. Differentially expressed proteins identified by MALDI-TOF PMF in the serum of hepatocellular carcinoma and normal healthy controls.
Spot NumberProtein nameMW (kDa)pIFold change (Ca/N)P value (t test)
1S-adenosylmethionine synthetase isoform type-143.65.864.210.005
2Glycine N-methyltransferase32.66.584.560.007
3Haptoglobin precursor38.96.425.100.004
4Serum amyloid P-component precursor25.46.103.840.018
5Glyceraldehyde-3-phosphate dehydrogenase35.98.585.730.003
6Heat shock protein 9083.14.977.04<0.0001
7Annexin V35.84.983.890.012
8Carbonic anhydrase I28.96.59−6.730.002
9Beta-galactoside-binding lectin15.15.34−6.09<0.0001
10Vitamin D-binding protein52.85.20−5.240.004
11Apolipoprotein A-I28.15.30−3.590.017
12Annexin 436.15.80−4.320.006

