Modelling Contaminant Formation during Thermal Processing of Sea Buckthorn Purée

Abstract
:1. Introduction
2. Results
2.1. Determination of ACR and HMF Precursors and Antioxidant Compounds
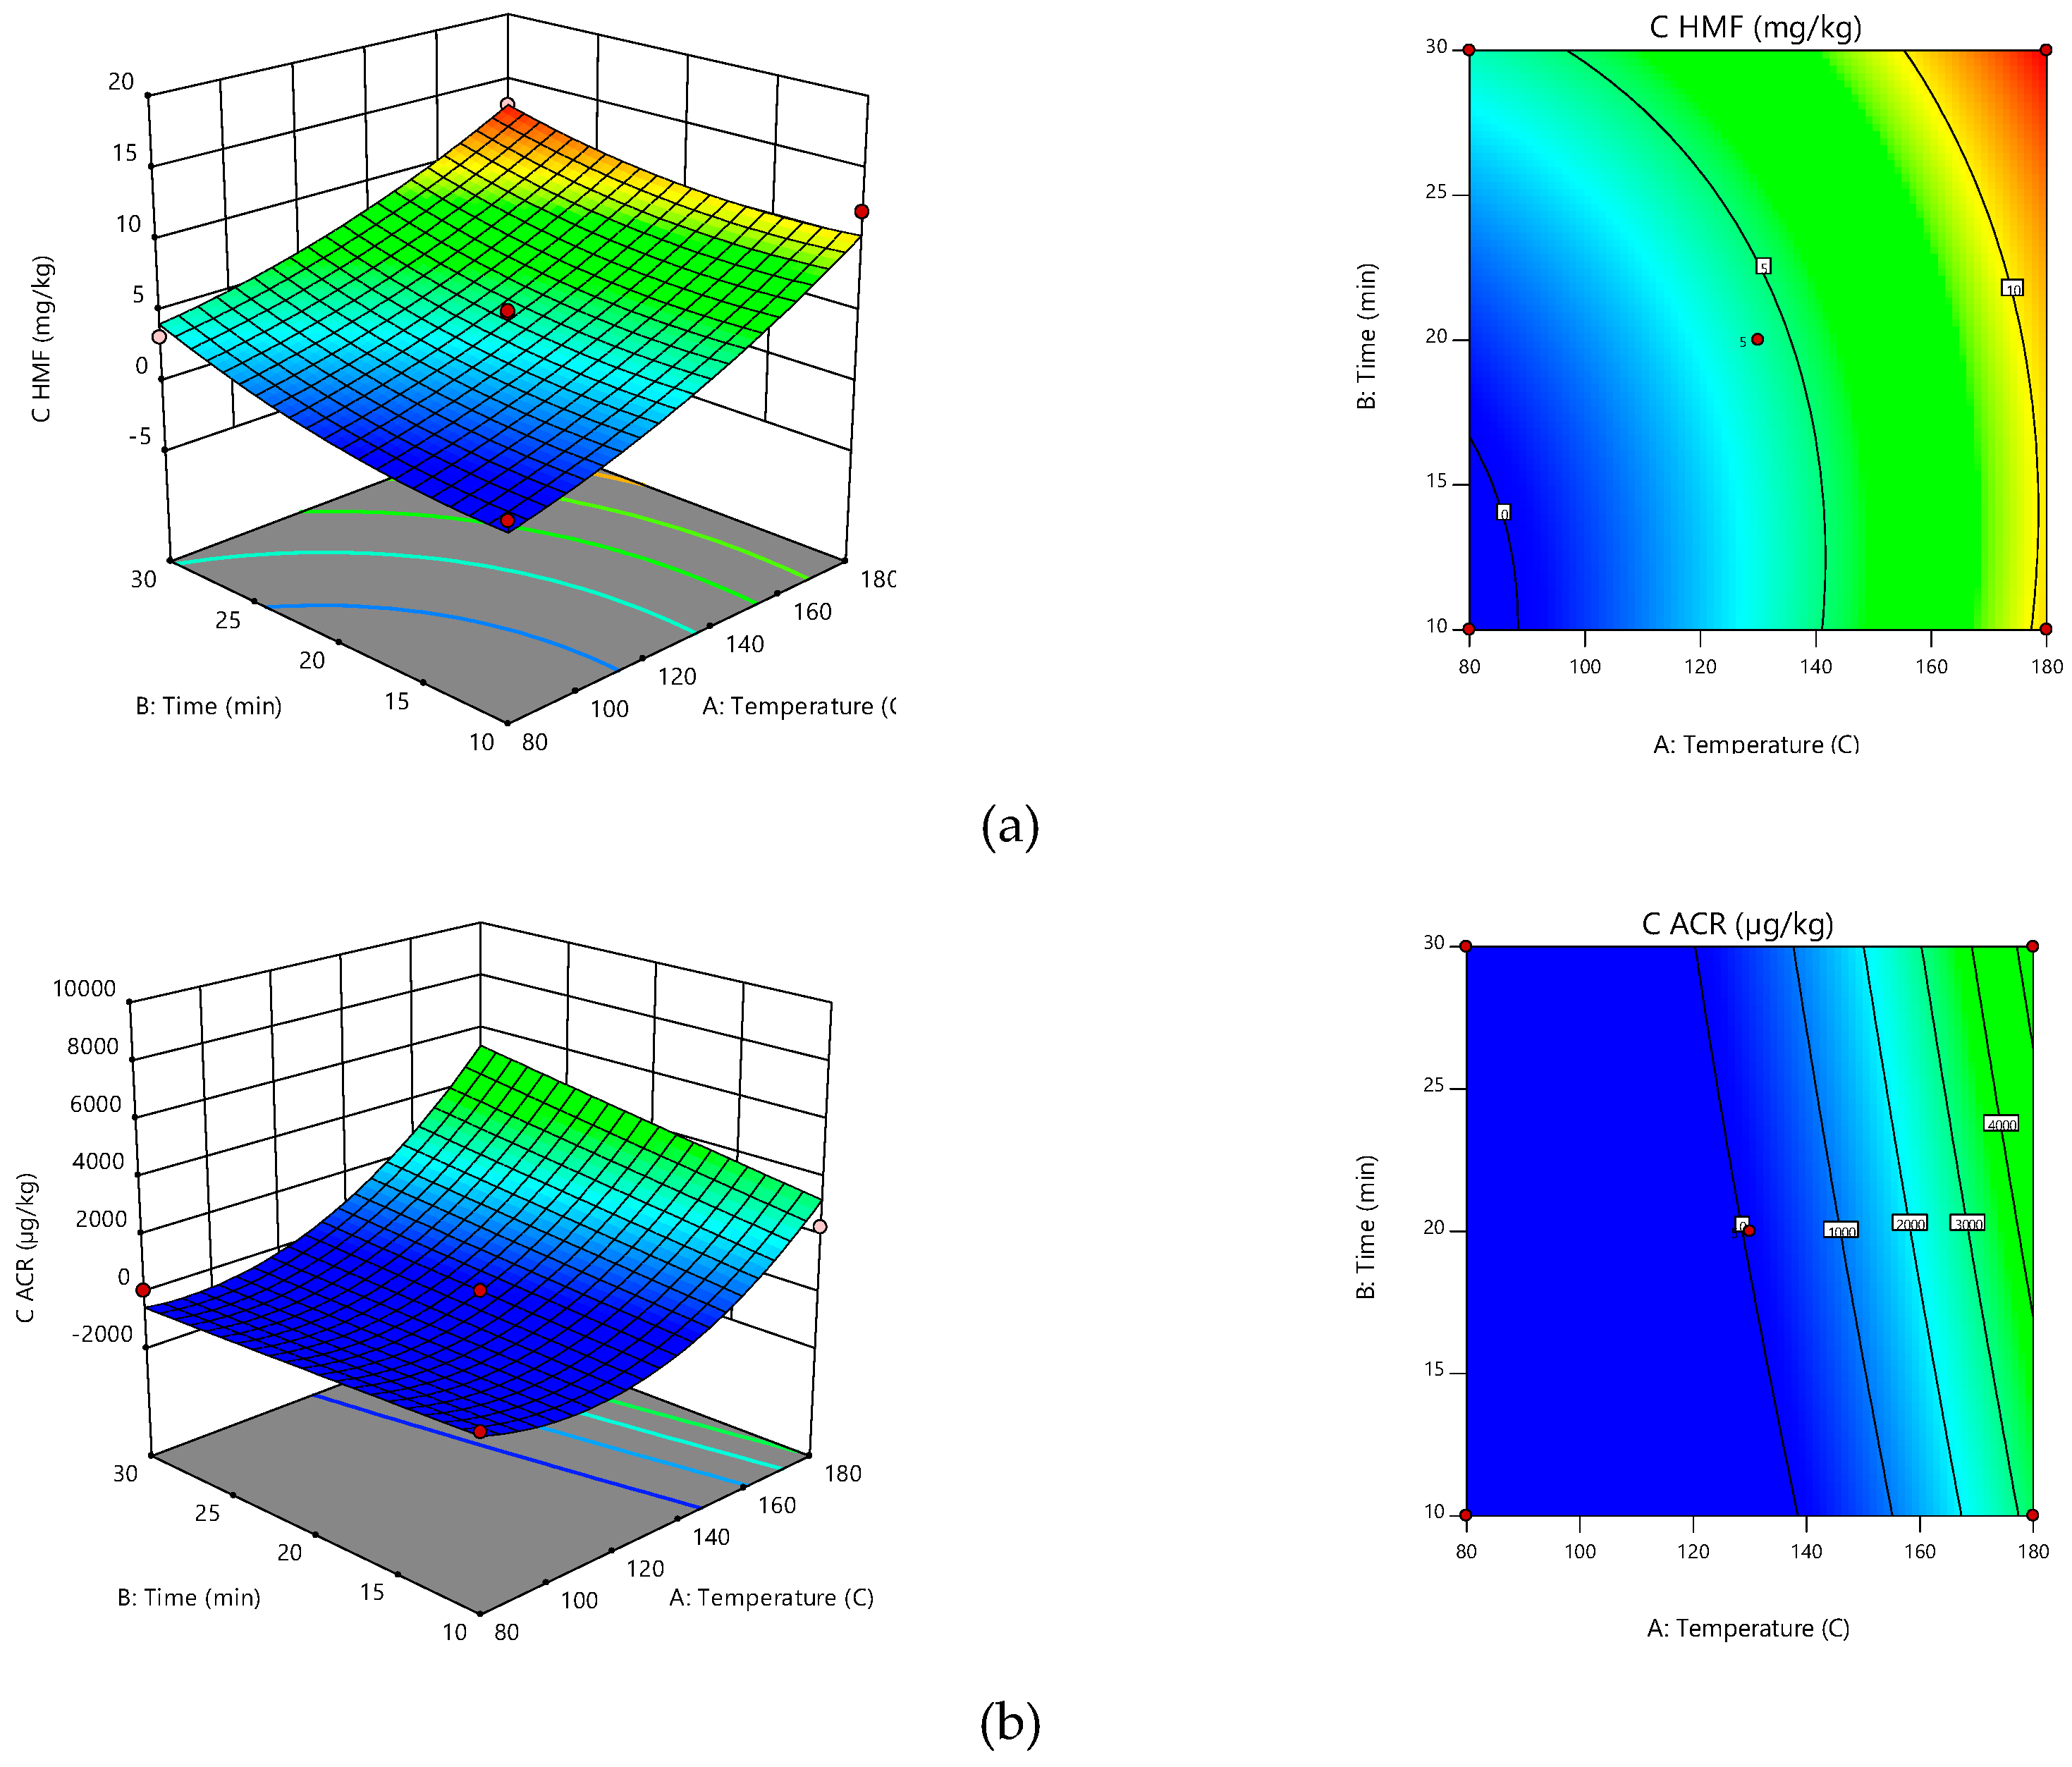
2.2. Contaminants (ACR and HMF) Formation
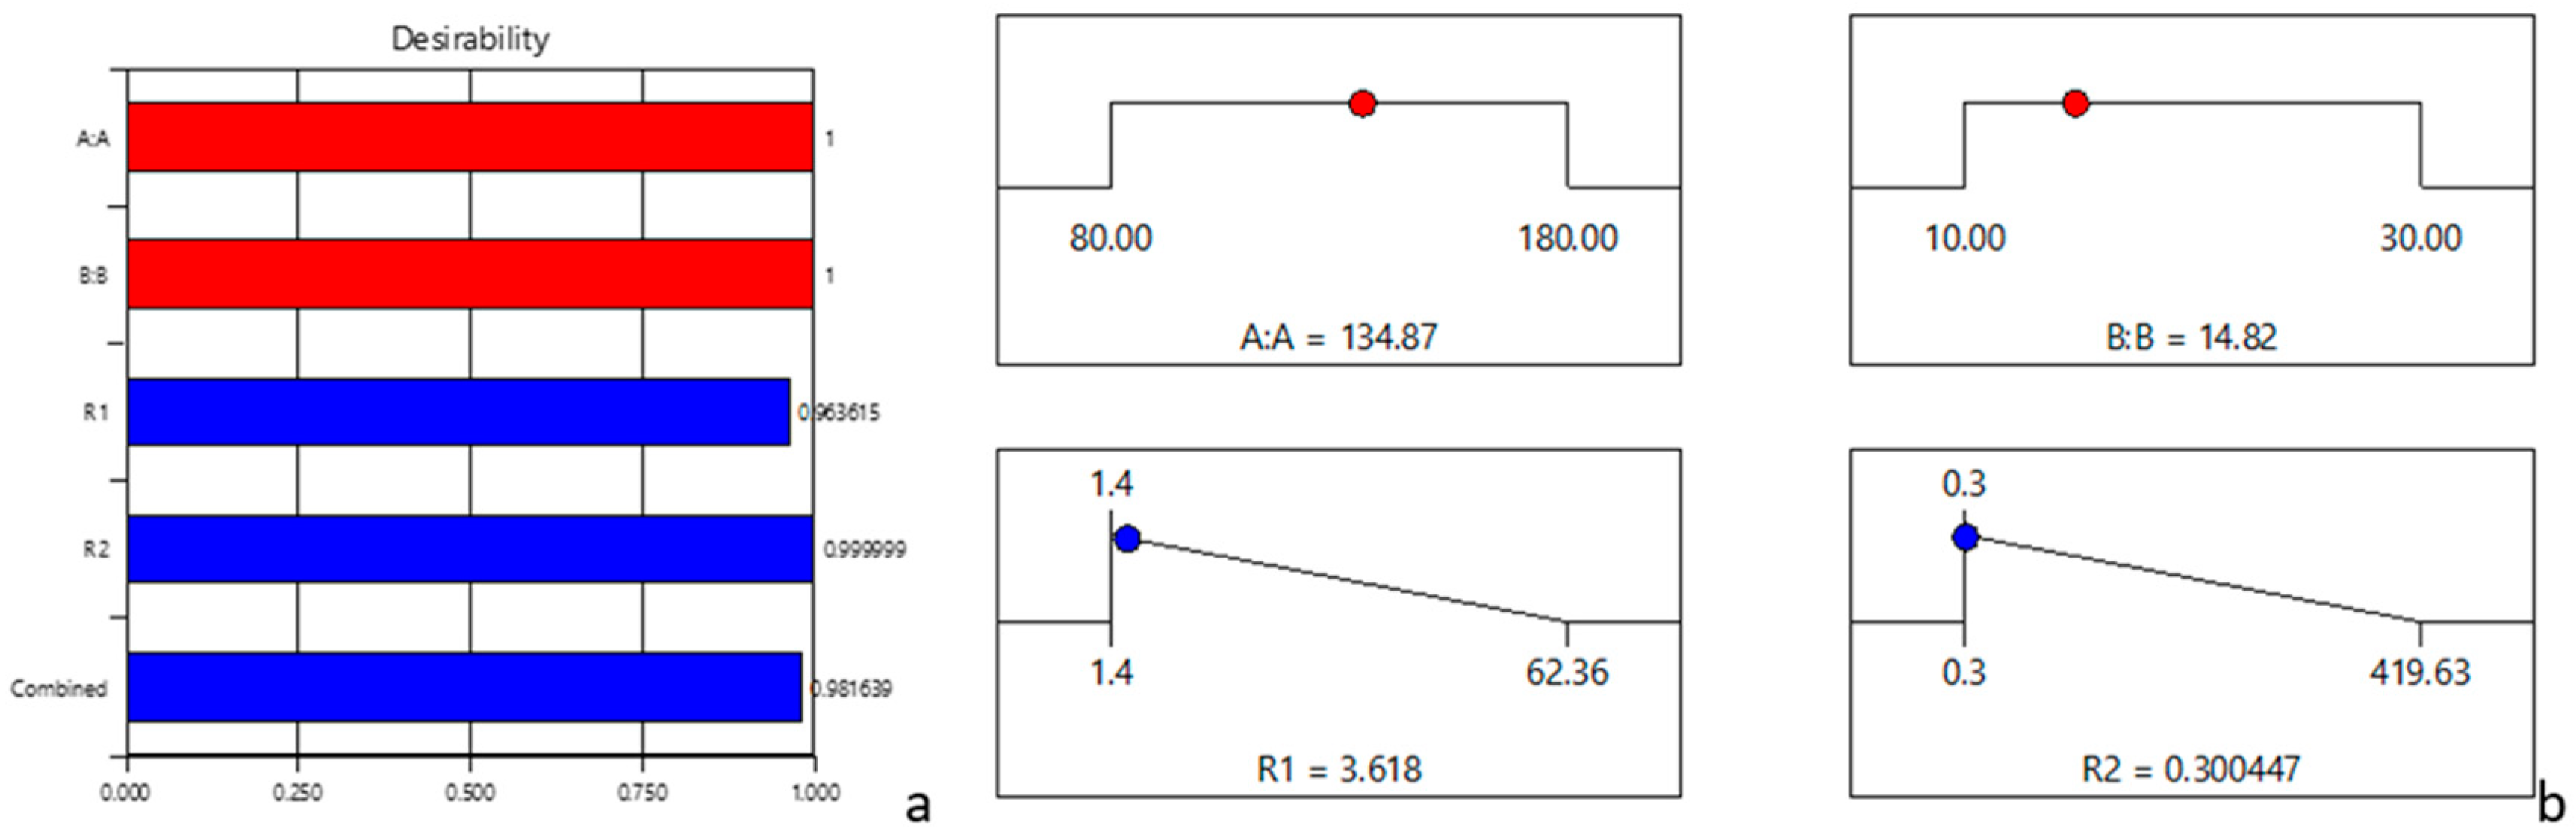
2.3. Global Optimization
3. Discussion
4. Materials and Methods
4.1. Reagents and Chemicals
4.2. Samples
4.3. Determination of Total Phenolic (TPC) and Antioxidant Activity (AA)
4.4. Acrylamide and HMF Precursors
4.5. Acrylamide and HMF Content
4.6. Thermal Treatment and Experimental Design
4.7. Statistical analysis
5. Conclusions
Author Contributions
Funding
Acknowledgments
Conflicts of Interest
References
- Upadhyay, N.K.; Kumar, M.Y.; Gupta, A. Antioxidant, cytoprotective and antibacterial effects of Sea buckthorn (Hippophae rhamnoides L.) leaves. Food Chem. Toxicol. 2010, 48, 3443–3448. [Google Scholar] [CrossRef]
- Beveridge, T.; Li, T.S.; Oomah, B.D.; Smith, A. Sea buckthorn products: Manufacture and composition. J. Agric. Food Chem. 1999, 47, 3480–3488. [Google Scholar] [CrossRef]
- Eccleston, C.; Baoru, Y.; Tahvonen, R.; Kallio, H.; Rimbach, G.H.; Minihane, A.M. Effects of an antioxidant-rich juice (sea buckthorn) on risk factors for coronary heart disease in humans. J. Nutr. Biochem. 2002, 13, 346–354. [Google Scholar] [CrossRef]
- Chawla, R.; Arora, R.; Singh, S.; Sagar, R.K.; Sharma, R.K.; Kumar, R.; Sharma, A.; Gupta, M.L.; Singh, S.; Prasad, J.; et al. Radioprotective and antioxidant activity of fractionated extracts of berries of Hippophae rhamnoides. J. Med. Food 2007, 10, 101–109. [Google Scholar] [CrossRef] [PubMed]
- Aslanova, D.; Bakkalbasi, E.; Artik, N. Effect of storage on 5-hydroxymethylfurfural (HMF) formation and color change in jams. Int. J. Food Prop. 2010, 13, 904–912. [Google Scholar] [CrossRef]
- Bal, L.M.; Meda, V.; Naik, S.N.; Satya, S. Sea buckthorn berries: A potential source of valuable nutrients for nutraceuticals and cosmoceuticals. Food Res. Int. 2011, 44, 1718–1727. [Google Scholar] [CrossRef]
- Tosun, I.; Ustun, N.S. Nonenzymic browning during storage of white hard grape pekmez (Zile pekmezi). Food Chem. 2003, 80, 441–443. [Google Scholar] [CrossRef]
- Martins, S.I.; Jongen, W.M.; Van Boekel, M.A. A review of Maillard reaction in food and implications to kinetic modelling. Trends Food Sci. Technol. 2000, 11, 364–373. [Google Scholar] [CrossRef]
- Mottram, D.S.; Wedzicha, B.L.; Dodson, A.T. Food chemistry: Acrylamide is formed in the Maillard reaction. Nature 2002, 419, 448. [Google Scholar] [CrossRef] [PubMed]
- Stadler, R.H.; Blank, I.; Varga, N.; Robert, F.; Hau, J.; Guy, P.A.; Robert, M.C.; Riediker, S. Food chemistry: Acrylamide from Maillard reaction products. Nature 2002, 419, 449. [Google Scholar] [CrossRef] [PubMed]
- Becalski, A.; Lau, B.P.Y.; Lewis, D.; Seaman, S.W. Acrylamide in foods: Occurrence, sources, and modeling. J. Agric. Food Chem. 2003, 51, 802–808. [Google Scholar] [CrossRef]
- Krishnakumar, T.; Visvanathan, R. Acrylamide in food products: A review. Int. J. Food Process. Techno. 2014, 5, 1. [Google Scholar]
- Claus, A.; Carle, R.; Schieber, A. Acrylamide in cereal products: A review. J. Cereal Sci. 2008, 47, 118–133. [Google Scholar] [CrossRef]
- Keramat, J.; LeBail, A.; Prost, C.; Jafari, M. Acrylamide in baking products: A review article. Food Bioprocess Tech. 2011, 4, 530–543. [Google Scholar] [CrossRef]
- Rada-Mendoza, M.; Olano, A.; Villamiel, M. Determination of hydroxymethylfurfural in commercial jams and in fruit-based infant foods. Food Chem. 2002, 79, 513–516. [Google Scholar] [CrossRef]
- Constantin, O.E.; Râpeanu, G.; Kukurová, K.; Turturică, M.; Dubová, Z.; Tobolková, B.; Daško, L.; Ciesarová, Z.; Croitoru, C. Antioxidative Capacity of and contaminant concentrations in processed plum products consumed in Romania. J. Food Prot. 2018, 81, 1313–1320. [Google Scholar] [CrossRef]
- Fohgelberg, P.; Rosén, J.; Hellenäs, K.E.; Abramsson-Zetterberg, L. The acrylamide intake via some common baby food for children in Sweden during their first year of life—An improved method for analysis of acrylamide. Food Chem. Toxicol. 2005, 43, 951–959. [Google Scholar] [CrossRef]
- Mojska, H.; Gielecińska, I.; Stoś, K. Determination of acrylamide level in commercial baby foods and an assessment of infant dietary exposure. Food Chem. Toxicol. 2012, 50, 2722–2728. [Google Scholar] [CrossRef]
- De Paola, E.L.; Montevecchi, G.; Masino, F.; Garbini, D.; Barbanera, M.; Antonelli, A. Determination of acrylamide in dried fruits and edible seeds using QuEChERS extraction and LC separation with MS detection. Food Chem. 2017, 217, 191–195. [Google Scholar] [CrossRef]
- Andrzejewski, D.; Roach, J.A.; Gay, M.L.; Musser, S.M. Analysis of coffee for the presence of acrylamide by LC-MS/MS. J. Agric. Food Chem. 2004, 52, 1996–2002. [Google Scholar] [CrossRef] [PubMed]
- Bertuzzi, T.; Rastelli, S.; Mulazzi, A.; Pietri, A. Survey on acrylamide in roasted coffee and barley and in potato crisps sold in Italy by a LC–MS/MS method. Food Addit. Contam. Part B. 2017, 10, 292–299. [Google Scholar] [CrossRef] [PubMed]
- Shapla, U.M.; Solayman, M.; Alam, N.; Khalil, M.I.; Gan, S.H. 5-Hydroxymethylfurfural (HMF) levels in honey and other food products: Effects on bees and human health. Chem. Cent. J. 2018, 12, 35. [Google Scholar] [CrossRef]
- Simsek, A.; Poyrazoglu, E.S.; Karacan, S.; Velioglu, Y.S. Response surface methodological study on HMF and fluorescent accumulation in red and white grape juices and concentrates. Food Chem. 2007, 101, 987–994. [Google Scholar] [CrossRef]
- Murkovic, M.; Pichler, N. Analysis of 5-hydroxymethylfurfual in coffee, dried fruits and urine. Mol. Nutr. Food Res. 2006, 50, 842–846. [Google Scholar] [CrossRef] [PubMed]
- Kowalski, S.; Lukasiewicz, M.; Duda-Chodak, A.; Zięć, G. 5-Hydroxymethyl-2-Furfural (HMF)—Heat-induced formation, occurrence in food and biotransformation—A Review. Pol. J. Food Nutr. Sci. 2013, 63, 207–225. [Google Scholar]
- Subramanian, R.; Umesh Hebbar, H.; Rastogi, N.K. Processing of honey: A review. Int. J. Food Prop. 2007, 10, 127–143. [Google Scholar]
- Yaylayan, V.A.; Wnorowski, A.; Perez Locas, C. Why asparagine needs carbohydrates to generate acrylamide. J. Agric. Food Chem. 2003, 51, 1753–1757. [Google Scholar] [CrossRef] [PubMed]
- Yu, M.; Ou, S.; Liumengzi, D.; Huang, C.; Zhang, G. Effect of ten amino acids on elimination of acrylamide in a model reaction system. Afr. J. Food Sci. 2013, 7, 329–333. [Google Scholar] [CrossRef]
- Koutsidis, G.; Simons, S.P.; Thong, Y.H.; Haldoupis, Y.; Mojica-Lazaro, J.; Wedzicha, B.L.; Mottram, D.S. Investigations on the effect of amino acids on acrylamide, pyrazines, and Michael addition products in model systems. J. Agric. Food Chem. 2009, 57, 9011–9015. [Google Scholar] [CrossRef] [PubMed]
- Tiitinen, K.M.; Hakala, M.A.; Kallio, H.P. Quality components of sea buckthorn (Hippophae rhamnoides) varieties. J. Agric. Food Chem. 2005, 53, 1692–1699. [Google Scholar] [CrossRef]
- Korekar, G.; Dolkar, P.; Singh, H.; Srivastava, R.B.; Stobdan, T. Variability and the genotypic effect on antioxidant activity, total phenolics, carotenoids and ascorbic acid content in seventeen natural population of Sea buckthorn (Hippophae rhamnoides L.) from trans-Himalaya. LWT—Food Sci. Technol. 2014, 55, 157–162. [Google Scholar] [CrossRef]
- Kumar, Y.M.S.; Dutta, R.; Prasad, D.; Misra, K. Subcritical water extraction of antioxidant compounds from sea buckthorn (Hippophae rhamnoides) leaves for the comparative evaluation of antioxidant activity. Food Chem. 2011, 127, 1309–1316. [Google Scholar] [CrossRef] [PubMed]
- Zhang, Y.; Zhang, Y. Study on reduction of acrylamide in fried bread sticks by addition of antioxidant of bamboo leaves and extract of green tea. Asia Pac. J. Clin. Nutr. 2007, 16, 131–136. [Google Scholar] [PubMed]
- Zhang, Y.; Zhang, Y. Effect of natural antioxidants on kinetic behavior of acrylamide formation and elimination in low-moisture asparagine–glucose model system. J. Food Eng. 2008, 85, 105–115. [Google Scholar] [CrossRef]
- Zhu, F.; Cai, Y.Z.; Ke, J.; Corke, H. Evaluation of the effect of plant extracts and phenolic compounds on reduction of acrylamide in an asparagine/glucose model system by RP-HPLC-DAD. J. Sci. Food Agric. 2009, 89, 1674–1681. [Google Scholar] [CrossRef]
- Liu, Y.; Wang, P.; Chen, F.; Yuan, Y.; Zhu, Y.; Yan, H.; Hu, X. Role of plant polyphenols in acrylamide formation and elimination. Food Chem. 2015, 186, 46–53. [Google Scholar] [CrossRef] [PubMed]
- Rannou, C.; Laroque, D.; Renault, E.; Prost, C.; Sérot, T. Mitigation strategies of acrylamide, furans, heterocyclic amines and browning during the Maillard reaction in foods. Food Res. Int. 2016, 90, 154–176. [Google Scholar] [CrossRef]
- Ciesarová, Z.; Kiss, E.; Boegl, P. Impact of L-asparaginase on acrylamide content in potato products. J. Food Nutr. Res. 2006, 45, 141–146. [Google Scholar]
- Ciesarova, Z.; Kukurova, K.; Bednáriková, A.; Marková, L.; Baxa, S. Improvement of cereal product safety by enzymatic way of acrylamide mitigation. Czech J. Food Sci. 2009, 27, S96–S98. [Google Scholar] [CrossRef]
- Bastos, D.M.; Monaro, É.; Siguemoto, É.; Séfora, M. Maillard reaction products in processed food: Pros and cons. In Food Industrial Processes-Methods and Equipment; Valdez, B., Ed.; IntechOpen: London, UK, 2012; pp. 281–300. [Google Scholar]
- Zyzak, D.V.; Sanders, R.A.; Stojanovic, M.; Tallmadge, D.H.; Eberhart, B.L.; Ewald, D.K.; Gruber, D.C.; Morsch, T.R.; Strothers, M.A.; Rizzi, G.P.; et al. Acrylamide formation mechanism in heated foods. J. Agric. Food Chem. 2003, 51, 4782–4787. [Google Scholar] [CrossRef]
- Daniali, G.; Jinap, S.; Hanifah, N.L.; Hajeb, P. The effect of maturity stages of banana on the formation of acrylamide in banana fritters. Food Control. 2013, 32, 386–391. [Google Scholar] [CrossRef]
- Amrein, T.M.; Bachmann, S.; Noti, A.; Biedermann, M.; Barbosa, M.F.; Biedermann-Brem, S.; Grob, K.; Keiser, A.; Realini, P.; Escher, F.; et al. Potential of acrylamide formation, sugars, and free asparagine in potatoes: A comparison of cultivars and farming systems. J. Agric. Food Chem. 2003, 51, 5556–5560. [Google Scholar] [CrossRef] [PubMed]
- Tobolková, B.; Durec, J.; Belajová, E.; Mihalíková, M.; Polovka, M.; Suhaj, M.; Daško, Ľ.; Šimko, P. Effect of light conditions on physico-chemical properties of pineapple juice with addition of small pineapple pieces during storage. J. Food Nutr. Res. 2013, 52, 181–190. [Google Scholar]
- Piva, A.; Di Mattia, C.; Neri, L.; Dimitri, G.; Chiarini, M.; Sacchetti, G. Heat-induced chemical, physical and functional changes during grape must cooking. Food Chem. 2008, 106, 1057–1065. [Google Scholar] [CrossRef]
- Corma, A.; Iborra, S.; Velty, A. Chemical routes for the transformation of biomass into chemicals. Chem. Rev. 2007, 107, 2411–2502. [Google Scholar] [CrossRef] [PubMed]
- Kavousi, P.; Mirhosseini, H.; Ghazali, H.; Ariffin, A.A. Formation and reduction of 5-hydroxymethylfurfural at frying temperature in model system as a function of amino acid and sugar composition. Food Chem. 2015, 182, 164–170. [Google Scholar] [CrossRef]
- Lee, H.S.; Nagy, S. Relative reactivities of sugars in the formation of 5-hydroxymethylfurfural in sugar-catalyst model systems. J. Food Process Preserv. 1990, 14, 171–178. [Google Scholar] [CrossRef]
- Zhang, Z.; Zou, Y.; Wu, T.; Huang, C.; Pei, K.; Zhang, G.; Lin, X.; Bai, W.; Ou, S. Chlorogenic acid increased 5-hydroxymethylfurfural formation when heating fructose alone or with aspartic acid at two pH levels. Food Chem. 2016, 190, 832–835. [Google Scholar] [CrossRef] [PubMed]
- Constantin, O.E.; Skrt, M.; Poklar Ulrih, N.; Râpeanu, G. Anthocyanins profile, total phenolics and antioxidant activity of two Romanian red grape varieties: Fetească neagră and Băbească neagră (Vitis vinifera). Chem. Pap. 2015, 69, 1573–1581. [Google Scholar] [CrossRef]
- AOAC. Official Methods of Analysis of the AOAC international, 16th ed.; Method 970.12; Association of Official Analytical Chemists International: Washington, DC, USA, 1995. [Google Scholar]
- Constantin, O.E.; Kukurová, K.; Neagu, C.; Bednáriková, A.; Ciesarová, Z.; Râpeanu, G. Modelling of acrylamide formation in thermally treated red bell peppers (Capsicum annuum L.). Eur. Food Res. Technol. 2014, 238, 149–156. [Google Scholar] [CrossRef]
Sample Availability: Samples of the compounds (ACR, HMF) are not available from the authors |


| Precursors | ||||
|---|---|---|---|---|
| Amino acids, mg/kg DW | Hyp | ND | Met | 0.12 ± 0.00 |
| Asp | 5.25 ± 0.02 | Tyr | ND | |
| Pro | 0.45 ± 0.02 | Ile | 0.61 ± 0.02 | |
| Asn | 194.55 ± 5.00 | Leu | 0.61 ± 0.02 | |
| Ser | 2.34 ± 0.08 | Phe | 1.50 ± 0.05 | |
| Gln | 7.44 ± 0.08 | His | 0.64 ± 0.02 | |
| Thr | 0.59 ± 0.03 | Orn | 0.23 ± 0.01 | |
| Glu | 1.43 ± 0.04 | Lys | 1.08 ± 0.03 | |
| Gly | 0.38 ± 0.02 | Arg | 5.01 ± 0.01 | |
| Ala | 5.09 ± 0.20 | Trp | 0.45 ± 0.01 | |
| Val | 0.54 ± 0.01 | |||
| Reducing sugars, mg/g DW | 2.86 ± 1.03 | |||
| Antioxidative compounds | ||||
| TPC, mg/g DW | 66.67 ± 3.74 | |||
| AA, mmol TE/g DW | 46.1 ± 2.2 | |||
| Factor | Name | Units | Variation Levels | |||||
|---|---|---|---|---|---|---|---|---|
| Minimum | Maximum | Coded Low (−1) | Coded High (+1) | Mean | Std. Dev. | |||
| A | Temperature | °C | 59.29 | 200.71 | 80.00 | 180.00 | 130.00 | 40.82 |
| B | Time | min | 5.86 | 34.14 | 10.00 | 30.00 | 20.00 | 8.16 |
| Run | Factor 1 | Factor 2 | Response 1 | Response 2 |
|---|---|---|---|---|
| A: Temperature, °C | B: Time, min | HMF, mg/kg DW | ACR, µg/kg DW | |
| 1 | 130.00 | 5.86 | 1.58 | 0.30 |
| 2 | 180.00 | 10.00 | 31.80 | 113.64 |
| 3 | 130.00 | 20.00 | 5.09 | 3.96 |
| 4 | 130.00 | 20.00 | 3.94 | 3.91 |
| 5 | 200.71 | 20.00 | 52.78 | 419.63 |
| 6 | 130.00 | 20.00 | 4.91 | 4.61 |
| 7 | 130.00 | 20.00 | 3.93 | 3.30 |
| 8 | 130.00 | 34.14 | 20.18 | 38.14 |
| 9 | 80.00 | 30.00 | 3.22 | 3.59 |
| 10 | 130.00 | 20.00 | 4.25 | 3.94 |
| 11 | 80.00 | 10.00 | 1.6 | 1.98 |
| 12 | 180.00 | 30.00 | 62.36 | 303.70 |
| 13 | 59.29 | 20.00 | 1.4 | 1.31 |
| Response | Source | Sum of Squares | df | Mean Square | F Value | p-Value Prob > F |
|---|---|---|---|---|---|---|
| HMF | Model | 5116.26 | 5 | 1023.25 | 67.18 | <0.0001 |
| A | 3280.59 | 1 | 3280.59 | 215.37 | <0.0001 | |
| B | 427.55 | 1 | 427.55 | 28.07 | 0.0011 | |
| AB | 209.38 | 1 | 209.38 | 13.75 | 0.0076 | |
| A2 | 1134.95 | 1 | 1134.95 | 74.51 | <0.0001 | |
| B2 | 151.58 | 1 | 151.58 | 9.95 | 0.0160 | |
| Residual | 106.63 | 7 | 15.23 | |||
| Lack of Fit | 105.44 | 3 | 35.15 | 118.31 | 0.0002 | |
| Pure Error | 1.19 | 4 | 0.30 | |||
| Cor Total | 5222.88 | 12 | ||||
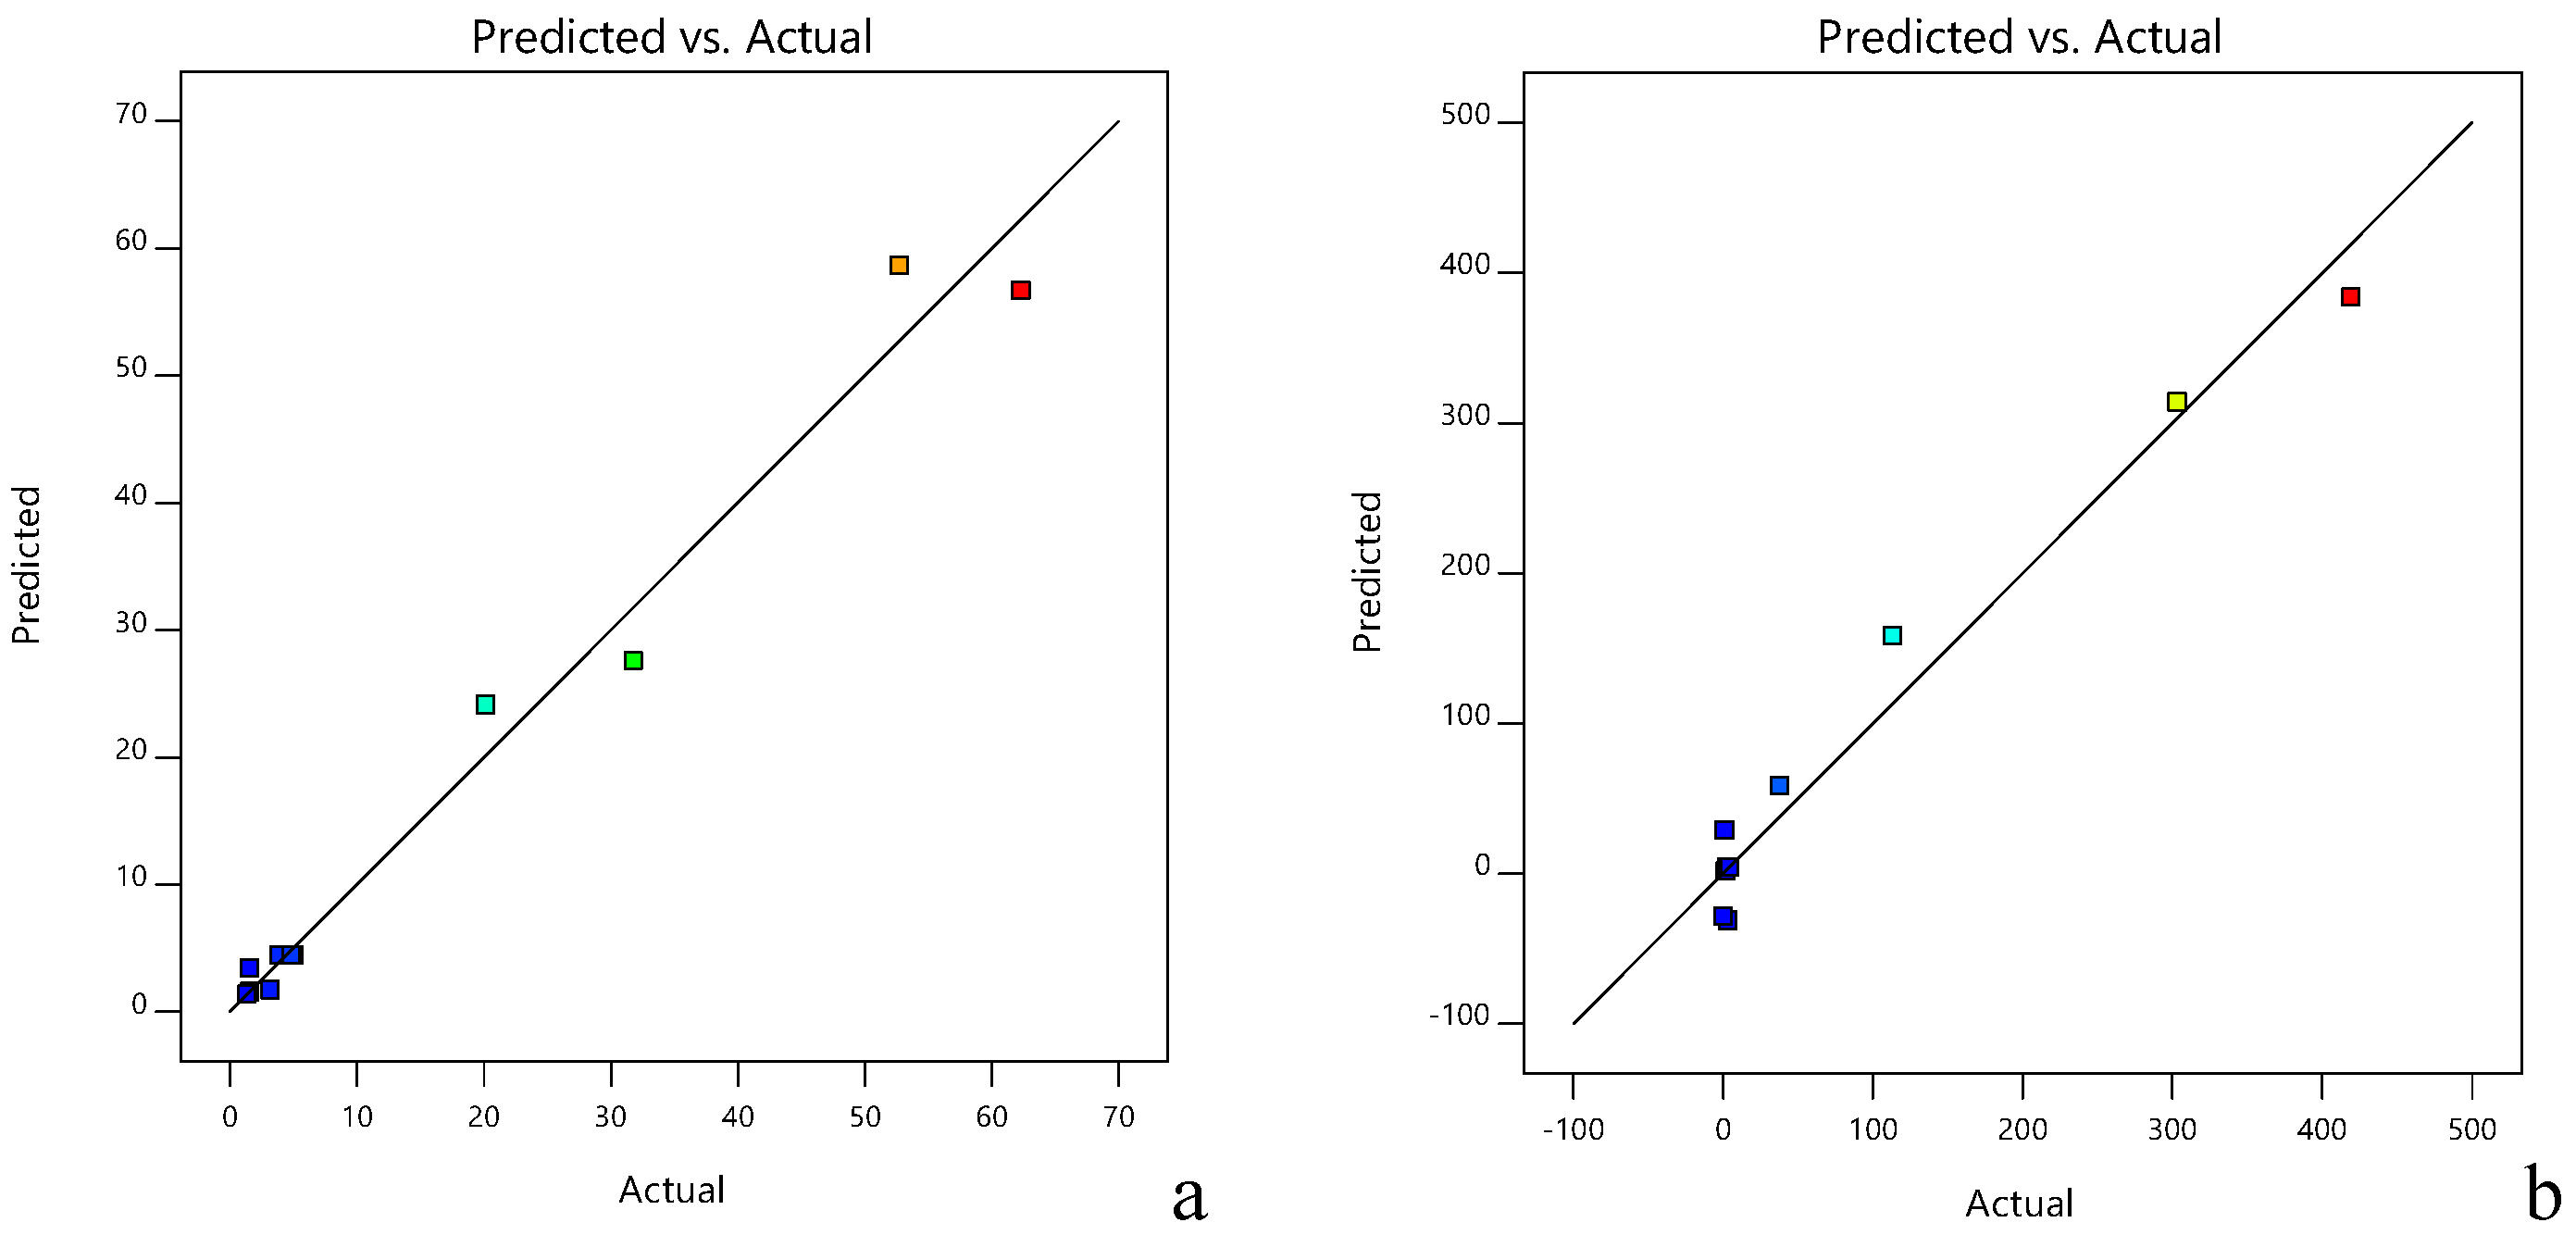
| R2 | 0.9796 | Adj R2 | 0.9650 | Pred R2 | 0.8561 | |
| ACR | Model | 2.136E + 005 | 5 | 42721.52 | 45.34 | <0.0001 |
| A | 1.258E+005 | 1 | 1.258E+005 | 133.57 | <0.0001 | |
| B | 7514.39 | 1 | 7514.39 | 7.98 | 0.0256 | |
| AB | 8878.35 | 1 | 8878.35 | 9.42 | 0.0181 | |
| A2 | 70940.47 | 1 | 70940.47 | 75.30 | <0.0001 | |
| B2 | 199.76 | 1 | 199.76 | 0.21 | 0.6592 | |
| Residual | 6595.08 | 7 | 942.15 | |||
| Lack of Fit | 6594.22 | 3 | 2198.07 | 10226.93 | <0.0001 | |
| Pure Error | 0.86 | 4 | 0.21 | |||
| Cor Total | 2.202E + 005 | 12 | ||||
| R2 | 0.9700 | Adj R2 | 0.9487 | Pred R2 | 0.7870 |
| Factors | β Coefficients | |
|---|---|---|
| HMF (R1) | ACR (R2) | |
| A | 4.42 | 3.94 |
| B | 20.25 | 125.42 |
| AB | 7.31 | 30.65 |
| A2 | 7.23 | 47.11 |
| B2 | 12.77 | 100.98 |
| Final Equation in Terms of Coded Factors | R1 = +4.42 + 20.25·A + 7.31·B + 7.23·A·B + 12.77·A2 + 4.67·B2 | R2 = +3.94 + 125.42·A + 30.65·B + 47.11·A·B + 100.98·A2 + 5.36·B2 |
© 2019 by the authors. Licensee MDPI, Basel, Switzerland. This article is an open access article distributed under the terms and conditions of the Creative Commons Attribution (CC BY) license (http://creativecommons.org/licenses/by/4.0/).
Share and Cite
Constantin, O.E.; Kukurová, K.; Daško, Ľ.; Stănciuc, N.; Ciesarová, Z.; Croitoru, C.; Râpeanu, G. Modelling Contaminant Formation during Thermal Processing of Sea Buckthorn Purée. Molecules 2019, 24, 1571. https://doi.org/10.3390/molecules24081571
Constantin OE, Kukurová K, Daško Ľ, Stănciuc N, Ciesarová Z, Croitoru C, Râpeanu G. Modelling Contaminant Formation during Thermal Processing of Sea Buckthorn Purée. Molecules. 2019; 24(8):1571. https://doi.org/10.3390/molecules24081571
Chicago/Turabian StyleConstantin, Oana Emilia, Kristina Kukurová, Ľubomír Daško, Nicoleta Stănciuc, Zuzana Ciesarová, Constantin Croitoru, and Gabriela Râpeanu. 2019. "Modelling Contaminant Formation during Thermal Processing of Sea Buckthorn Purée" Molecules 24, no. 8: 1571. https://doi.org/10.3390/molecules24081571