
Lignans from the Twigs of Litsea cubeba and Their Bioactivities
by
 ,
,
Xiuting Li
1,† ,
,
Huan Xia
2,†,
Lingyan Wang
2,
Guiyang Xia
2,
Yuhong Qu
2,
Xiaoya Shang
3,* and
Sheng Lin
2,* 1
Beijing Advanced Innovation Center for Food Nutrition and Human Health, Beijing Technology and Business University, Beijing 100048, China
2
State Key Laboratory of Bioactive Substance and Function of Natural Medicines, Institute of Materia Medica, Chinese Academy of Medical Sciences and Peking Union Medical College, Beijing 100050, China
3
Beijing Key Laboratory of Bioactive Substances and Functional Foods, Beijing Union University, Beijing 100023, China
*
Authors to whom correspondence should be addressed.
†
These authors contributed equally to this work.
Molecules 2019, 24(2), 306; https://doi.org/10.3390/molecules24020306
Submission received: 18 December 2018
/
Revised: 30 December 2018
/
Accepted: 4 January 2019
/
Published: 16 January 2019
(This article belongs to the Special Issue Isolation and Structure Elucidation of Bioactive Compounds (Dedicated to the memory of the late Professor Charles D. Hufford))
Abstract
:Litsea cubeba, an important medicinal plant, is widely used as a traditional Chinese medicine and spice. Using cytotoxicity-guided fractionation, nine new lignans 1–9 and ten known analogues 10–19 were obtained from the EtOH extract of the twigs of L. cubeba. Their structures were assigned by extensive 1D- and 2D-NMR experiments, and the absolute configurations were resolved by specific rotation and a combination of experimental and theoretically calculated electronic circular dichroism (ECD) spectra. In the cytotoxicity assay, 7′,9-epoxylignans with feruloyl or cinnamoyl groups (compounds 7–9, 13 and 14) were selectively cytotoxic against NCI-H1650 cell line, while the dibenzylbutyrolactone lignans 17–19 exerted cytotoxicities against HCT-116 and A2780 cell lines. The results highlighted the structure-activity relationship importance of a feruloyl or a cinnamoyl moiety at C-9′ or/and C-7 ketone in 7′,9-epoxylignans. Furthermore, compound 11 was moderate active toward protein tyrosine phosphatase 1B (PTP1B) with an IC50 value of 13.5 μM, and compounds 4–6, 11 and 12 displayed inhibitory activity against LPS-induced NO production in RAW264.7 macrophages, with IC50 values of 46.8, 50.1, 58.6, 47.5, and 66.5 μM, respectively.
1. Introduction
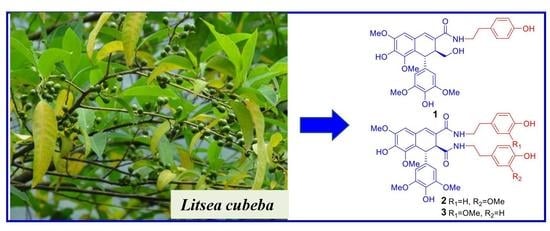
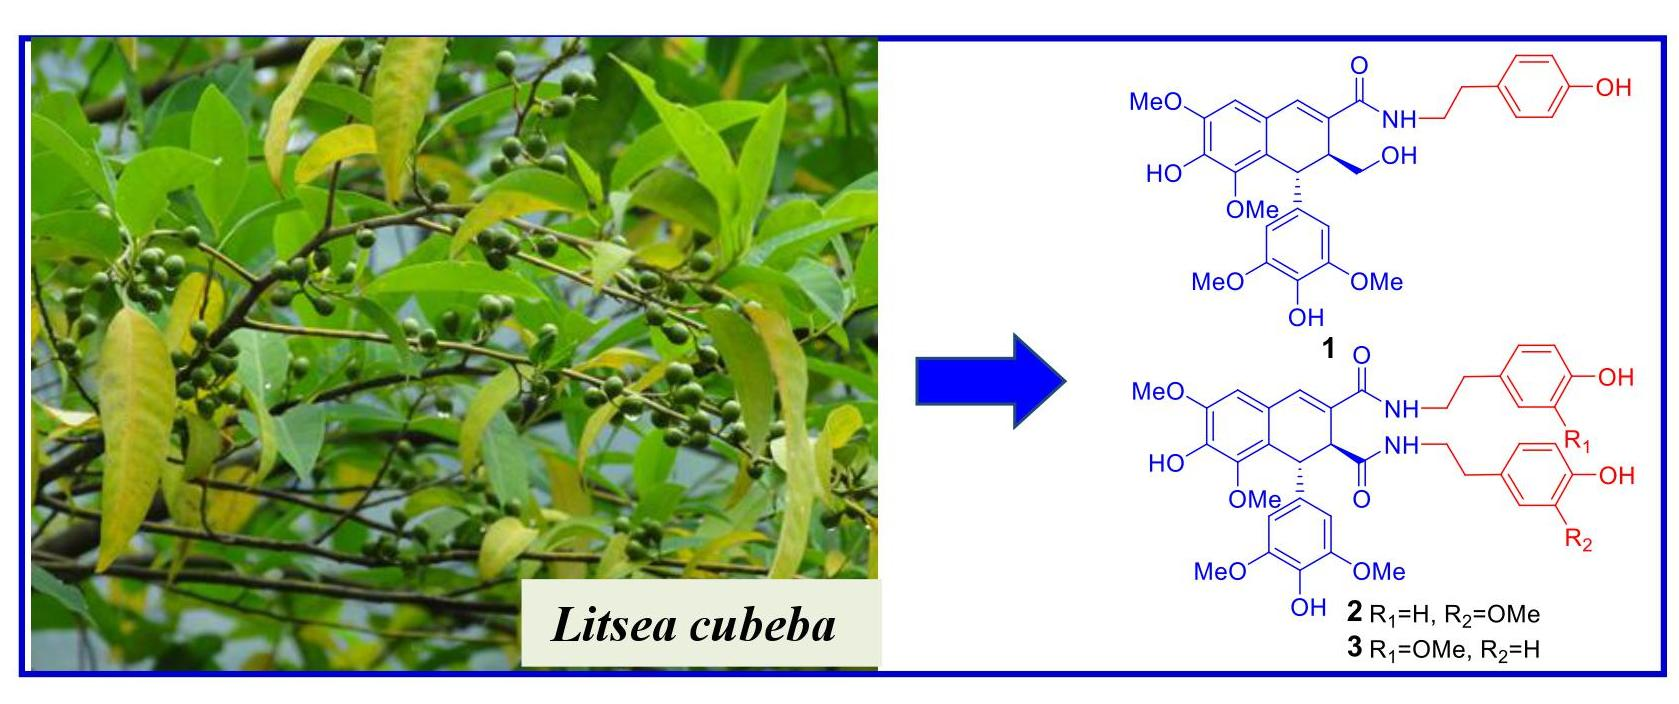
Plants from the Litsea species (Lauraceae) are widely distributed in tropical or subtropical areas. Litsea cubeba, mainly grown in the east and south of China, is broadly used as a traditional Chinese medicine and spice. “Bi-cheng-qie” and “dou-chi-jiang”, the dried fruits and roots of L. cubeba, respectively, have been documented in the Chinese Pharmacopoeia and Chinese Materia Medica as two important traditional Chinese medicines for the treatment of various ailments, including coronary disease, cerebral apoplexy, asthma, and rheumatic arthritis [1,2,3]. Moreover, Litsea cubeba fruits are also important spices and great sources of essential oils which are often used as flavor enhancers in foods, cigarettes, and cosmetics [4]. Previous phytochemical investigation of the fruits and roots of L. cubeba have reported the discovery of aporphine-type alkaloids, lignans, and phenolic constituents [5,6,7,8,9,10,11]. Among them, aporphine-type alkaloids and lignans were considered as the major active principles of this plant due to their antithrombotic, anti-inflammatory, and antinociceptive properties [8,9,12,13,14,15]. Since there are few reports on the phytochemicals of twigs of L. cubeba, a recent study on L. cubeba twigs by our group led to the characterization of 36 aromatic glycosides from the the water-soluble fraction of an ethanolic extract. Interestingly, some lignan glycosides showed potent hepatoprotective and HDAC1 inhibitory activity [16,17]. In the present study, we have investigated the constituents of the EtOAc-soluble fraction of the ethanolic extract of L. cubeba twigs. Bioassay-guided isolation of a fraction with cytotoxicity against HCT-116, NCI-H1650, and A2780 cell lines (IC50 = 28.3, 11.5, and 16.8 µg/mL, respectively) led to the discovery of nine new lignans 1–9 and ten analogues 10–19 (Figure 1). The structures of 1–9 were elucidated by spectroscopic methods, and their absolute configurations were determined by optical rotations and a combination of experimental and theoretically calculated electronic circular dichroism (ECD) spectra. Detailed herein are the isolation, structural elucidation, and bioactivity assay of compounds 1–19.
2. Results and Discussions
2.1. Structure Elucidation
The EtOAc extract of the twigs of L. cubeba was subjected to column chromatography on silica gel to give 13 fractions (F1–F13). Cytotoxicity assays found that F9 displayed potent activities against HCT-116, NCI-H1650, and A270 cell lines. Fractionation of F9 by Sephadex LH-20, RP-18, preparative TLC, and preparative HPLC led to the discovery of nine new lignans 1–9 and the ten known ones 10–19.
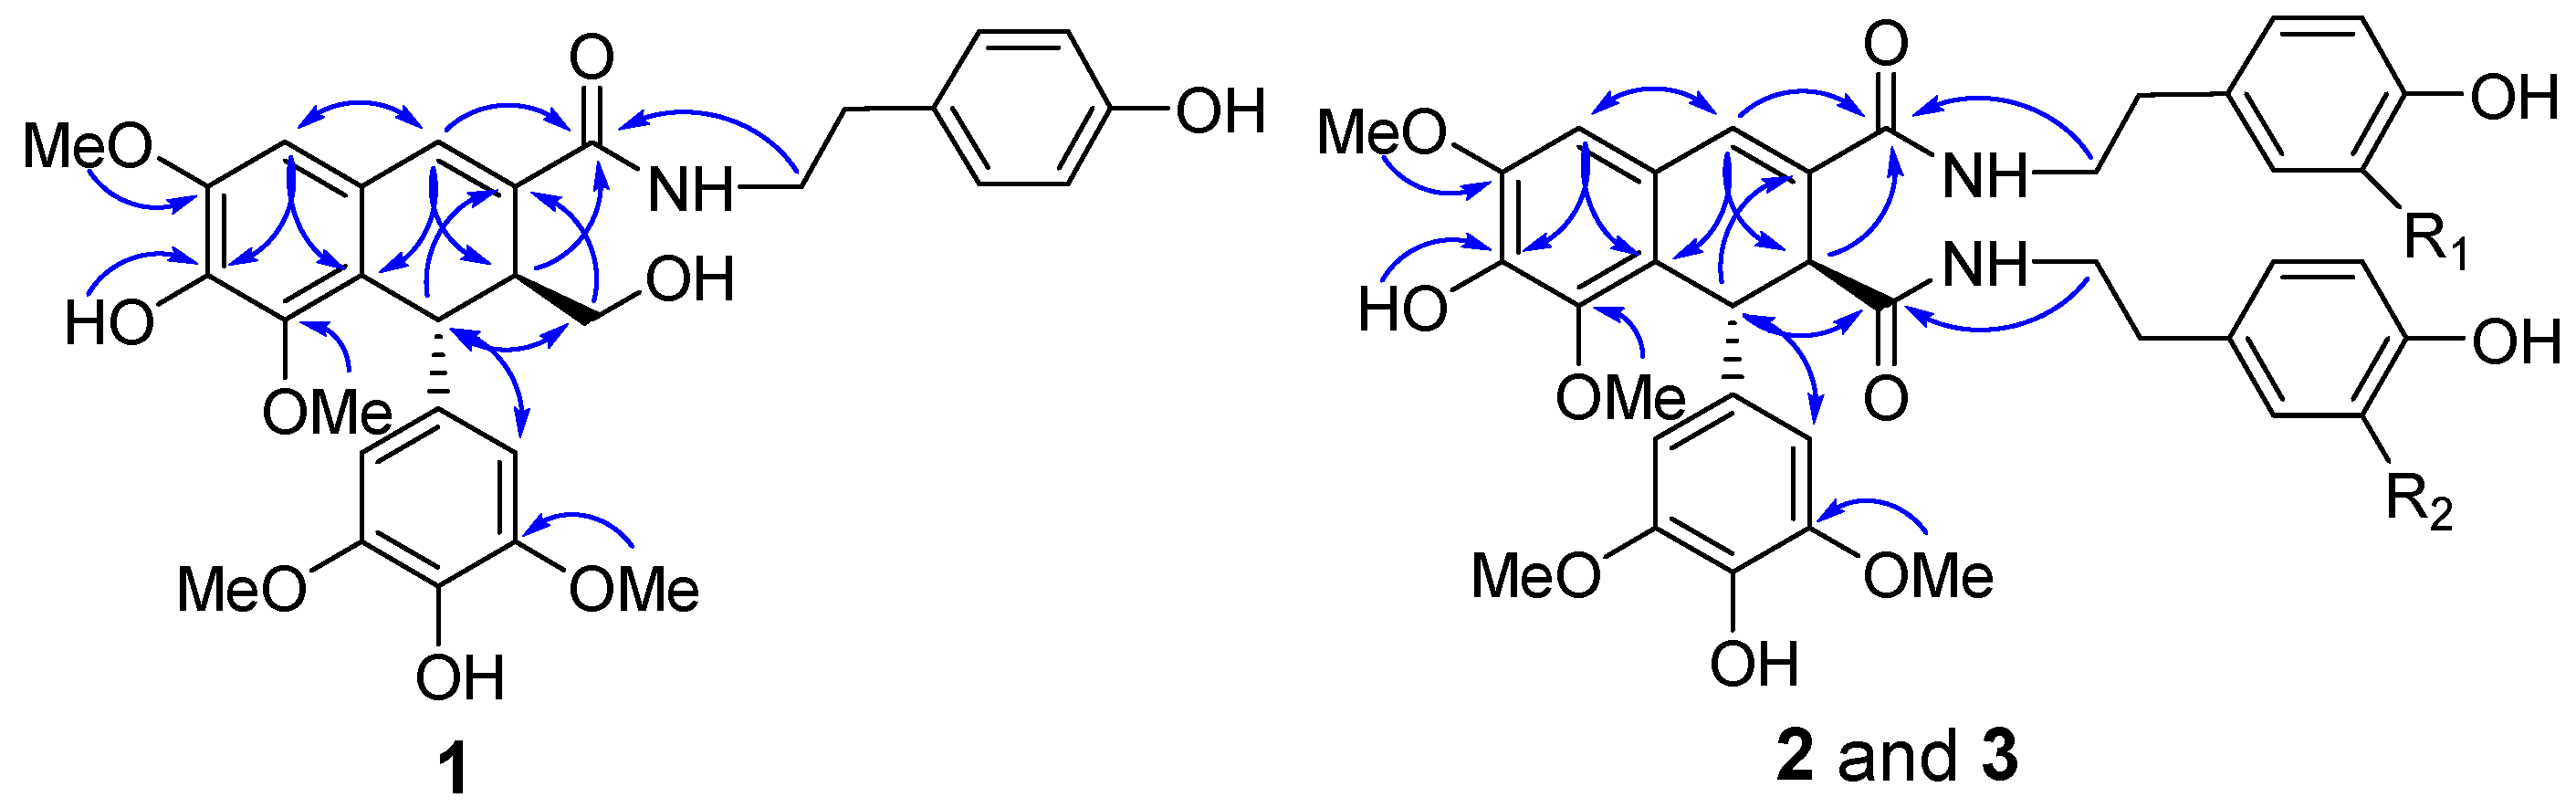
Compound 1 was obtained as a white amorphous powder. The presence of amide (1643 cm−1), aromatic ring (1611, 1516, and 1459 cm−1), and hydroxy (3372 cm−1) functionalities were evident in its IR spectrum. Its molecular formula of C30H33NO9 with fifteen degrees of unsaturation was established by HREIMS based on the [M + H]+ ion at m/z 552.2234 (calcd. 552.2228) and 13C-NMR spectrum. In the 1H-NMR spectrum recorded in acetone-d6, the signals for an aromatic singlet integrated for two protons at δ 6.39 (2H, s, H-2′ and H-6′), a methoxy singlet integrated for six protons at δ 3.67 (6H, s, OMe×2), suggested a 1-substituted-3,5-dimethoxy-4-hydroxybenzene ring in 1. Signals of a singlet proton at δ 6.74 and two methoxy protons at δ 3.86 and 3.58 revealed a pentasubstituted aromatic ring attached two methoxy groups. These 1H-NMR signals, together with another two singlet protons at δ 7.19 and 4.62, were indicative of a typical skeleton of 2,7′-cyclolignan-7-en such as thomasic acid [18]. Additionally, the 1H-NMR spectrum of 1 displayed characteristic signals for a tyramine group with resonances at δH 6.98 (2H, d, J = 8.5 Hz, H-2” and H-6”), 6.71 (2H, d, J = 8.5 Hz, H-3” and H-5”), 2.69 (2H, t, J = 7.5 Hz, H2-7”), and 3.39 (2H, dt, J = 7.5, 4.5 Hz, H2-8”). The 13C-NMR spectrum of 1 displayed 30 carbon signals, of which twelve could be assigned to be a tyramine moiety (δC 131.2, 130.5 × 2, 116.0 × 2, 156.6, 35.6, 42.2) and four methoxy groups (δC 56.6 × 2, 56.5, 60.4), and the remaining eighteen carbons were consistent with the 2,7′-cyclolignan-7-en skeleton. The complete 1H- and 13C-NMR assignments of 1 were made by a combination of 1D- and 2D-NMR experiments. In the HMBC spectrum of 1, the two or three bonds long range correlations from H-6 to C-2, C-4, and C-7, from H-7 to C-2, C-6, C-9, and C-8′, from H-7′ to C-3, C-8, C-2′ (C-6′), and C-9′, from H-8′ to C-2, C-7, C-9, and C-1′, from H2-9′ to C-8 and C-7′, and from the methoxy protons at δH 3.58 to C-3′ (C-5′) (Figure 2) confirmed the 2,7′-cyclolignan-7-en type lignan containing a 3,5-dimethoxy-4-hydroxy-benzene moiety. The NOESY correlation observed between H-6 and the methoxy protons at δH 3.86 together with the HMBC correlation observed for these methoxy protons and C-5 gave the evidence for the location of one methoxy group at C-5. Key HMBC cross-peaks, such as between methoxy protons at δH 3.58 and C-3, as well as between OH proton at δH 7.76 and C-4, served to locate this methoxy and OH group at C-3 and C-4, respectively. Furthermore, the tyramine was linked to C-9 to form an amine bond, according to the HMBC correlations from both H2-8″ and NH proton to C-9. Therefore, these data completed the planar structure of 1 as N-[2-(4-hydroxyphenyl)-ethyl]-4,4′,9′-trihydroxy-3,5,3′,5′-tetramethoxy-2,7′-cyclolignan-7-en-9-amide. H-7′ appearing as a singlet suggested the dihedral angle for the vicinal protons of H-7′ and H-8′ was nearly 90°, requiring a trans relationship of H-7′ and H-8′. This assignment was also supported by the NOESY correlations of H-7′ with H2-9′, and H-8′ with H-2′ (H-6)′. Finally, the negative optical rotation of 1 demonstrated the 7′R,8′S absolute configuration of 1 [18,19]. Hence, compound 1 was defined as (−)-(7′R,8′S)-N-[2-(4-hydroxyphenyl)-ethyl]-4,4′,9′-trihydroxy-3,5,3′,5′-tetramethoxy-2,7′-cyclolignan-7-en-9-amide.
Compound 2 was isolated as a white amorphous powder. The IR spectrum exhibited absorptions of hydroxy (3362 cm−1), amide (1649 cm−1), and aromatic (1612 and 1516 cm−1) moieties. Its molecular formula was deduced as C39H42N2O11 from the negative HRESIMS at m/z 713.2719 [M − H]− (calcd. 713.2716) and the 13C-NMR spectrum. This indicated twenty degrees of unsaturation. The NMR spectra of 2 were very similar to those of compound 10, a known lignan diamide that was also isolated from this plant [20], with the only difference being the replacement of one of a tyramine group by a 3-methoxytyramine moiety (Table 1; Table 2). In the HMBC spectrum of 2, H2-7”′ showed HMBC correlations with the amide carbon at δC 171.4, which indicated that the 3-methoxytyramine moiety was connected to C-9′ via an amide bond (Figure 2). In the 1D NOE difference spectrum of 2, H-8′ was enhanced upon irradiation of H-2′ (H-6′). This enhancement, together with H-7′ presented in a singlet, revealed a trans-vicinal orientation of H-7′ and H-8′. Finally, on the basis of the negative optical rotation of 2 and biosynthetic considerations, the structure of compound 2 was defined as (−)-(7′R,8′S)-N1-[2-(4-hydroxyphenyl)-ethyl]-N2-[2-(4-hydroxy-3-methoxyphenyl)-ethyl]-4,4′-dihydroxy-3,5,3′,5′-tetramethoxy-2,7′-cyclolignan-7-en-9,9′-diamide.
Compound 3 gave the same molecular formula, C39H42N2O11, as that of 2 by analysis of the HRESIMS. Compound 3 shared almost identical UV, IR, and 1H- and 13C-NMR features to those of 2, which suggested that they both contained the 4,4′-dihydroxy-3,5,3′,5′-tetramethoxy-2,7′-cyclolignan- 7-en-9,9′-diamide core, a tyramine, and a 3-methoxytyramine moieties.
Further analysis of 2D-NMR data permitted the tyramine and 3-methoxytyramine moieties to be located at C-9′ and C-9 in 3, the reverse of 2, via the amide bonds (Figure 2), respectively. Analysis of the 1D NOE difference spectrum of 3 and its optical rotation indicated that 3 had the same absolute configuration as 2. Therefore, the structure of 3 was confirmed as (−)-(7′R,8′S)-N1-[2-(4-hydroxy-3-methoxyphenyl)-ethyl]-N2-[2-(4-hydroxyphenyl)-ethyl]-4,4′-dihydroxy-3,5,3′,5′-tetramethoxy-2,7′-cyclolignan-7-en-9,9′-diamide.
Compound 4 was obtained as a yellow solid and its molecular formula was deduced as C31H36O10 from HRESIMS. The IR spectrum exhibited absorption bands at 3391, 1608, and 1516 cm−1 due to the aromatic and hydroxy groups. The NMR data of 4 showed signals similar with secoisolariciresinol (Table 1; Table 2) [21,22]. However, both the H2-9 and C-9 were shifted downfield when compared with secoisolariciresinol. Besides, the 1H- and 13C-NMR signals attributed to a trans-cinnamyloxy unit were present (Table 1; Table 2). These were consistent with the substitution of the trans-cinnamyloxy at C-9, which was verified by the key HMBC correlation from H2-9 to C-9″. The positive optical rotation of 4 supported the same (8S,8′S) configuration as that of the known compound (+)-(8S,8′S)-9,9′-di-O-(E)-feruloylsecoisolariciresinol (11), which has been also isolated from this plant [12]. The (8S,8′S) configuration was confirmed by the evidence that compound 4 showed optical rotation opposite to that of (−)-1-O-feruloylsecoisolariciresinol [21]. Thus, the structure of 4 was defined as (+)-(8S,8′S)-9-O-(E)-cinnamoylsecoisolariciresinol.
The molecular formula of compound 5 was C32H38O11 from the HRESIMS data. Analysis of the 1D- and 2D-NMR data revealed that its planar structure was completely identical to the known lignan, (−)-(8R,8′R)-9-O-(E)-feruloyl-5,5′-dimethoxysecoisolariciresinol, but their specific rotation was inverse [23]. Taking into account that 4 was the 5-methoxy analogue of 5 and they displayed similar specific rotation, it is proposed that they both have the (8S,8′S) configuration. Thus, the structure of 5 was defined as (+)-(8S,8′S)-9-O-(E)-feruloyl-5,5′-dimethoxysecoisolariciresinol.
The planar structure of 6 was proved to be identical to (−)-(8R,8′R)-9-O-(E)-feruloyl-secoisolariciresinol (different nomenclature was used in literature [21]) after analysis of the HRMS, and 1D- and 2D-NMR data of 6. However, the optical rotation of 6 was opposite for (−)-(8R,8′R)-9-O-(E)-feruloyl-secoisolariciresinol [21]. Thus, the structure of 6 was determined as (+)-(8S,8′S)-9-O-(E)-feruloyl-secoisolariciresinol.
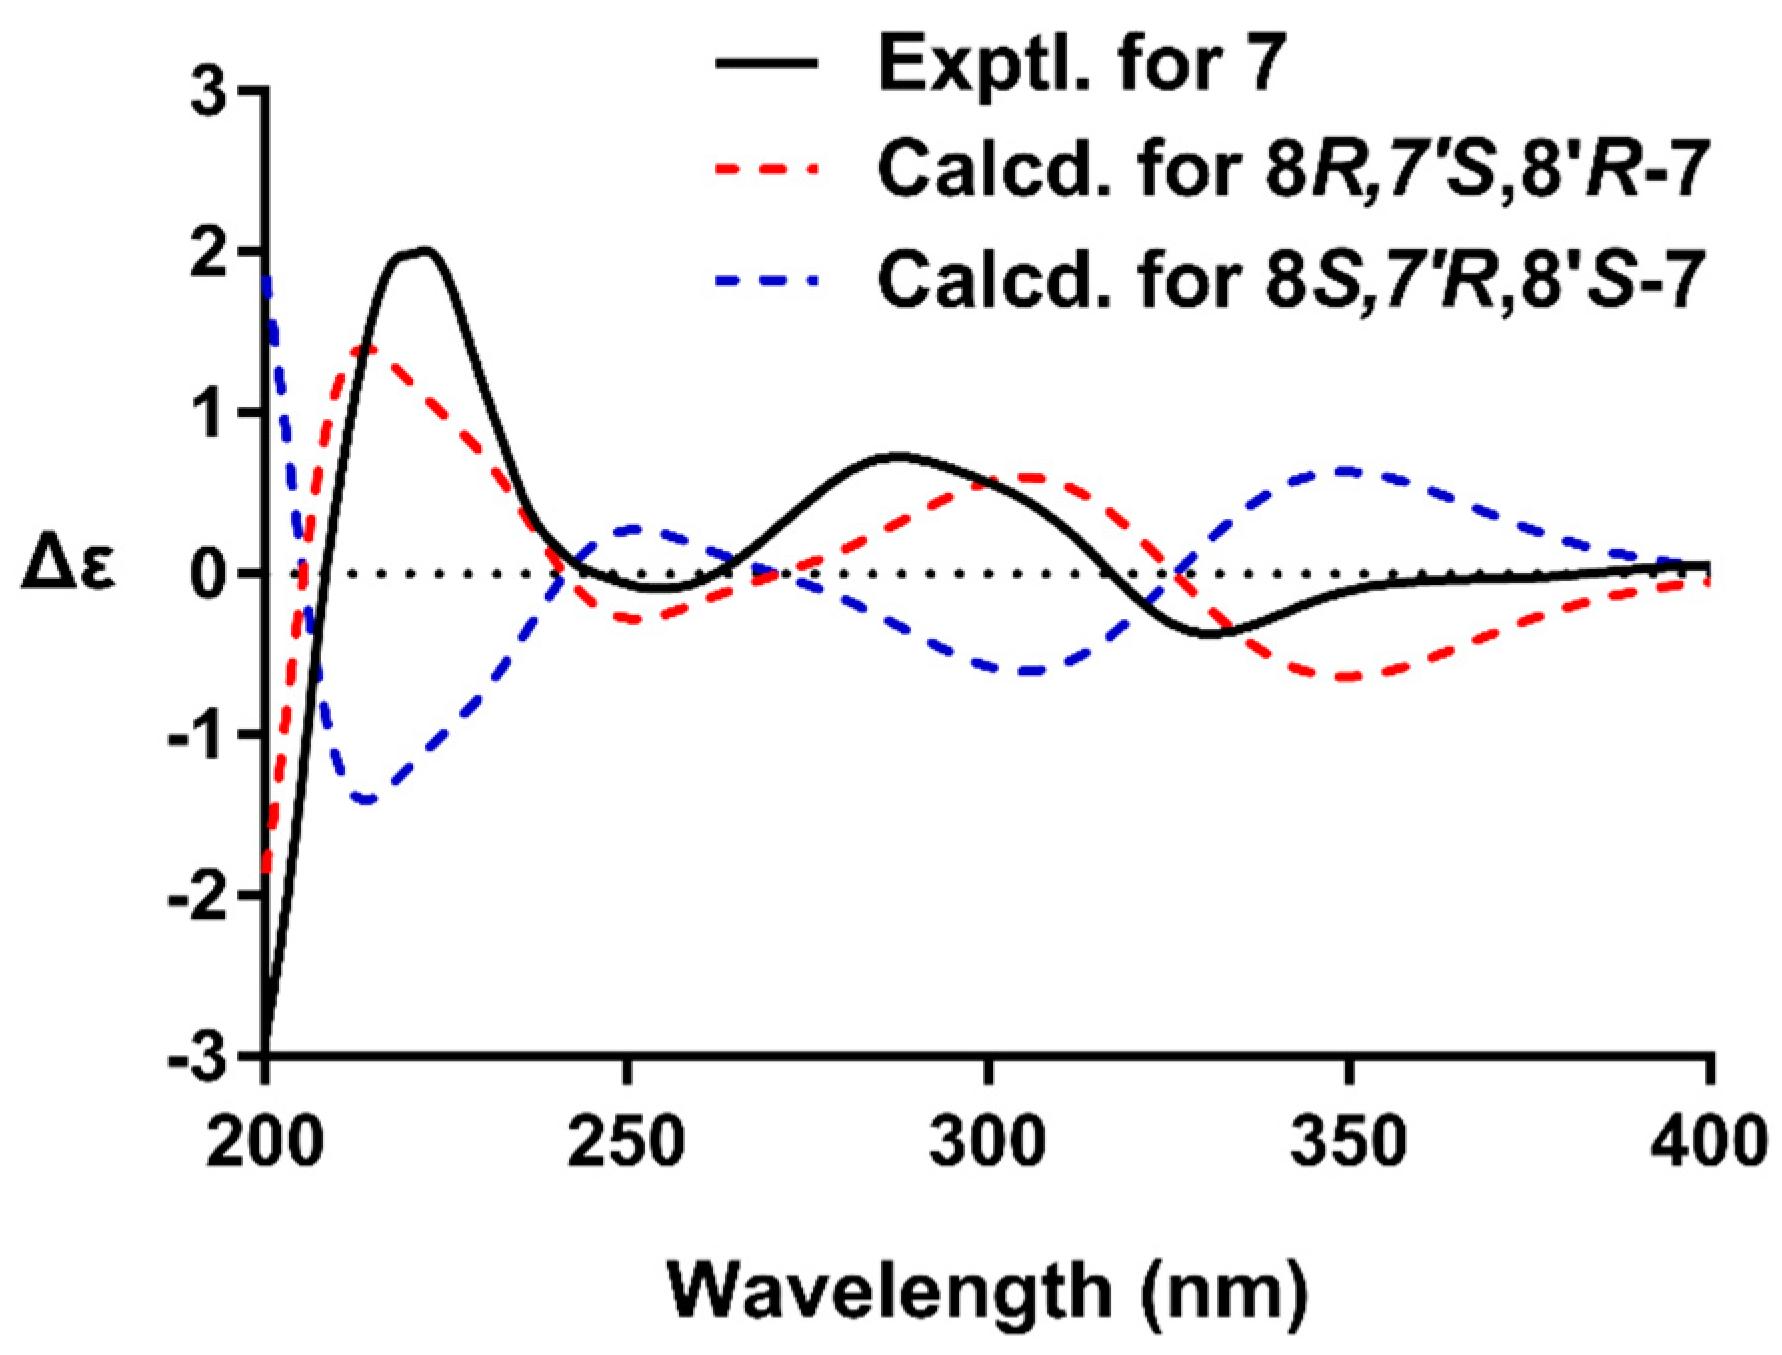
Compound 7, an amorphous powder, was determined to have the molecular formula of C32H34O12 by HRESIMS. The NMR spectra of 7 were similar to the co-occurring (+)-9′-O-trans-feruloyl-5,5′-dimethoxylariciresinol (13) [24], with the only difference being the replacement of the CH2 group by a ketone. These data demonstrated the presence of a ketone moiety at C-7 in 7. This inference was confirmed by the HMBC cross-peak of H-2(6)/C-7, H2-9/C-7, and H-8′/C-7. The coupling constant of H-7′ (J = 7.5 Hz) indicated a trans relationship of H-7′/H-8′. The presence of correlations of H-7′/H2-9′ and H-2(6)/H-8′ and the absence of H-8/H2-9′ were observed in the NOESY spectrum of 7, which confirmed that H-7′ was oriented opposite to H-8 and H-8′. The absolute configuration of 7 was established by quantum chemical ECD calculation (Supplementary Materials). The calculated ECD curve for 8R,7′S,8′R-isomer matched well with the experimental ECD spectrum of 7 (Figure 3), which suggested compound 7 had the (8R,7′S,8′R) absolute configurations. Based on these observations, the structures of 7 was assigned as (+)-(8R,7′S,8R′)-9′-O-(E)-feruloyl-5,5′-dimethoxylariciresinol-7-one.
The molecular formula of compound 8 was C33H38O12 as indicated by the HRESIMS. The NMR spectra of 8 and (+)-9′-O-trans-feruloyl-5,5′-dimethoxylariciresinol were closely comparable [24], except for the replacement of (E)-feruloyl group by the (E)-cinnamoyl group. The structure of 8 was confirmed by the 2D-NMR HSQC, COSY, HMBC, and NOESY data. Also, the NOESY correlations of H-7′/H2-9′ and H2-7/H2-9′ revealed that compounds 7 and 8 have the same relative configuration. Therefore, on the basis of the positive optical rotation of 8 and biosynthetic considerations, the structure of 8 was deduced as (+)-(8R,7′S,8′R)-9′-O-(E)-cinnamoyl-5,5′-dimethoxylariciresinol.
Compound 9 was shown to have the molecular formula of C33H38O12, as established by the HRESIMS. The 1H- and 13C-NMR spectra of 9 closely resembled those of 7, the only discernable difference being the presence of a new methoxy moiety and lack of a ketone moiety in 9, suggesting that compound 9 contains a methoxy moiety rather than a ketone moiety at C-7. This was confirmed from the COSY correlation of H-7/H-8 and HMBC correlation of OMe/C-7. In the NOESY spectrum of 9, the NOE correlations of H-7/H2-9′ and H-7′/H2-9′ also verified that H-7′ was oriented opposite to H-8 and H-8′. Thus, the structure of 9 was defined as 9′-O-(E)-feruloyl-5,7,5′-trimethoxy-lariciresinol.
The known compounds were identified as 1,2-dihydro-6,8-dimethoxy-7-hydroxy-1-(3,5-dimethoxy- 4-hydroxyphenyl)-N1,N2-bis-[2-(4-hydroxypeenyl)ethyl]-2,3-naphthalene dicarboxamide (10) [20], (+)-9,9′-O-di-(E)-feruloyl-5,5′-dimethoxy secoisolariciresinol (11) [25], (+)-9,9′-O-di-(E)-feruloyl-secoisolariciresinol (12) [12], (+)-9′-O-(E)-feruloyl-5,5′-dimethoxylariciresinol (13) [24], (+)-9′-O-(E)-feruloyl-5′-methoxylariciresinol (14) [26], (+)-5,5′-dimethoxylariciresinol (15) [27], (+)-5′-methoxylariciresinol (16) [28], arctigenin (17), matairesinol (18) [29], and (7E,8R′)-didehydroarctigenin (19) [30], respectively, by spectroscopic analysis and comparison of the data obtained with literature values.
2.2. Biological Activities of Compounds 1–19
2.2.1. Cytotoxic Activity
The task of IC50 assessment for all isolates against human colon cancer (HCT-116), human non-small-cell lung carcinoma (NCI-H1650), and human ovarian cancer (A2780) cell lines began immediately following the purification and characterization of each lignan.
Of the compounds, only 7′,9-epoxylignans with feruloyl or cinnamoyl group (compounds 7–9, 13 and 14) were selectively cytotoxic against NCI-H1650 cell line, with IC50 values of less than 20 μM. These results suggested the presence of a feruloyl or a cinnamoyl moiety at C-9′ in 7′,9-epoxylignans is essential for cytotoxicity against NCI-H1650 cell line. It is noteworthy that compound 7 displayed 4-6 folds more active than 8, 9, 13, and 14, indicating that the presence of the C-7 ketone could enhance the bioactivity. In addition, the dibenzylbutyrolactone lignans (17–19) exerted cytotoxicities against HCT-116 and A2780 cell lines, with IC50 values ranging from 0.28 to 18.47 μM (Table 3), but less potent than the positive control taxol (IC50 = 0.005 and 0.02 μM, respectively). Interestingly, the addition of the double bond at C-7−C-8 on 19 resulted in 4–40 folds less active than 17 and 18. This implied that the C-7−C-8 double bond could reduce the cytotoxicity, especially against the A2780 cell line.
2.2.2. Inhibitory Activity of Protein Tyrosine Phosphatase 1B
The isolates were also evaluated for inhibitory activities against protein tyrosine phosphatase 1B (PTP1B). Only compound 11 was moderate active toward PTP1B with an IC50 value of 13.5 μM. The positive control oleanolic acid gave an IC50 value of 3.82 μM.
2.2.3. Anti-Inflammatory Activity
The inhibitory activity of compounds 1–19 against LPS-induced NO production in RAW264.7 macrophages was examined in this study. As a result, compounds 4–6, 11 and 12 displayed inhibitions against LPS-induced NO production in RAW264.7 macrophages, with IC50 values of 46.8, 50.1, 58.6, 47.5, and 66.5 μM, respectively. Dexamethasone was used as positive control with an IC50 value of 9.5 μM.
3. Materials and Methods
3.1. General Experimental Procedures
Optical rotations were measured on an Autopol III automatic polarimeter (Rudolph Research, Hackettstown, NJ, USA). UV spectra were measured on a Cary 300 spectrometer (Agilent, Melbourne, Australia). ECD spectra were recorded on a J-815 spectrometer (JASCO, Tokyo, Japan). IR spectra were acquired on an Impact 400 FT-IR Spectrophotometer (Nicolet, Madison, WI, USA). Standard pulse sequences were used for all NMR experiments, which were run on either a Bruker spectrometer (600 MHz for 1H or 150 MHz for 13C, Karlsruhe, Germany) or a Varian INOVA spectrometer (500 MHz for 1H or 125 MHz for 13C, Palo Alto, CA, USA) equipped with an inverse detection probe. Residual solvent shifts for acetone-d6 were referenced to δH 2.05, δC 206.7 and 29.9, respectively. Accurate mass measurements were obtained on a Q-Trap LC/MS/MS (Turbo ionspray source) spectrometer (Sciex, Toronto, ON, Canada). Column chromatography (CC) was run using silica gel (200–300 mesh, Qingdao Marine Chemical Inc., Qingdao, China), and Sephadex LH-20 (Pharmacia Biotech AB, Uppsala, Sweden). HPLC separation was done on Waters HPLC components (Milford, MA, USA) comprising of a Waters 600 pump, a Waters 600 controller, a Waters 2487 dual λ absorbance, with GRACE preparative (250 × 19 mm) Rp C18 (5 μm) columns.
3.2. Plant Material
The twigs of Litsea cubeba were collected in Zhaotong, Yunnan Province, People’s Republic of China, in May 2013, and identified by Prof. Gan-Peng Li at Yunnan Minzu University. A herbarium specimen was deposited in at the Herbarium of the Department of Medicinal Plants, Institute of Materia Medica, Beijing 100050, People’s Republic of China (herbarium No. 2013-05-10).
3.3. Extraction and Isolation
The air-dried twigs of L. cubeba (12 kg) were ground and extracted using 30.0 L of 95% EtOH under ambient temperature for 3 × 48 h. The EtOH extract was concentrated in vacuo and the residue was suspended in H2O, then partitioned with EtOAc, to afford EtOAc and H2O soluble extracts.
The EtOAc fraction (300 g) was chromatographed over silica gel (1500 g), eluting with a gradient of acetone (0–100%) in petroleum ether, and 13 fractions (F1–F13) was obtained based on the TLC analysis. The F9 (12.0 g), which showed potent cytotoxicity against HCT-116, NCI-H1650, and A270 cell lines, was subjected to the reversed-phase flash chromatography over C-18 silica gel, eluting with a step gradient from 20 to 95% MeOH in H2O, to give 15 fractions (F9-1–F9-15). F9-8 (1.5 g) was separated on Sephadex LH-20 eluting with petroleum CHCl3-MeOH (1:1) to give three subfractions, and the first subfraction was purified by reversed-phase preparative HPLC (RP18, 5 μm, 254 nm, MeOH-H2O, 75:25) to yield 1 (9.2 mg). The second and third subfractions were further purified by preparative TLC developed with CHCl3-MeOH (15:1) to afford 15 (52 mg), 16 (35mg), and 18 (29 mg). F9-9 (1.0 g) was fractionated on a Sephadex LH-20 column using CHCl3-MeOH (1:1) as the eluent to yield five corresponding subfractions. Compound 10 (55 mg) was crystallized from a Me2CO solution of the second subfraction. The third subfraction was further purified by preparative TLC with CHCl3-MeOH (20:1) to give 17 (17 mg) and 19 (8 mg). The fourth subfraction was purified by reversed-phase preparative HPLC (RP18, 5 μm, 254 nm, MeOH-H2O, 85:15) to give 2 (56 mg), 3 (21 mg), and 14 (23 mg). Using the same HPLC system, the fifth subfraction afforded 7 (27 mg), 8 (12 mg) and 9 (8 mg), and 13 (17 mg). F9-10 (1.2 g) was chromatographed over Sephadex LH-20 eluting with CHCl3-MeOH (1:1), and then further separated by reversed-phase preparative HPLC (RP18, 5 μm, 254 nm, MeOH-H2O, 90:10), to afford 4 (8 mg) and 5 (5 mg). F9-11 (0.8 g) was fractionated on a Sephadex LH-20 column with CHCl3-MeOH (1:1) as the eluent to give three subfractions. The second and third subfractions were further purified by reversed-phase preparative HPLC (RP18, 5 μm, 254 nm, MeOH-H2O, 90:10) to afford 6 (12 mg), 11 (23 mg), and 12 (15 mg).
3.4. (−)-(7′R,8′S)-N-[2-(4-Hydroxyphenyl)-ethyl]-4,4′,9′-trihydroxy-3,5,3′,5′-tetramethoxy-2,7′-cyclo-lignan-7-en-9-amide (1)
White, amorphous powder. −35.0 (c 0.1, MeOH); UV (MeOH) λmax (log ε) 204 (4.04), 200 (2.32), 245 2.12), 324 (1.13) nm; IR (KBr) νmax 3372, 2935, 2849, 1643, 1611, 1516, 1459, 1427, 1329, 1286, 1218, 1115, 1030, 961, 912, 834, 646 cm−1; 1H-NMR (acetone-d6, 500 MHz) and 13C-NMR (acetone-d6, 125 MHz) data, see Table 1; Table 2; ESIMS m/z 574 [M + Na]+ and 550 [M − H]−; HRESIMS m/z 552.2234 [M + H]+ (calcd. for C30H34NO9, 552.2228) and 574.2048 [M + Na]+ (calcd. for C30H33NO9Na, 574.2048).
3.5. (−)-(7′R,8′S)-N1-[2-(4-Hydroxyphenyl)-ethyl]-N2-[2-(4-hydroxy-3-methoxyphenyl)-ethyl]-4,4′-dihydro-xy-3,5,3′,5′-tetramethoxy-2,7′-cyclolignan-7-en-9,9′-diamide (2)
White, amorphous power. −23.0 (c 0.1, MeOH); UV (MeOH) λmax (log ε) 204 (4.11), 250 (0.86), 281 (0.30), 328 (0.42) nm; IR (KBr) νmax 3362, 2919, 2851, 1736, 1649, 1612, 1516, 1464, 1424, 1372, 1328, 1274, 1217, 1115, 1035, 890, 834, 802, 721, 640 cm−1; 1H-NMR (acetone-d6, 600 MHz) and 13C-NMR (acetone-d6, 150 MHz) data, see Table 1; Table 2; ESIMS m/z 713 [M − H]−; HRESIMS m/z 713.2719 [M − H]− (calcd. for C39H41N2O11, 713.2716).
3.6. (−)-(7′R,8′S)-N1-[2-(4-Hydroxy-3-methoxyphenyl)-ethyl]-N2-[2-(4-hydroxyphenyl)-ethyl]-4,4′-dihydro-xy-3,5,3′,5′-tetramethoxy-2,7′-cyclolignan-7-en-9,9′-diamide (3)
White, amorphous power. −25.0 (c 0.1, MeOH); UV (MeOH) λmax (log ε) 204 (4.12), 248 (0.82), 285 (0.27), 333 (0.45) nm; IR (KBr) νmax 3391, 2920, 2851, 1647, 1611, 1541, 1517, 1465, 1425, 1367, 1278, 1203, 1116, 1035, 932, 888, 829, 801, 722, 650, 599 cm−1; 1H-NMR (acetone-d6, 600 MHz) and 13C-NMR (acetone-d6, 150 MHz) data, see Table 1; Table 2; ESIMS m/z ESIMS m/z 713 [M − H]−; HRESIMS m/z 713.2715 [M − H]− (calcd. for C39H41N2O11, 713.2716).
3.7. (+)-(8S,8′S)-9-O-(E)-Cinnamoyl-secoisolariciresinol (4)
Yellow solid. +18.2 (c 0.05, MeOH); UV (MeOH) λmax (log ε) 204 (4.12), 230 (0.82), 287 (0.39), 329 (0.78) nm; IR (KBr) νmax 3391, 2920, 2850, 1683, 1645, 1608, 1516, 1463, 1428, 1375, 1341, 1272, 1237, 1155, 1119, 1033, 875, 820, 799, 721, 631 cm−1; 1H-NMR (acetone-d6, 500 MHz) and 13C-NMR (acetone-d6, 125 MHz) data, see Table 1; Table 2; ESIMS m/z 567 [M − H]−; HRESIMS m/z 569.2387 [M + H]+ (calcd. for C31H37NO10, 569.2381) and 591.2204 [M + Na]+ (calcd. for C31H36O10Na, 591.2201).
3.8. (+)-(8S,8′S)-9-O-(E)-Feruloyl-5,5′-dimethoxysecoisolariciresinol (5)
Yellow solid. +22.2 (c 0.05, MeOH); UV (MeOH) λmax (log ε) 206 (4.22), 234 (0.84), 284 (0.36), 326 (0.82) nm; IR (KBr) νmax 3394, 2921, 2850, 1696, 1604, 1517, 1461, 1428, 1370, 1328, 1273, 1218, 1161, 1117, 1033, 984, 915, 825, 721, 645, 604 cm−1; 1H-NMR (acetone-d6, 600 MHz) and 13C-NMR (acetone-d6, 150 MHz) data, see Table 1; Table 2; HRESIMS m/z 621.2299 [M + Na]+ (calcd. for C32H38O11Na, 621.2306).
3.9. (+)-(8S,8′S)-9-O-(E)-Feruloyl-secoisolariciresinol (6)
Yellow solid. +25.2 (c 0.1, MeOH); IR (KBr) νmax 3367, 2928, 2855, 1683, 1601, 1516, 1454, 1431, 1375, 1271, 1207, 1154, 1033, 935, 846, 801, 724 cm−1; 1H-NMR (acetone-d6, 600 MHz) and 13C-NMR (acetone-d6, 150 MHz) data, see Table 1; Table 2; HRESIMS m/z 537.2134 [M − H]− (calcd. for C30H33O9, 537.2130).
3.10. (+)-(8R,7′S,8′R)-9′-O-(E)-Feruloyl-5,5′-dimethoxylariciresinol-7-one (7)
Amorphous powder. +19.5 (c 0.1, MeOH); UV (MeOH) λmax (log ε) 211 (4.01), 234 (2.12), 318 (1.96) nm; ECD (MeOH) 331 (Δε − 0.37), 288 (Δε + 0.73), 222 (Δε + 2.01); IR (KBr) νmax 3409, 2940, 2843, 1701, 1665, 1604, 1516, 1461, 1425, 1371, 1323, 1271, 1215, 1169, 1116, 1032, 983, 912, 845, 827, 765, 712, 662 cm−1; 1H-NMR (acetone-d6, 500 MHz) and 13C-NMR (acetone-d6, 125 MHz) data, see Table 1; Table 2; ESIMS m/z 609 [M − H]−; HRESIMS m/z 609.1980 [M − H]− (calcd. for C32H33O12, 609.1978).
3.11. (+)-(8R,7′S,8′R)-9′-O-(E)-Cinnamoyl-5,5′-dimethoxylariciresinol (8)
Amorphous powder. +23.0 (c 0.1, MeOH); IR (KBr) νmax 3425, 2937, 2845, 1703, 1612, 1516, 1461, 1427, 1331, 1282, 1218, 1154, 1117, 1041, 980, 913, 832, 719 cm−1; 1H-NMR (acetone-d6, 600 MHz) and 13C-NMR (acetone-d6, 150 MHz) data, see Table 1; Table 2; HRESIMS m/z 625.2297 [M − H]− (calcd. for C33H37O12, 625.2291).
3.12. 9′-O-(E)-Feruloyl-5,7,5′-trimethoxylariciresinol (9)
Amorphous powder. +21.0 (c 0.1, MeOH); IR (KBr) νmax 3395, 2933, 2849, 1701, 1610, 1517, 1462, 1428, 1372, 1324, 1270, 1214, 1159, 1116, 1033, 983, 909, 831, 703 cm−1; 1H-NMR (acetone-d6, 500 MHz) and 13C-NMR (acetone-d6, 125 MHz) data, Table 1; Table 2; HRESIMS m/z 625.2297 [M − H]− (calcd. for C33H37O12, 625.2291).
3.13. Cytotoxicity Assay
The cytotoxic activity was determined against human colon cancer (HCT-116), human non-small-cell lung carcinoma (NCI-H1650), and human ovarian cancer (A2780) cell lines which were bought from the Cell Bank of Shanghai Institute of Cell Biology (Chinese Academy of Sciences) and originally obtained from the American Type Culture Collection (ATCC, Rockville, MD, USA). Cells were grown in RPMI 1640 (GIBCO, New York, NY, USA) supplemented with 10% fetal calf serum (Life Technologies, Carlsbad, CA, USA), penicillin G (100 U/mL), and streptomycin (100 μg/mL) at 37 °C in a 5% CO2 and seeded in 96-well plates (CLS3635, Corning®, Sigma, Santa Clara, CA, USA) at a cell density of 3000 per well over night, and then were treated with various diluted concentrations (each concentration was arranged triple) of compounds 1–19, which were prepared with DMSO (Sigma) to 100 μM stock solution and stored in −20 °C in advance. After 24 h of treatment, 10 μL of MTT (5 mg/mL in PBS) was then added directly to all wells and the plates were placed in the dark at 37 °C for 3 h incubation. Cell viability was measured by observing absorbance at 570 nm on a SpectraMax190 microplate reader (Molecular Devices, Silicon Valley, CA, USA). IC50 values were calculated using Microsoft Excel software (version 2010, Redmond, WA, USA). Taxol was used as a positive control.
3.14. PTP1B Inhibition Assay
The recombinant GST-hPTP1B (gluthathione S-transferase-human protein tyrosine phosphatase 1B) bacteria pellets were purified by a GST bead column. The dephosphorylation of para-nitrophenyl phosphate (p-NPP) was catalyzed to para-nitrophenol by PTP1B. Enzyme activity involving an end-point assay, which intensified the yellow color, was measured at a wavelength of 405 nm. All compounds were dissolved in 100% dimethyl sulfoxide (DMSO), and reactions, including controls, were performed at a final concentration of 10% DMSO. Selected compounds were first evaluated for their ability to inhibit the PTPase reaction at a 10 μM concentration at 30 °C for 10 min, in a reaction system with 3 mM p-NPP in HEPES assay buffer (pH 7.0). The reaction was initiated by addition of the enzyme and quenched by addition of 1 M NaOH. The amount of the produced p-nitrophenol was determined at 405 nm using a microplate spectrophotometer (uQuant, Bio-Tek, Winooski, VT, USA). IC50 values were evaluated using a sigmoidal dose-response (variable slope) curve-fitting program of GraphPad Prism 4.0 software (La Jolla, CA, USA). Oleanolic acid was used as a positive control.
3.15. Nitric Oxide (NO) Production in RAW264.7 Macrophages
The RAW 264.7 macrophages were cultured in The RPMI 1640 medium (Hyclone, Logan, UT, USA) containing 10% FBS. The compounds were dissolved in DMSO and further diluted in medium to produce different concentrations. The cell mixture and culture medium were dispensed into 96-well plates (2 × 10⁵ cells/well) and maintained at 37 °C under 5% CO2. After preincubation for 24 h, serial dilutions of the test compounds were added into the cells, up to the maximum concentration 25 μM, then added with LPS to a concentration 1 μg/mL and continued to incubate for 18 h. The amount of NO was assessed by determined the nitrite concentration in the cultured RAW264.7 macrophage supernatants with Griess reagent. Aliqueots of supernatants (100 μL) were incubated, in sequence, with 50 μL 1% sulphanilamide and 50 μL 1% naphthylethylenediamine in 2.5% phosphoric acid solution. The sample absorbance was measured at 570 nm by a 2104 Envision Multilabel Plate Reader (PerkinElmer, Inc., Waltham, MA, USA). Dexamethasone was used as a positive control.
4. Conclusions
In summary, bioassay-guided isolation of cytotoxic fractions of the twigs of L. cubeba revealed the presence of nine new lignans 1–9 and ten analogues 10–19. Initially, all of the isolated compounds were evaluated against HCT-116, NCI-H1650, and A2780 tumor cell lines. Of the compounds, only 7′,9-epoxylignans with feruloyl or cinnamoyl group (7–9, 13 and 14) were selectively cytotoxic against NCI-H1650 cell line, with IC50 values of less than 20 μM, whereas, the dibenzylbutyrolactone lignans 17–19 exerted cytotoxicity against HCT-116 and A2780 cell lines, with IC50 values ranging from 0.28 to 18.47 μM. The results highlighted the structure-activity relationship importance of a feruloyl or a cinnamoyl moiety at C-9′ or/and C-7 ketone in 7′,9-epoxylignans. The isolates were also examined for inhibitory activities against PTP1B and LPS-induced NO production in RAW264.7 macrophages. As a result, compound 11 was moderate active toward PTP1B with an IC50 value of 13.5 μM and compounds 4–6, 11 and 12 displayed inhibitions against LPS-induced NO production in RAW264.7 macrophages, with IC50 values of 46.8, 50.1, 58.6, 47.5, and 66.5 μM, respectively. The present results provide additional phytochemical and bioactive information of this medicinal and spiced plant.
Supplementary Materials
The following are available online, IR, UV, HRMS, NMR and ECD spectra of compounds 1–9 as well as other supporting data.
Author Contributions
X.S. conceived and designed the experiments; X.L. and Y.Q. realized the evaluation of bioactivities; H.X., L.W. and G.X. performed the isolation, structural elucidation and wrote the paper; S.L. analyzed the results and revised the paper.
Funding
Financial supports from the Beijing Advanced Innovation Center for Food Nutrition and Human Health, Beijing Technology and Business University (No. 20171040) and the National Natural Science Foundation of China (NNSFC; Nos. 81522050 and 81773589), and the Key projects of the Beijing Natural Sciences Foundation and Beijing Municipal Education Committee (No. KZ201811417049).
Conflicts of Interest
The authors declare no conflict of interest.
References
- National Pharmacopoeia Commission. Chinese Pharmacopoeia; China Medical Science and Technology Press: Beijing, China, 2015. [Google Scholar]
- Editorial Committee of Chinese Materia Medica, State Administration Bureau of Traditional Chinese Medicine. Chinese Materia Medica (Zhonghua Bencao); Shanghai Science & Technology Press: Shanghai, China, 1999. [Google Scholar]
- Zhang, S.Y.; Guo, Q.; Gao, X.L.; Guo, Z.Q.; Zhao, Y.F.; Chai, X.Y.; Tu, P.F. A phytochemical and pharmacological advance on medicinal plant Litsea cubeba (Lauraceae). Chin. J. Chin. Mater. Med. 2014, 39, 769–776. [Google Scholar]
- Li, W.R.; Shi, Q.S.; Liang, Q.; Xie, X.B.; Huang, X.M.; Chen, Y.B. Antibacterial activity and kinetics of Litsea cubeba oil on Escherichia coli. PLoS ONE 2014, 9, e110983. [Google Scholar] [CrossRef] [PubMed]
- Lee, S.S.; Chen, C.K.; Huang, F.M.; Chen, C.H. Two dibenzopyrrocoline alkaloids from Litsea cubeba. J. Nat. Prod. 1996, 59, 80–82. [Google Scholar] [CrossRef]
- Lee, S.S.; Lin, Y.J.; Chen, C.K.; Liu, K.C.S.; Chen, C.H. Quaternary alkaloids from Litsea cubeba and Cryptocarya konishii. J. Nat. Prod. 1993, 56, 1971–1976. [Google Scholar] [CrossRef]
- Wu, Y.C.; Liou, J.Y.; Duh, C.Y.; Lee, S.S.; Lu, S.T. Litebamine, a novel phenanthrene alkalord from Quaternary alkaloids from Litsea cubeba. Tetrahedron Lett. 1991, 32, 4169–4170. [Google Scholar] [CrossRef]
- Feng, T.; Xu, Y.; Cai, X.H.; Du, Z.Z.; Luo, X.D. Antimicrobially active isoquinoline alkaloids from Litsea cubeba. Planta Med. 2009, 75, 76–79. [Google Scholar] [CrossRef]
- Zhang, S.Y.; Guo, Q.; Cao, Y.; Zhang, Y.; Gao, X.L.; Tu, P.F.; Chai, X.Y. Alkaloids from roots and stems of Litsea cubeba. Chin. J. Chin. Mater. Med. 2014, 39, 3964–3968. [Google Scholar]
- Guo, Q.; Bai, R.F.; Su, G.Z.; Zhu, Z.X.; Tu, P.F.; Chai, X.Y. Chemical constituents from the roots and stems of Litsea cubeba. J. Asian Nat. Prod. Res. 2015, 1, 51–58. [Google Scholar]
- Zhang, S.Y.; Zhang, Q.; Guo, Q.; Zhao, Y.F.; Gao, X.L.; Chai, X.Y.; Tu, P.F. Characterization and simultaneous quantification of biological aporphine alkaloids in Litsea cubeba by HPLC with hybrid ion trap time-of-flight mass spectrometry and HPLC with diode array detection. J. Sep. Sci. 2015, 38, 2614–2624. [Google Scholar] [CrossRef]
- Guo, Q.; Zeng, K.W.; Gao, X.L.; Zhu, Z.X.; Zhang, S.Y.; Chai, X.Y.; Tu, P.F. Chemical constituents with NO production inhibitory and cytotoxic activities from Litsea cubeba. J. Nat. Med. 2015, 69, 94–99. [Google Scholar] [CrossRef]
- Lin, B.; Zhang, H.; Zhao, X.X.; Rahman, K.; Wang, Y.; Ma, X.Q.; Zheng, C.J.; Zhang, Q.Y.; Han, T.; Qin, L. Inhibitory effects of the root extract of Litsea cubeba (lour.) pers. on adjuvant arthritis in rats. J. Ethnopharmacol. 2013, 147, 327–334. [Google Scholar] [CrossRef] [PubMed]
- Xie, H.H.; Zhang, F.X.; Wei, X.Y.; Liu, M.F. A review of the studies on Litsea alkaloids. J. Trop. Subtrop. Bot. 1999, 7, 87–92. [Google Scholar]
- Zhang, W.; Hu, J.F.; Lv, W.W.; Zhao, Q.C.; Shi, G.B. Antibacterial, antifungal and cytotoxic isoquinoline alkaloidsfrom Litsea cubeba. Molecules 2012, 17, 12950–12960. [Google Scholar] [CrossRef]
- Wang, L.Y.; Chen, M.H.; Wu, J.; Sun, H.; Liu, W.; Qu, Y.H.; Li, Y.C.; Wu, Y.Z.; Li, R.; Zhang, D.; et al. Bioactive glycosides form the twigs of Litsea cubeba. J. Nat. Prod. 2017, 80, 1808–1818. [Google Scholar] [CrossRef]
- Wang, L.Y.; Qu, Y.H.; Li, Y.C.; Wu, Y.Z.; Li, R.; Guo, Q.L.; Wang, S.J.; Wang, Y.N.; Yang, Y.C.; Lin, S. Water soluble constituents from the twigs of Litsea cubeba. Chin. J. Chin. Mater. Med. 2017, 42, 2704–2713. [Google Scholar]
- Wallis, A.F.A. Stereochemistry of cyclolignan—A revised structure of thomasic acid. Tetrahedron Lett. 1968, 9, 5287–5288. [Google Scholar] [CrossRef]
- Assoumatine, T.; Datta, P.K.; Hooper, T.S.; Yvon, B.L.; Charlton, J.L. A short asymmetric synthesis of (+)-lyoniresinol dimethyl ether. J. Org. Chem. 2004, 69, 4140–4144. [Google Scholar] [CrossRef]
- Chaves, M.H.; Roque, N.F. Amides and lignanamides from Porcelia macrocarpa. Phytochemistry 1997, 46, 879–881. [Google Scholar] [CrossRef]
- Moon, S.S.; Rahman, A.A.; Kim, J.Y.; Kee, S.H. Hanultarin, a cytotoxic lignan as an inhibitor of actin cytoskeleton polymerization from the seeds of Trichosanthes kirilowii. Bioorg. Med. Chem. 2008, 16, 7264–7269. [Google Scholar] [CrossRef]
- Park, H.B.; Lee, K.H.; Kim, K.H.; Lee, I.K.; Noh, H.J.; Choi, S.U.; Lee, K.R. Lignans from the roots of Berberis amurensis. Nat. Prod. Sci. 2009, 15, 17–21. [Google Scholar]
- Zhao, Q.; Liu, J.; Wang, F.N.; Liu, G.F.; Wang, G.Z.; Zhang, K. Lignans from branch of Hypericum petiolulatum. Chin. J. Chin. Mater. Med. 2009, 34, 1373–1376. [Google Scholar]
- Chen, J.J.; Wang, T.Y.; Hwang, T.L. Neolignans, a coumarinolignan, lignan derivatives, and a chromene: Anti-inflammatory constituents from Zanthoxylum avicennae. J. Nat. Prod. 2008, 71, 212–217. [Google Scholar] [CrossRef] [PubMed]
- Chen, T.H.; Huang, Y.H.; Lin, J.J.; Liau, B.C.; Wang, S.Y.; Wu, Y.C.; Jong, T.T. Cytotoxic lignans esters from Cinnamomum osmophloeum. Planta Med. 2010, 76, 613–619. [Google Scholar] [CrossRef]
- Hsiao, J.J.; Chiang, H.C. Lignans from the wood of Aralia bipinnata. Phytochemistry 1995, 39, 899–902. [Google Scholar] [CrossRef]
- Achenbach, H.; Stöcker, M.; Constenla, M.A. Flavonoid and other constituents of Bauhinia manca. Phytochemistry 1988, 27, 1835–1841. [Google Scholar] [CrossRef]
- Duh, C.Y.; Phoebe, C.H., Jr.; Pezzuto, J.M.; Kinghorn, A.D.; Farnsworth, N.R. Plant anticancer agents, XLII. Cytotoxic constituents from Wikstroemia elliptica. J. Nat. Prod. 1986, 49, 706–709. [Google Scholar] [CrossRef]
- Umehara, K.; Sugawa, A.; Kuroyanagi, M.; Ueno, A.; Taki, T. Studies on differentiation-inducers from Arctium Fructus. Chem. Pharm. Bull. 1993, 41, 1774–1779. [Google Scholar] [CrossRef]
- Wang, H.Y.; Yang, J.S. Chemical components from Arctimu lappa. Acta Pharm. Sin. 1993, 28, 911–917. [Google Scholar]
Sample Availability: Samples of the compounds 1–19 are available from the authors. |
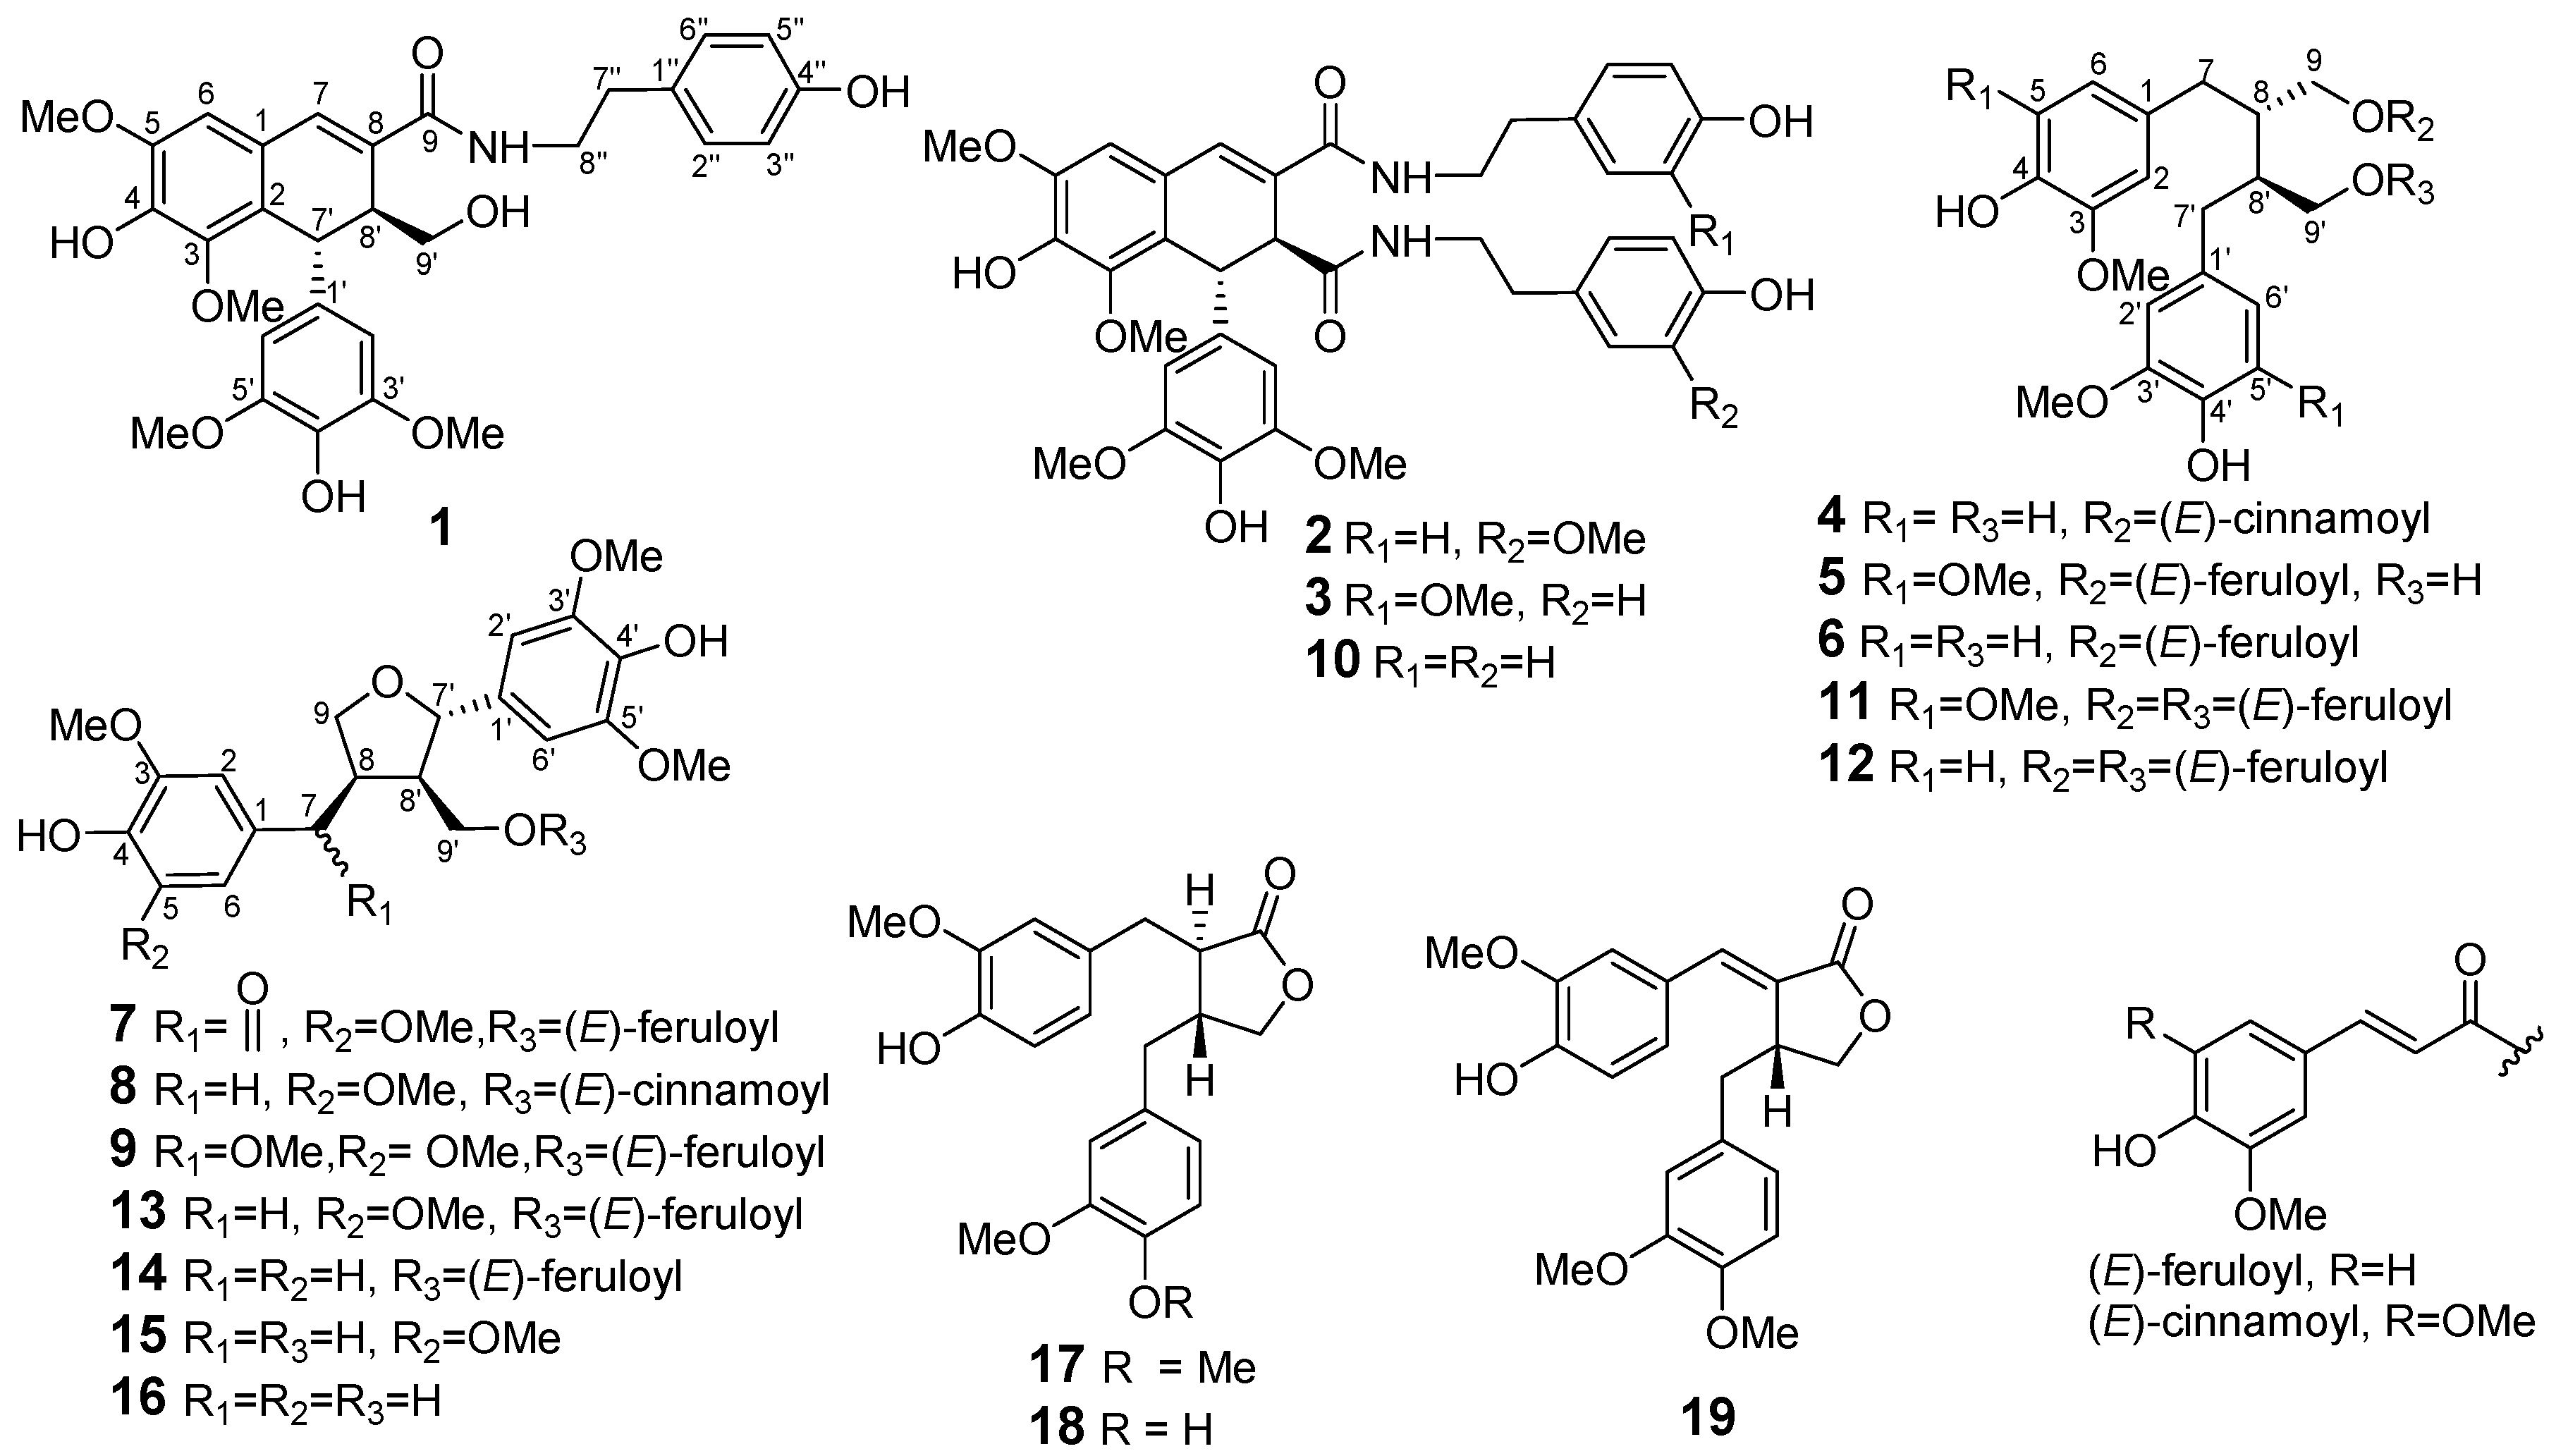
Figure 1.
The structures of compounds 1–19.

Figure 2.
The key HMBC correlations of 1–3.

Figure 3.
The experimental ECD spectrum of 7 (black), and the calculated ECD spectra of (8R,7′S,8′R)-7 (red) and (8S,7′R,8′S)-7 (blue).
Figure 3.
The experimental ECD spectrum of 7 (black), and the calculated ECD spectra of (8R,7′S,8′R)-7 (red) and (8S,7′R,8′S)-7 (blue).


Table 1.
1H-NMR Data (δH (mult, J, Hz)) of Compounds 1–9 in Acetone-d6 a.
| No. | 1 | 2 | 3 | 4 | 5 | 6 | 7 | 8 | 9 |
|---|---|---|---|---|---|---|---|---|---|
| 2 | 6.71 d (1.5) | 6.42 s | 6.70 d (1.8) | 7.39 s | 6.57 s | 6.67 s | |||
| 5 | 6.71 d (7.5) | 6.71 d (7.8) | |||||||
| 6 | 6.74 s | 6.69 s | 6.60 s | 6.61 dd (7.5, 1.5) | 6.42 s | 6.61 dd (7.8, 1.8) | 7.39 s | 6.57 s | 6.67 s |
| 7 | 7.19 s | 7.18 s | 7.21 s | 2.80 dd (13.5, 7.0); 2.62 dd (13.5, 8.0) | 2.79 dd (14.2, 7.2); 2.62 dd (14.2, 8.4) | 2.80 dd (13.8, 6.6); 2.62 dd (13.8, 8.4) | 2.91 dd (13.2, 5.4); 2.59 dd (13.2, 10.2) | 4.35 d (6.5) | |
| 8 | 2.32 m | 2.31 m | 2.31 m | 4.57 m | 2.82 m | 2.84 m | |||
| 9 | 4.36 dd (11.5, 6.5); 4.11 dd (11.5, 6.0) | 4.42 dd (10.8, 6.0); 4.10 dd (10.8, 6.0) | 4.36 dd (11.4, 6.6); 4.11 dd (11.4, 6.0) | 4.35 t (8.0); 4.22 t (8.0) | 4.04 dd (8.4, 6.6); 3.74 dd (8.4, 6.6) | 4.14 t (8.5); 4.04 t (8.5) | |||
| 2′ | 6.39 s | 6.38 s | 6.38 s | 6.73 d (1.5) | 6.44 s | 6.73 d (1.8) | 6.78 s | 6.68 s | 6.63 s |
| 5′ | 6.69 d (7.5) | 6.69 d (7.8) | |||||||
| 6′ | 6.39 s | 6.38 s | 6.38 s | 6.61 dd (7.5, 1.5) | 6.44 s | 6.61 dd (7.8, 1.8) | 6.78 s | 6.68 s | 6.63 s |
| 7′ | 4.62 s | 5.03 s | 5.03 s | 2.70 dd (13.5, 7.0); 2.63 dd (13.5, 8.0) | 2.70 dd (14.2, 7.2); 2.63 dd (14.2, 8.4) | 2.70 dd (13.8, 6.6); 2.63 dd (13.8, 8.4) | 4.74 d (7.5) | 4.82 d (5.5) | |
| 8′ | 3.14 dd (7.5, 7.5) | 3.66 s | 3.67 s | 1.99 m | 1.99 m | 1.99 m | 3.01 m | 2.61 m | |
| 9′ | 3.59 m 3.28 m | 3.67 m; 3.59 m | 3.67 m; 3.61 m | 3.69 m; 3.59 m | 4.16 d (6.5) | 4.53 dd (11.4, 6.6); 4.30 dd (11.4, 7.8) | |||
| 2′′ | 6.98 d (8.5) | 6.98 d (8.5) | 6.79 d (1.8) | 7.00 s | 7.32 d (1.8) | 7.32 d (1.8) | 7.06 d (1.5) | 6.98 s | 7.27 d (2.0) |
| 3′′ | 6.71 d (8.5) | 6.72 d (8.5) | |||||||
| 5′′ | 6.71 d (8.5) | 6.72 d (8.5) | 6.71 d (7.8) | 6.86 d (8.4) | 6.81 d (8.4) | 6.82 d (8.5) | 6.85 d (8.0) | ||
| 6′′ | 6.98 d (8.5) | 6.98 d (8.5) | 6.61 dd (7.8, 1.8) | 7.00 s | 7.13 dd (8.4, 1.8) | 7.13 dd (8.4, 1.8) | 6.96 dd (8.5, 1.5) | 6.98 s | 7.11 dd (8.0, 2.0) |
| 7′′ | 2.69 t (7.5) | 2.70 t (7.0) | 2.72 t (7.2) | 7.58 d (15.6) | 7.57 d (15.6) | 7.16 d (16.0) | 7.47 d (16.2) | 7.49 d (15.5) | |
| 8′′ | 3.39 dt (7.4, 4.5) | 3.41 t (6.0) | 3.47 m, 3.39 m | 6.42 d (15.6) | 6.41 d (15.6) | 5.89 d (16.0) | 6.39 d (16.2) | 6.34 d (15.5) | |
| 2′′′ | 6.79 d (1.5) | 6.93 d (8.4) | |||||||
| 3′′′ | 6.70 d (8.4) | ||||||||
| 5′′′ | 6.69 d (8.0) | 6.70 d (8.4) | |||||||
| 6′′′ | 6.55 dd (8.0, 1.5) | 6.93 d (8.4) | |||||||
| 7′′′ | 2.58 t (7.0) | 2.56 t (7.2) | |||||||
| 8′′′ | 3.28 t (7.0) | 3.29 m, 3.21 m | |||||||
| OMe-3 | 3.58 s | 3.69 s | 3.69 s | 3.75 s | 3.73 s | 3.75 s | 3.84 s | 3.79 s | 3.80 s |
| OMe-5 | 3.86 s | 3.85 s | 3.85 s | 3.73 s | 3.84 s | 3.79 s | 3.80 s | ||
| OMe-7 | 3.17 s | ||||||||
| OMe-3′ | 3.67 s | 3.67 s | 3,67 s | 3.75 s | 3.73 s | 3.75 s | 3.83 s | 3.88 s | 3.77 s |
| OMe-5′ | 3.67 s | 3.67 s | 3.67 s | 3.73 s | 3.83 s | 3.88 s | 3.77 s | ||
| OMe-3′′ | 3.78 s | 3.88 s | 3.91 s | 3.90 s | 3.91 s | 3.79 s | 3.91 s | ||
| OMe-5′′ | 3.88 s | 3.79 s | |||||||
| OMe-3′′′ | 3.80 s | ||||||||
| OH-4 | 7.76 s | 7.78 s | 7.79 s | 7.29 s | 6.91 s | 7.27 s | 7.09 s | ||
| OH-4′ | 6.90 s | 6.91 s | 6.91 s | 7.26 s | 6.89 s | 7.24 s | 6.98 s | ||
| OH-4′′ | 8.08 s | 7.21 s | 7.75 s | 8.15 s | 8.12 s | 7.77 s | |||
| OH-4′′′ | 7.26 s | 8.07 s | |||||||
| NH | 7.45 t (4.5) | 7.81 t (4.5), 7.59 t (4.5) | 7.72 t (4.5), 7.59 t (4.5) |
a1H-NMR data (δ) were measured at 600 MHz or 500 MHz. The assignments were based on 1H-1H COSY, HSQC, and HMBC experiments.
Table 2.
13C-NMR Data (δC) for Compounds 1–9 in Acetone-d6 a.
| No. | 1 | 2 | 3 | 4 | 5 | 6 | 7 | 8 | 9 |
|---|---|---|---|---|---|---|---|---|---|
| 1 | 132.0 | 123.8 | 123.8 | 132.9 | 132.4 | 132.9 | 129.6 | 131.8 | 134.5 |
| 2 | 124.6 | 126.5 | 126.5 | 113.2 | 107.2 | 113.2 | 107.2 | 106.9 | 106.9 |
| 3 | 147.0 | 146.4 | 146.4 | 148.1 | 148.5 | 148.1 | 148.4 | 148.9 | 148.5 |
| 4 | 141.8 | 142.4 | 142.4 | 145.5 | 134.9 | 145.5 | 142.2 | 135.2 | 136.0 |
| 5 | 148.2 | 148.1 | 148.1 | 115.5 | 148.5 | 115.5 | 148.4 | 148.9 | 148.5 |
| 6 | 108.0 | 108.3 | 108.2 | 122.3 | 107.2 | 122.3 | 107.2 | 106.9 | 106.9 |
| 7 | 131.5 | 132.5 | 133.6 | 35.4 | 35.9 | 35.4 | 198.2 | 34.2 | 82.6 |
| 8 | 124.4 | 128.3 | 128.4 | 40.7 | 40.6 | 40.8 | 47.6 | 43.6 | 48.1 |
| 9 | 169.1 | 169.8 | 169.6 | 65.2 | 65.2 | 65.2 | 71.1 | 73.3 | 70.3 |
| 1′ | 135.9 | 135.1 | 135.1 | 133.4 | 131.8 | 133.4 | 132.9 | 134.6 | 131.7 |
| 2′ | 106.4 | 106.4 | 106.4 | 113.2 | 107.3 | 113.2 | 104.7 | 104.3 | 104.4 |
| 3′ | 148.3 | 148.4 | 148.4 | 148.1 | 148.5 | 148.1 | 148.6 | 148.7 | 148.8 |
| 4′ | 135.3 | 135.5 | 135.5 | 145.6 | 135.0 | 145.5 | 136.3 | 136.0 | 136.5 |
| 5′ | 148.3 | 148.4 | 148.4 | 115.4 | 148.5 | 115.4 | 148.6 | 148.7 | 148.8 |
| 6′ | 106.4 | 106.4 | 106.4 | 122.3 | 107.3 | 122.3 | 104.7 | 104.3 | 104.4 |
| 7′ | 39.0 | 39.5 | 39.6 | 34.9 | 35.4 | 35.0 | 84.9 | 84.5 | 85.1 |
| 8′ | 46.1 | 49.1 | 49.1 | 44.1 | 44.1 | 44.2 | 51.5 | 50.3 | 49.4 |
| 9′ | 64.6 | 171.4 | 171.4 | 62.1 | 62.1 | 62.1 | 62.8 | 63.4 | 63.6 |
| 1′′ | 131.2 | 131.1 | 131.7 | 126.1 | 127.4 | 127.5 | 127.2 | 126.0 | 127.3 |
| 2′′ | 130.5 | 130.6 | 113.1 | 106.8 | 111.3 | 11.3 | 111.0 | 106.7 | 111.3 |
| 3′′ | 116.0 | 116.1 | 148.2 | 148.9 | 148.7 | 148.8 | 148.6 | 148.6 | 148.7 |
| 4′′ | 156.6 | 156.7 | 145.9 | 139.4 | 150.1 | 150.1 | 149.9 | 139.5 | 150.1 |
| 5′′ | 116.0 | 116.1 | 115.7 | 148.9 | 116.1 | 116.0 | 115.9 | 148.6 | 116.1 |
| 6′′ | 130.5 | 130.6 | 122.0 | 106.8 | 123.9 | 124.0 | 123.7 | 106.7 | 123.8 |
| 7′′ | 35.6 | 35.5 | 36.0 | 145.9 | 145.6 | 145.6 | 145.6 | 146.2 | 145.8 |
| 8′′ | 42.2 | 42.4 | 42.3 | 116.2 | 116.0 | 116.0 | 115.1 | 115.9 | 114.8 |
| 9′′ | 167.5 | 167.6 | 167.5 | 166.7 | 167.3 | 167.3 | |||
| 1′′′ | 131.8 | 131.2 | |||||||
| 2′′′ | 113.0 | 130.6 | |||||||
| 3′′′ | 148.2 | 116.0 | |||||||
| 4′′′ | 145.8 | 156.6 | |||||||
| 5′′′ | 115.6 | 116.0 | |||||||
| 6′′′ | 122.0 | 130.6 | |||||||
| 7′′′ | 36.1 | 35.7 | |||||||
| 8′′′ | 41.9 | 42.1 | |||||||
| OMe-3 | 60.4 | 60.3 | 60.3 | 56.5 | 56.5 | 56.1 | 56.7 | 56.6 | 56.6 |
| OMe-5 | 56.5 | 56.2 | 56.2 | 56.5 | 56.7 | 56.6 | 56.6 | ||
| OMe-7 | 56.1 | ||||||||
| OMe-3′ | 56.6 | 56.7 | 56.7 | 56.1 | 56.4 | 56.1 | 56.6 | 56.7 | 56.6 |
| OMe-5′ | 56.6 | 56.7 | 56.7 | 56.4 | 56.6 | 56.7 | 56.6 | ||
| OMe-3′′ | 56.5 | 56.7 | 56.3 | 56.3 | 56.3 | 56.6 | |||
| OMe-5′′ | 56.7 | 56.6 | |||||||
| OMe-3′′′ | 56.6 |
a13C-NMR data (δ) were measured at 150 MHz or 125 MHz. The assignments were based on 1H-1H COSY, HSQC, and HMBC experiments.
Table 3.
Cytotoxicity of Compounds 1–19 to HCT-116, NCI-H1650, and A2780 Cell Lines.
| Compound | IC50 (μM) | ||
|---|---|---|---|
| HCT-116 | NCI-H1650 | A2780 | |
| 1 | >20 | >20 | >20 |
| 2 | >20 | >20 | >20 |
| 3 | >20 | >20 | >20 |
| 4 | >20 | >20 | >20 |
| 5 | >20 | >20 | >20 |
| 6 | >20 | >20 | >20 |
| 7 | >20 | 2.47 | >20 |
| 8 | >20 | 11.25 | >20 |
| 9 | >20 | 13.16 | >20 |
| 10 | >20 | >20 | >20 |
| 11 | >20 | >20 | >20 |
| 12 | >20 | >20 | >20 |
| 13 | >20 | 9.68 | >20 |
| 14 | >20 | 10.52 | >20 |
| 15 | >20 | >20 | >20 |
| 16 | >20 | >20 | >20 |
| 17 | 3.25 | >20 | 0.28 |
| 18 | 13.95 | >20 | 1.53 |
| 19 | 18.47 | >20 | 12.8 |
| Taxol a | 0.005 | 1.28 | 0.02 |
a Taxol was used as a positive control.
© 2019 by the authors. Licensee MDPI, Basel, Switzerland. This article is an open access article distributed under the terms and conditions of the Creative Commons Attribution (CC BY) license (http://creativecommons.org/licenses/by/4.0/).
Share and Cite
MDPI and ACS Style
Li, X.; Xia, H.; Wang, L.; Xia, G.; Qu, Y.; Shang, X.; Lin, S. Lignans from the Twigs of Litsea cubeba and Their Bioactivities. Molecules 2019, 24, 306. https://doi.org/10.3390/molecules24020306
AMA Style
Li X, Xia H, Wang L, Xia G, Qu Y, Shang X, Lin S. Lignans from the Twigs of Litsea cubeba and Their Bioactivities. Molecules. 2019; 24(2):306. https://doi.org/10.3390/molecules24020306
Chicago/Turabian StyleLi, Xiuting, Huan Xia, Lingyan Wang, Guiyang Xia, Yuhong Qu, Xiaoya Shang, and Sheng Lin. 2019. "Lignans from the Twigs of Litsea cubeba and Their Bioactivities" Molecules 24, no. 2: 306. https://doi.org/10.3390/molecules24020306