Ultrasound-Assisted Osmotic Dehydration of Apples in Polyols and Dihydroxyacetone (DHA) Solutions


1
Department of Food Engineering and Process Management, Warsaw University of Life Sciences SGGW, Nowoursynowska 159c, 02-776 Warsaw, Poland
2
Department of Biotechnology, Microbiology and Food Evaluation, Warsaw University of Life Sciences WULS-SGGW, 159c Nowoursynowska St., 02-776 Warsaw, Poland
3
Institute of Agricultural Engineering, Wrocław University of Environmental and Life Sciences, 37/41 Chełmońskiego Street, 51 630 Wrocław, Poland
*
Author to whom correspondence should be addressed.
Molecules 2019, 24(19), 3429; https://doi.org/10.3390/molecules24193429
Submission received: 31 August 2019
/
Revised: 18 September 2019
/
Accepted: 19 September 2019
/
Published: 21 September 2019
(This article belongs to the Special Issue Physicochemical Properties of Food)
Abstract
:The aim of this work was to analyse the effect of ultrasound-assisted osmotic dehydration of apples v. Elise on mass transfer parameters, water activity, and colour changes. Ultrasound treatment was performed at a frequency of 21 kHz with a temperature of 40 °C for 30–180 min using four osmotic solutions: 30% concentrated syrups of erythritol, xylitol, maltitol, and dihydroxyacetone (DHA). The efficiency of the used solutes from the polyol groups was compared to reference dehydration in 50% concentrated sucrose solution. Peleg’s model was used to fit experimental data. Erythritol, xylitol, and DHA solutions showed similar efficiency to sucrose and good water removal properties in compared values of true water loss. The application of ultrasound by two methods was in most cases unnoticeable and weaker than was expected. On the other hand, sonication by the continuous method allowed for a significant reduction in water activity in apple tissue in all tested solutions.
1. Introduction
Osmotic dehydration (OD) is a simple technique for removal of water from fruits and vegetables, although a more correct term is “osmotic dewatering” since the final product still has a high moisture content. However, the amount of water remaining in the material does not ensure its stability, as water activity is generally higher than 0.9 [1]. This partial dehydration is performed by immersion of the fruit or vegetable material in a concentrated aqueous solution, where there are two major simultaneous countercurrent flows: one flow of solutes from the solution into the food matrix and another from the food into the osmotic solution (principally water) [2]. OD is usually used as a pre-treatment before drying and preserves texture and colour [1]. The relevance of osmotic dehydration is chiefly related to the improvement of some nutritional, functional, and organoleptic properties of the product [3]. Recently, different substances such as sweeteners or sweetness enhancer were proposed as an alternative to the use of sucrose. One of them was steviol glycoside, the additive which was used in OD [4]. Researchers also focused on solutes from the polyol groups, such as xylitol, erythritol, and maltitol [5,6,7]. The use of sugar alcohol during pre-treatment can reduce sugar content in the product, resulting in the reduction of calories [8].
Ultrasound is an example of a new form of technology, and its application in food processing are numerous and include among others pre-treatment in extractions, freezing, drying, defoaming, cleaning, depolymerization, disaggregation, and inactivation of microorganisms [9]. Primarily, ultrasonic waves with high power at low frequency (20–100 kHz) are applied at a minimal temperature to stimulate a rapid series of alternative expansions and compressions, resulting in the removal of moisture and providing a sponge-like effect [3]. The stress can generate micro-cracks in the internal structure, producing micro-channels that facilitate moisture transport. Moreover, high-intensity ultrasound can produce cavitation in the liquid fraction and the asymmetric implosion of cavitation bubbles near to the solid surface, leading to a partial release of some water bounded to the solid structure. All these mechanical effects result in a reduction in the internal resistance to mass transport and, therefore, an increase in the internal diffusion of water [10]. Ultrasound also induces changes on the cell structure, but in contrast to osmotic dehydration no cell breakdown is observed, and the increase in diffusivity is attained by the formation of microscopic channels in the cell structure, which also offer lower resistance to diffusion of water, pigments and soluble solids [11]. The beneficial use of sound is realized through its chemical, mechanical, or physical effects on the process or product [9]. The application of continuous high-frequency ultrasound enhances the mass transfer rate during osmo-concentration. Ultrasound in combination with high sugar concentration speeds up the rate of water withdrawal from the tissue and may significantly reduce the osmo-dehydration time [3,12]. Ultrasound application may also change the viscosity and surface tension, and deform porous solid materials. During ultrasound application, no increase of intercellular spaces has been reported in the literature [11]. Nowacka et al. [13] investigated the utilization of ultrasound as a mass transfer-enhancing method prior to drying of apple tissue. The ultrasound treatment caused a reduction of the drying time by 31–40% in comparison to untreated tissue.
The aim of this study was to investigate the effect of the application of ultrasound (using two methods—continuous and with intervals) during osmotic dehydration in polyols solutions on the mass transfer and water removal from apple tissue. The influences of ultrasound treatment on water activity and colour changes during the process were analysed as well.
2. Results and Discussion
2.1. Water Content (WC)
The raw apple tissue was characterized by a water content (WC) of 5.69 ± 0.25 g H2O/g dry matter (Table 1). With the increase of time followed loss of WC in fruit. The lowest values were observed after OD in the reference dehydration in sucrose solution; at the end of the process, the WC was reduced to 1.79 ± 0.2 g H2O/g d.m. A 50% reduction in the WC of raw apple was obtained after 60 min in the case where sucrose used as osmotic agent (except OD with interval sonication), and after 120 min and 150 min in the case of erythritol and xylitol, respectively (Table 1). Simal et al. [14] dehydrated apple cubes in 70°. Brix sucrose solution. They reported a 50% reduction in water content after 150, 105, 90, and 75 min at 40, 50, 60, and 70 °C, respectively. Application of ultrasound allowed for this time to be reduced to 105, 90, 60, and 50 min, respectively.
Osmotic dehydration in maltitol and DHA solutions resulted in a lower level of reduction water content—at the end of the process values of water content were higher than 3 g H2O/g d.m., while in the case of sucrose, water content was at the level of about 2 g H2O/g d.m. (Table 1). In almost all cases the highest values of water content were noted for OD with the application of ultrasound by the interval method. However, statistical analysis did not show any differences between the values of WC achieved in the case of sonication (continuous method), compared to after OD without treatment (Table 2). Moreover, the application of ultrasound by the interval method resulted in an increase of the observed values. This phenomenon is most noticeable in the case of OD in DHA solution (Table 1). Similar results were reported by Nowacka et al. [13], who stated that with the increase in the applied treatment time of ultrasound (from 10 to 30 min) there was a loss of dry matter in fruit and the changes were significant compared to untreated samples. Additionally, the change of ultrasound frequency resulted in a dry matter decrease. Namely, the application of 21 kHz, which was also used in the present research, led to higher changes than using 35 kHz [15]. Mierzwa and Kowalski [16] reported that the most effective period of dehydration took place in the first 30 min of the process, regardless of the type of osmotic agent (fructose/sorbitol) and the variant of the process (with or without sonication).
Phisut et al. [17] dehydrated cantaloupe by two methods: slow and fast osmotic dehydration (SOD and FOD, respectively). In FOD, the cantaloupe slices were immersed continuously in 50° Brix sucrose solution for 24 h, but in SOD, the cantaloupe slices were first immersed in 30° Brix sucrose solution for 24 h and the slices were then transferred to a 40° Brix sucrose solution for 24 h. After that, the slices were transferred to a 50° Brix sucrose solution for another 24 h. No difference in moisture content was found between sample produced by FOD and SOD (p-value >0.05). The same results were achieved by Fei et al. [18], who osmo-dehydrated button mushrooms. The water contents in ultrasound-assisted osmo-dehydrated samples and OD samples showed no significant differences, but they were lower than in control samples.
Osmotic dehydration supported in ultrasonic pre-treatment can result in different behaviour of the fruit: gaining or losing water during pre-treatment. For example bananas, sapotas, papayas, and jenipapos gained water during ultrasound treatment. However, melons and pineapples lost a small amount of water during pretreatment [11]. Simal et al. [14] reported that apple cubes subjected to sucrose and treated by ultrasound, dewatered faster than non-treated samples. Water and solute transport rates were significantly higher in sonicated samples in comparison with those not sonicated during osmotic dehydration. The higher water content after sonication in the present research (Table 1, compared to osmo-treated samples) could be explained by the higher the loss of soluble solids from the tissue.
2.2. Water Loss (WL)
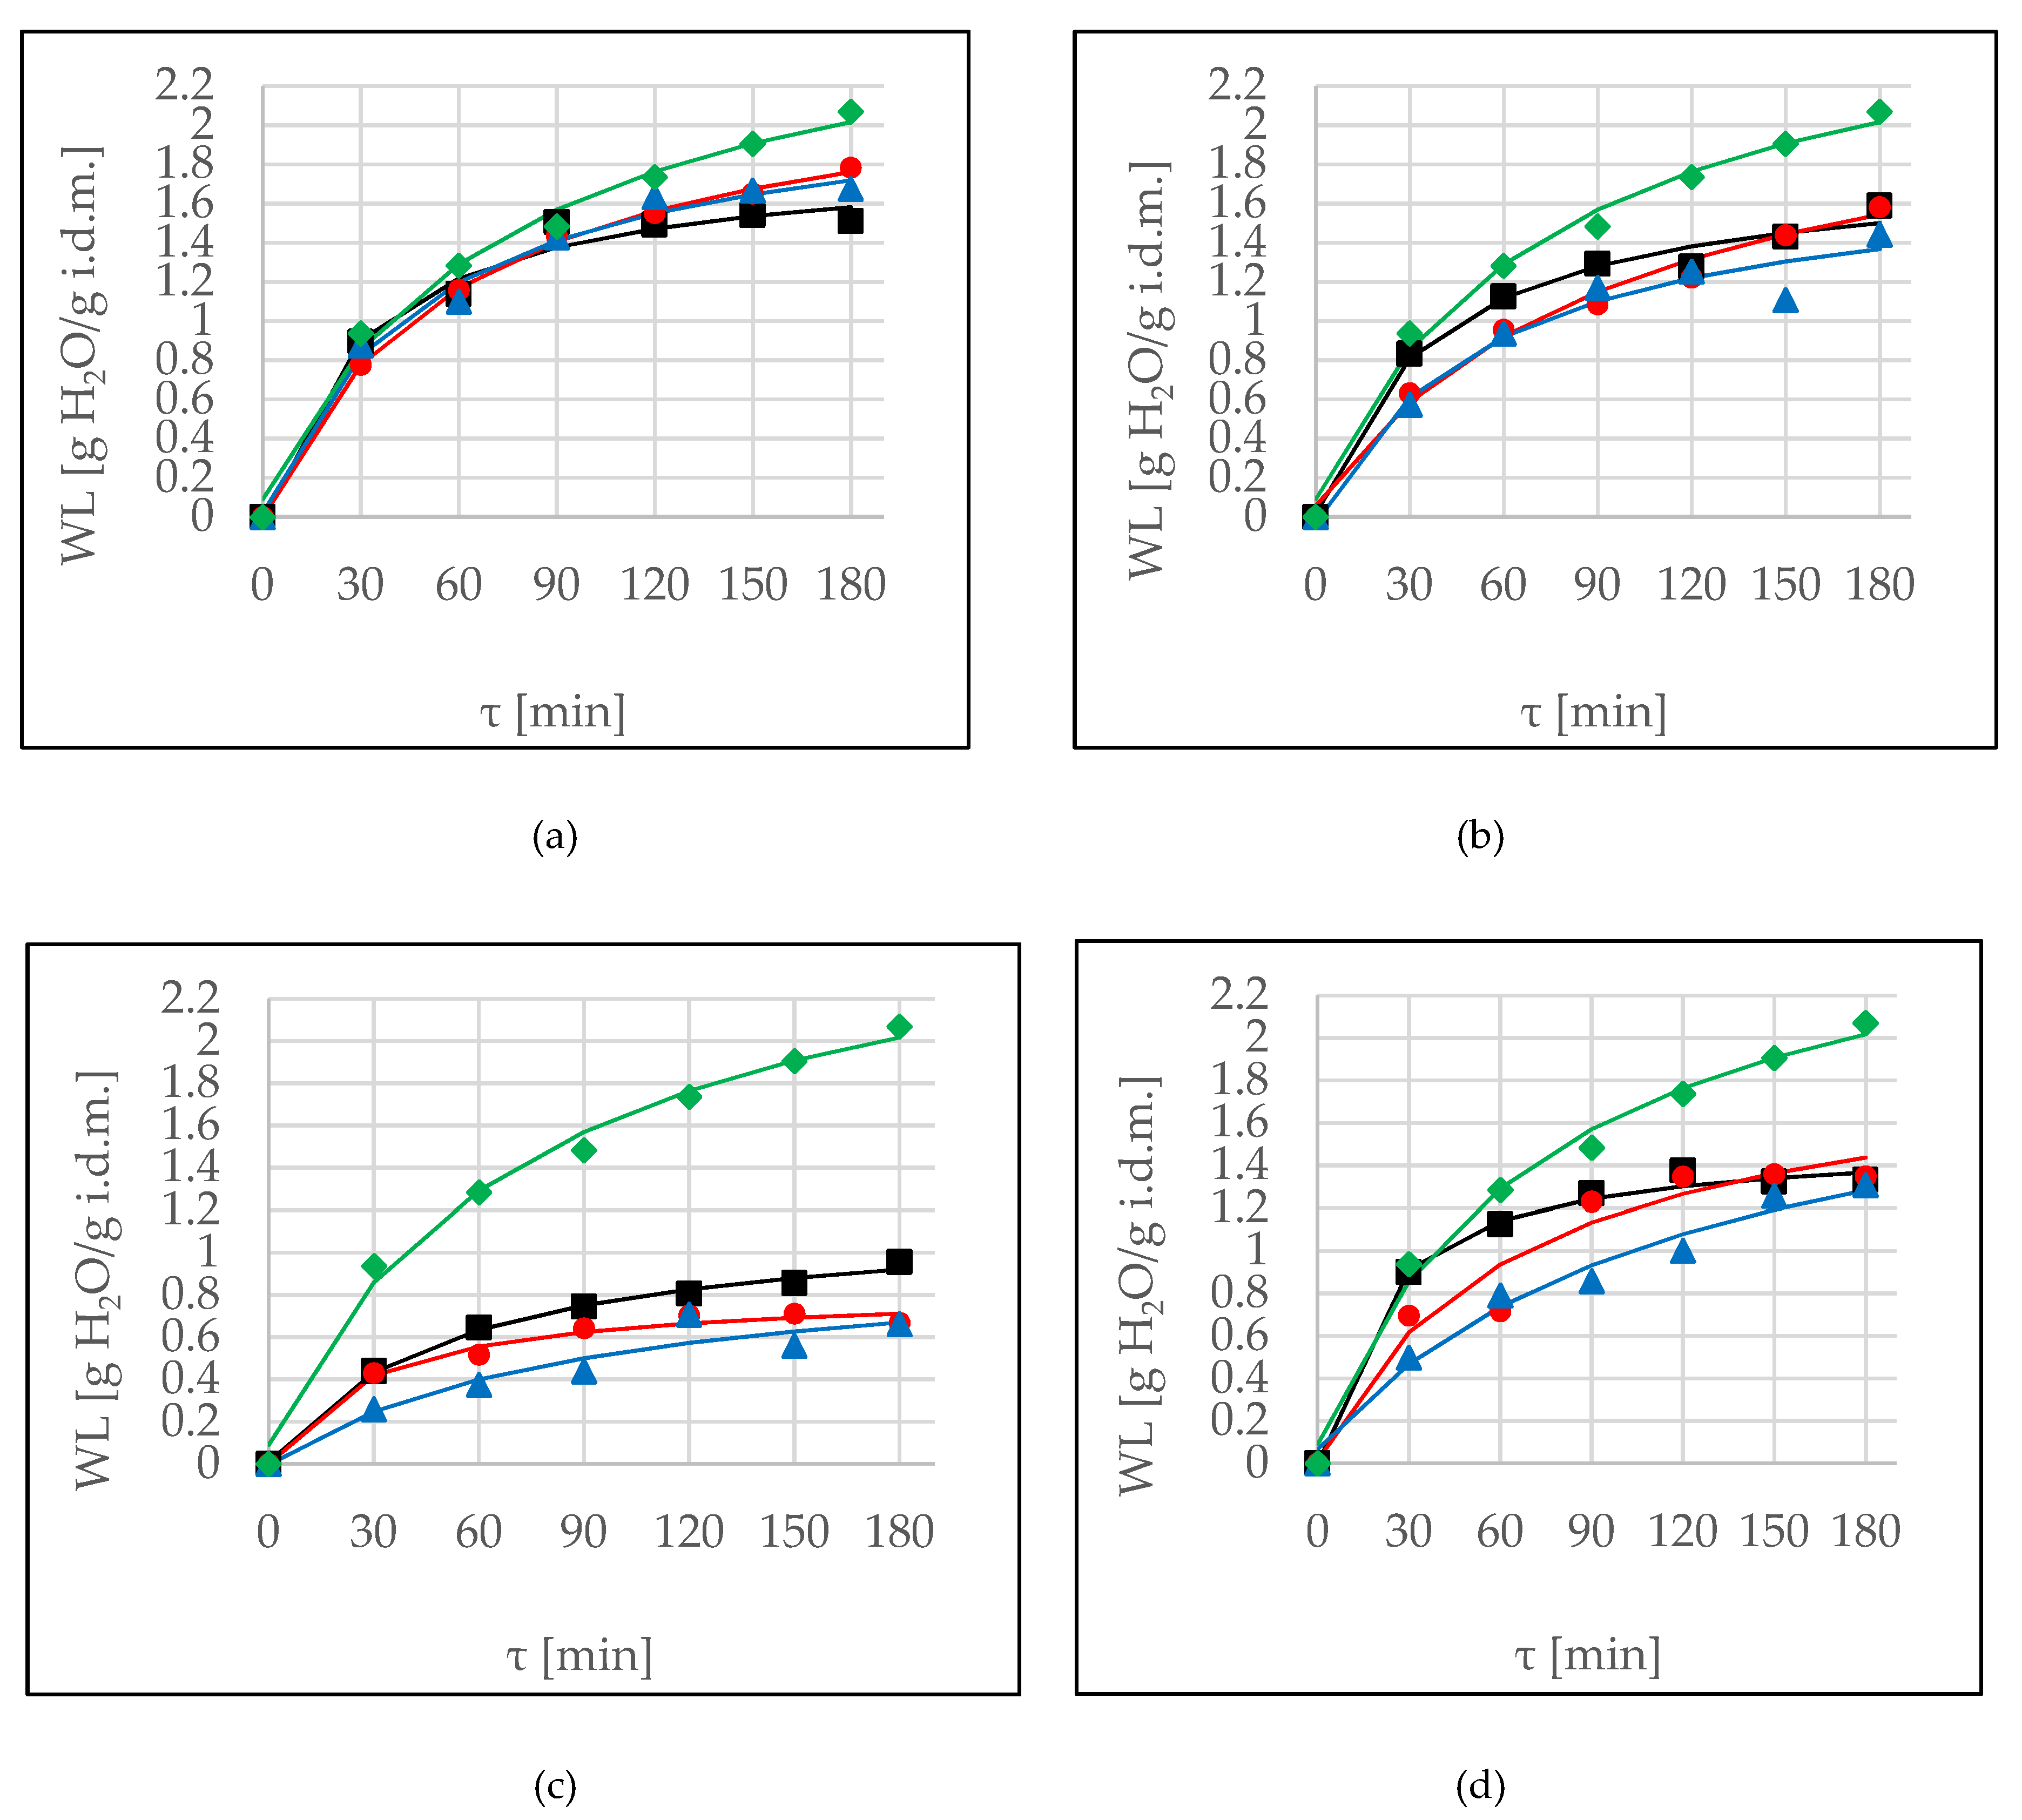
Water loss is a parameter which allows for the evaluation of the effectiveness of osmotic dehydration. In the case of OD, in sucrose solution the achieved values were the highest (Figure 1, green lines). This observation remained in agreement with research by Nowacka et al. [4], where the highest water loss was noticed for samples treated in sucrose as compared to trehalose and with the addition of steviol glycoside.
Among the tested solutions, the most comparable WL values were noted when erythritol was used as the osmotic agent (Figure 1a). At the end of the process, observed values were in the range of 1.6–1.8 g H2O/g initial dry matter. This is because of erythritol having a lower molecular weight than other osmotic agents (xylitol, sucrose, maltitol) do. The use of hypertonic solution, which has low molecular weight, increased the phenomenon of water loss [6]. In this case there was no significant influence of sonication (p-value = 0.276). The second most effective osmotic agent, which can be used as an alternative to sucrose, proved to be xylitol (Figure 1b). However, application of ultrasound (both methods) resulted in a decrease of WL values. A similar situation was observed in the case of OD in maltitol solution (Figure 1c). Moreover, due to low values of WL, this solute at a tested concentration of 30% was considered to be ineffective. However, Phisut et al. [8] in the case of cantaloupe noted higher water loss and a solid gain in maltitol-treated sample compared to a sucrose-treated sample when a 50% concentrated solution was used.
The opposite results were reported by Mierzwa and Kowalski [16] during ultrasound-assisted OD in fructose solution (40% concentration), achieving noticeably higher values (compared to untreated samples). Also, Nowacka et al. [4] reported that ultrasound pre-treatment led to a significant increase in water loss during OD of cranberries. After 90 min, papaya subjected to ultrasound resulted in the largest loss of water (11.92%), while at shorter ultrasound treatment time the water loss was lower. However, between OD and ultrasound-assisted OD samples no statistical differences were found [19]. Simal et al. [14] reported the applicability of sonication to osmotic dehydration of porous fruit such as apple cubes and showed that the rates of mass transfer increase with the use of ultrasound in comparison with the osmotic process carried out under dynamic conditions involving 50 RPM of agitation.
Continuous sonication method during OD in DHA solution (Figure 1d) did not influence significantly on achieved values, while the interval method resulted in weakness of the phenomenon. In almost all cases (except point 180 min for xylitol) the processing time had a significant influence on observed values up to 120 min. The further prolonging of the process did not affect the parameter increase. Multifactor ANOVA confirmed the significant influence of all of the factors: time, type of osmotic agent, and method of application on achieved values (Table 3).
Modeling of WL kinetics by Peleg’s model was efficient in all of the cases. High R2 values, low values of the root mean square error (RMSE), and coefficient of residual variation (CRV) <20% means that this model can be used for prediction of WL (Table 4). During the application of ultrasound in almost all cases, an increase of the k1 parameter was observed as well as a decrease of the k2 parameter. This means that an initial mass transfer rate at the beginning of the process was weaker under sonication. However, the k2 defined the equilibrium value of WL (and soluble solids) [6], and consequently the water removal was higher under pre-treatment. Observed values of k2 parameter were higher compared to OD in sucrose, on the other hand, the value of k1 in control OD was low, which means high dehydration rate at the very beginning of the process (Table 4).
2.3. Solid Gain (SG)
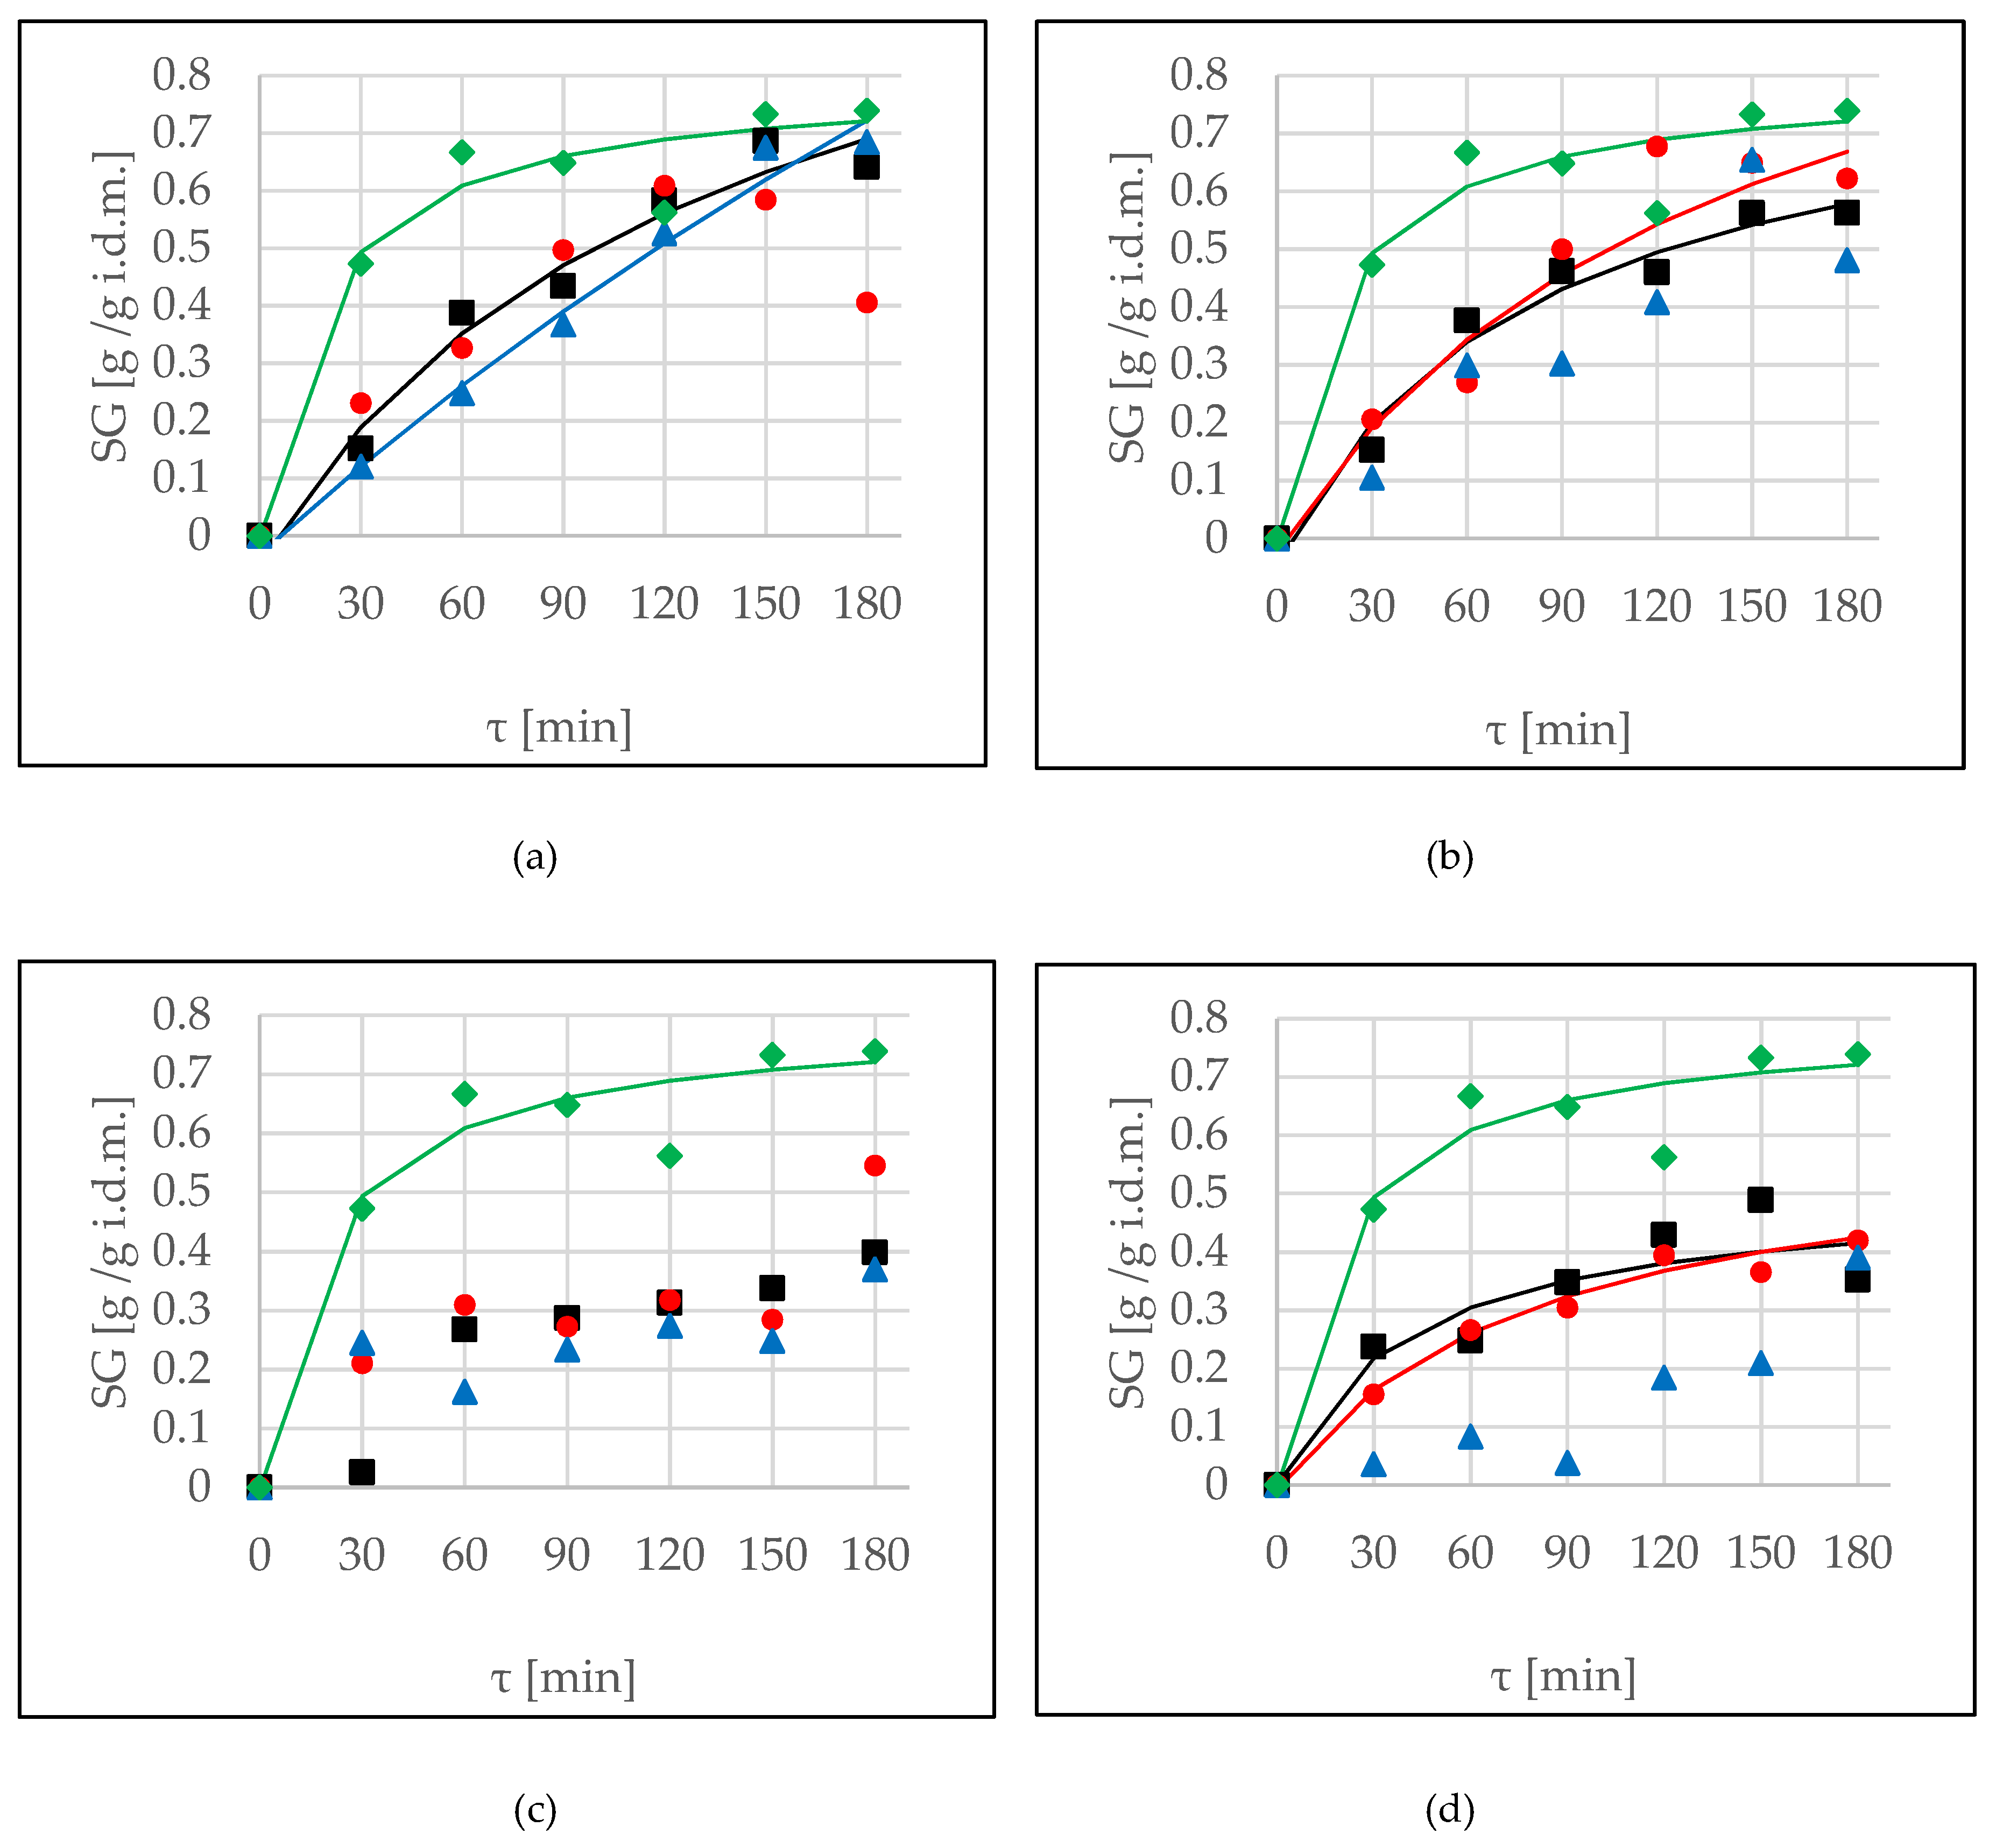
During OD, the phenomenon of solid gain was also observed. The main aim of this research was to remove water (as much as possible) from the apple tissue, not to enrich it in additional compounds. Figure 2 shows kinetics of SG using different osmotic agents during osmotic dehydration and ultrasound application by two methods. Similarly to the WL parameter discussed above, sonication did not have significance in achieved values of SG in the case of OD in erythritol (p-value 0.182) (Figure 2a). The interval method of US application did not cause significant differences compared to values without treatment in the cases of use of xylitol and maltitol solutions (Figure 2b,c). In these cases, sonication by continuous method resulted in an increase of SG values. The kinetics of OD in xylitol solution (Figure 2b) were similar to the kinetics of 50% concentrated glycerol at 25 °C [20]. Moreover, the kinetics of OD together with sonication by the interval method were similar to those of OD in 60% concentrated glycerol at 35 °C [20]. A different behaviour of apple tissue was observed during OD in DHA solution (Figure 2d). The interval method significantly decreased values of SG, whereas the values achieved during the continuous method of ultrasound application were classified into one homogenous group with those which were obtained after OD without sonication. Also, Fei et al. [18] reported that the solid gain in the OD samples was significantly higher (p < 0.05) than that in the ultrasound-assisted OD samples. This result could be attributed to the over twice shorter treatment time for OD samples supported with ultrasound.
Over the 2 hours of the process there was further enrichment of the tissue, while WL was mainly observed up to this time (Table 5). The smallest solid uptake was noticed in the cases of DHA and maltitol solutions, whereas the biggest was observed when erythritol and xylitol were used as osmotic agents (no statistically significant differences). Ambiguous results of the influence of sonication were also obtained by Mierzwa and Kowalski [16]: in the case of fructose, application of US resulted in higher values of WL; however, in the case of sorbitol, US-treatment resulted in smaller values. Mieszczakowska-Frąc et al. [21] reported that during application of ultrasound in a water medium was observed an increase of water content and substantial loses of soluble solids, whereas during sonication in sucrose solution a significant increase of WL and SG values was noted. These observations remained in consensus with results obtained by Fernandes et al. [22] in the case of melon. On the other hand, during OD of cranberries, using sucrose and trehalose as osmotic agents, sonication did not promote any differences for solid gain, while it caused a significant decrease in samples with steviol glycoside [4].
Using of the Peleg’s model to predict SG values was impossible in the case of maltitol (Figure 2c) due to CRV values higher than 20% and high values of the indicator of root mean squared error (RMSE) (Table 6). The same problem was reported in the previous research by Cichowska et al. [5] and in this case a better fit was found using the Kelvin–Voigt model. A similar situation was found in the case of presentation of SG kinetics for interval applications using xylitol and DHA solutions, as well as the continuous method in erythritol solution. Using the sonication resulted in an increase of k1 values (meaning that initial mass transfer was reduced) and decreased values of k2 parameters (Table 6). The lowest values of k2 parameter were noted in the case of OD in erythritol solution, in an agreement with the greatest water loss using this osmotic agent (Figure 1a).
2.4. True Water Loss (WLT)
WLT, a new parameter which was proposed by Cichowska et al. [5], describes real water loss, including actual solid uptake during OD. When comparing values of WLT for different osmotic agents, excellent efficiency (similar to that of sucrose) and good water removal properties were found for erythritol, xylitol, and DHA solutions (Figure 3a,b,d). This behaviour of osmotic agents results from the high osmotic pressure of these substances, which were calculated by Cichowska et al. [5,6]. At the end of the process values of WLT were in the range of approximately 0.9–1.2 g/g d.m. However, using 30% concentrated maltitol as an osmotic agent, achieved values were smaller (0.5–0.7 g/g d.m.) (Figure 3c). No statistical differences were observed between sonication and OD without US-treatment in the case of erythritol (p-value = 0.165) (Figure 3a). In other cases, application of ultrasound resulted in a decrease of WLT values. Statistical analysis showed that time had a significant impact during 120 min of the process, so prolonging for a longer time is unfounded (Table 7). Generally, sonication by continuous method did not give better results compared to OD without US-treatment (no significant differences). Moreover, the interval method of ultrasound.
The goodness of fit experimental data to Peleg’s model was effective in all tested solutions, as evidenced by high R2 values, low RMSE, and low χ2 values (Table 8). Similar to modelling WL and SG parameters, application of ultrasound resulted in an increase of k1 and decrease of k2 parameters in the cases of OD in erythritol, xylitol, and DHA solutions. The opposite situation took place using maltitol as an osmotic agent. The best water removal rate was characterized by sucrose (the lowest k2 parameter).
2.5. The Cichowska et al. Ratio
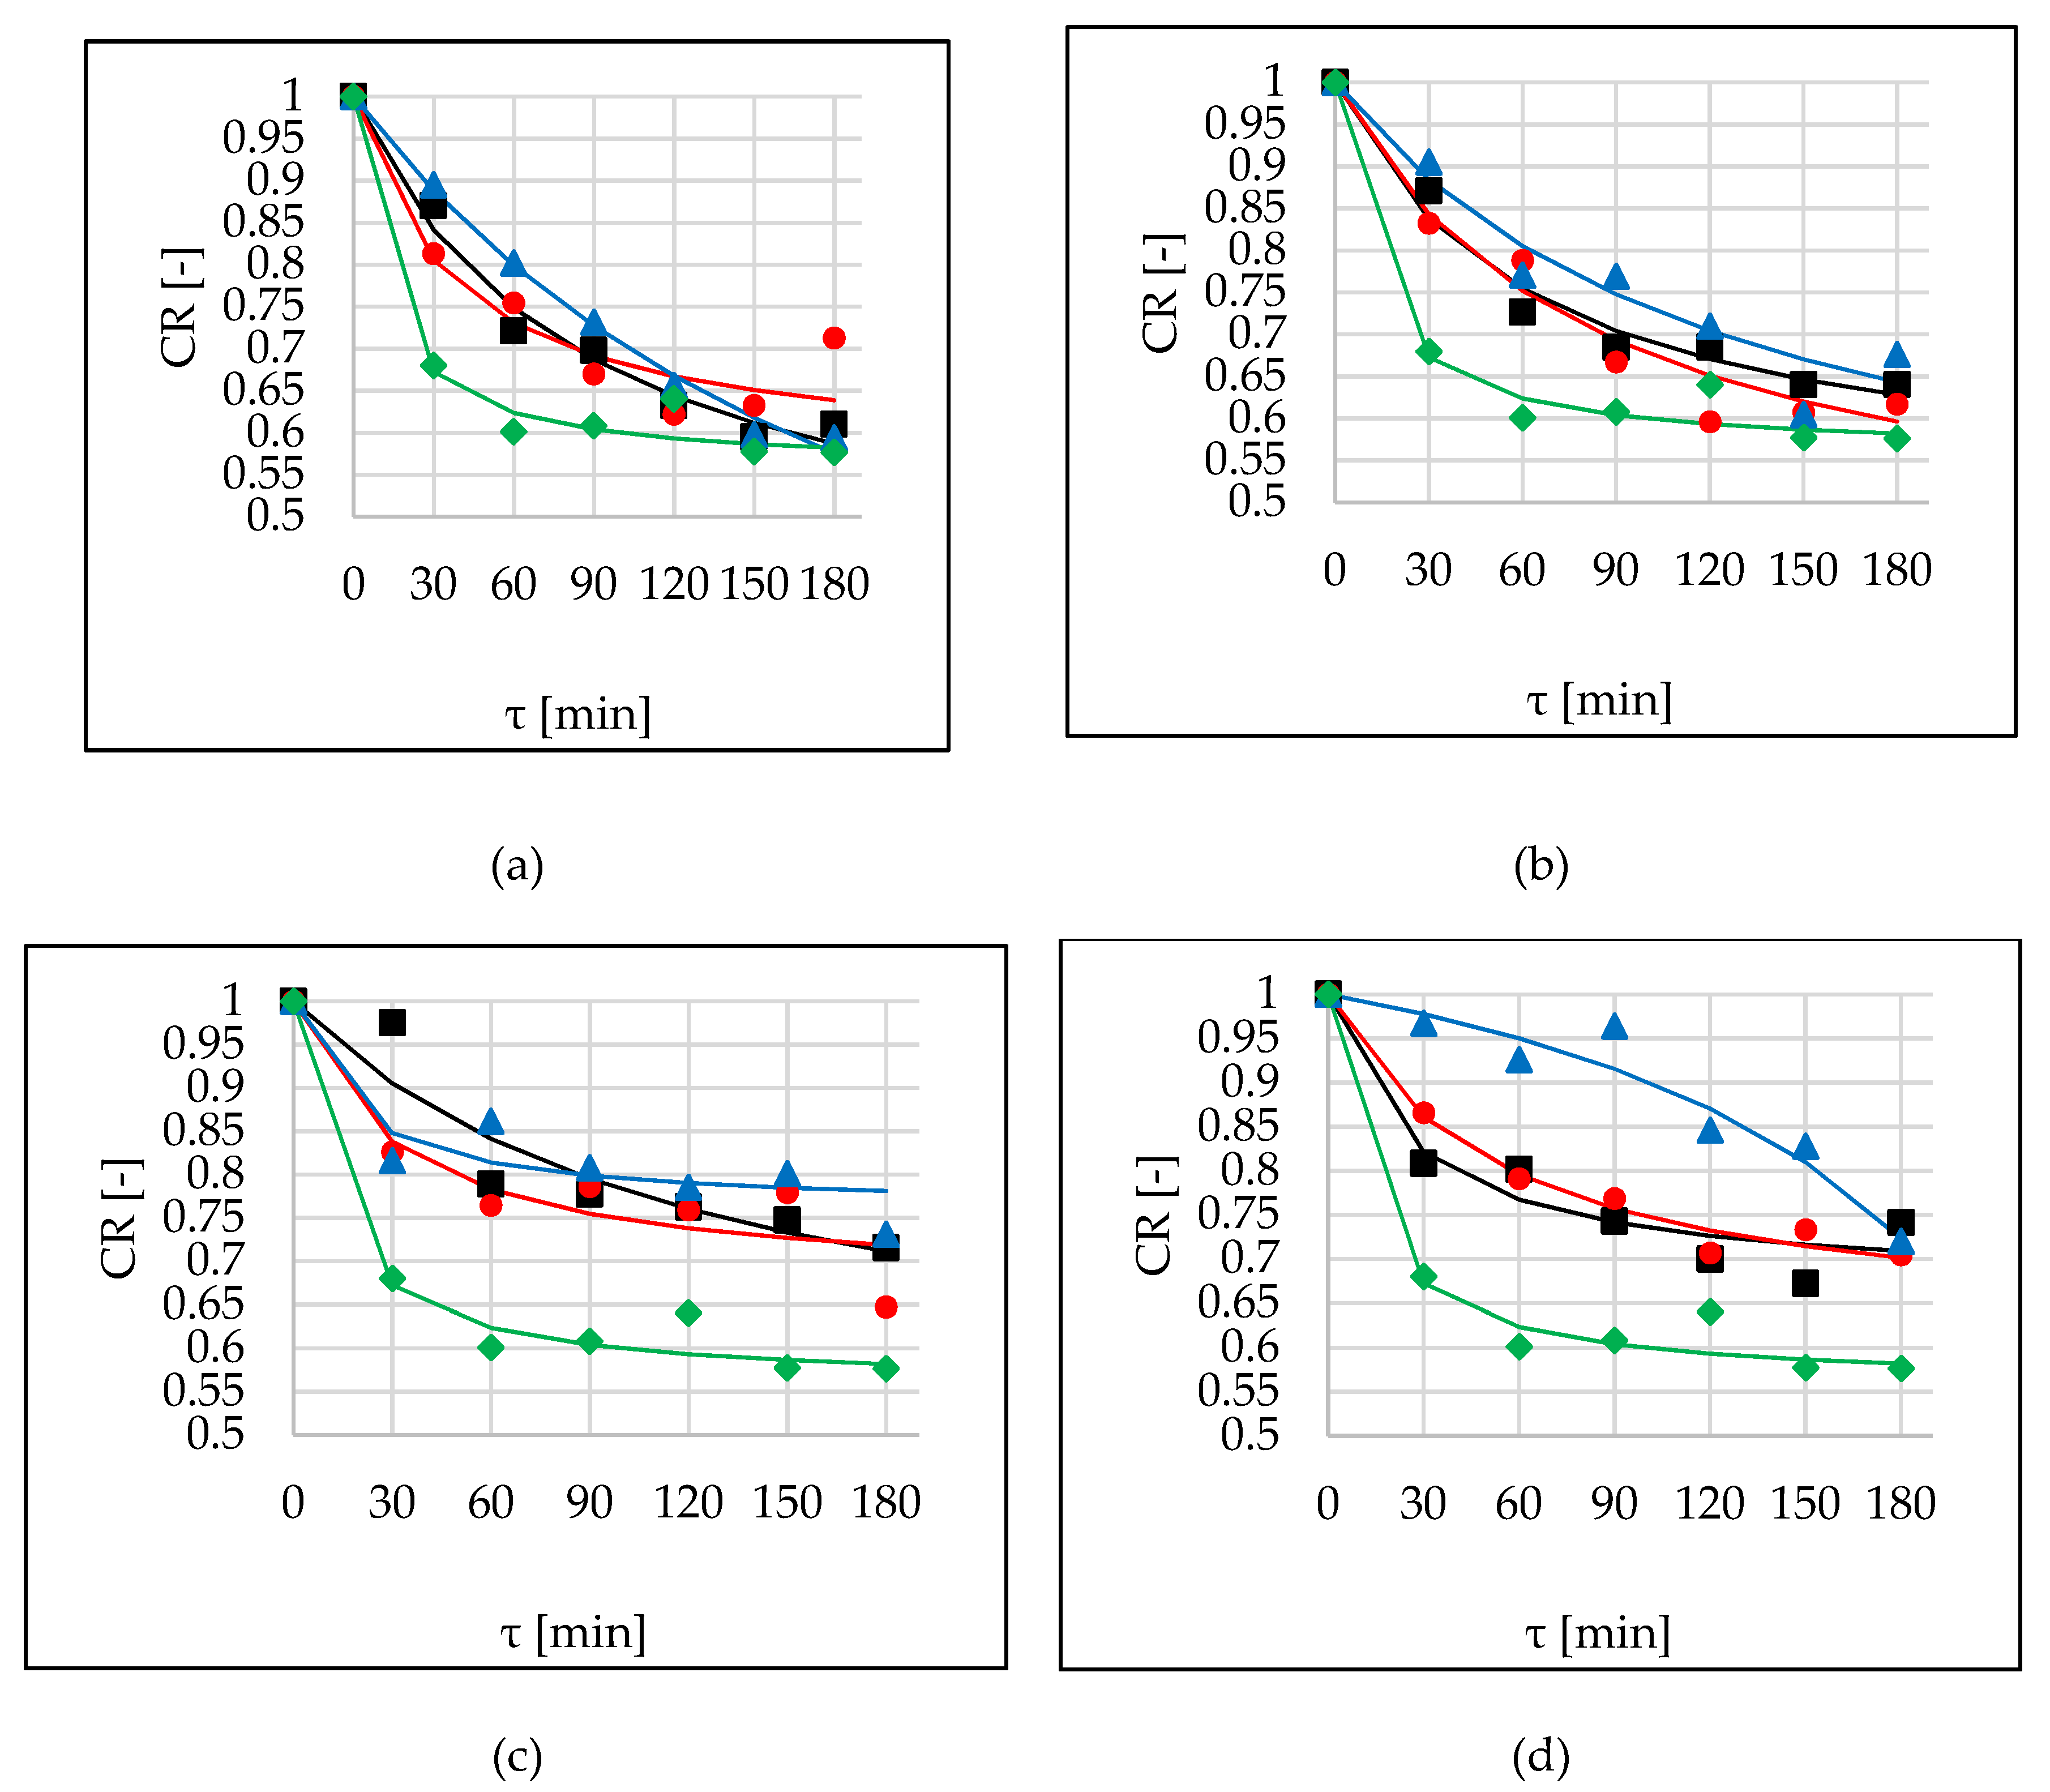
The ratio of WLT/WL was defined as the Cichowska et al. ratio (CR) [5]. The lowest values of this parameter in the case of sucrose indicate that during OD solid uptake was considerable, with simultaneous major water loss (Figure 4, green lines). The opposite situation could be seen in the cases where both WL and SG were inconsiderable, as in the case of maltitol (Figure 4c), or when WL was significant and at the same time SG was slight, as observed during OD in DHA solution (Figure 4d). This ambiguity means that this parameter should be analysed together with the two parameters WL and SG. For this research, the second situation was desirable. After 120 min of OD, which was considered the most optimal for ending of the process, the highest values of CR were noted using DHA as an osmotic agent. The CR values were in the range of 0.77-0.87, and slightly lower in the cases of xylitol and erythritol: 0.7–0.65 and 0.65, respectively (Figure 4a,b). Sonication did not have any influence on CR values in the case of erythritol (p-value 0.105) (Figure 4a). Statistical analysis showed that higher values of this parameter were achieved when interval sonication was applied (Table 9).
Peleg’s model also can be used for the prediction of CR. Values of CRV are lower (Table 10) compared to parameters discussed above. Influence of sonication on model parameters in the case of erythritol was ambiguous. Similar to modelling of WL and WLT, application of ultrasound resulted in an increase of k1 and decrease of k2 parameters in the cases of xylitol and DHA solutions, and opposite in the case of maltitol. The most effective behaviour (the highest water removal and small solid uptake) showed DHA hypertonic solution, which was proved by high k1 and small k2 parameters.
2.6. Water Activity
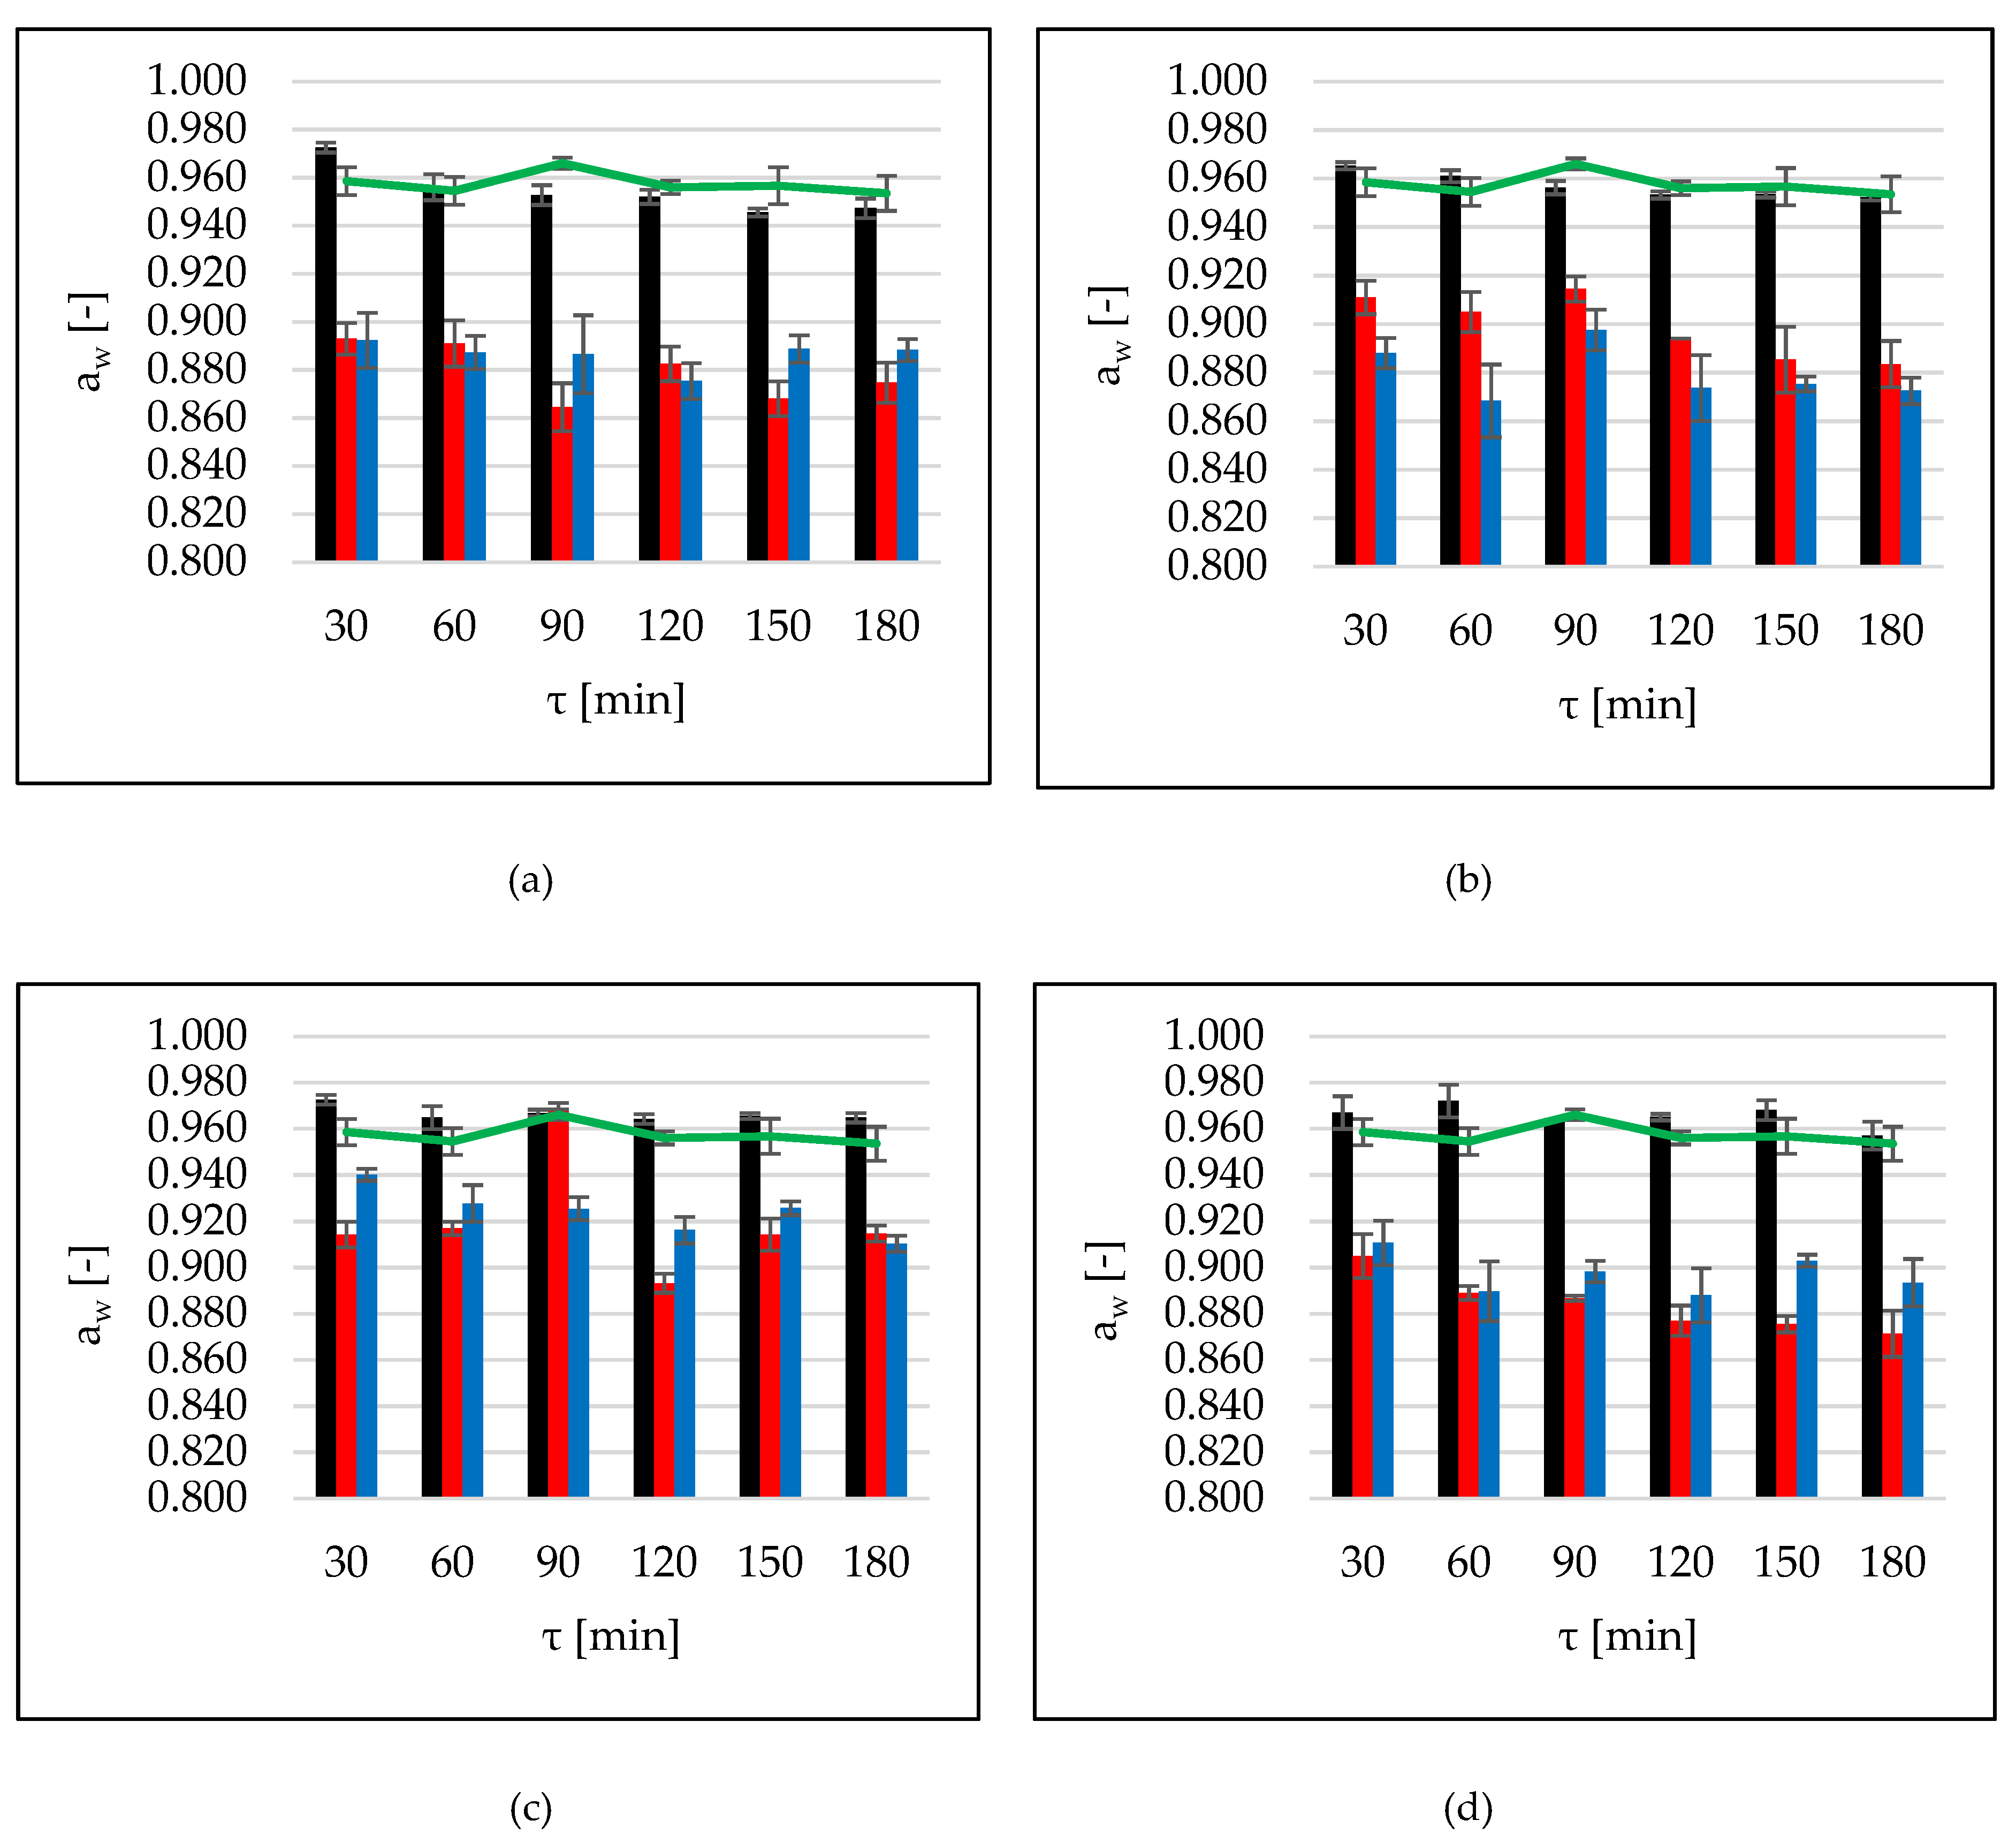
Raw apple tissue was characterized by water activity of 0.967. The use of sugar alcohols could reduce aw in the product. Hydroxyl groups of polyols can form hydrogen bonds with water, resulting in the increment of bound water in osmo-dried fruit [8]. With increment of time, the aw values decreased during OD in erythritol and xylitol solutions (Figure 5a,b, black bars). In other cases (maltitol, DHA, sucrose), aw remained at a similar level during all the process of OD without US treatment (Figure 5c,d, black bars). Application of ultrasound by continuous method allowed to decrease this parameter below the value of 0.880 after 90 min of OD in erythritol and after 120 min using DHA solutions. The interval method of application gave better results only in the case of xylitol used as osmotic agent. Values, compared with continuous method of sonication, were significantly lower. The lowest reduction of water activity was observed during OD in maltitol solution. It was related to the small osmotic pressure at the tested 30% concentration [5]. There were no significant differences between values achieved during OD in erythritol, xylitol, and sucrose solutions, as well as between xylitol, sucrose, and DHA used as osmotic solutes (Table 11). Decrease of aw took place during 120 min of the process, which confirmed earlier observations. Significant reduction of this parameter is very desirable by producers because water activity determines food microbiological safety. It is worth mentioning that values of aw significant decreased under the influence of sonication. Simultaneously, no significant influences of ultrasound on water content in the tissue were observed, and there were unnoticeable differences in WL (comparing values after sonication and without US-treatment). This could indicate the changes in the degree of water binding in the cell. It is possible that under influence of ultrasound reorganization of water molecules occurred, and thus they became less available. This hypothesis should be verified in the future research, using the method with nuclear magnetic resonance (NMR).
Nowacka et al. [4], after 30 min of sonication and 72 h of OD in sucrose solution, achieved aw values of about 0.867. Phisut et al. [17] studied the influence of fast osmotic dehydration (FOD) and slow osmotic dehydration (SOD) in sucrose solution on the chemical, physical, and sensory properties of osmo-dried cantaloupe. They observed that the SOD-treated cantaloupe sample showed lower water activity (0.69) as compared to the FOD-treated samples (0.72). These findings may be due to the higher sugar content of the SOD-treated sample, which encouraged the interaction of sugar and water molecules via the hydrogen bond. The same authors in another study [8] investigated the effect of osmotic dehydration in various solutions (sucrose, maltitol, sorbitol, and invert sugar) on cantaloupe tissue. They observed that sugar alcohols (sorbitol and maltitol) and invert sugar can reduce aw in the osmo-dried product.
2.7. Colour Changes
Colour is the one of important discriminants of the main quality attributes that influence the product acceptance by the consumer [23]. The browning index (BI) represents the purity of the brown colour. Table 12 shows changes of this parameter during OD in different solutions. The lightest-coloured tissue was found in samples which were dipped into a hypertonic solution with sucrose (Table 12). Statistical analysis revealed that the time of osmotic treatment had no significant influence on BI values (Table 13). Moreover, the highest values of the BI parameter were noted during OD with interval sonication.
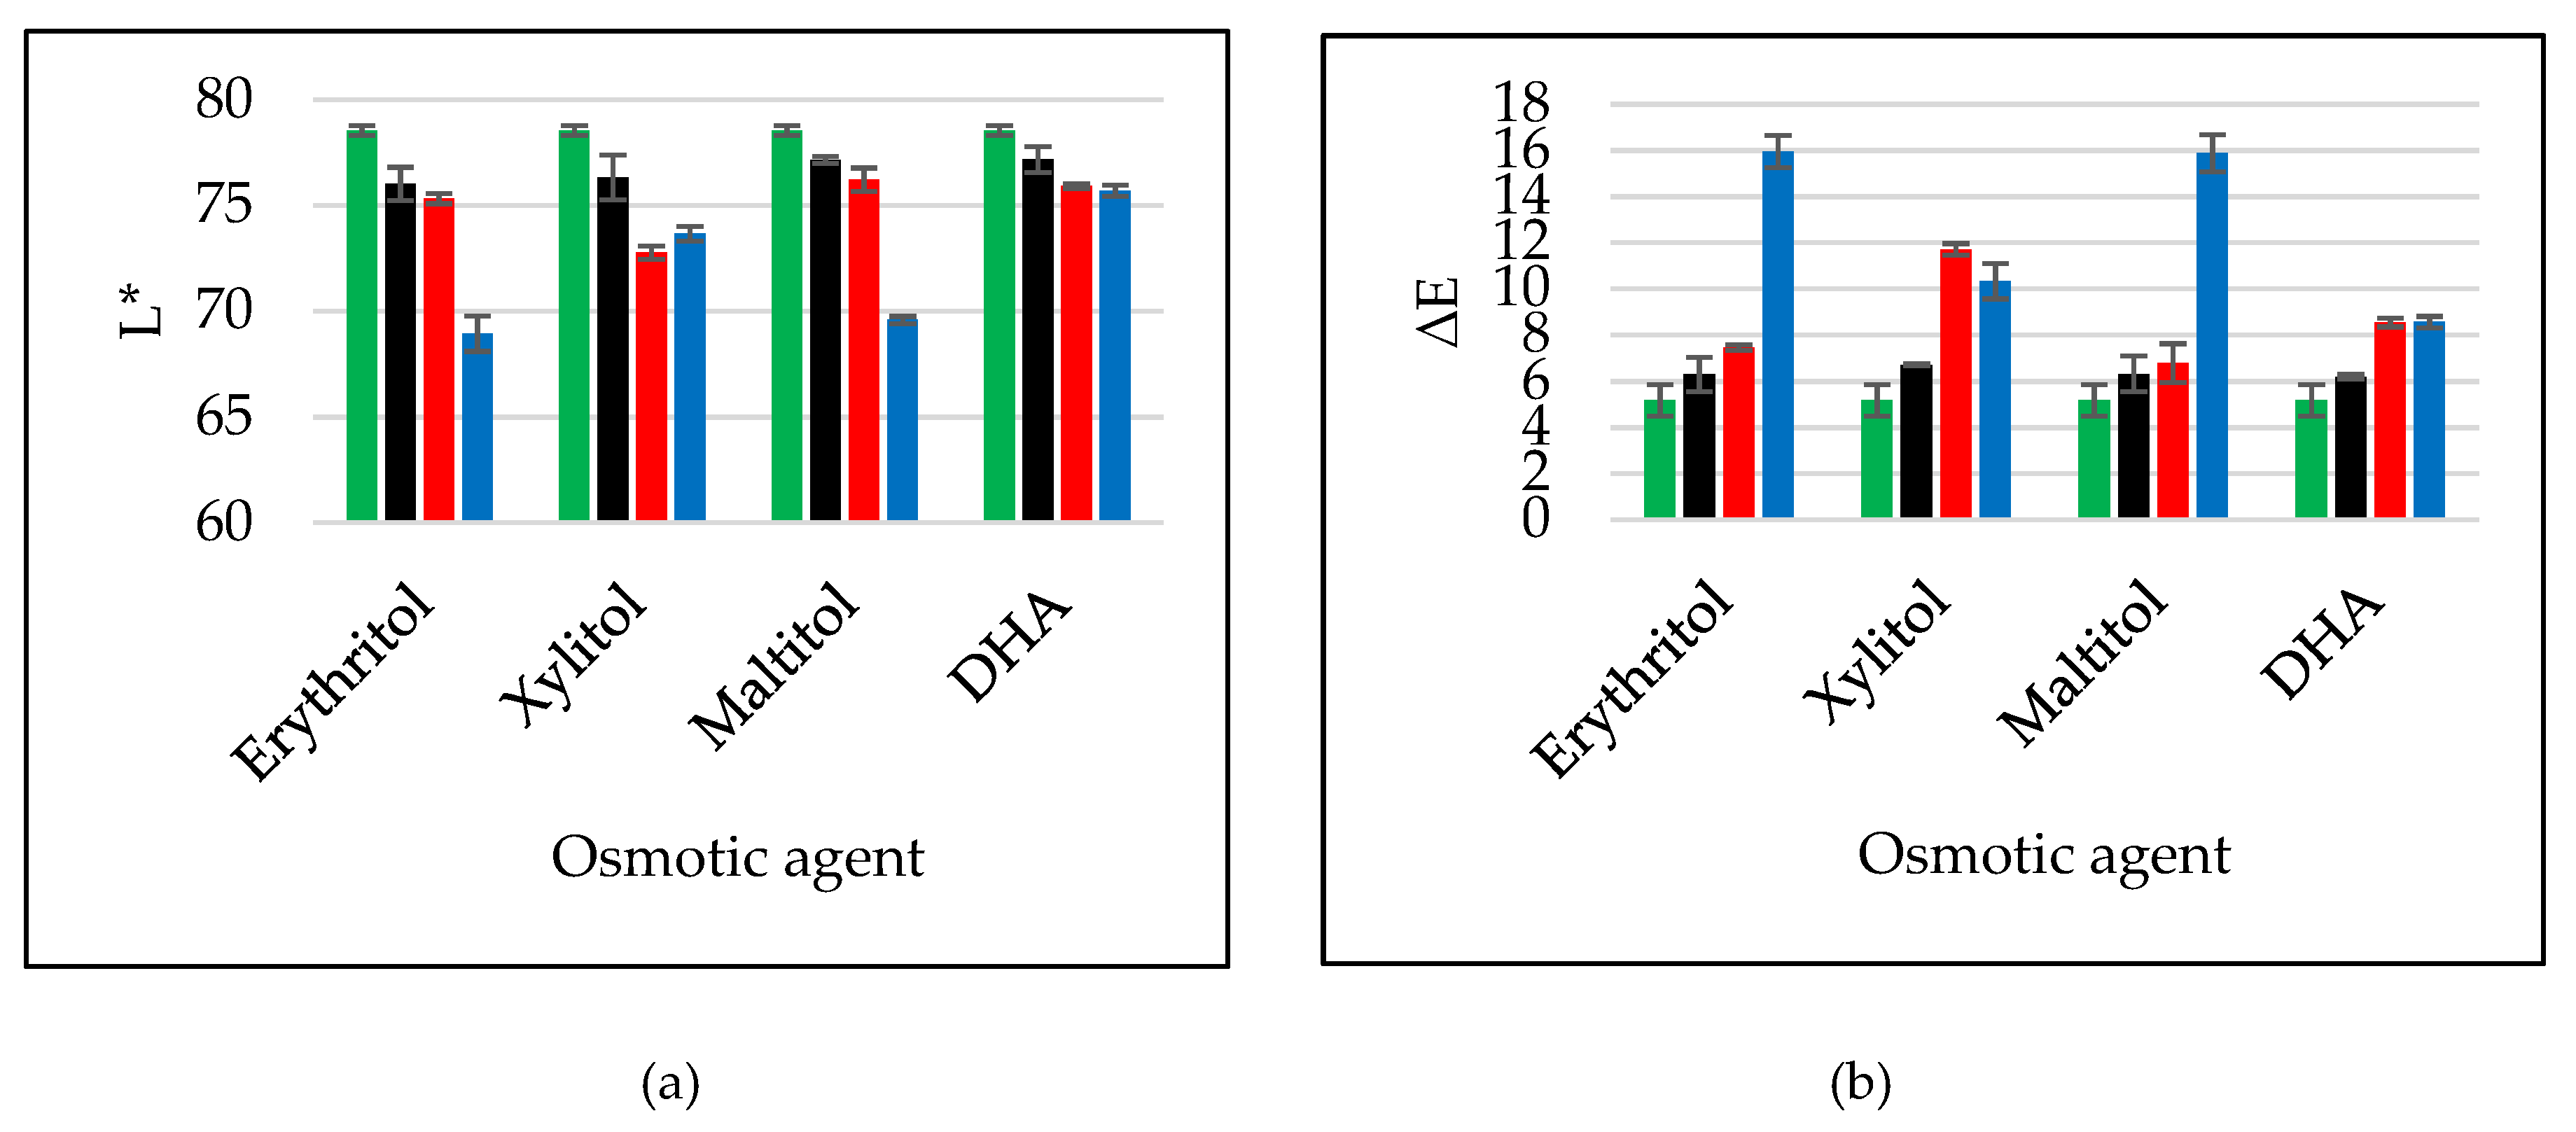
Figure 6 shows changes in the colour of the apple tissue after 120 min (the most optimal time for ending of the process). Values of the L* parameter were on a similar level after OD in polyols and DHA solutions. However, these values were slightly lower compared to sucrose (green bars) (Figure 6a). Sonication continuous method resulted in a decrease in values of L* about 1 unit in the cases of erythritol, maltitol and DHA solutions. When xylitol was used as an osmotic agent, the decrease equalled 3 units. Intervals application of ultrasound was insignificant on achieved values of L* and ∆E during OD in DHA solution. However, interval application of ultrasound resulted in the major darkness of the apple tissue, and consequently, high values of absolute colour differences in the cases of erythritol and maltitol (Figure 6ab). Opposite situation took place during OD in xylitol. More lightness of the surface and smaller ∆E compared to the second method were observed. Absolute colour differences after 120 min were on the similar level during OD in all tested hypertonic solutions (Figure 6b black bars).
L* values were higher in osmosed mangoes than in untreated samples; however, the colour of guava after ultrasound application became darker [24]. Ultrasound application has been showed to be unable to totally deactivate browning enzymes, such as polyphenoloxidase (PPO) and peroxidase (POD) [25]. The partial deactivation of these enzymes may lead to a certain degree of loss of lightness and the formation of brown compounds due to enzymatic browning [24].
More information about colour changes could show absolute colour differences. After osmotic dehydration without US-treatment small changes of ∆E were observed in the range of 4.8-7.5 (Table 14). Sonication by continuous method resulted in decrease of ∆E values in the case of control dehydration, but the interval method caused an increase of these values. Both methods of ultrasound application resulted in more changes observed in samples after OD in the case of other tested solutions. Moreover, the interval method brought two or three times more changes. This is in agreement with the parameter discussed above. The smallest changes in colour were observed when sucrose and DHA were used as the osmotic agent. Additionally, the processing time had no influence on observed changes (Table 15).
3. Materials and Methods
3.1. Sample Preparation
Fresh apples of the Elise variety were collected from the Experimental Fields (orchards) of the Faculty of Horticulture and Landscape Architecture (Warsaw University of Life Sciences). The fruits were stored at 4 ± 1 °C and relative humidity of 85–90% in a refrigerator until use. Before the experiment, the apples were washed, stoned, and cut into 5-mm-thick slices, and then each slice was cut into four pieces.
3.2. Pre-Treatment Procedure
In this procedure, a sample of 20 g ± 2 g was placed in a beaker into syrups in the ratio of 1:4 (fruit:solution) [4,26] in order to avoid significant changes in the solution concentration. Osmotic solutions were prepared with selected substances from the polyol group: erythritol, xylitol, and maltitol (Brenntag, Kędzierzyn-Koźle, Poland) as well as dihydroxyacetone (DHA) (Merck, Germany) dissolved in distilled water. Then, the beakers with samples immersed in osmotic solutions were positioned in an ultrasonic bath MKD-3 (MKD Ultrasonics, Stary Konik, Poland, internal dimensions: 240 × 140 × 110 mm). Two experimental repeats were carried out simultaneously. The temperature of the water bath was constant (40 °C). During sonication in OD solutions, significant temperature changes were not observed (±1 °C). The pre-treatment was conducted in the range from 0.5 to 3 hours by two methods: continuous and with 30-min intervals. The used frequency was 21 kHz and the total power generated by sonotrodes was 320 W, which corresponded to the ultrasound intensity of 8 W per gram of material. Afterwards, samples were removed from the osmotic solution, blotted with absorbent paper to remove osmotic liquid from their surface and were weighed.
3.3. Mathematical Modelling
Mass transfer parameters: WC, WL, and SG were determined according to Cichowska et al. [6] and WLT, CR according to equations by Cichowska et al. [5]. Fitting of the mathematical model (Peleg:) to the experimental points was done using Table Curve 2D version 5.01 (SYSTAT Software Inc., Chicago, IL, USA) [5]. The determination coefficient (R2), the reduced chi-squared statistic (χ2), the root mean square error (RMSE), and the coefficient of residual variation (CRV) were used to evaluate the goodness of fit of the model.
3.4. Water Activity
Water activity was determined using the AquaLab CX-2 (Decagon Devices Inc., USA) apparatus in accordance with the manufacturer’s instructions. The temperature of water activity determination was constant (25 °C). Each measurement was conducted in four repetitions.
3.5. Colour Measurement
Colour analysis of the surface of the osmo-dehydrated apple was determined with the use of Minolta Chroma Meter CR-200 (Minolta Corp., Osaka, Japan). The measurement conditions were: D65 standard illuminate, 2° Standard Observer, measurement diameter: 30 mm. The results were presented using the directly measured parameters: L* (lightness/darkness), a* (red/green), b* (yellow/blue). The measurements were made in 5 repetitions for every sample; the mean values were reported. The total colour differences (ΔE – Equation (1)) were calculated according to the following formula:
where ΔL*, Δa*, Δb* represent the change of L*, a* and b* parameters, respectively, between raw material and samples after treatment.
The browning index (BI) represents the purity of the brown colour and was calculated for each sample separately.
3.6. Statistical Analysis
The statistical software Statgraphics Plus ver. 5.1 (StatPoint) and Excel 2016 (Microsoft) were used for data analysis. The influence of pre-treatment (duration of the process, type of osmotic solution, method of ultrasound) on dependent variables: (WC, WL, SG, WLT, CR, aw and colour changes) was evaluated by means of a multifactorial analysis of variance (ANOVA) at a significance level α = 0.05. In the case of significant associations, post-hoc Tukey’s test was performed.
4. Conclusions
The expected positive effect of ultrasound application on mass transfer intensification during osmotic dehydration turned out to be unnoticeable in the case of WC, WL, and SG parameters. Erythritol, xylitol, and DHA solutions at a 30% concentration showed similar efficiency to sucrose and good water removal properties based on values of true water loss (WLT) during osmotic dehydration. Sonication resulted in a decrease of WLT parameter values; only in the case of erythritol were no statistically significant differences observed. Maltitol at the tested concentration was ineffective. Peleg’s model could be used for prediction of observed values for almost all parameters, except few cases of solid gain. Application of ultrasound by continuous method allowed us to significantly reduce water activity in apple tissue in all tested solutions and achieved small colour changes, using sucrose as an osmotic agent. The use of the interval method was unfounded because of too high changes in absolute colour changes and weakness of the phenomenon of water loss.
Author Contributions
Conceptualization, J.C. and D.W.-R.; methodology, D.W.-R. and A.F.; software, J.C and L.S.-R.; validation, D.W.-R. and A.F.; formal analysis, J.C.; investigation, J.C. and L.S.-R.; resources, J.C.; data curation, J.C.; writing—original draft preparation, J.C.; writing—review and editing, J.C., D.W.-R., and A.F.; visualization, J.C.; supervision, D.W.-R. and A.F.; project administration, J.C.
Funding
This research received no external funding.
Conflicts of Interest
The authors declare no conflict of interest. The funders had no role in the design of the study; in the collection, analyses, or interpretation of data; in the writing of the manuscript, or in the decision to publish the results.
Nomenclature
| OD | osmotic dehydration |
| US | application of ultrasound |
| OD+US | ultrasound-assisted osmotic dehydration (continuous method) |
| OD+USi | ultrasound-assisted osmotic dehydration (interval method) |
| WC | water content, (g/g d.m.) |
| WL | water loss, (g/g i.d.m.) |
| WLT | true water loss (g/g d.m) |
| SG | solid gain, (g/g i.d.m.) |
| CR | Cichowska et al. ratio |
| k1 | constant in Peleg’s model, (kg/kg) |
| k2 | constant in Peleg’s model, (kg/kg·h) |
| τ | time of osmotic dehydration (min) |
References
- Michailidis, P.A.; Krokida, M.K. Drying and Dehydration Processes in Food Preservation and Processing. In Conventional and Advanced Food Processing Technologies; John Wiley & Sons, Ltd.: Chichester, UK, 2014; pp. 1–32. [Google Scholar]
- Petzold, G.; Moreno, J.; Gianelli, M.P.; Cerda, F.; Mella, K.; Zúñiga, P.; Orellana-Palma, P. Food Technology Approaches for Improvement of Organoleptic Properties Through Preservation and Enrichment of Bioactive Compounds. In Food Processing for Increased Quality and Consumption; Grumezescu, A., Holban, A.M., Eds.; Elsevier Inc.: Amsterdam, The Netherlands, 2018; pp. 65–90. [Google Scholar] [CrossRef]
- Ahmed, I.; Qazi, I.M.; Jamal, S. Developments in osmotic dehydration technique for the preservation of fruits and vegetables. Innov. Food Sci. Emerg. Technol. 2016, 34, 29–43. [Google Scholar] [CrossRef]
- Nowacka, M.; Tylewicz, U.; Tappi, S.; Siroli, L.; Lanciotti, R.; Romani, S.; Witrowa-Rajchert, D. Ultrasound assisted osmotic dehydration of organic cranberries (Vaccinium oxycoccus): Study on quality parameters evolution during storage. Food Control. 2018, 93, 40–47. [Google Scholar] [CrossRef]
- Cichowska, J.; Figiel, A.; Stasiak-Różańska, L.; Witrowa-Rajchert, D. Modeling of Osmotic Dehydration of Apples in Sugar Alcohols and Dihydroxyacetone (DHA) Solutions. Foods 2019, 8, 20. [Google Scholar] [CrossRef] [PubMed]
- Cichowska, J.; Zubernik, J.; Czyzewski, J.; Kowalska, H.; Witrowa-Rajchert, D. Efficiency of osmotic dehydration of apples in polyols solutions. Molecules 2018, 23. [Google Scholar] [CrossRef] [PubMed]
- Bialik, M.; Wiktor, A.; Latocha, P.; Gondek, E. Mass transfer in osmotic dehydration of kiwiberry: Experimental and mathematical modelling studies. Molecules 2018, 23. [Google Scholar] [CrossRef] [PubMed]
- Phisut, N.; Rattanawedee, M.; Aekkasak, K. Effect of different osmotic agents on the physical, chemical and sensory properties of osmo-dried cantaloupe. Chiang Mai J. Sci. 2013, 40, 427–439. [Google Scholar]
- Jambrak, A.R.; Herceg, Z. Application of Ultrasonics in Food Preservation and Processing. In Conventional and Advanced Food Processing Technologies; Bhattacharya, S., Ed.; John Wiley & Sons: New York, NY, USA, 2014; pp. 515–536. [Google Scholar] [CrossRef]
- Cárcel, J.A.; García-Pérez, J.V.; Riera, E.; Rosselló, C.; Mulet, A. Ultrasonically Assisted Drying. In Ultrasound in Food Processing; John Wiley & Sons, Ltd.: Chichester, UK, 2017; pp. 371–391. [Google Scholar]
- Rodrigues, S.; Fernandes, F.A.N. Ultrasound in food processing. In New Food Engineering Research Trends; Urwaye, A.P., Ed.; Nova Science Publishers: New York, NY, USA, 2008; pp. 103–135. [Google Scholar]
- Lee, H.; Zhou, B.; Feng, H. Power Ultrasound Treatment of Fruits and Fruit Products. In Fruit Preservation; Rosenthal, A., Deliza, R., Welti-Chanes, J.B.-C.G., Eds.; Springer: New York, NY, USA, 2018; pp. 311–333. [Google Scholar]
- Nowacka, M.; Wiktor, A.; Śledź, M.; Jurek, N.; Witrowa-Rajchert, D. Drying of ultrasound pretreated apple and its selected physical properties. J. Food Eng. 2012, 113, 427–433. [Google Scholar] [CrossRef]
- Simal, S.; Benedito, J.; Sánchez, E.S.; Rosselló, C. Use of Ultrasound to Increase Mass Transport Rates During Osmotic Dehydration. J. Food Eng. 1998, 36, 323–336. [Google Scholar] [CrossRef]
- Fijalkowska, A.; Nowacka, M.; Wiktor, A.; Sledz, M.; Witrowa-Rajchert, D. Ultrasound as a Pretreatment Method to Improve Drying Kinetics and Sensory Properties of Dried Apple. J. Food Process Eng. 2016. [Google Scholar] [CrossRef]
- Mierzwa, D.; Kowalski, S.J. Ultrasound-assisted osmotic dehydration and convective drying of apples: Process kinetics and quality issues. Chem. Process Eng. Inz Chem. i Proces 2016, 37, 383–391. [Google Scholar] [CrossRef]
- Phisut, N.; Rattanawedee, M.; Aekkasak, K. Effect of osmotic dehydration process on the physical, chemical and sensory properties of osmo-dried cantaloupe. Int. Food Res. J. 2013, 20, 189–196. [Google Scholar]
- Fei, P.; Lifu, C.; Wenjian, Y.; Liyan, Z.; Yong, F.; Ning, M.; Qiuhui, H. Comparison of osmotic dehydration and ultrasound-assisted osmotic dehydration on the state of water, texture, and nutrition of agaricus bisporus. CYTA J. Food 2018. [Google Scholar] [CrossRef]
- Fernandes, F.A.N.; Oliveira, F.I.P.; Rodrigues, S. Use of ultrasound for dehydration of papayas. Food Bioprocess. Technol. 2008, 1, 339–345. [Google Scholar] [CrossRef]
- Dermesonlouoglou, E.K.; Giannakourou, M.C. Modelling dehydration of apricot in a non-conventional multi-component osmotic solution: Effect on mass transfer kinetics and quality characteristics. J. Food Sci. Technol. 2018. [Google Scholar] [CrossRef] [PubMed]
- Mieszczakowska-Frąc, M.; Dyki, B.; Konopacka, D. Effects of Ultrasound on Polyphenol Retention in Apples After the Application of Predrying Treatments in Liquid Medium. Food Bioprocess. Technol. 2016, 9, 543–552. [Google Scholar] [CrossRef]
- Fernandes, F.A.N.; Gallão, M.I.; Rodrigues, S. Effect of osmotic dehydration and ultrasound pre-treatment on cell structure: Melon dehydration. LWT Food Sci. Technol. 2008, 41, 604–610. [Google Scholar] [CrossRef]
- Holzwarth, M.; Korhummel, S.; Carle, R.; Kammerer, D.R. Evaluation of the effects of different freezing and thawing methods on color, polyphenol and ascorbic acid retention in strawberries (Fragaria × ananassa Duch.). Food Res. Int. 2012, 48, 241–248. [Google Scholar] [CrossRef]
- Fernandes, F.A.N.; Rodrigues, S. Osmotic Dehydration and Blanching. In Ultrasound in Food Processing; John Wiley & Sons, Ltd.: Chichester, UK, 2017; pp. 311–328. [Google Scholar]
- Gamboa-Santos, J.; Montilla, A.; Soria, A.C.; Villamiel, M. Effects of conventional and ultrasound blanching on enzyme inactivation and carbohydrate content of carrots. Eur. Food Res. Technol. 2012, 234, 1071–1079. [Google Scholar] [CrossRef] [Green Version]
- Tylewicz, U.; Panarese, V.; Laghi, L.; Rocculi, P.; Nowacka, M.; Placucci, G.; Rosa, M.D. NMR and DSC Water Study During Osmotic Dehydration of Actinidia deliciosa and Actinidia chinensis Kiwifruit. Food Biophys. 2011. [Google Scholar] [CrossRef]
- Bernaś, E. Comparison of the mechanism of enzymatic browning in frozen white and brown A. bisporus. Eur. Food Res. Technol. 2018, 244, 1239–1248. [Google Scholar] [CrossRef]
Sample Availability: Samples of the osmotic agents: erythritol, xylitol, sucrose and DHA (dihydroxyacetone) are available from the authors. |
Figure 1.
Water loss (WL) kinetics at several conditions (OD (■), OD+US (●), OD+USi (▲)) at 40 °C, in different solutions: (a) erythritol, (b) xylitol, (c) maltitol, (d) DHA. Lines are the Peleg’s model. The green line (♦) is the kinetic reference (sucrose).
Figure 1.
Water loss (WL) kinetics at several conditions (OD (■), OD+US (●), OD+USi (▲)) at 40 °C, in different solutions: (a) erythritol, (b) xylitol, (c) maltitol, (d) DHA. Lines are the Peleg’s model. The green line (♦) is the kinetic reference (sucrose).

Figure 2.
Solid gain (SG) kinetics at several conditions, (OD (■), OD+US (●), OD+USi (▲)) at 40 °C, in different solutions: (a) erythritol, (b) xylitol, (c) maltitol, (d) DHA. Lines represent the Peleg’s model. The green line (♦) is the kinetic reference (sucrose).
Figure 2.
Solid gain (SG) kinetics at several conditions, (OD (■), OD+US (●), OD+USi (▲)) at 40 °C, in different solutions: (a) erythritol, (b) xylitol, (c) maltitol, (d) DHA. Lines represent the Peleg’s model. The green line (♦) is the kinetic reference (sucrose).

Figure 3.
True water loss (WLT) kinetics in several conditions (OD (■), OD+US (●), OD+USi (▲)) at 40 °C in different solutions: (a) erythritol, (b) xylitol, (c) maltitol, (d) DHA. Lines are the Peleg’s model. The green line (♦) is the kinetic reference (sucrose).
Figure 3.
True water loss (WLT) kinetics in several conditions (OD (■), OD+US (●), OD+USi (▲)) at 40 °C in different solutions: (a) erythritol, (b) xylitol, (c) maltitol, (d) DHA. Lines are the Peleg’s model. The green line (♦) is the kinetic reference (sucrose).

Figure 4.
The Cichowska et al. ratio (CR) kinetics in several conditions (OD (■), OD+US (●), OD+USi (▲)) at 40 °C, in different solutions: (a) erythritol, (b) xylitol, (c) maltitol, (d) DHA. Lines are the Peleg’s model. The green line (♦) is the kinetic reference (sucrose).
Figure 4.
The Cichowska et al. ratio (CR) kinetics in several conditions (OD (■), OD+US (●), OD+USi (▲)) at 40 °C, in different solutions: (a) erythritol, (b) xylitol, (c) maltitol, (d) DHA. Lines are the Peleg’s model. The green line (♦) is the kinetic reference (sucrose).

Figure 5.
Water activity, aw, at several conditions (OD (black bars), OD+US (red bars), OD+USi (blue bars)) at 40 °C, using different solutions: (a) erythritol, (b) xylitol, (c) maltitol, (d) DHA. The green lines are values for the reference (sucrose).
Figure 5.
Water activity, aw, at several conditions (OD (black bars), OD+US (red bars), OD+USi (blue bars)) at 40 °C, using different solutions: (a) erythritol, (b) xylitol, (c) maltitol, (d) DHA. The green lines are values for the reference (sucrose).

Figure 6.
Colour changes after 120 min OD of apples: values of parameter L* (a), values of absolute colour difference (b) in several conditions (OD (black bars), OD+US (red bars), OD+USi (blue bars)) at 40 °C using different solutions. The green bars are values for reference (sucrose).
Figure 6.
Colour changes after 120 min OD of apples: values of parameter L* (a), values of absolute colour difference (b) in several conditions (OD (black bars), OD+US (red bars), OD+USi (blue bars)) at 40 °C using different solutions. The green bars are values for reference (sucrose).


Table 1.
Water content (g H2O/g dry matter) in apples during OD in different solutions. OD: osmotic dehydration, US: continuous sonication, USi: interval sonication; DHA: dihydroxyacetone.
Table 1.
Water content (g H2O/g dry matter) in apples during OD in different solutions. OD: osmotic dehydration, US: continuous sonication, USi: interval sonication; DHA: dihydroxyacetone.
| Time [min] | Solution/Application | Sucrose | Erythritol | Xylitol | Maltitol | DHA |
|---|---|---|---|---|---|---|
| 0 | 5.69 ± 0.2 | |||||
| 30 | OD | 3.23 ± 0.2 | 4.16 ± 0.2 | 4.22 ± 0.4 | 5.11 ± 0.2 | 3.86 ± 0.1 |
| OD+US | 3.52 ± 0.2 | 3.99 ± 0.1 | 4.20 ± 0.3 | 4.34 ± 0.1 | 4.31 ± 0.1 | |
| OD+USi | 3.82 ± 0.2 | 4.30 ± 0.3 | 4.62 ± 0.2 | 4.44 ± 0.2 | 5.01 ± 0.3 | |
| 60 | OD | 2.64 ± 0.1 | 3.27 ± 0.0 | 3.31 ± 0.1 | 3.97 ± 0.1 | 3.65 ± 0.1 |
| OD+US | 2.54 ± 0.2 | 3.41 ± 0.1 | 3.72 ± 0.2 | 3.95 ± 0.2 | 3.92 ± 0.2 | |
| OD+USi | 3.09 ± 0.5 | 3.67 ± 0.1 | 3.66 ± 0.2 | 4.57 ± 0.2 | 4.53 ± 0.3 | |
| 90 | OD | 2.55 ± 0.2 | 2.91 ± 0.1 | 3.00 ± 0.1 | 3.83 ± 0.1 | 3.28 ± 0.2 |
| OD+US | 2.96 ± 0.1 | 2.84 ± 0.2 | 3.06 ± 0.1 | 3.96 ± 0.1 | 3.42 ± 0.3 | |
| OD+USi | 2.81 ± 0.2 | 3.11 ± 0.1 | 3.47 ± 0.2 | 4.23 ± 0.2 | 4.65 ± 0.1 | |
| 120 | OD | 2.52 ± 0.0 | 2.64 ± 0.0 | 3.02 ± 0.0 | 3.71 ± 0.1 | 3.01 ± 0.0 |
| OD+US | 2.32 ± 0.1 | 2.57 ± 0.0 | 2.58 ± 0.2 | 3.78 ± 0.1 | 3.02 ± 0.1 | |
| OD+USi | 2.68 ± 0.2 | 2.65 ± 0.1 | 3.14 ± 0.0 | 3.91 ± 0.2 | 3.96 ± 0.2 | |
| 150 | OD | 2.18 ± 0.1 | 2.46 ± 0.1 | 2.72 ± 0.1 | 3.60 ± 0.0 | 2.93 ± 0.1 |
| OD+US | 2.42 ± 0.2 | 2.55 ± 0.2 | 2.58 ± 0.2 | 3.87 ± 0.1 | 3.17 ± 0.2 | |
| OD+USi | 2.94 ± 0.3 | 2.40 ± 0.1 | 2.76 ± 0.1 | 4.10 ± 0.1 | 3.66 ± 0.2 | |
| 180 | OD | 2.08 ± 0.1 | 2.54 ± 0.2 | 2.62 ± 0.1 | 3.38 ± 0.1 | 3.22 ± 0.2 |
| OD+US | 1.79 ± 0.2 | 2.78 ± 0.2 | 2.53 ± 0.1 | 3.24 ± 0.0 | 3.05 ± 0.1 | |
| OD+USi | 2.15 ± 0.2 | 2.38 ± 0.0 | 2.87 ± 0.2 | 3.67 ± 0.2 | 3.15 ± 0.1 | |
Table 2.
The influence of osmotic agents and pre-treatment time on water content in fruit.
| Factor | p-Value | Contrast | +/– Limits | Difference | |
|---|---|---|---|---|---|
| Type of osmotic substance | erythritol b | 0.000 * | erythritol–xylitol | 0.1300 | –0.2106 * |
| xylitol c | erythritol–sucrose | 0.1311 | 0.3703 * | ||
| maltitol e | xylitol–maltitol | 0.1305 | –0.7410 * | ||
| DHA d | xylitol–sucrose | 0.1335 | 0.5809 * | ||
| sucrose a | DHA–erythritol | 0.1385 | 0.6672 * | ||
| Time (min) | 30 e | 0.000 * | 30–60 | 0.1497 | 0.6378 * |
| 60 d | 60–90 | 0.1504 | 0.2674 * | ||
| 90 c | 90–120 | 0.1549 | 0.2734 * | ||
| 120 b | 120–150 | 0.1577 | 0.0955 | ||
| 150 b | 120–180 | 0.1548 | 0.3013 * | ||
| 180 a | 150–180 | 0.1549 | 0.2059 * | ||
| Type of sonication | OD a | 0.000 * | OD–US | 0.0902 | –0.0117 |
| OD+US a | OD–USi | 0.0881 | –0.3300 * | ||
| OD+USi b | US–USi | 0.0889 | –0.3183 * | ||
Statistical differences between factors; a Tukey test of main effects was performed. * Denotes a statistically significant difference. Means within columns with a different lowercase letter superscript are significantly different (p < 0.05).
Table 3.
The influence of osmotic agents and pre-treatment time on water loss during OD.
| Factor | p-Value | Contrast | +/– Limits | Difference | |
|---|---|---|---|---|---|
| Type of osmotic substance | erythritol d | 0.000 * | erythritol–xylitol | 0.0764 | 0.2053 * |
| xylitol c | erythritol–sucrose | 0.0770 | –0.2390 * | ||
| maltitol a | xylitol–maltitol | 0.0767 | 0.5534 * | ||
| DHA b | xylitol–sucrose | 0.0784 | –0.4443 * | ||
| sucrose e | DHA–erythritol | 0.0814 | –0.2918 * | ||
| Time (min) | 30 a | 0.000 * | 30–60 | 0.0879 | –0.2963 * |
| 60 b | 60–90 | 0.0888 | –0.2109 * | ||
| 90 c | 90–120 | 0.0910 | –0.1247 * | ||
| 120 d | 120–150 | 0.0927 | –0.0552 | ||
| 150 d | 120–180 | 0.0910 | –0.1745 * | ||
| 180 e | 150–180 | 0.0910 | –0.1193 * | ||
| Type of sonication | OD b | 0.000 * | OD–US | 0.0530 | –0.0034 |
| OD+US b | OD–USi | 0.0514 | 0.1406 * | ||
| OD+USi a | US–USi | 0.0522 | 0.1439 * | ||
Statistical differences between factors; a Tukey test of main effects was performed. * Denotes a statistically significant difference. Means within columns with a different lowercase letter superscript are significantly different – homogeneous groups (p < 0.05).
Table 4.
Values of k1, k2, R2, χ2, coefficient of residual variation (CRV), and RMSE of modelling WL using Peleg’s model. RMSE: root mean square error.
Table 4.
Values of k1, k2, R2, χ2, coefficient of residual variation (CRV), and RMSE of modelling WL using Peleg’s model. RMSE: root mean square error.
| Solution | Application | k1 (kg/kg·min) | k2 (kg/kg) | R2 | χ2 | CRV (%) | RMSE |
|---|---|---|---|---|---|---|---|
| Erythritol | OD | 16.714 | 0.534 | 0.862 | 0.006 | 5.85 | 0.064 |
| OD+US | 25.757 | 0.424 | 0.982 | 0.000 | 1.59 | 0.018 | |
| OD+USi | 23.446 | 0.459 | 0.967 | 0.004 | 4.96 | 0.056 | |
| Xylitol | OD | 21.117 | 0.558 | 0.942 | 0.004 | 5.26 | 0.054 |
| OD+US | 43.499 | 0.431 | 0.959 | 0.004 | 5.94 | 0.005 | |
| OD+USi | 30.449 | 0.547 | 0.920 | 0.011 | 10.03 | 0.087 | |
| Maltitol | OD | 45.191 | 0.846 | 0.910 | 0.000 | 3.18 | 0.019 |
| OD+US | 35.390 | 1.210 | 0.906 | 0.001 | 5.63 | 0.028 | |
| OD+USi | 89.974 | 0.985 | 0.818 | 0.005 | 15.24 | 0.062 | |
| DHA | OD | 13.019 | 0.658 | 0.976 | 0.002 | 3.51 | 0.034 |
| OD+US | 34.449 | 0.512 | 0.884 | 0.016 | 11.89 | 0.106 | |
| OD+USi | 60.139 | 0.487 | 0.954 | 0.005 | 7.73 | 0.059 | |
| Sucrose | OD | 28.202 | 0.362 | 0.974 | 0.005 | 4.88 | 0.060 |
Table 5.
The influence of osmotic agents and pre-treatment time on solid gain during OD.
| Factor | p-Value | Contrast | +/– Limits | Difference | |
|---|---|---|---|---|---|
| Type of osmotic substance | erythritol b | 0.000 * | erythritol–xylitol | 0.0479 | 0.0327 |
| xylitol b | erythritol–sucrose | 0.0483 | –0.0906 * | ||
| maltitol a | xylitol–maltitol | 0.0481 | 0.1408 * | ||
| DHA a | xylitol–sucrose | 0.0492 | –0.1233 * | ||
| sucrose c | DHA–erythritol | 0.0511 | –0.1875 * | ||
| Time (min) | 30 a | 0.000 * | 30–60 | 0.0552 | –0.1396 * |
| 60 b | 60–90 | 0.0555 | –0.3507 | ||
| 90 b | 90–120 | 0.0571 | –0.0801 * | ||
| 120 c | 120–150 | 0.0582 | –0.0378 | ||
| 150 cd | 120–180 | 0.0571 | –0.0915 * | ||
| 180 d | 150–180 | 0.0571 | –0.0538 | ||
| Type of sonication | OD b | 0.000 * | OD–US | 0.0333 | 0.0164 |
| OD+US b | OD–USi | 0.0325 | 0.0872 * | ||
| OD+USi a | US–USi | 0.0328 | 0.0708 * | ||
Statistical differences between factors; a Tukey test of main effects was performed. * Denotes a statistically significant difference. Means within columns with a different lowercase letter superscript are significantly different – homogeneous groups (p < 0.05).
Table 6.
Values of k1, k2, R2, χ2, CRV, and RMSE of modelling SG using Peleg’s model.
| Solution | Application | k1 (kg/kg·min) | k2 (kg/kg) | R2 | χ2 | CRV (%) | RMSE |
|---|---|---|---|---|---|---|---|
| Erythritol | OD | 103.136 | 0.782 | 0.906 | 0.002 | 10.65 | 0.041 |
| OD+US | 66.307 | 1.302 | 0.699 | 0.009 | 22.11 | 0.079 | |
| OD+USi | 187.963 | 0.282 | 0.962 | 0.001 | 8.62 | 0.030 | |
| Xylitol | OD | 89.979 | 1.108 | 0.899 | 0.002 | 9.88 | 0.034 |
| OD+US | 114.672 | 0.806 | 0.869 | 0.006 | 17.48 | 0.065 | |
| OD+USi | 158.859 | 0.822 | 0.801 | 0.007 | 24.26 | 0.071 | |
| Maltitol | OD | 138.805 | 1.398 | 0.849 | 0.004 | 23.47 | 0.052 |
| OD+US | 7432.023 | 38.048 | 0.719 | 0.013 | 35.55 | 0.095 | |
| OD+USi | 186.212 | 3.007 | 0.484 | 0.004 | 25.93 | 0.053 | |
| DHA | OD | 79.275 | 1.975 | 0.757 | 0.003 | 18.20 | 0.050 |
| OD+US | 126.674 | 1.606 | 0.869 | 0.000 | 7.36 | 0.019 | |
| OD+USi | 1796.065 | –7.29 | 0.854 | 0.001 | 22.53 | 0.029 | |
| Sucrose | OD | 22.821 | 1.254 | 0.802 | 0.004 | 10.63 | 0.055 |
Table 7.
The influence of osmotic agents and pre-treatment time on true water loss during OD.
| Factor | p-Value | Contrast | +/– Limits | Difference | |
|---|---|---|---|---|---|
| Type of osmotic substance | erythritol c | 0.000 * | erythritol–xylitol | 0.0554 | 0.1245 * |
| xylitol b | erythritol–sucrose | 0.0558 | –0.1033 * | ||
| maltitol a | xylitol–maltitol | 0.0556 | 0.3357 * | ||
| DHA b | xylitol–sucrose | 0.0568 | –0.2278 * | ||
| sucrose d | DHA–erythritol | 0.0590 | –0.0943 * | ||
| Time (min) | 30 a | 0.000 * | 30–60 | 0.0637 | –0.1525 * |
| 60 b | 60–90 | 0.0640 | –0.1351 * | ||
| 90 c | 90–120 | 0.0659 | –0.0353 | ||
| 120 cd | 120–150 | 0.0672 | –0.0162 | ||
| 150 cd | 120–180 | 0.0659 | –0.0602 | ||
| 180 d | 150–180 | 0.0660 | –0.0440 | ||
| Type of sonication | OD b | 0.000 * | OD–US | 0.0384 | –0.0106 |
| OD+US b | OD–USi | 0.0375 | 0.0563 * | ||
| OD+USi a | US–USi | 0.0379 | 0.0669 * | ||
Statistical differences between factors; a Tukey test of main effects was performed. * Denotes a statistically significant difference. Means within columns with a different lowercase letter superscript are significantly different – homogeneous groups (p < 0.05).
Table 8.
Values of k1, k2, R2, χ2, CRV, and RMSE of modelling WLT using Peleg’s model.
| Solution | Application | k1 (kg/kg·min) | k2 (kg/kg) | R2 | χ2 | CRV (%) | RMSE |
|---|---|---|---|---|---|---|---|
| Erythritol | OD | 8.734 | 0.993 | 0.723 | 0.005 | 7.94 | 0.058 |
| OD+US | 27.541 | 0.743 | 0.932 | 0.006 | 8.39 | 0.064 | |
| OD+USi | 10.986 | 0.900 | 0.934 | 0.003 | 5.74 | 0.044 | |
| Xylitol | OD | 13.276 | 0.982 | 0.899 | 0.001 | 4.62 | 0.033 |
| OD+US | 30.771 | 0.932 | 0.897 | 0.005 | 9.85 | 0.061 | |
| OD+USi | 24.939 | 0.947 | 0.817 | 0.012 | 15.01 | 0.095 | |
| Maltitol | OD | 34.796 | 1.338 | 0.860 | 0.000 | 3.23 | 0.015 |
| OD+US | 31.860 | 1.763 | 0.791 | 0.003 | 11.70 | 0.044 | |
| OD+USi | 95.468 | 1.349 | 0.836 | 0.003 | 14.91 | 0.047 | |
| DHA | OD | 10.983 | 0.966 | 0.958 | 0.002 | 4.67 | 0.033 |
| OD+US | 33.461 | 0.823 | 0.864 | 0.011 | 13.08 | 0.087 | |
| OD+USi | 34.938 | 0.818 | 0.955 | 0.003 | 6.91 | 0.045 | |
| Sucrose | OD | 36.246 | 0.696 | 0.959 | 0.003 | 6.50 | 0.049 |
Table 9.
The influence of osmotic agents and pre-treatment time on CR during OD.
| Factor | p-Value | Contrast | +/– Limits | Difference | |
|---|---|---|---|---|---|
| Type of osmotic substance | erythritol b | 0.000 * | erythritol–xylitol | 0.0254 | –0.0144 |
| xylitol b | erythritol–sucrose | 0.0256 | 0.0470 * | ||
| maltitol c | xylitol–maltitol | 0.0255 | –0.0721 * | ||
| DHA c | xylitol–sucrose | 0.0260 | 0.0614 * | ||
| sucrose a | DHA–erythritol | 0.0270 | 0.1009 * | ||
| Time (min) | 30 d | 0.000 * | 30–60 | 0.0292 | 0.0854 * |
| 60 c | 60–90 | 0.0293 | 0.0233 | ||
| 90 c | 90–120 | 0.0302 | 0.0429 * | ||
| 120 b | 120–150 | 0.0308 | 0.0130 | ||
| 150 ab | 120–180 | 0.0302 | 0.0415 * | ||
| 180 a | 150–180 | 0.0302 | 0.0285 | ||
| Type of sonication | OD a | 0.000 * | OD–US | 0.0176 | –0.0034 |
| OD+US a | OD–USi | 0.0172 | –0.0482 * | ||
| OD+USi b | US–USi | 0.0174 | –0.0447 * | ||
Statistical differences between factors; a Tukey test of main effects was performed. * Denotes a statistically significant difference. Means within columns with a different lowercase letter superscript are significantly different – homogeneous groups (p < 0.05).
Table 10.
Values of k1, k2, R2, χ2, CRV, and RMSE of modelling CR using Peleg’s model.
| Solution | Application | k1 (kg/kg·min) | k2 (kg/kg) | R2 | χ2 | CRV (%) | RMSE |
|---|---|---|---|---|---|---|---|
| Erythritol | OD | 139.433 | 1.645 | 0.959 | 0.001 | 3.28 | 0.019 |
| OD+US | 85.026 | 2.295 | 0.794 | 0.002 | 5.92 | 0.036 | |
| OD+USi | 235.305 | 1.046 | 0.960 | 0.000 | 1.92 | 0.012 | |
| Xylitol | OD | 124.570 | 1.997 | 0.942 | 0.000 | 3.23 | 0.020 |
| OD+US | 137.717 | 1.700 | 0.889 | 0.001 | 4.75 | 0.028 | |
| OD+USi | 209.326 | 1.637 | 0.858 | 0.001 | 5.14 | 0.033 | |
| Maltitol | OD | 255.096 | 2.046 | 0.877 | 0.002 | 5.05 | 0.034 |
| OD+US | 94.274 | 3.031 | 0.664 | 0.002 | 5.75 | 0.037 | |
| OD+USi | 72.079 | 4.168 | 0.565 | 0.001 | 4.33 | 0.030 | |
| DHA | OD | 77.326 | 3.007 | 0.893 | 0.001 | 4.15 | 0.027 |
| OD+US | 138.372 | 2.578 | 0.903 | 0.000 | 1.97 | 0.013 | |
| OD+USi | 1479.120 | –4.603 | 0.824 | 0.001 | 3.21 | 0.024 | |
| Sucrose | OD | 23.758 | 2.260 | 0.967 | 0.001 | 3.83 | 0.020 |
Table 11.
The influence of osmotic agents and pre-treatment time on water activity during OD.
| Factor | p-Value | Contrast | +/– Limits | Difference | |
|---|---|---|---|---|---|
| Type of osmotic substance | erythritol a | 0.000 * | erythritol–xylitol | 0.0067 | –0.0052 |
| xylitol ab | erythritol–sucrose | 0.0062 | –0.0050 | ||
| maltitol c | xylitol–maltitol | 0.0062 | –0.0246 * | ||
| DHA b | xylitol–sucrose | 0.0063 | 0.0002 | ||
| sucrose ab | DHA–erythritol | 0.0066 | 0.0083 * | ||
| Time (min) | 30 d | 0.000 * | 30–60 | 0.0071 | 0.0080 * |
| 60 bc | 60–90 | 0.0071 | –0.0035 | ||
| 90 cd | 90–120 | 0.0074 | 0.0123 * | ||
| 120 a | 120–150 | 0.0075 | –0.0037 | ||
| 150 ab | 120–180 | 0.0074 | –0.0009 | ||
| 180 a | 150–180 | 0.0074 | 0.0028 | ||
| Type of sonication | OD c | 0.000 * | OD–US | 0.0043 | 0.0682 * |
| OD+US a | OD–USi | 0.0042 | 0.0606 * | ||
| OD+USi b | US–USi | 0.0042 | –0.0075 * | ||
Statistical differences between factors; a Tukey test of main effects was performed. * Denotes a statistically significant difference. Means within columns with a different lowercase letter superscript are significantly different – homogeneous groups (p < 0.05).
Table 12.
Values of the browning index (BI) parameter during OD in different solutions. OD: osmotic dehydration; US: continuous sonication; USi: interval sonication.
Table 12.
Values of the browning index (BI) parameter during OD in different solutions. OD: osmotic dehydration; US: continuous sonication; USi: interval sonication.
| Time (min) | Solution/Application | Sucrose | Erythritol | Xylitol | Maltitol | DHA |
|---|---|---|---|---|---|---|
| 0 | 20.67 ± 2.12 | |||||
| 30 | OD | 14.4 ± 1.3 | 16.6 ± 1.5 | 13.8 ± 0.2 | 14.3 ± 1.2 | 21.2 ± 4.5 |
| OD+US | 25.3 ± 0.4 | 25.0 ± 0.5 | 31.2 ± 2.6 | 28.2 ± 1.4 | 24.3 ± 0.0 | |
| OD+USi | 27.6 ± 3.8 | 48.3 ± 0.9 | 39.6 ± 1.0 | 43.9 ± 3.0 | 30.0 ± 1.8 | |
| 60 | OD | 17.6 ± 3.8 | 23.7 ± 0.7 | 24.6 ± 1.8 | 22.4 ± 3.0 | 22.0 ± 3.5 |
| OD+US | 23.9 ± 1.7 | 26.8 ± 0.4 | 29.7 ± 0.6 | 31.1 ± 4.7 | 33.3 ± 3.0 | |
| OD+USi | 29.1 ± 1.6 | 48.2 ± 1.7 | 45.7 ± 0.0 | 41.8 ± 2.1 | 32.7 ± 1.7 | |
| 90 | OD | 16.2 ± 3.1 | 22.1 ± 1.7 | 20.4 ± 4.2 | 20.9 ± 0.2 | 19.4 ± 2.9 |
| OD+US | 24.9 ± 1.5 | 30.7 ± 2.8 | 28.9 ± 0.8 | 30.2 ± 0.8 | 28.7 ± 0.7 | |
| OD+USi | 29.5 ± 1.2 | 44.1 ± 0.5 | 29.1 ± 1.8 | 52.3 ± 5.7 | 36.6 ± 2.2 | |
| 120 | OD | 16.9 ± 1.5 | 21.1 ± 1.2 | 19.4 ± 3.9 | 19.4 ± 2.6 | 23.1 ± 7.2 |
| OD+US | 23.1 ± 0.2 | 27.7 ± 0.1 | 36.9 ± 1.5 | 26.7 ± 1.4 | 31.7 ± 0.1 | |
| OD+USi | 28.4 ± 0.0 | 45.5 ± 0.6 | 33.3 ± 1.6 | 46.8 ± 3.6 | 32.0 ± 1.0 | |
| 150 | OD | 16.7 ± 2.8 | 19.7 ± 0.1 | 20.7 ± 4.8 | 21.5 ± 0.9 | 22.9 ± 2.0 |
| OD+US | 24.3 ± 2.3 | 28.8 ± 0.9 | 32.3 ± 1.2 | 25.7 ± 0.1 | 24.5 ± 0.2 | |
| OD+USi | 28.4 ± 0.0 | 49.0 ± 5.3 | 30.7 ± 0.1 | 31.3 ± 0.4 | 43.3 ± 0.4 | |
| 180 | OD | 15.0 ± 0.5 | 19.8 ± 1.7 | 19.8 ± 2.6 | 22.8 ± 1.5 | 22.4 ± 6.4 |
| OD+US | 19.8 ± 0.1 | 26.5 ± 2.4 | 28.4 ± 2.5 | 33.8 ± 0.2 | 26.7 ± 0.2 | |
| OD+USi | 32.4 ± 1.5 | 48.0 ± 1.7 | 33.9 ± 0.3 | 33.5 ± 1.8 | 45.0 ± 1.0 | |
Table 13.
The influence of osmotic agents and pre-treatment time on the BI parameter during OD.
| Factor | p-Value | Contrast | +/– Limits | Difference | |
|---|---|---|---|---|---|
| Type of osmotic substance | erythritol c | 0.000 * | erythritol–xylitol | 3.0435 | 3.1333 * |
| xylitol b | erythritol–sucrose | 3.0435 | 8.4874 * | ||
| maltitol bc | xylitol–maltitol | 3.0435 | –1.6702 | ||
| DHA bc | xylitol–sucrose | 3.0435 | 5.3541 * | ||
| sucrose a | DHA–erythritol | 3.0435 | –2.9343 | ||
| Time (min) | 30 a | 0.130 | 30–60 | 3.4854 | –3.2889 |
| 60 a | 60–90 | 3.4854 | 1.3982 | ||
| 90 a | 90–120 | 3.4854 | –0.0402 | ||
| 120 a | 120–150 | 3.4854 | 0.9655 | ||
| 150 a | 120–180 | 3.4854 | –0.2985 | ||
| 180 a | 150–180 | 3.4854 | –1.2640 | ||
| Type of sonication | OD a | 0.000 * | OD–US | 2.0206 | –8.5294 * |
| OD+US b | OD–USi | 2.0206 | –18.3389 * | ||
| OD+USi c | US–USi | 2.0206 | –9.8096 * | ||
Statistical differences between factors; a Tukey test of main effects was performed. * Denotes a statistically significant difference. Means within columns with a different lowercase letter superscript are significantly different – homogeneous groups (p <0.05).
Table 14.
Values of absolute colour difference (∆E) during OD in different solutions. OD: osmotic dehydration; US: continuous sonication; USi: interval sonication.
Table 14.
Values of absolute colour difference (∆E) during OD in different solutions. OD: osmotic dehydration; US: continuous sonication; USi: interval sonication.
| Time (min) | Solution/Application | Sucrose | Erythritol | Xylitol | Maltitol | DHA |
|---|---|---|---|---|---|---|
| 30 | OD | 6.6 ± 1.1 | 5.7 ± 0.3 | 7.5 ± 0.3 | 7.0 ± 0.8 | 5.1 ± 1.3 |
| OD+US | 5.1 ± 0.3 | 4.4 ± 0.1 | 8.6 ± 0.6 | 6.1 ± 0.5 | 4.4 ± 0.2 | |
| OD+USi | 5.9 ± 1.7 | 15.3 ± 0.1 | 12.5 ± 0.6 | 12.5 ± 1.0 | 6.4 ± 1.1 | |
| 60 | OD | 6.2 ± 0.1 | 6.8 ± 0.7 | 7.4 ± 1.0 | 6.1 ± 0.8 | 5.9 ± 1.6 |
| OD+US | 5.1 ± 1.0 | 7.4 ± 0.6 | 9.0 ± 0.7 | 8.9 ± 1.8 | 8.6 ± 1.4 | |
| OD+USi | 6.5 ± 0.9 | 16.2 ± 0.4 | 15.3 ± 0.2 | 15.3 ± 0.8 | 7.8 ± 0.9 | |
| 90 | OD | 5.6 ± 0.6 | 7.2 ± 0.1 | 6.2 ± 0.7 | 5.5 ± 0.0 | 5.3 ± 2.4 |
| OD+US | 5.0 ± 0.3 | 7.8 ± 1.4 | 8.5 ± 0.4 | 8.8 ± 0.4 | 7.5 ± 0.5 | |
| OD+USi | 7.0 ± 0.5 | 14.5 ± 0.0 | 7.9 ± 1.0 | 7.9 ± 1.8 | 10.4 ± 0.9 | |
| 120 | OD | 5.2 ± 0.7 | 6.3 ± 0.7 | 6.7 ± 0.0 | 6.3 ± 0.8 | 6.2 ± 0.1 |
| OD+US | 4.2 ± 0.0 | 7.5 ± 0.1 | 11.7 ± 0.3 | 6.8 ± 0.8 | 8.5 ± 0.2 | |
| OD+USi | 6.1 ± 0.6 | 15.9 ± 0.7 | 10.3 ± 0.8 | 10.3 ± 0.8 | 8.6 ± 0.2 | |
| 150 | OD | 5.3 ± 0.4 | 6.3 ± 0.3 | 6.7 ± 0.5 | 4.8 ± 0.2 | 5.2 ± 0.1 |
| OD+US | 4.3 ± 1.2 | 8.7 ± 0.0 | 10.4 ± 0.7 | 7.2 ± 0.3 | 6.4 ± 0.2 | |
| OD+USi | 6.7 ± 0.2 | 17.3 ± 1.3 | 9.0 ± 0.3 | 9.0 ± 0.0 | 14.5 ± 0.5 | |
| 180 | OD | 5.7 ± 0.2 | 6.8 ± 0.4 | 6.1 ± 0.8 | 5.7 ± 0.4 | 5.9 ± 0.4 |
| OD+US | 5.4 ± 0.4 | 6.5 ± 0.9 | 9.0 ± 1.1 | 10.2 ± 0.3 | 6.8 ± 0.9 | |
| OD+USi | 8.9 ± 0.5 | 15.8 ± 0.8 | 11.0 ± 0.0 | 11.0 ± 0.8 | 14.8 ± 0.4 |
Table 15.
The influence of osmotic agents and pre-treatment time on absolute colour difference during OD.
Table 15.
The influence of osmotic agents and pre-treatment time on absolute colour difference during OD.
| Factor | P-Value | Contrast | +/– Limits | Difference | |
|---|---|---|---|---|---|
| Type of osmotic substance | erythritol c | 0.000 * | erythritol–xylitol | 1.4168 | 0.6972 |
| xylitol c | erythritol–sucrose | 1.4168 | 3.9778 * | ||
| maltitol bc | xylitol–maltitol | 1.4168 | 0.1278 | ||
| DHA b | xylitol–sucrose | 1.4168 | 3.2806 * | ||
| sucrose a | DHA–erythritol | 1.4168 | –2.1333 * | ||
| Time (min) | 30 a | 0.468 | 30–60 | 1.6225 | –1.0933 |
| 60 a | 60–90 | 1.6225 | 0.4500 | ||
| 90 a | 90–120 | 1.6225 | –0.0833 | ||
| 120 a | 120–150 | 1.6225 | 0.2033 | ||
| 150 a | 120–180 | 1.6225 | –0.2233 | ||
| 180 a | 150–180 | 1.6225 | -0.4267 | ||
| Type of sonication | OD a | 0.000 * | OD–US | 0.9406 | –1.1800 * |
| OD+US b | OD–USi | 0.9406 | –5.3083 * | ||
| OD+USi c | US–USi | 0.9406 | –4.1283 * | ||
Statistical differences between factors; a Tukey test of main effects was performed. * Denotes a statistically significant difference. Means within columns with a different lowercase letter superscript are significantly different – homogeneous groups (p < 0.05).
© 2019 by the authors. Licensee MDPI, Basel, Switzerland. This article is an open access article distributed under the terms and conditions of the Creative Commons Attribution (CC BY) license (http://creativecommons.org/licenses/by/4.0/).
Share and Cite
MDPI and ACS Style
Cichowska, J.; Witrowa-Rajchert, D.; Stasiak-Różańska, L.; Figiel, A. Ultrasound-Assisted Osmotic Dehydration of Apples in Polyols and Dihydroxyacetone (DHA) Solutions. Molecules 2019, 24, 3429. https://doi.org/10.3390/molecules24193429
AMA Style
Cichowska J, Witrowa-Rajchert D, Stasiak-Różańska L, Figiel A. Ultrasound-Assisted Osmotic Dehydration of Apples in Polyols and Dihydroxyacetone (DHA) Solutions. Molecules. 2019; 24(19):3429. https://doi.org/10.3390/molecules24193429
Chicago/Turabian StyleCichowska, Joanna, Dorota Witrowa-Rajchert, Lidia Stasiak-Różańska, and Adam Figiel. 2019. "Ultrasound-Assisted Osmotic Dehydration of Apples in Polyols and Dihydroxyacetone (DHA) Solutions" Molecules 24, no. 19: 3429. https://doi.org/10.3390/molecules24193429