Article

Discovery of Lipid Peroxidation Inhibitors from Bacopa Species Prioritized through Multivariate Data Analysis and Multi-Informative Molecular Networking

by
Tongchai Saesong
1,
Pierre-Marie Allard
2,
Emerson Ferreira Queiroz
2,
Laurence Marcourt
2,
Nitra Nuengchamnong
3,
Prapapan Temkitthawon
1,
Nantaka Khorana
4,
Jean-Luc Wolfender
2,* and
Kornkanok Ingkaninan
1,*
1
Department of Pharmaceutical Chemistry and Pharmacognosy, Faculty of Pharmaceutical Sciences and Center of Excellence for Innovation in Chemistry, Naresuan University, Phitsanulok 65000, Thailand
2
School of Pharmaceutical Sciences, EPGL, University of Geneva, University of Lausanne, CMU Rue Michel Servet 1, 1211 Geneva 4, Switzerland
3
Science Lab Center, Faculty of Science, Naresuan University, Phitsanulok 65000, Thailand
4
Division of Pharmaceutical Sciences, School of Pharmaceutical Sciences, University of Phayao, Phayao 56000, Thailand
*
Authors to whom correspondence should be addressed.
Molecules 2019, 24(16), 2989; https://doi.org/10.3390/molecules24162989
Submission received: 29 June 2019 / Revised: 14 August 2019 / Accepted: 15 August 2019 / Published: 17 August 2019
(This article belongs to the Special Issue Natural Products and Drug Discovery)

Abstract

:
A major goal in the discovery of bioactive natural products is to rapidly identify active compound(s) and dereplicate known molecules from complex biological extracts. The conventional bioassay-guided fractionation process can be time consuming and often requires multi-step procedures. Herein, we apply a metabolomic strategy merging multivariate data analysis and multi-informative molecular maps to rapidly prioritize bioactive molecules directly from crude plant extracts. The strategy was applied to 59 extracts of three Bacopa species (B. monnieri, B. caroliniana and B. floribunda), which were profiled by UHPLC-HRMS2 and screened for anti-lipid peroxidation activity. Using this approach, six lipid peroxidation inhibitors 16 of three Bacopa spp. were discovered, three of them being new compounds: monnieraside IV (4), monnieraside V (5) and monnieraside VI (6). The results demonstrate that this combined approach could efficiently guide the discovery of new bioactive natural products. Furthermore, the approach allowed to evidence that main semi-quantitative changes in composition linked to the anti-lipid peroxidation activity were also correlated to seasonal effects notably for B. monnieri.

Graphical Abstract

1. Introduction

Natural products (NPs) play an important role as a source of various pharmaceuticals and biologically active substances. However, the discovery of new bioactive NPs is challenging because of the inherent complex composition of crude natural extracts. Such extracts contain hundreds, if not thousands, of chemical constituents and the purification and identification of bioactive NPs by conventional methods is a time consuming multi-step procedure. Moreover, bioactive substances can be lost during purification and effort can be wasted in the unnecessary re-isolation of known NPs. Therefore, it is important to pinpoint bioactive candidates and recognize known metabolites (dereplication) early in the purification process in order to avoid the redundant isolation of known molecules [1,2].
Recently, metabolomics combined with multivariate data analysis (MVA) has proven to be an efficient tool to predict bioactive constituents in NP research [3,4,5,6,7]. Metabolomics aims at providing comprehensive qualitative and quantitative analysis of the whole set of metabolites (metabolome) present in a complex biological sample [8,9]. The most used analytical techniques in metabolomics are nuclear magnetic resonance (NMR) and mass spectrometry (MS) [10]. Generally metabolite profiling of natural extracts is achieved via high resolution ultra-high performance liquid chromatography (UHPLC), coupled to high resolution tandem mass spectrometry (HRMS2), which provides molecular formula and fragmentation information on most NPs in extracts in an untargeted manner [11]. Unsupervised or supervised multivariate data analysis such as principal components analysis (PCA) or orthogonal partial least squares (OPLS) are then needed to mine such data and highlight biomarkers. Alternative strategies have been developed to explore LC-HRMS2 metabolite profiling datasets with the aim of highlighting structural similarities between analytes and efficiently identify new compounds with potential therapeutic interest. Molecular network analysis (MN) [12,13] is a computer-based approach allowing the organization of fragmentation spectra from MS-based metabolomics experiments in order to dereplicate and eventually prioritize natural products of interest [14,15,16]. MN is generated based on the similarities of fragmentation patterns and, thus, indirectly allows the grouping of analytes with closely related structures. Networks can be built using the Global Natural Product Social Molecular Networking (GNPS) platform [17] or software such as Metgem or MS-Dial [18,19].
Bacopa is a genus of aquatic plants belonging to the Plantaginaceae family. Three species occur in Thailand: B. monnieri, B. caroliniana and B. floribunda [20]. Among them, only B. monnieri (Brahmi) has been reported as a herbal medicine in Ayurvedic medicine for learning and memory improvement [21]. The safety and efficacy of Brahmi extracts in animal models [22,23] and in clinical trials [24,25,26,27,28] have been proven and support its traditional uses. Intake of Brahmi has been reported to exert undesirable effects on the gastrointestinal tract, such as nausea, increased stool frequency and abdominal cramps [25,29], which might be explained by a cholinergic effect [30]. In addition, severe liver toxicity has been detected in women taking Brahmi products for vitiligo disease. Nevertheless, their liver function returned to normal after discontinuation of products’ usage [31]. Other reports however indicated that Brahmi possessed hepatoprotective activity [32,33]. Notwithstanding such adverse effects and considering the positive effects of the plant in relation with cognition improvements, further investigations are still worth to identify bioactive principles.
The compounds responsible for the memory enhancing effects of Brahmi have been reported to be triterpenoid saponins i.e., bacoside A3, bacopaside I, bacopaside II, bacopasaponin C and bacopaside X [34,35]. They are considered as markers of Brahmi [36,37,38,39,40,41], and their level is assessed for quality control purposes. Usually, the level of plant specialized metabolites is highly variable according to environmental factors. In Brahmi, the levels of such markers were found to vary significantly depending on the part of used (leaves, stems, shoots etc.), collection area and season [42,43,44,45].
Moreover, this plant also contains other classes of NPs such as sterols [46], flavonoids [47] and phenylethanoids [48,49] that may play roles in the pharmacological activities of the plant. It has also been reported that part of the neuroprotective effects of Brahmi appeared to result from its antioxidant activities that suppress neuronal oxidative stress. Brahmi has been found to inhibit the lipid peroxidation reaction of brain homogenate in a dose-dependent manner [50].
In this study, we aimed at searching for compounds that could be involved in the memory improvement activity of Brahmi through lipid peroxidation inhibitory activity. In addition, the anti-lipid peroxidation activity of two other Bacopa species has been investigated. To achieve these goals, a metabolomic strategy combining multivariate data analysis (MVA) and bioactivity informed molecular maps [14] was used as a guide to highlight bioactive constituents early in the phytochemical study process and directly target their isolation.

2. Results and Discussion

Fifty-nine extracts of three Bacopa species from different regions of Thailand and harvested at various seasons [summer (March to June), rainy season (July to October) and winter (November to February)] were collected for this study. All extracts were profiled by UHPLC-HRMS2 to generate data that could be used to monitor metabolite profile variations across the whole dataset and provide high quality data dependent MS2 spectra for annotation. In parallel, all of the extracts were screened for their anti-lipid peroxidation activity. Variations in the profiles were then linked to bioactivity modulation through MVA in order to highlight possible bioactive metabolites. In addition, the MS2 dataset was organized using the GNPS platform to generate a MN, which was visualized using Cytoscape software. The bioactivity and taxonomy of plant extracts were mapped on the MN in order to pinpoint cluster(s) of potentially bioactive metabolite(s). The lists of prioritized candidates from MVA and MN were finally compared and the common metabolites were then selected as bioactive candidates. They were annotated based on their MS2 spectra compared with experimental or in silico MS/MS database (GNPS libraries and DNP–ISDB). Both known and possibly novel compounds were isolated to establish their bioactivities and their structures were unambiguously determined by NMR. A summary of the prioritization workflow is presented in Figure 1.

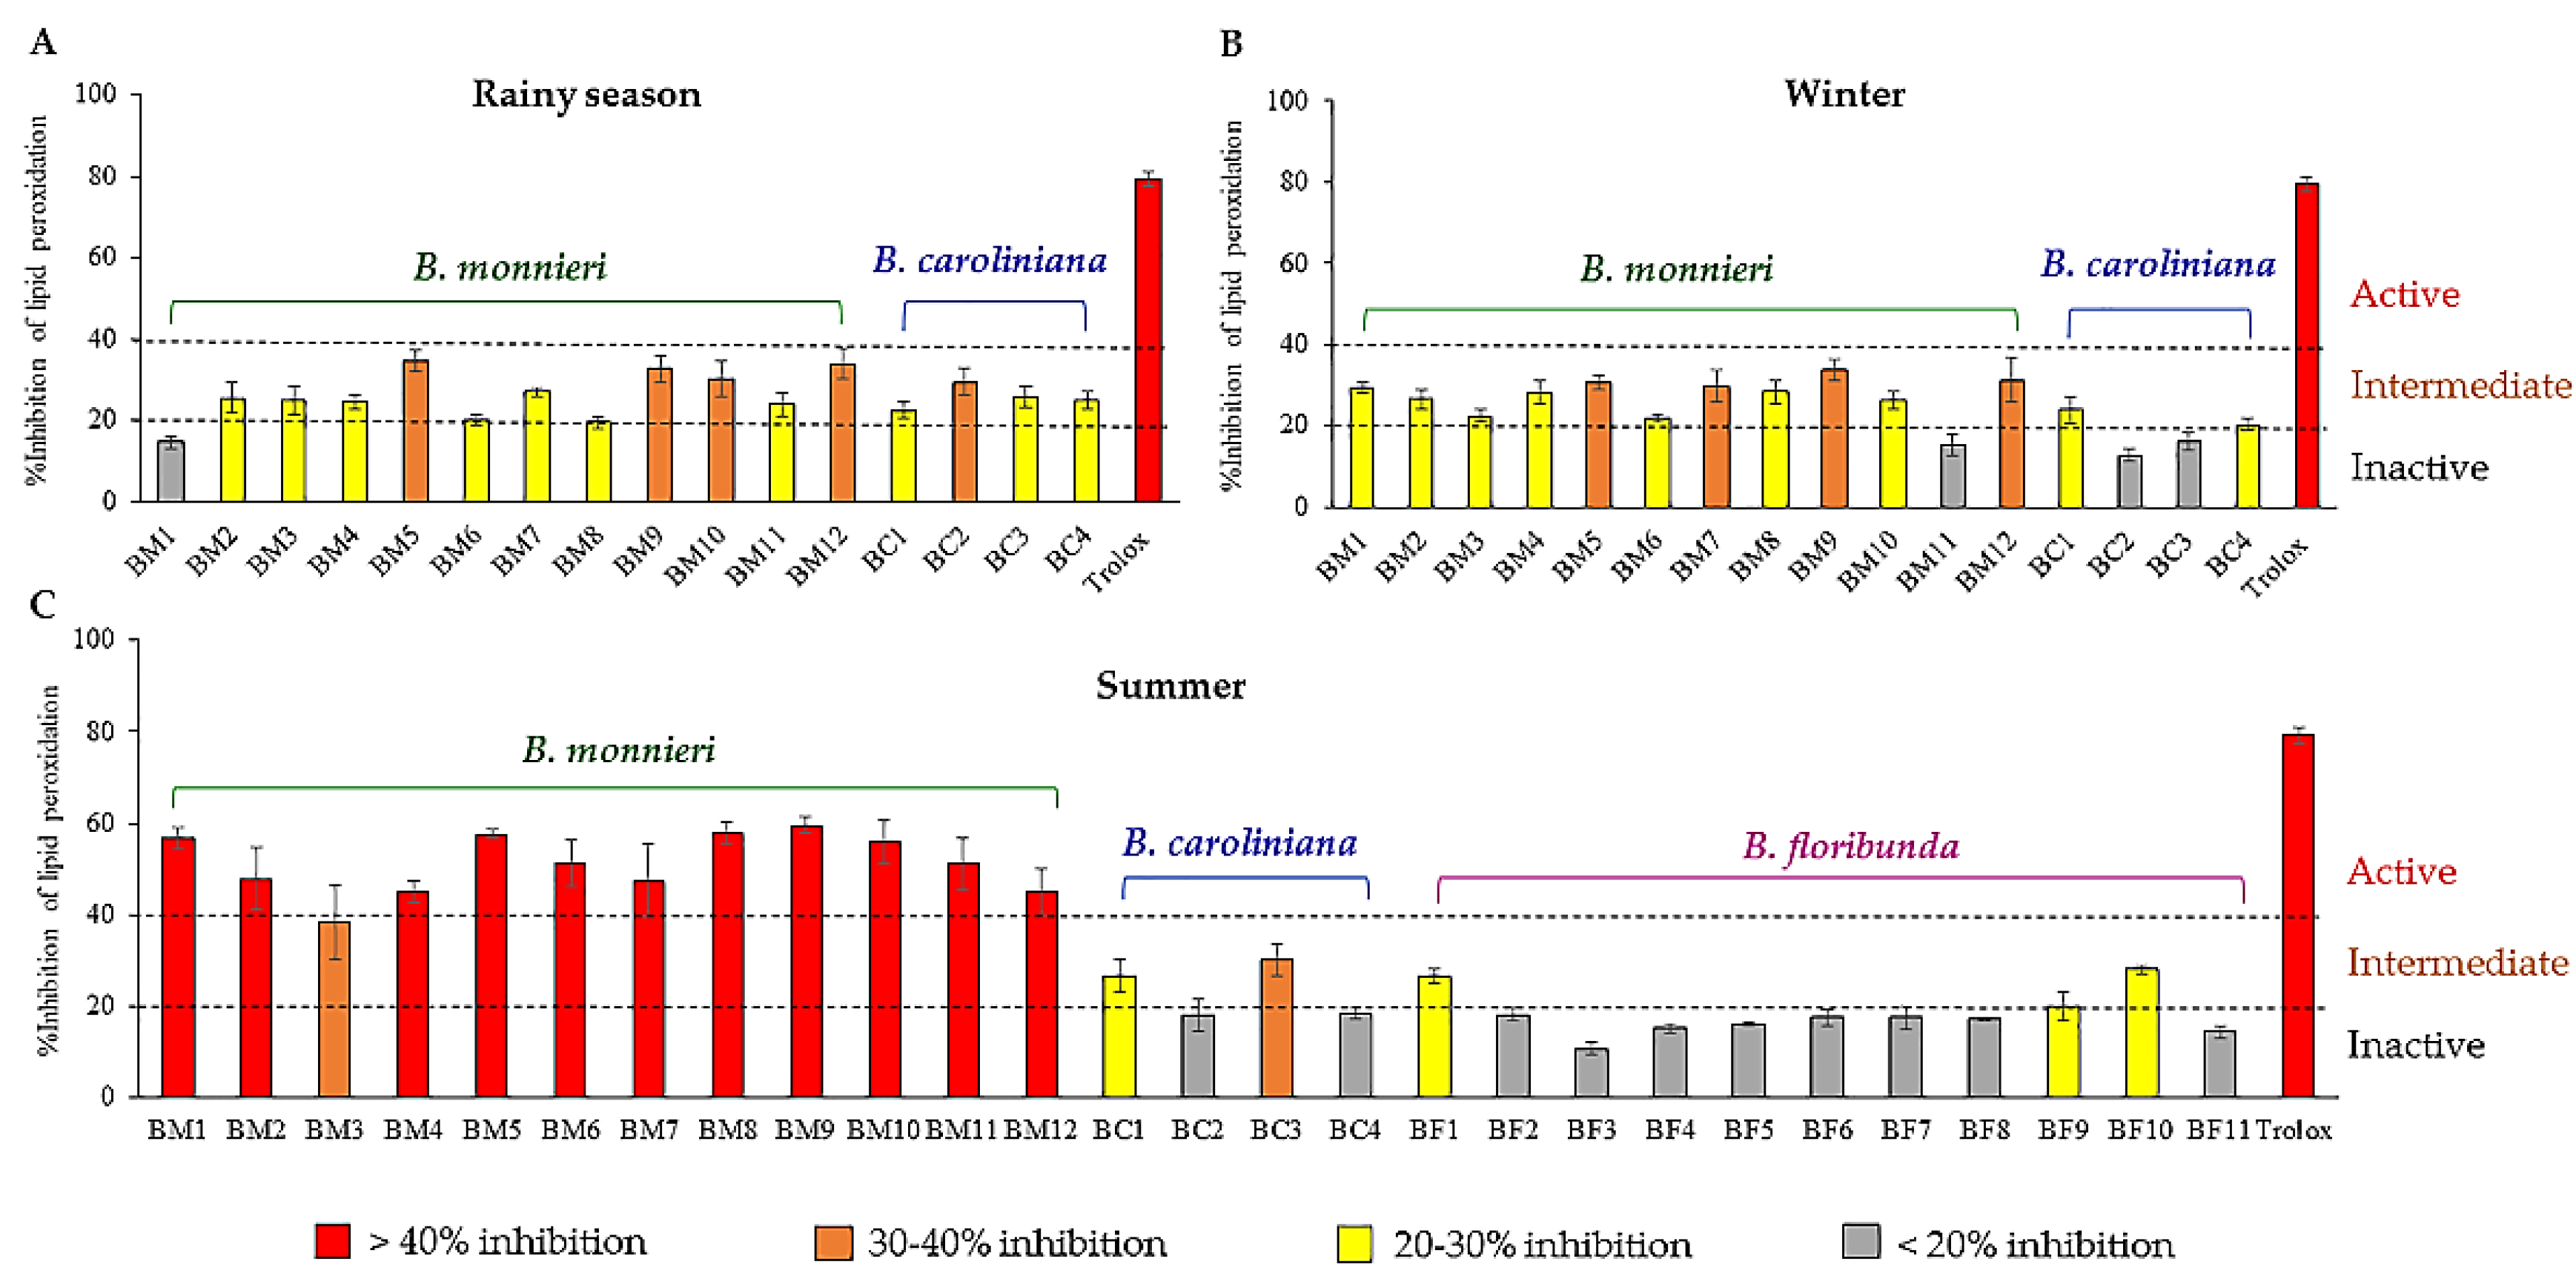
2.1. Lipid Peroxidation Inhibitory Activity Evaluation of the Extracts

The fifty-nine extracts of three Bacopa species collected from different regions of Thailand in rainy season, winter and summer were submitted to a thiobarbituric acid reactive substances (TBAR) assay. A significant variation of lipid peroxidation inhibitory activities between groups of related samples was observed (Figure 2A–C). In particular, B. monnieri harvested in summer (Figure 2C) exhibited stronger inhibitory effects (around 2-fold) than B. monnieri collected in other seasons or than other Bacopa species.

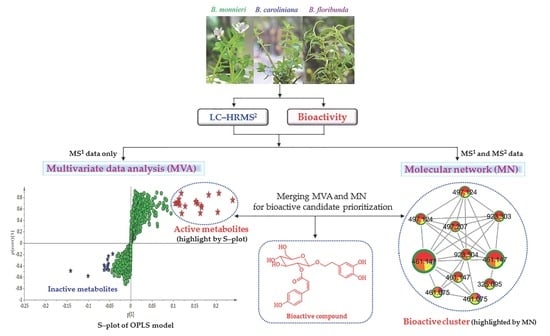
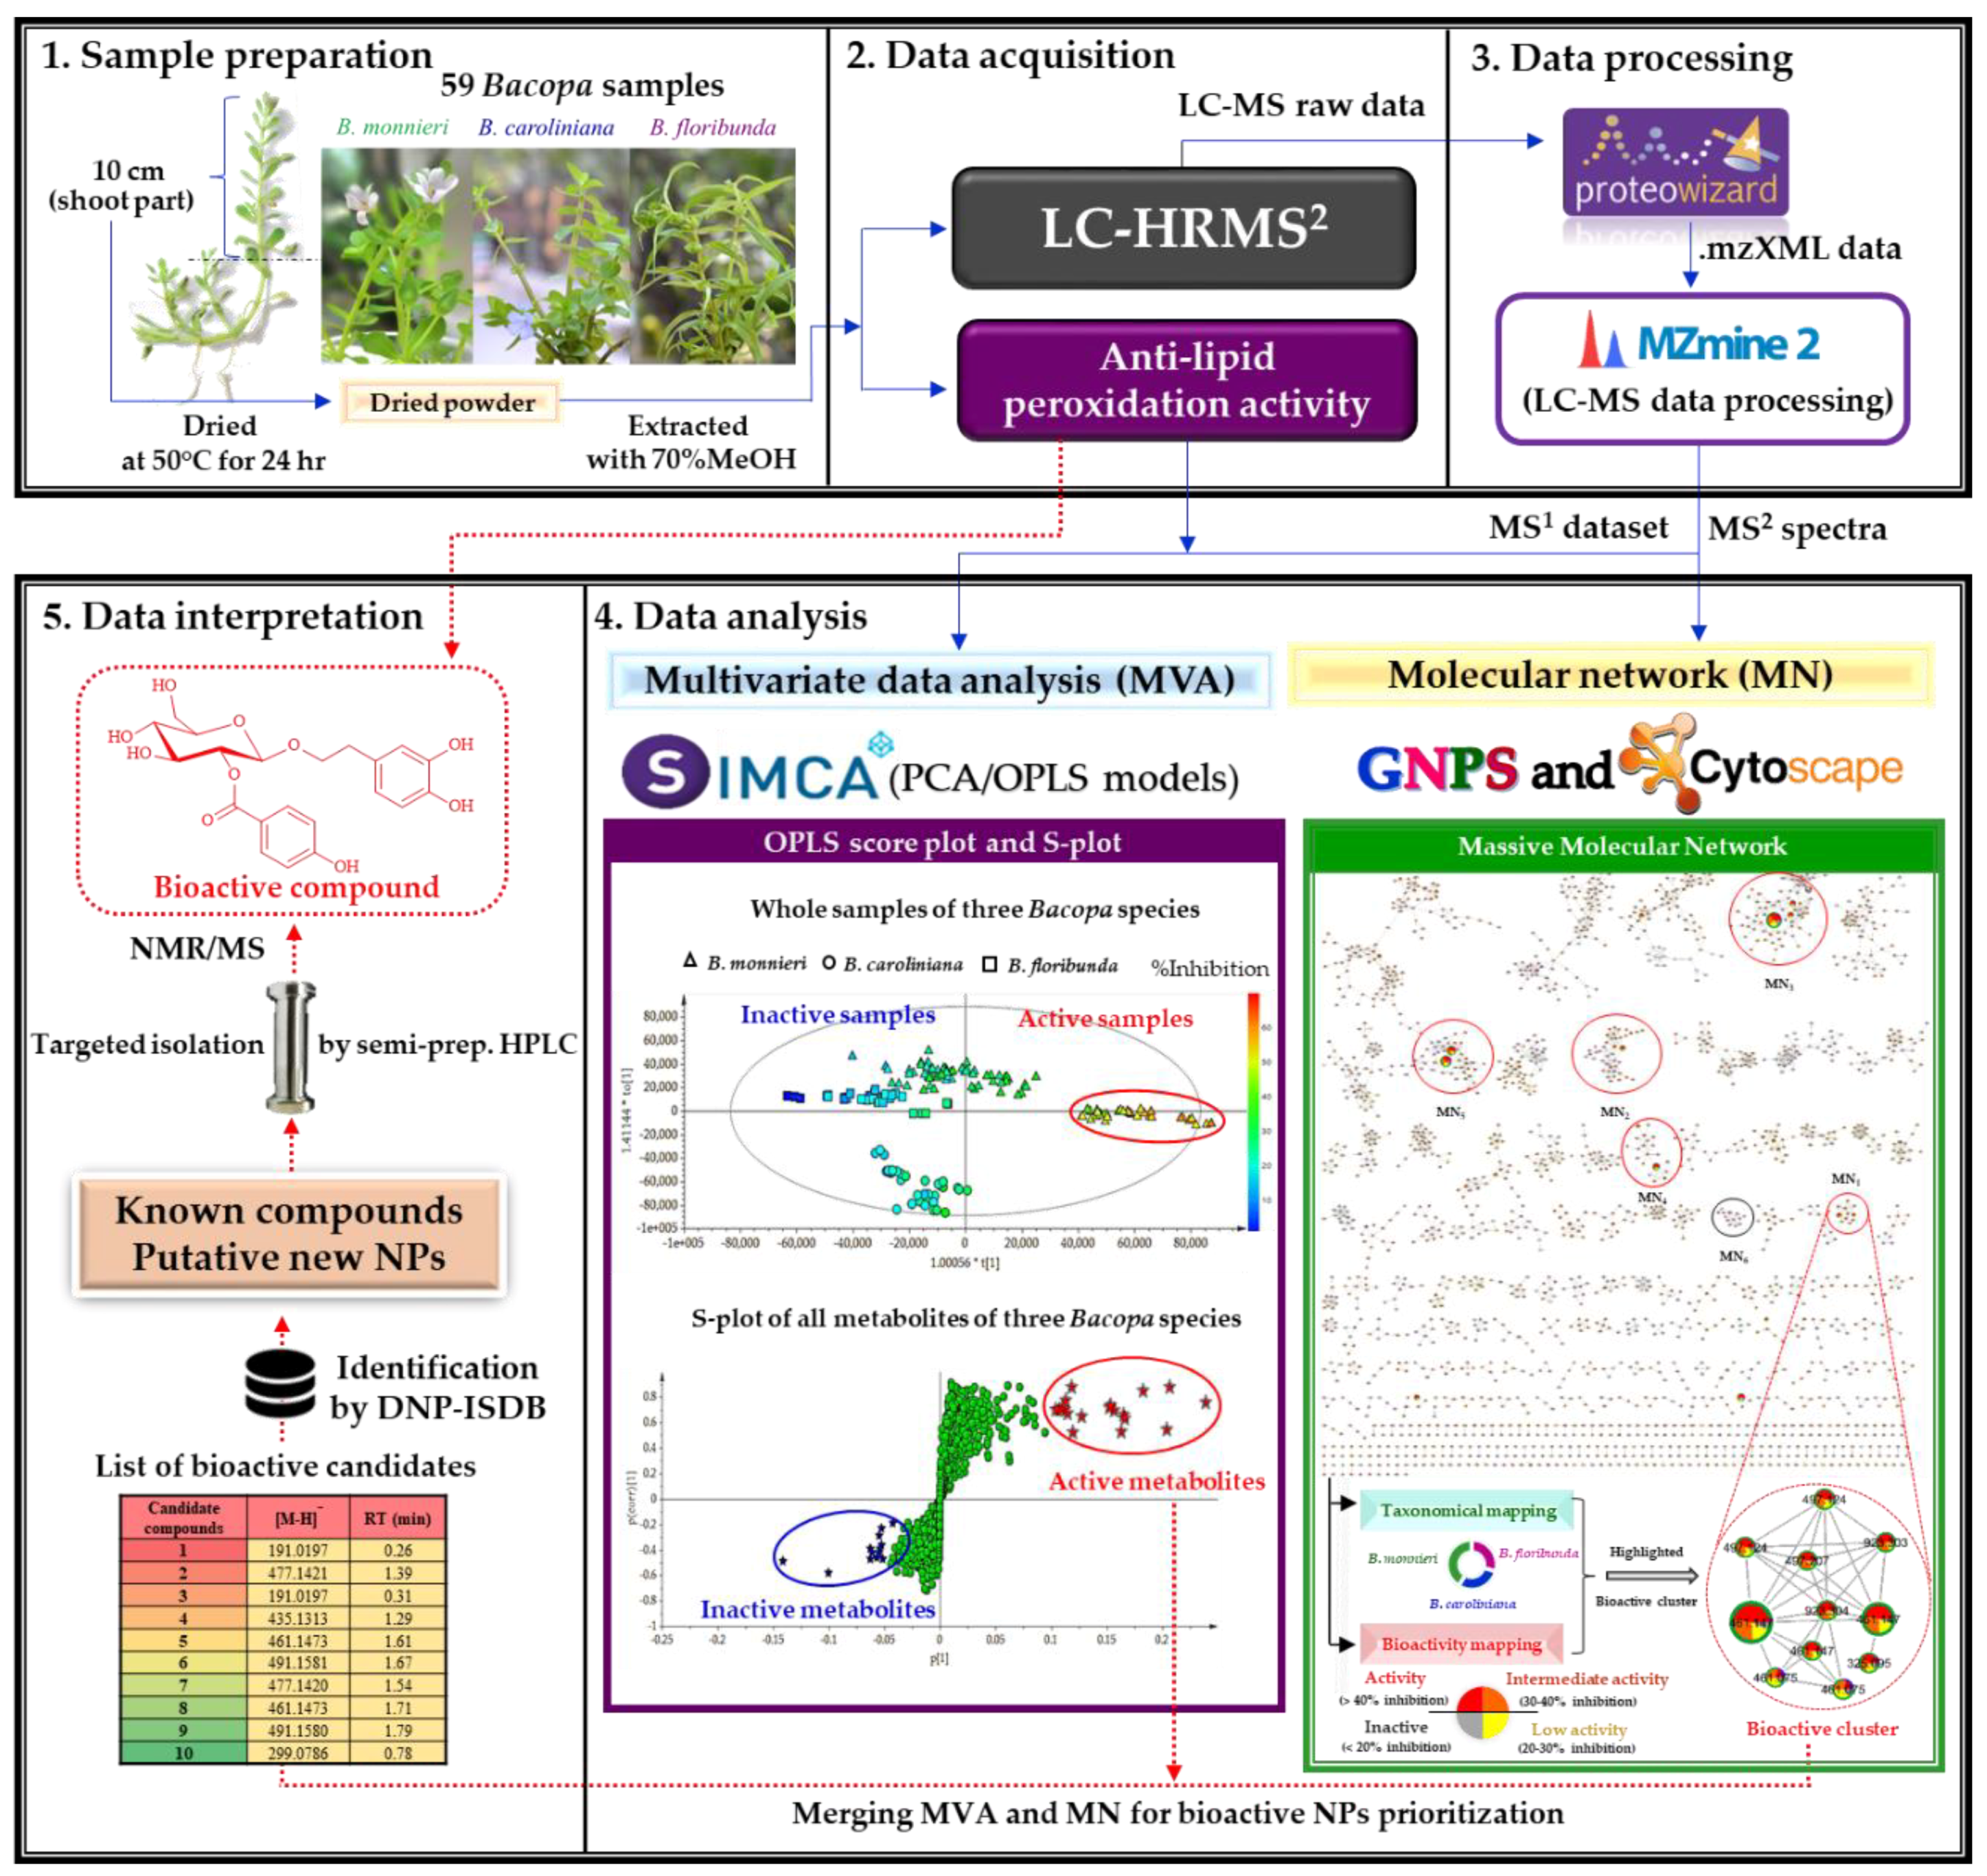
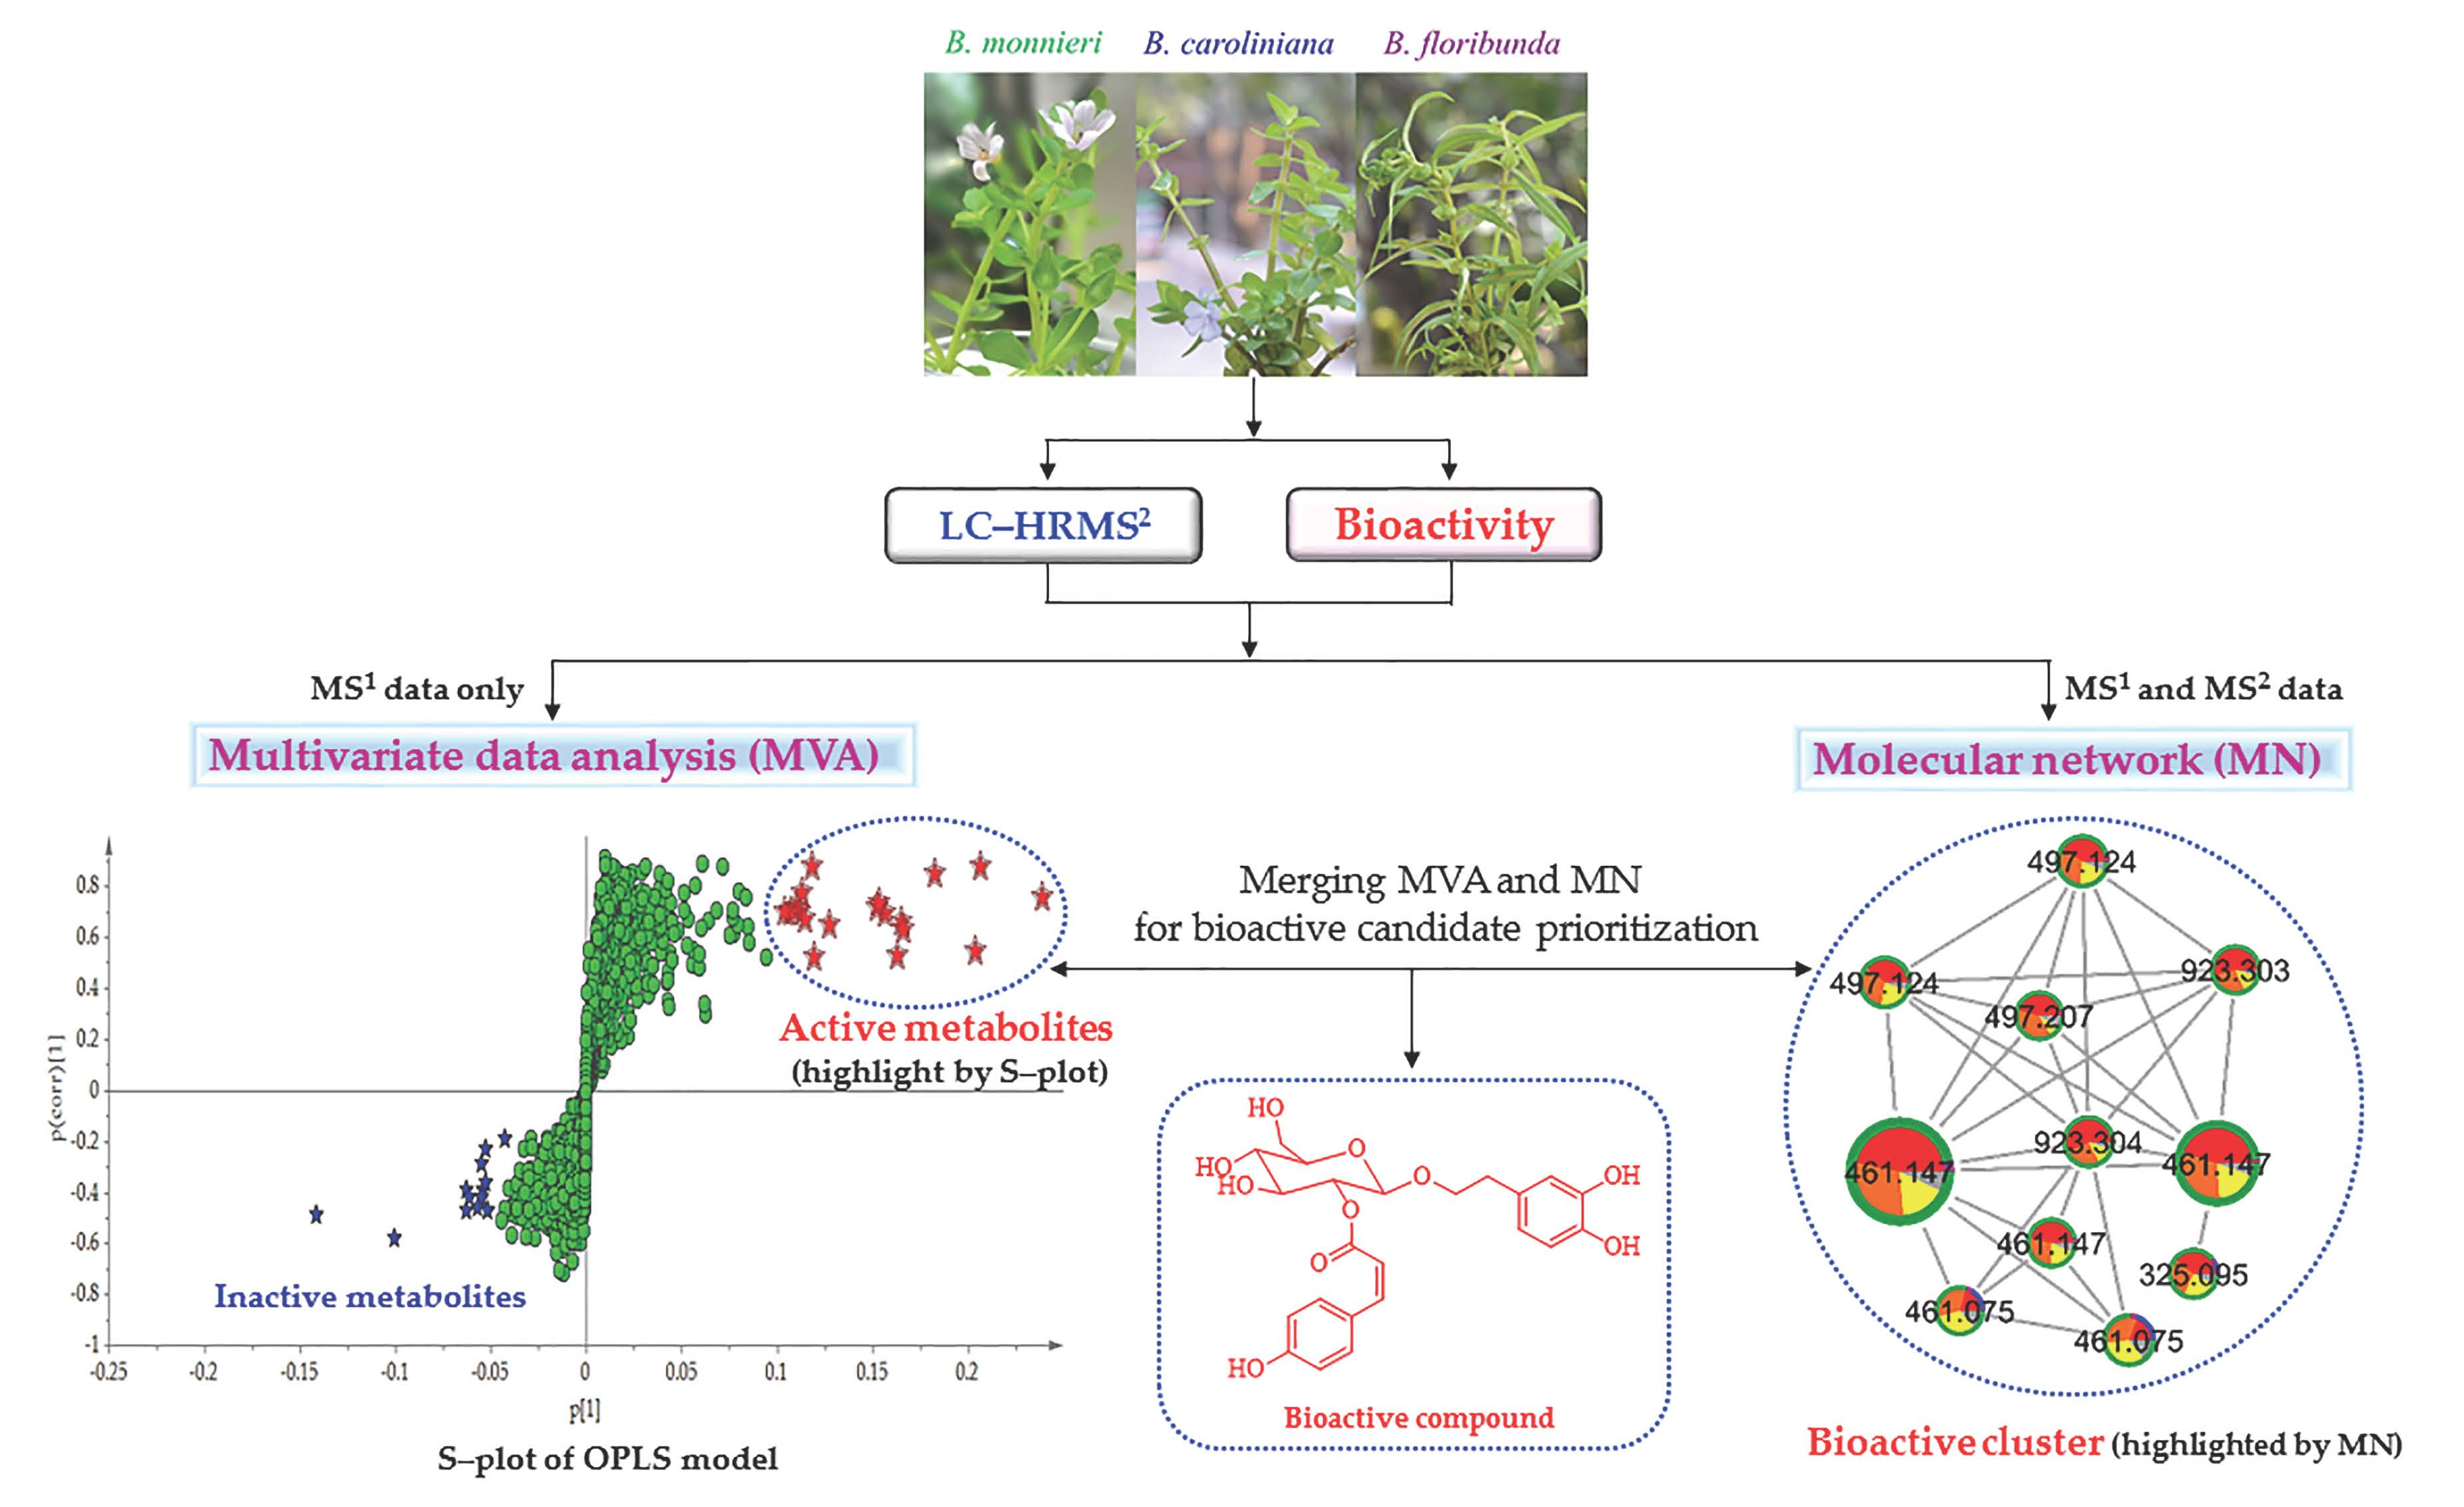
2.2. Potential Bioactive Metabolites Prioritized through Multivariate Statistical Analysis and Molecular Networking

2.2.1. Organization and Pre–Treatment of the Metabolite Profiling Data

All extracts that were screened for bioactivity were profiled by UHPLC-HRMS2 using a generic gradient in negative ionization (NI) mode to provide MS1 and MS2 data of all metabolites in the Bacopa samples. The NI mode was used because it provided far more molecular ion features than the positive ionization (PI) mode for the samples considered. This was in good agreement with the rich polyphenolic content of Bacopa species.
After profiling, the LC–HRMS2 data was treated by MZmine [51] for mass detection, chromatogram building, deconvolution, isotopic peak grouping, alignment and gap filling. This resulted in a peaklist of 6082 features which was further filtered to a peaklist of 4191 features having associated MS2 spectra. This peaklist of 4191 features was exported as input for the MVA (MS1 data only) and for MN generation (MS1 and MS2 data). These data were correlated to the extract’s bioactivity results in order to highlight bioactive compounds responsible for anti–lipid peroxidation in Bacopa species.

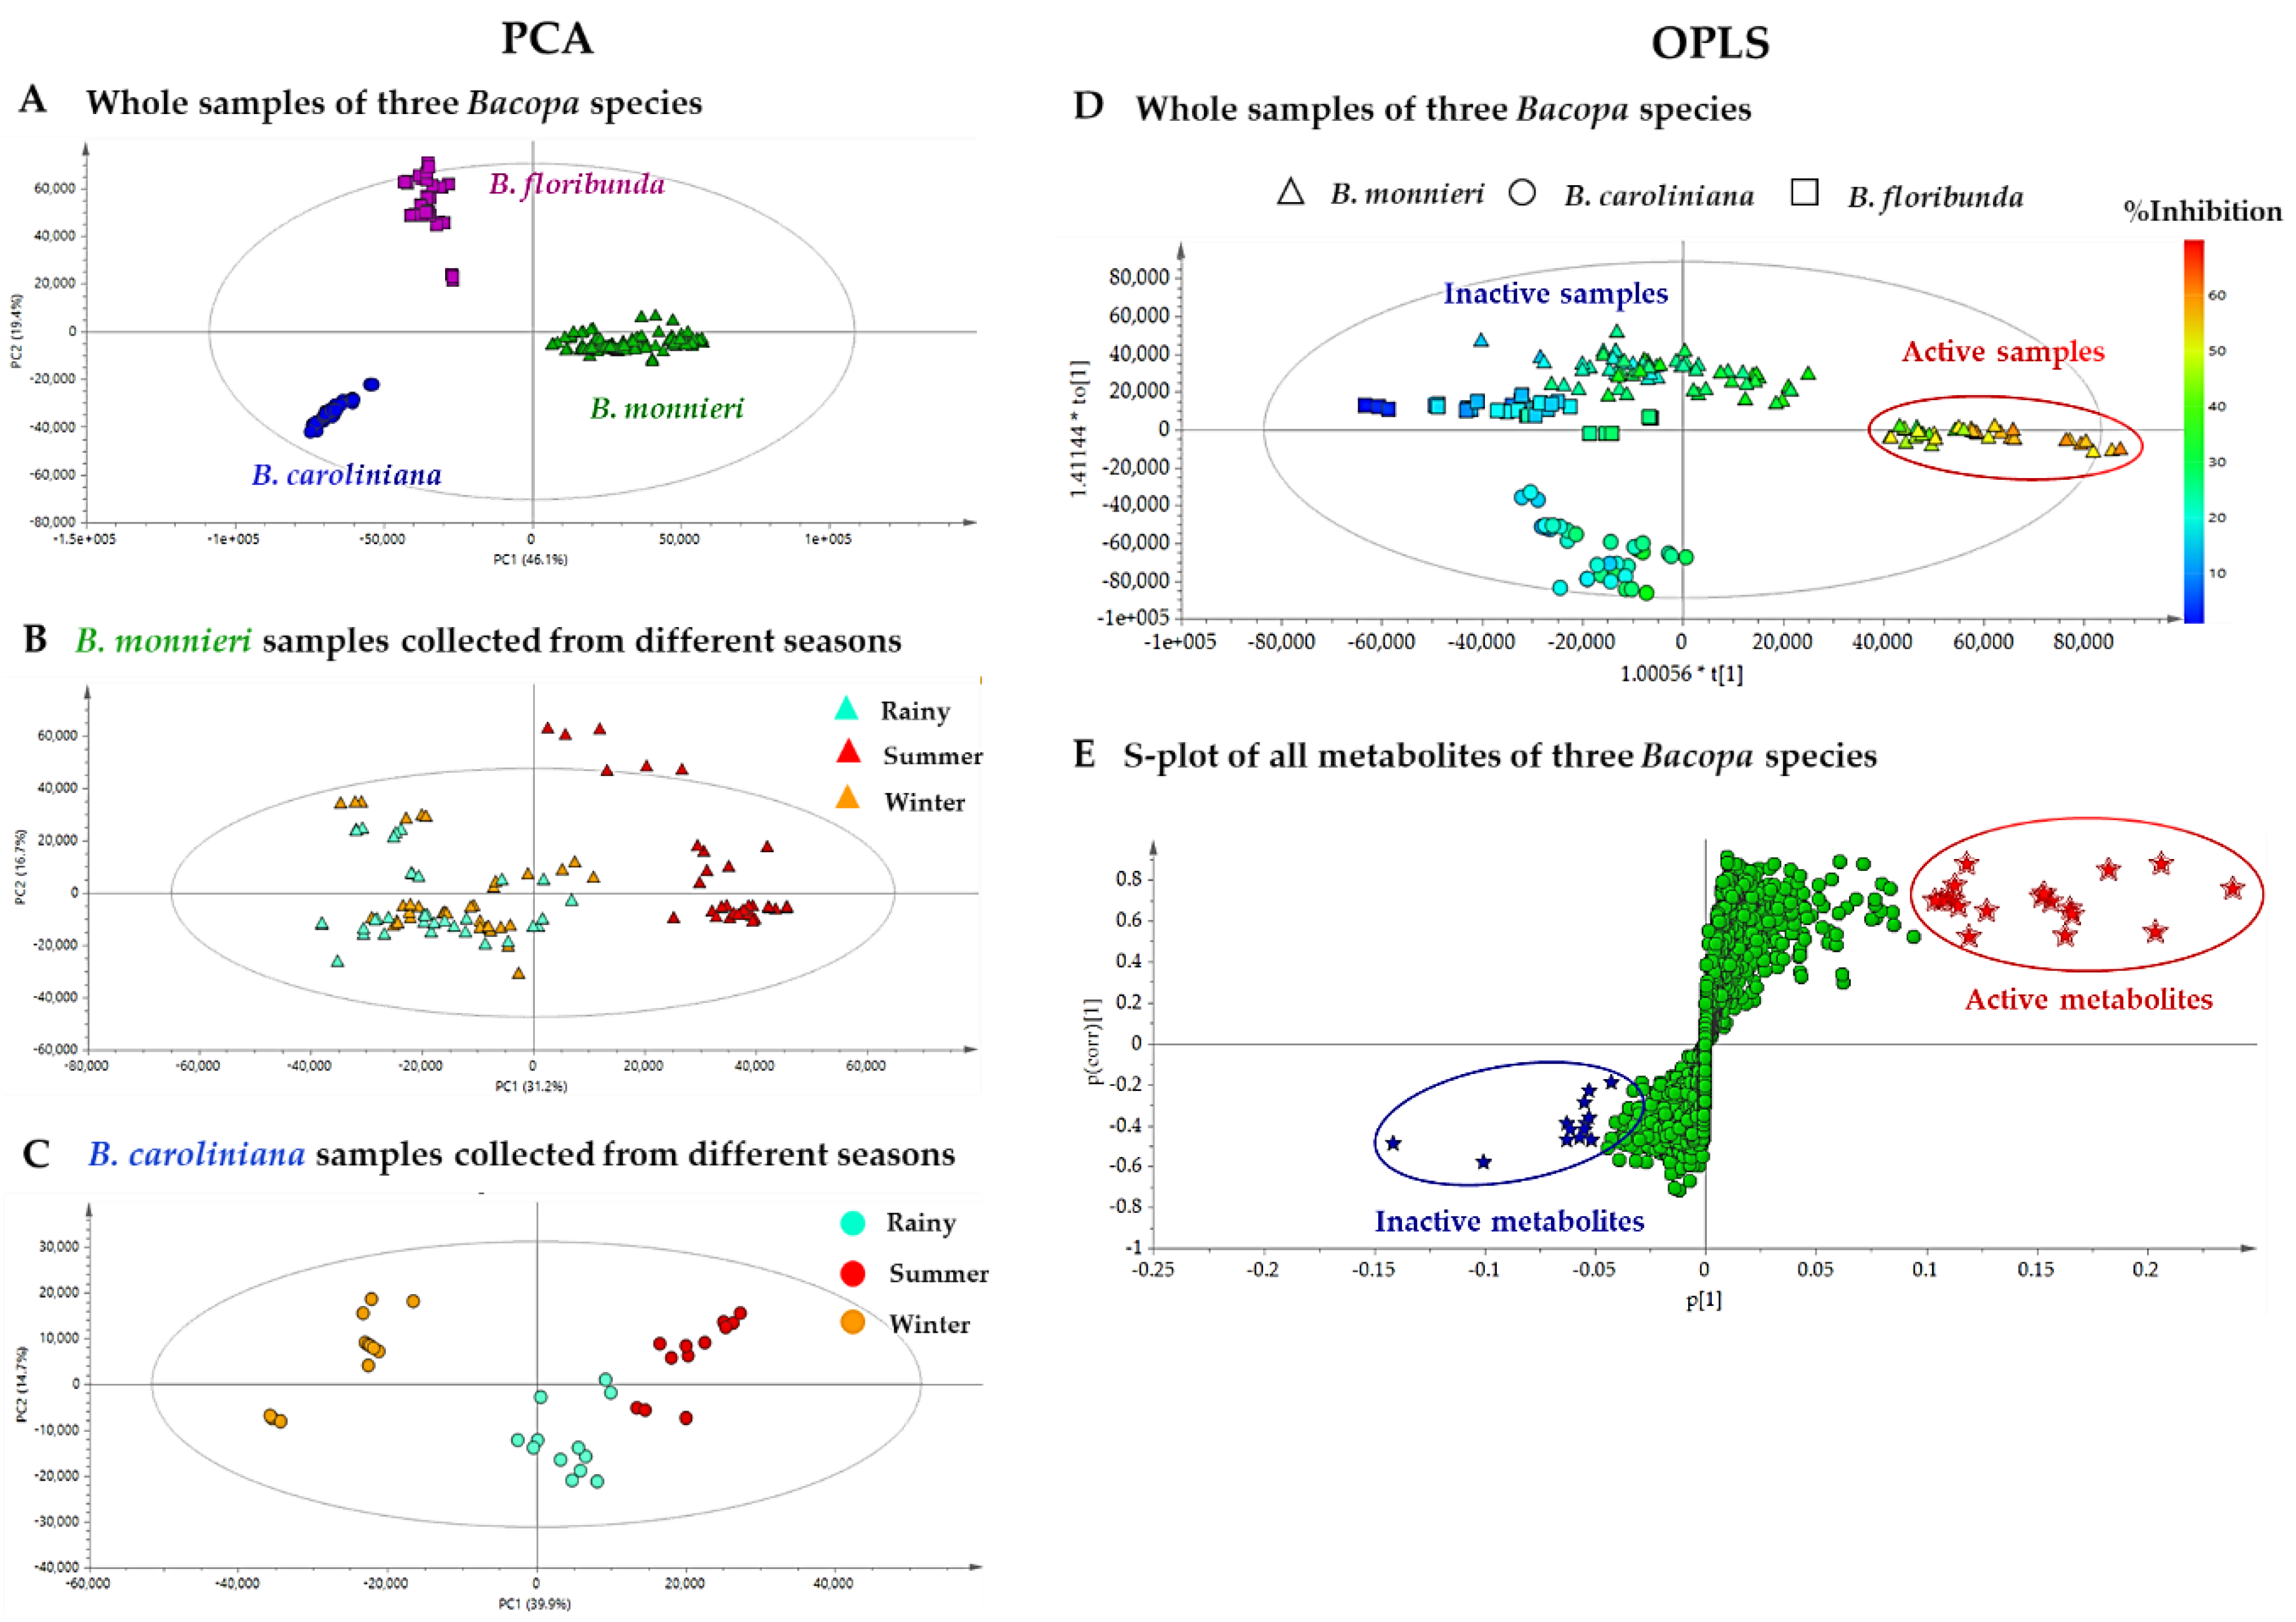
2.2.2. Multivariate Data Analysis

As a preliminary step, the whole MS1 dataset (consisting of m/z values, retention times (RT), and intensities) was analyzed by principal component analysis (PCA) to investigate the differences of metabolite profiles of three Bacopa species and the effects on quality of regional cultivation and seasonal harvesting of BM and BC samples. The PCA scatter plot (normalized by Pareto-scaling) is presented in Figure 3A. It showed obvious discrimination among B. monnieri (BM), B. caroliniana (BC) and B. floribunda (BF), exhibiting 65.50% of the total variance in the dataset (46.10% of the variance for PC1 and 19.40% for PC2). This plot exhibited obvious inter–species variations, while intra–species variation of BM and BC samples could only be observed in the PCA plots generated from the individual datasets of BM and BC (Figure 3B,C). Interestingly, the PCA plot of the BM dataset showed a clear separation between BM samples collected in summer versus those harvested in the rainy season and winter (Figure 3B). For BC, the samples were clustered into three groups, according to the harvesting season (Figure 3C). These results demonstrated that the metabolite profiles of BM and BC in different seasons were different and could thus impact the bioactivity of these samples. Therefore, notably for BM, which is used as a food supplement, the harvesting season clearly needs to be taken in consideration to favor the sought-after bioactivity. On the other hand, the PCA plots indicated that the sample composition did not seem to be affected by the region of provenance.
In order to correlate the variations observed in bioactivities with the metabolite profiles of all extracts, the data was analyzed by a supervised method (OPLS), which is a regression extension of PCA allowing maximization of the separation between groups of observations and pinpointing of variables contributing to the separation. The peaklist consisting of m/z values, RT, and intensities was used as X variables (similarly to what had been done for PCA) and the %inhibitions of lipid peroxidation were used as the Y variables. A significant separation between the active and the inactive groups was observed, as shown in the OPLS score plot (Figure 3D), where a reddish color represents a high %lipid peroxidation inhibition. As expected from the initial screening results (see Figure 2), all samples exhibiting an activity higher than 40% were grouped (BM samples collected in summer). From the S-plot of all metabolites in the Bacopa samples (Figure 3E), 19 features at the upper right corner (highlighted with red stars) were identified as the most discriminating features between the active and non-active samples, and were thus potentially responsible for the observed anti-lipid peroxidation effects. In contrast, the features at the lower left corner corresponded to metabolites that were likely non-actives. These nineteen features with high p[1] values were thus ranked as putative bioactive features (Table 1). Using the m/z and RT of each feature (labeled F in the Table 1), we found that seventeen features corresponded to unique compounds and that two other features, F2 and F8 were adduct and dimer forms of F18 and F3, respectively. Therefore, seventeen bioactive candidates were prioritized from the S-plot. In parallel to this MVA treatment, the same dataset was explored using the multi-informative MN strategy.

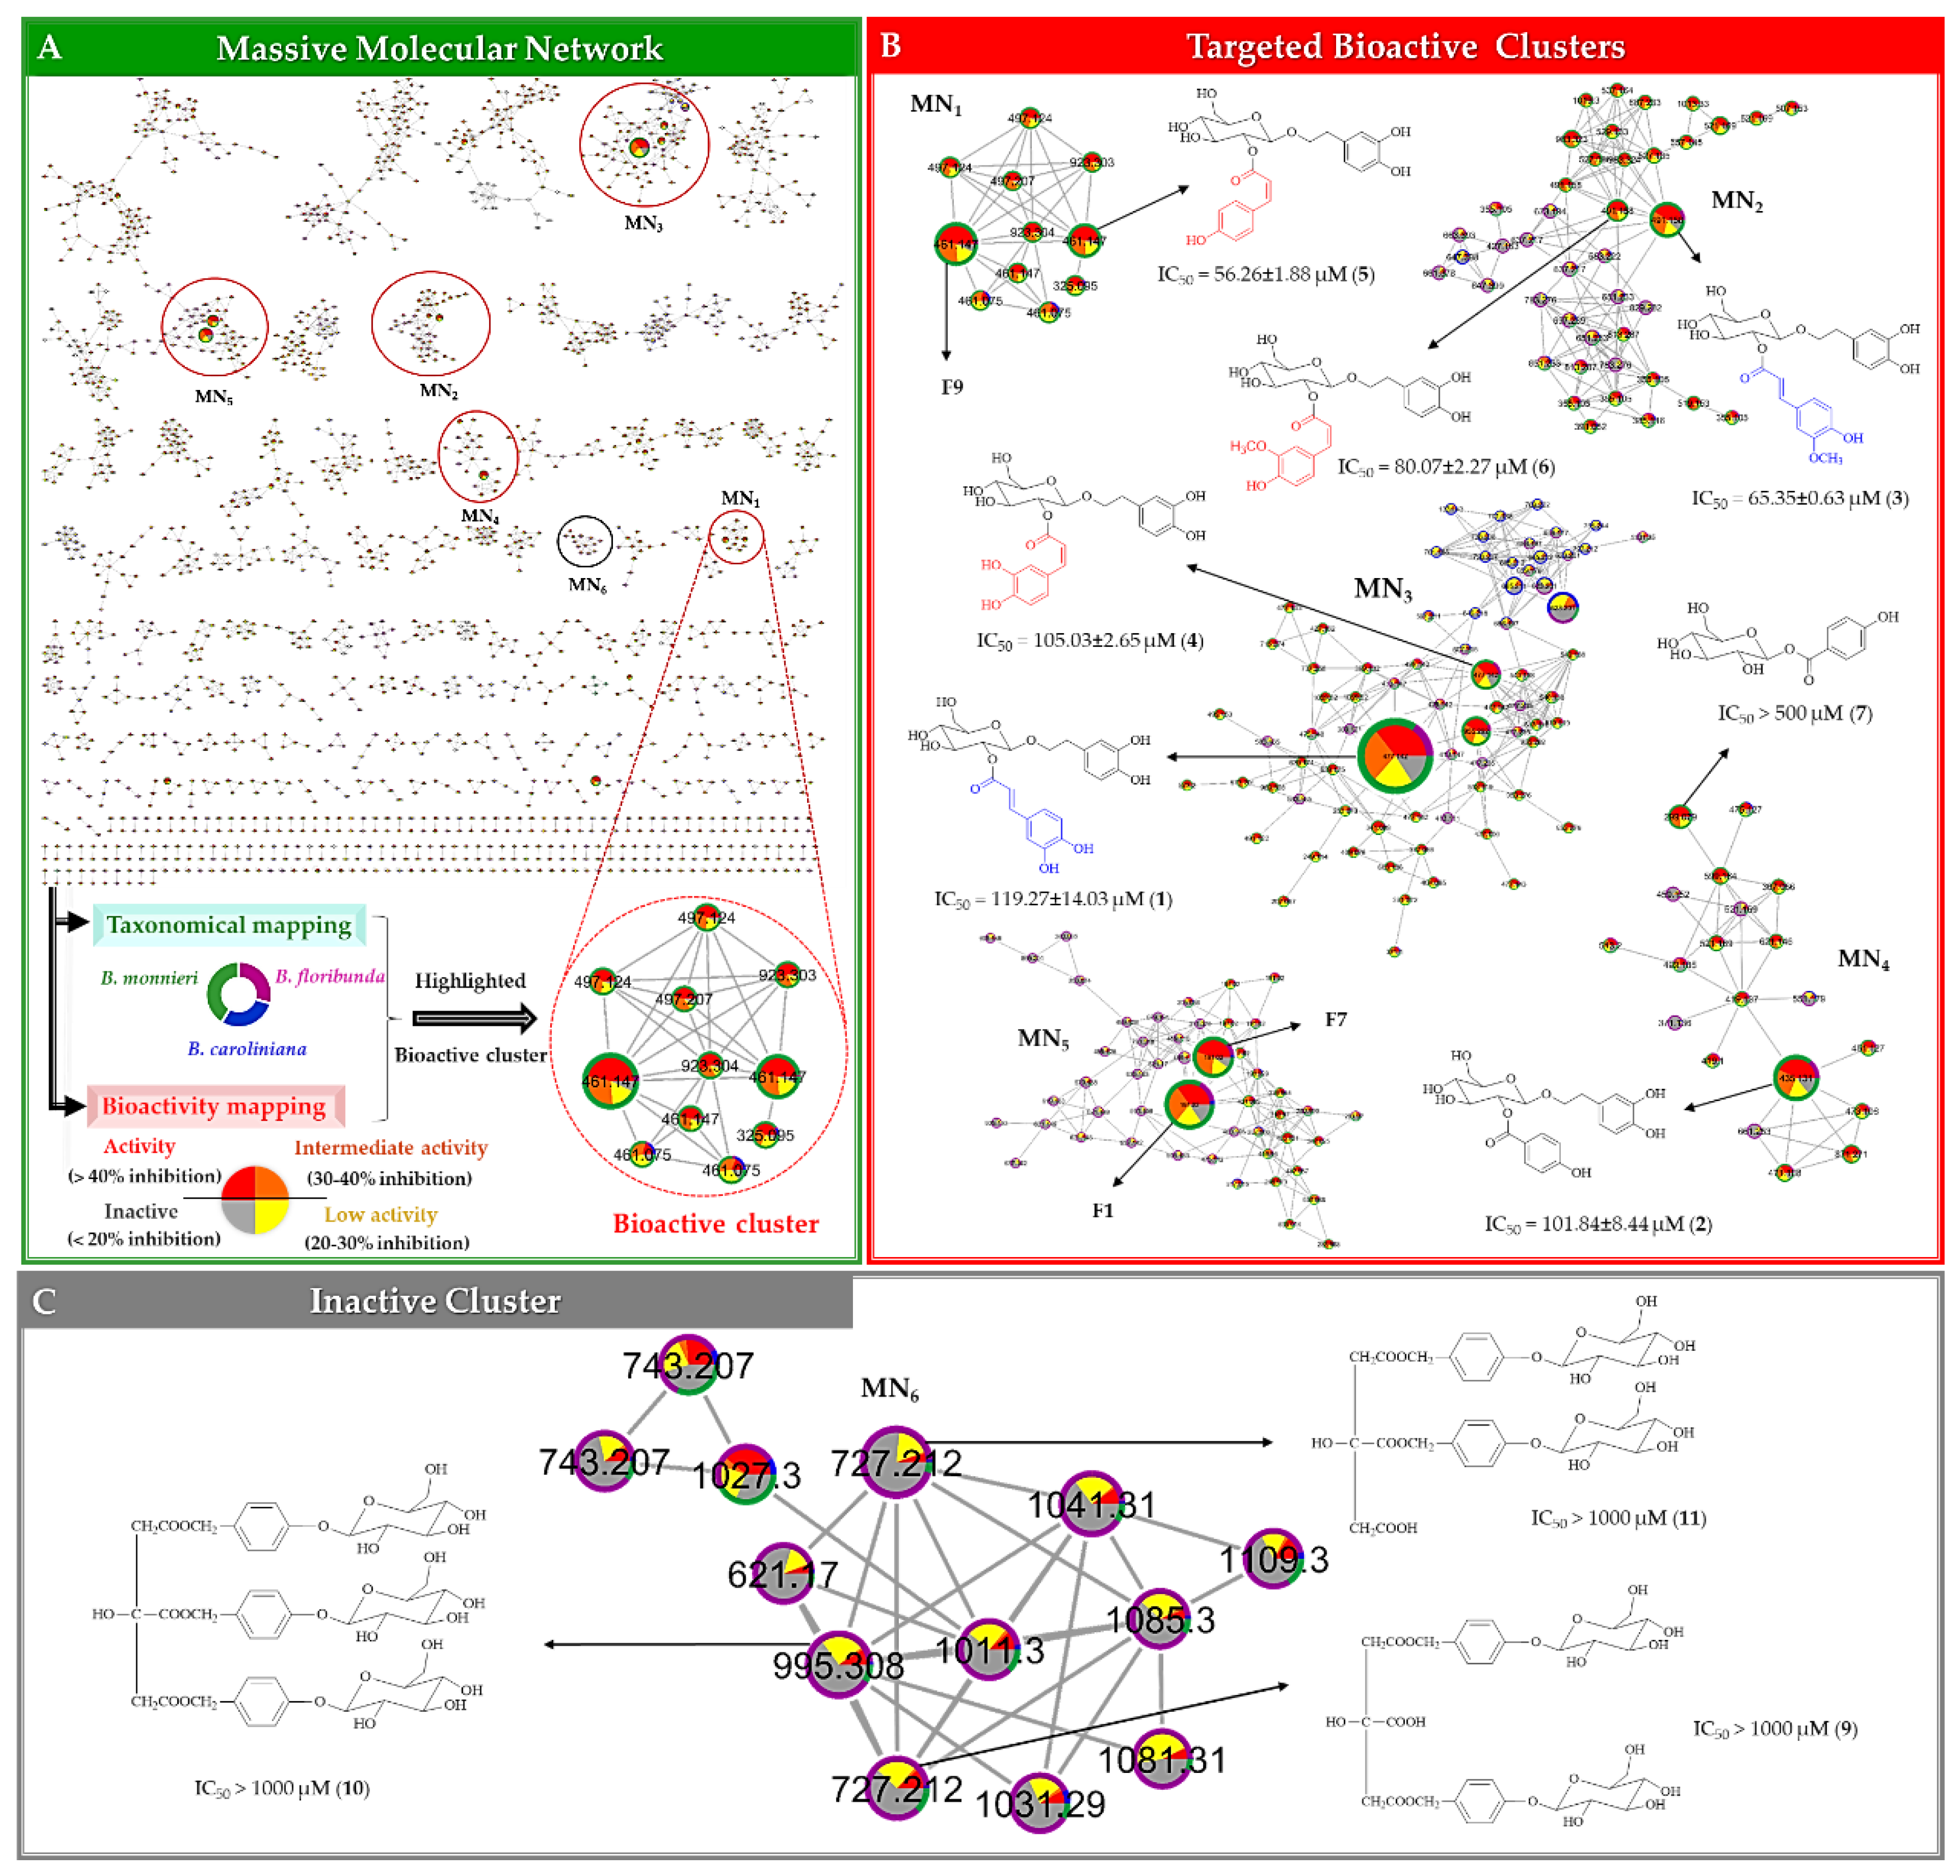
2.2.3. Multi-Informational Molecular Map

Multi-informative MN is a strategy that has previously been demonstrated to effectively prioritize bioactive compounds in natural extract collections [14]. For this, the MS1–MS2 peaklist was analyzed using such approach in order to visually highlight the clusters of compounds possibly responsible for the observed anti-lipid peroxidation activity. Here, the 4191 features presenting MS2 were organized using the GNPS platform to generate a single MN. In this MN, the nodes representing each feature were grouped into 602 clusters by similarity of fragmentation patterns. A multi-informational molecular map was created by merging this MN with biological results and taxonomical information (Figure 4A). All nodes in the MN were color-labeled according to the corresponding lipid peroxidation inhibition level of the extracts (bioactive mapping). This allowed a rapid highlighting of potential bioactive molecular families. Additionally, a taxonomical mapping was applied. The species were differentiated by colored tags on the border of each node (Figure 4A). This additional layout was used to indicate the distribution of plant species for each node. If a given node was most abundantly found in bioactive species, it could be hypothesized that this node was potentially related to an NP responsible for the observed bioactivity of the extract of the corresponding species. Using such mapping, twenty putative bioactive clusters with a minimum of five nodes, corresponding to more than a hundred features were selected by visual inspection based on their dominant red color tags indicating presence in bioactive extracts (Figure S1). The colors of the border (taxonomical origin mapping) suggested that the active nodes were mainly found in B. monnieri, while only a few were related to other species. The size of the nodes was based on the MS intensity, which was obtained from an average of the corresponding signal across all samples. In a MN, molecular families tend to cluster together, thus leading to similar ionization behaviours within clusters. Consequently, we hypothesized that the MS intensity of these molecules within a cluster was indicative of their relative abundance. According to this logic, five bioactive clusters (MN1–MN5, Figure 4B), were further prioritized based on the five largest nodes, leading to a selection of 25 potential bioactive features (Table 1). Among these, seventeen features corresponded to unique molecules, whereas the other neighboring nodes connected to these features were dimeric or adduct forms. Thus, seventeen compounds from MN1‒MN5 were considered as bioactive candidates from MN (Table 1). An example of unprioritized cluster (MN6), potentially linked to non-active metabolites, with dominant grey color tags is also shown in Figure 4C for comparison purposes.

2.2.4. Merging MVA and MN for Bioactive Candidate Prioritization

The S-plot of MVA brings statistical correlation between features and bioactivity but can however be biased by scaling and normalization processes. On the other side, the bioactivity-informed MN approach allows to highlight structural relations between putative bioactive compounds and thus, despite the lack of statistics, allows to indirectly discriminate possible MS artefacts from specialized metabolites features. In order to prioritize unique bioactive molecules from the merging of MVA and MN, common features found in both approaches were highlighted with color tags (see in Table 1) and prioritized as potential bioactive candidates. The two largest nodes found in each five selected clusters (MN1‒MN5, Figure 4B) represented features also found in the list of putative bioactive candidates in MVA. Therefore, these ten features (F1, F3, F6, F7, F9, F10, F12, F14, F15 and F17) were prioritized as potential bioactive compounds for this study (Table 1).

2.3. DNP-ISDB Dereplication and Purification of Bioactive Candidates

In the MN, the acquired MS2 spectra of each node from the whole MN were matched automatically against GNPS spectral libraries and then annotated against an in silico spectral database build from the Dictionary of Natural Products (DNP-ISDB) as previously described [1] thus providing an identification of level 2 [52]. These spectra were subsequently matched against with a subset of the DNP-ISDB restricted to Plantaginaceae specialized metabolites in order to refine the dereplication results. The top five candidate structures with highest spectral similarity scores were retrieved and the chemical structures for each node was directly visualized within the network using Cytoscape and the ChemViz plugin. The candidate structures for each node were ranked according to their spectral similarity score and the structure with the highest score was reported (Table 1).
Compounds F1 and F7 (m/z 191.0197 [M − H]¯) were isomers, which were both annotated as idaric acid-1,4-lactone. The other three pairs of isomers i.e., F3 and F12 (m/z 477.1421 [M − H]¯), F9 and F14 (m/z 461.1473 [M − H]¯) and F10 and F15 (m/z 491.1581 [M − H]¯), were proposed to be plantainoside B, 8-O-(6’-O-trans-coumaroyl-β-d-glucopyranosyl)-3,4-dihydroxyphenylethanol and monnieraside II, respectively. The F6 was predicted to be monnieraside III. The unprioritized features, F3436, did not match with MS2 spectra libraries from DNP–ISDB, however F35 was matched against the GNPS spectral library entry parishin A. From these dereplication results, the four pairs of isomers could not be differentiated and two inactive features were given no annotation. Therefore, they may have been new compounds. To establish their structures and evaluate their bioactivity potential, targeted purification of these potential bioactive and inactive compounds was carried out. In order to isolate these compounds, the active extract of B. monnieri was fractionated by medium pressure liquid chromatography coupled to an ultraviolet detector (MPLC-UV). The conditions of this separation were first developed by HPLC–UV using a column with identic stationary phase. After this, the analytical HPLC conditions were geometrically transferred to semi–preparative MPLC-UV [53]. All of the MPLC fractions obtained were systematically analyzed by LC-MS. Using the retention time and molecular weight, it was possible to localize the ten potential bioactive candidates (F1, F3, F6, F7, F9, F10, F12, F14, F15 and F17) and three unprioritized features (F3436). MPLC fractions were further purified by semi–preparative HPLC. As for the separation using MPLC, the conditions of the semi–preparative HPLC were first developed in an analytical method using a column with a similar stationary phase chemistry. After this step, the condition was successfully transferred to the semi–preparative HPLC [54] (Figure S2). In order to avoid loss of resolution, the sample was introduced into the semi–preparative HPLC column by dry load according to a recently developed protocol [55]. Thanks to this approach, it was possible to obtain a high–resolution separation of the majority of the polar compounds, allowing them to be obtained in a high degree of purity. Using this system, seven bioactive candidates prioritized by MVA and MN (compounds 17, corresponding to features F3, F6, F10, F12, F14, F15 and F17, respectively) and one compound highlighted MVA only (compound 8, corresponding to feature F5) were isolated. In addition, compounds 911 (features F3436), which were all found in a non–prioritized cluster (MN6, Figure 4C) and in an area of the S-plot indicative of potential inactive compounds (lower left corner, Figure 3E), were also isolated.

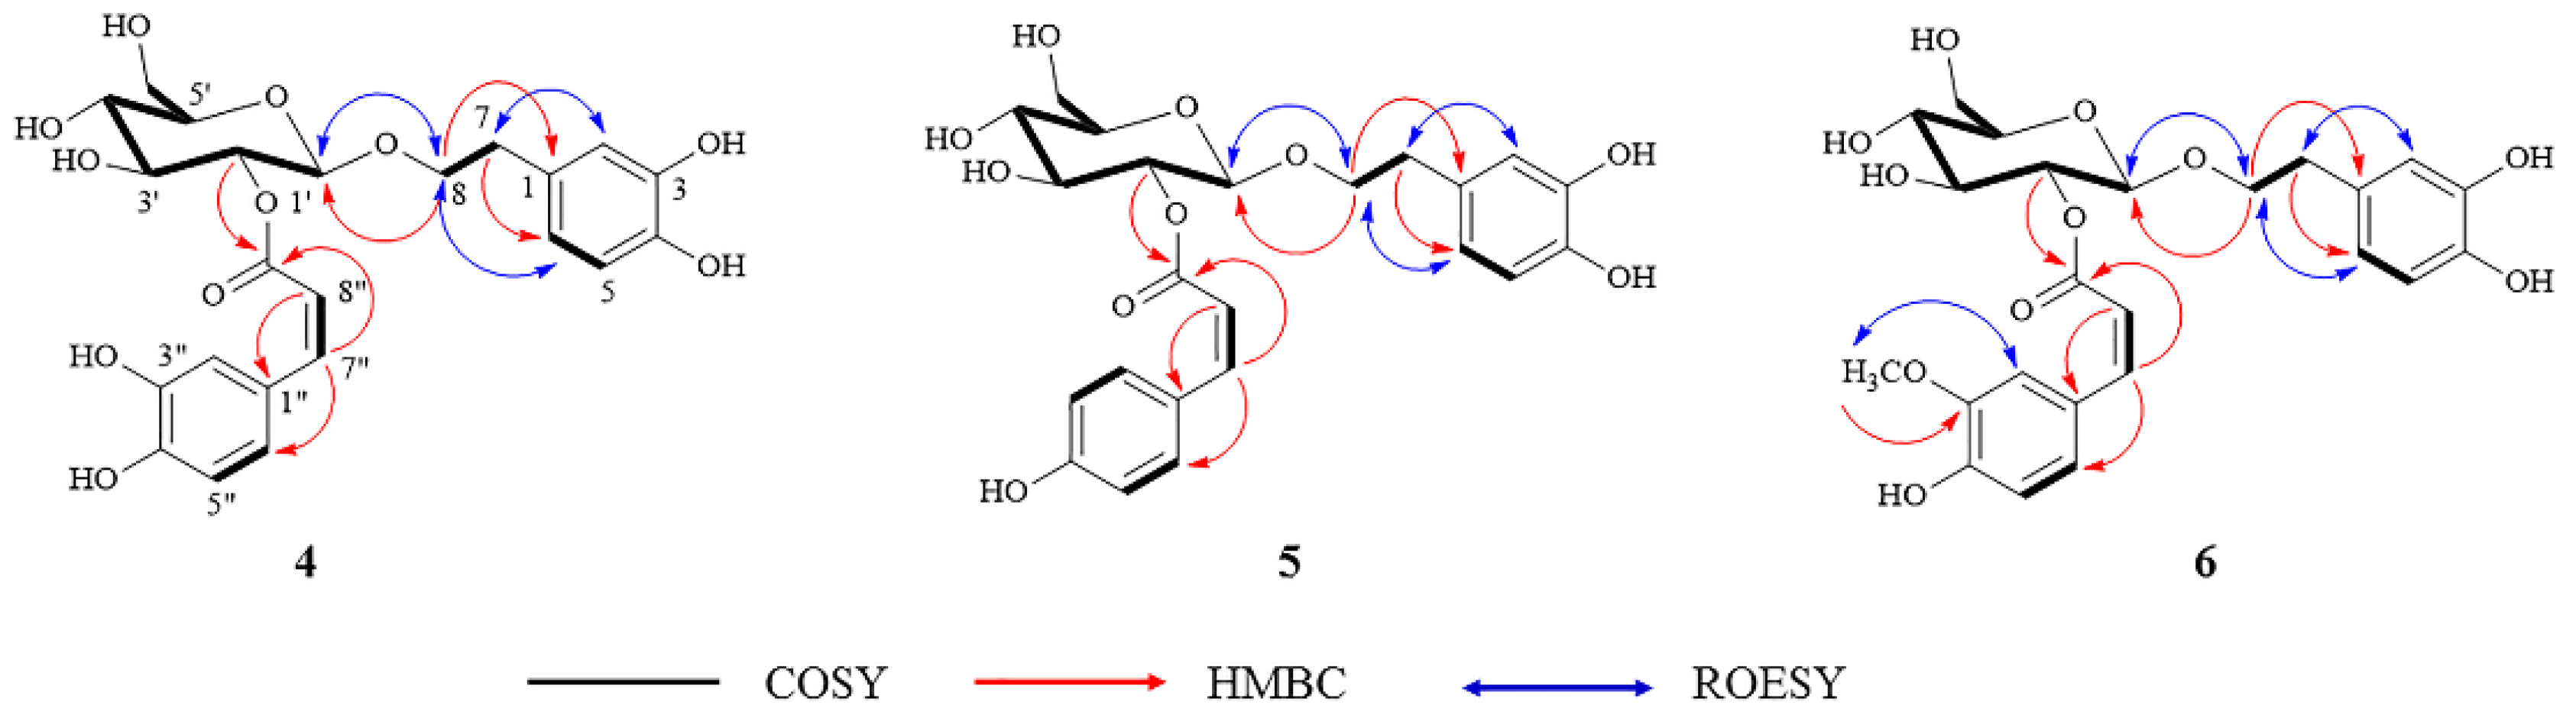
2.4. Identification and Structure Elucidation of Compounds 111

After purification, all isolated compounds were fully characterized by extensive 2D NMR experiments, which complemented the HRMS2 results. Compounds 13 and 711, were identified as plantainoside B (1), monnieraside III (2), monnieraside II (3) [48], 4-hydroxybenzoyl glucose (7) [56], 3,4-dihydroxyphenethyl glucoside (8) [57], parishin C (9), parishin A (10) and parishin B (11) [58], respectively, by comparing their spectral data with literature. Compounds 46 were isolated for the first time and identified as new phenylethanoid glycosides: monnieraside IV (4), monnieraside V (5), and monnieraside VI (6). The 1H and 13C-NMR of 46 are provided in Table 2 and their COSY, HMBC and ROESY correlations are shown in Figure 5.
The 2D NMR spectra and HRMS spectra are provided as supplementary data (Figures S3–S21). The structures of seven isolated bioactive candidates are displayed on the prioritized clusters in Figure 4B and structure of the three unprioritized compounds are provided in Figure 4C.
Compound 4 was obtained as a white amorphous powder. The HRESIMS of this compound exhibited a deprotonated molecular ion at m/z 477.1420 [M − H]¯ corresponding to the molecular formula C23H26O11 (calcd. 477.1402), indicating an isomer of plantainoside B (1). The NMR data of 4 showed close similarities to those of plantainoside B except that the value of the coupling constant between the two ethylenic protons at δH 5.73 (H‒8") and 6.81 (H‒7") of 12.8 Hz indicated a cis-form for the caffeoyl group in 4. The structure of 4 was therefore established as 8-O-(2’-O-cis-caffeoyl-β-d-glucopyranosyl)-3,4-dihydroxyphenylethanol (monnieraside IV).
Compound 5 was obtained as a white amorphous powder and it showed a deprotonated molecular ion at m/z 461.1473 [M − H], which was consistent with the molecular formula C23H26O10 (calcd. 461.1453). The NMR data of 5 exhibited a para-disubstituted moiety at δH 6.74 (2H, d, J = 8.7 Hz, H3'', H5'') and 7.60 (2H, d, J = 8.7 Hz, H2'', H6'') instead of the tri-substituted group of the cis-caffeoyl of 4. The 16 Da mass difference between these two compounds was consistent with this NMR observation. The structure of 5 was established as 8-O-(2’-O-cis-coumaroyl-β-d-gluco-pyranosyl)-3,4-dihydroxyphenylethanol (monnieraside V).
The molecular formula of compound 6 (white amorphous powder) was calculated as C24H28O11 by analysis of its HRESIMS (m/z 491.1580 [M − H]¯, calcd. 491.1559). The NMR data of 6 showed similarities with those of compound 3 (monnieraside II) both of them being isomers. A cis-feruoyl group was present in 6, as confirmed by the coupling constant value of 12.8 Hz between H‒7" and H‒8" protons. The structure of 6 was thus established as 8-O-(2’-O-cis-feruloyl-β-d-glucopyranosyl)-3,4-dihydroxyphenylethanol (monnieraside VI).
According to DNP-ISDB dereplication results for the eleven isolated compounds (111), four compounds; plantainoside B (1), monnieraside III (2), monnieraside II (3) and 4-hydroxybenzoyl glucose (7) were correctly annotated as confirmed by NMR results (Table 1). Compound 8 was attributed an incorrect structure (2-(3,5-dihydroxyphenyl)ethanol-3'-O-β-d-glucopyranoside) by MS2 dereplication, however this annotation was related to the structure later established by NMR (3,4-dihydroxyphenethyl glucoside). In addition, DNP-ISDB dereplication proposed the structure of F9 and 5 (m/z 461.1473 [M − H]¯) as 8-O-(6’-O-trans-coumaroyl-β-d-glucopyranosyl)-3,4-dihydroxy-phenylethanol. However, NMR data of 5 suggested it as 8-O-(2’-O-cis-coumaroyl-β-d-glucopyranosyl)-3,4-dihydroxyphenylethanol. This indicated that the structure of F9 could indeed be the dereplicated trans–isomer. Furthermore, previous observation showed that the trans-isomers of phenylpropanoid derivatives (compounds 1 and 3) had shorter retention time than their cis-isomers counterpart (compounds 4 and 6). The same phenomenon was also observed for F9 and 5. Consequently, F9 could therefore correspond to as 8-O-(2’-O-trans-coumaroyl-β-d-glucopyranosyl)-3,4-dihydroxy-phenylethanol. In addition, we found that the annotation against GNPS spectral libraries of compound 10 (parishin A) was correct, as confirmed by NMR structural elucidation. In MN6, the annotation of node m/z 995.3078 [M − H]¯ with parishin A and the mass difference of 268.0950 with two neighboring nodes at m/z 727.2121 [M − H]¯, RT 1.19 min and 727.2124 [M − H]¯, RT 1.10 min indicated a possible loss of the 4-(β-d-glucopyranosyloxy)benzyl alcohol moiety (–C13H16O6, calcd. 268.0946) present on parishin A. After isolation and NMR identification structural elucidation, 9 and 11 were indeed found to be parishin C and parishin B, respectively, illustrating the interest of MN for dereplication purposes.

2.5. Evaluation of the Anti-Lipid Peroxidation Activity of the Isolated Compounds

In order to verify the bioactivity potential of the compound prioritized by the combination of MVA and multi-informative MN, the seven isolated compounds were tested for their anti-lipid peroxidation activity with the TBAR assay. Six compounds, 16, showed inhibitory activity with IC50 values < 120 µM and one compound, 7, had lower activity (IC50 > 500 µM) (Table 1). The positive control (Trolox) showed an IC50 value of 13.92 ± 0.32 µM. For this study, we defined compounds presenting IC50 values not higher than 10-fold of the control’s IC50 value as active compounds.
Some prioritized features (F1, F7 and F9) could not be isolated, their bioactivity potential is however discussed according to the following evidences. Features F1 and F7 were proposed to be idaric acid-1,4-lactone and its isomer by MS2. The d enantiomer, d-glucaric-1,4-lactone, has been reported to exert anti-lipid peroxidation and anti-oxidant activities [59]. Compound F9 was also likely to exhibit anti-lipid peroxidation activity similar to its isomer (5), in the same fashion as isomeric compounds 1/4 and 3/6 also shared the same range of anti-lipid peroxidation activity. Given the structure similarity of 16, their inhibitory activities were compared. The activity of the compounds tends to decrease when C3'' was substituted with methoxy (3, 6) and hydroxy groups (1, 4), respectively (Figure 4B). Such substitutions might reduce the ability of the compounds to protect the oxidation of Fe2+ to Fe3+ in the lipid peroxidation process.
To verify that the proposed merging of MVA and MN decreased the numbers of false positive candidate compounds, two features F5 and F16 (identified to bacopaside I using standard comparison) highlighted by MVA only were assayed. Both showed low levels of activity with IC50 values > 500 µM and > 1000 µM, respectively. This indicated that the combination of both prioritization approaches could help to further refine the prioritization process and lower the rate of false positives isolation.
Additionally, three unprioritized compounds 911 were isolated and their anti-lipid peroxidation activity assayed. We found that these three compounds displayed very low inhibition of lipid peroxidation with the IC50 values > 1000 µM, indicating that the employed strategy was effective to highlight bioactive compounds from complex mixtures of NPs prior to isolation.
Further investigations of ten prioritized bioactive features F1, F7, F9 and compounds 17 revealed that they were differently distributed (% of MS intensities) in the three Bacopa species (Figure 6). The highest mean distribution of these compounds was observed in B. monnieri (77%), followed by B. floribunda (21%). This result agreed with the finding that B. monnieri had higher anti-lipid peroxidation activity than B. floribunda (Figure 2), suggesting that these compounds are the bioactives responsible for the anti–lipid peroxidation effects observed in B. monnieri and B. floribunda. Even though B. caroliniana presented the lowest level of these active compounds (~2%), it still showed some inhibition of lipid peroxidation, which could indicate the presence of other bioactive compounds in the plant.
The biological evaluation of the compounds prioritized by merging MVA and MN, indicated the validity of the approach. However, some bioactive compounds could be missed since the selection in MN was partly based on MS signal intensity, which is non–quantitative and highly dependent on the chemical structure of the analytes. The hyphenation of MS analytical platforms with universal detectors such as evaporative light scattering detector (ELSD) should offer a more accurate view of the precise quantitative repartition of metabolites within complex matrices, hence enhancing the power of MS–based prioritization approaches.

3. Materials and Methods

3.1. Chemicals and Plant Materials

All chemicals used were of analytical grade and obtained from Sigma-Aldrich (St. Louis, MO, USA). All solvents were HPLC and LC-MS grades. Acetonitrile (ACN), methanol (MeOH) and formic acid were purchased from Merck (Darmstadt, Germany). Water was purified by a Milli–Q purification system from Millipore (Bedford, MA, USA).
Three Bacopa species i.e., 36 samples of B. monnieri (BM1‒12), 12 samples of B. caroliniana (BC1‒4), and 11 samples of B. floribunda (BF1 from nature and BF2‒11 from tissue culture) were collected from different regions and seasons. Only collected BM and BC samples were planted under the same growing conditions in the Faculty of Pharmaceutical Sciences, Naresuan University and subsequently harvested during different seasons in 2017: January (represented winter), April (summer), and July (rainy season) to enable an evaluation of the effect of these seasonal conditions. These plants species were identified by Dr. Pranee Nangngam and their voucher specimens (Saesong001‒17) have been deposited at Department of Biology, Faculty of Science, Naresuan University. The codes and information regarding the samples are presented in Table 3.
The shoot part (10 cm) of each Bacopa sample was collected based on a previous method [45]. Then it was cleaned and dried at 50 °C in a hot air oven for 24 h. The dried plants were crushed and passed through a 60 mesh sieve and stored in plastic containers under refrigeration at −20 °C until used.

3.2. Sample Preparation

Metabolites of Bacopa were extracted by adding 1 mL of 70%MeOH to a powdered sample (20 mg). The solution was then sonicated at room temperature for 15 min and filtered through a 0.45 µm nylon filter. Each extract solution was analyzed by UPHLC-HRMS2 and tested for anti-lipid peroxidation activity in parallel.

3.3. TBAR Assay

Lipid peroxidation inhibitory activity was tested by TBARs assay, with minor modification to a previous study [50]. In this process, 20 µL of sample and 140 µL of homogenate rat brain (contained 5.72 mg/mL total protein) were mixed and incubated at 37 °C for 30 min. Then, 20 µL of 4 mM Fe2SO4 and 2 mM ascorbic acid were added to the mixture solution and incubated at 37 °C for 1 h. After incubation, 200 µL of TBARs reagent (40% trichloroacetic acid, 1.4% thiobarbituric acid, and 8% HCl) was added and incubated at 90 °C for 60 min. The mixture was then allowed to cool to room temperature and centrifuged at 10,000 rpm at 4 °C for 5 min to pelletize the precipitated protein. The absorbance of the supernatant was read at 530 nm by a microplate reader (BioTek Instruments, Winooski, Vermont, USA). The inhibition was calculated by comparison with the negative control. The homogenized rat brain in this assay was prepared in 1x PBS buffer (pH 7.4). The protein content in the homogenized rat brain was measured using a bicinchoninic acid (BCA) assay [60].

3.4. UHPLC-ESI-HRMS2 Analysis

The UHPLC−HRMS2 was carried out on a Waters Acquity UPLC IClass system system interfaced to a Q-Exactive Focus mass spectrometer (Thermo Scientific, Bremen, Germany), using a heated electrospray ionization (HESI-II) source. Chromatographic separation was performed on a Waters BEH C18 column (50 × 2.1 mm, 1.7 μm), the mobile phase consisted of 0.1% formic acid in water (A) and 0.1% formic acid in acetonitrile (B), the flow rate was 600 μL/min, the injection volume was 1 μL, and the linear gradient elution initially increased from 5–100% B for 7 min, followed by isocratic conditions at 100% B for 1 min, and then decreased to 5% B for the final step for 2 min. The negative ionization mode was applied in this study because the molecular ion peak of the most important metabolites could not be observed in positive ion mode. The optimized HESI-II parameters were set as follows: source voltage, 3.5 kV; sheath gas flow rate (N2), 48 units; auxiliary gas flow rate, 11 units; spare gas flow rate, 2.0 units; capillary temperature, 300 °C, S-Lens RF Level, 55. The mass analyzer was calibrated using a mixture of caffeine, methionine-arginine-phenylalanine-alanine-acetate (MRFA), sodium dodecyl sulfate, sodium taurocholate, and Ultramark 1621 in an acetonitrile/methanol/water solution containing 1% formic acid by direct injection. The data-dependent MS/MS events were performed on the three most intense ions detected in full scan MS (Top3 experiment). The MS/MS isolation window width was 2 Da, and the normalized collision energy (NCE) was set to 35 units. In data-dependent MS/MS experiments, full scans were acquired at a resolution of 35,000 fwhm (at m/z 200) and MS/MS scans at 17,500 fwhm, both with a maximum injection time of 50 ms. After being acquired in a MS/MS scan, parent ions were placed in a dynamic exclusion list for 3.0 s. All samples were performed by UHPLC-HRMS2 in one batch and a single pool of all samples was used as a quality control (QC). The QC sample was processed to monitor the reproducibility and stability of the system, which was injected at the beginning, then once every ten tested samples, and at the end of the batch analysis.

3.5. MZmine data preprocessing

The UHPLC−HRMS2 raw data were converted to .mzXML format using MSConvert software, part of the ProteoWizard package and processed with MZmine version 2.32. Six main steps, consisting in mass detection, chromatogram building, deconvolution, isotopic peak grouping, alignment and gap filling, were carried. The mass detection was set in centroid mode and the noise level was kept at 1 × 10⁶ for MS1 and 0 for MS2. The ADAP chromatogram builder was selected and run using a minimum group size in number of scans of 5, minimum height of 1 × 10⁶, and m/z tolerance of 0.001 Da (or 5 ppm). The chromatogram deconvolution was set as follows: wavelets (ADAP) was used as the algorithm for peak recognition, m/z and RT range for MS2 scan pairing were 0.3 Da and 0.1 min, S/N threshold was 20, minimum feature height was 1 × 10⁶, coefficient/area threshold was 110, peak duration range was 0.01–1.0 min, and the RT wavelets range was 0.001–0.04. Chromatograms were then deisotoped by isotopic peaks a grouper algorithm with a m/z tolerance of 0.001 Da and an RT tolerance of 0.05 min. Peak alignment was carried out using a join aligner, with m/z tolerance set at 0.001 Da, absolute RT tolerance at 0.05 min, and weight for m/z and RT at 30. The missing peaklist after alignment was filled by gap filling of same RT and m/z range gap filler module with a m/z tolerance of 0.001 Da. After gap filling, all peaklists were done with identification of adduct search, complex search, and molecular formula prediction. This resulted in a peaklist of 6082 features which was further filtered to a peaklist of 4191 features having an associated data dependent MS2 spectra. This resulting peaklist of 4191 features was exported as input for the MVA (MS1 data only) and for MN generation (MS1 and MS2 data).

3.6. Multivariate Analysis

After data treatment with MZmine, a three-dimensional data matrix comprising of retention time, m/z value and peak height were analyzed by SIMCA-P software (version 13.0, Umerics, Umea, Sweden). Pareto-scaling was applied to normalize data for PCA and OPLS analysis. In addition, R2 and Q2 (cum) were used for model evaluation. Values of both parameters close to 1.0 indicated a good fitness for the created model. OPLS, a supervised multivariate statistical method, was completed with percent inhibition of lipid peroxidation activity as the Y input. The features with potential bioactivity from S-plot in OPLS model were selected based on their p[1] values.

3.7. Molecular Networking Analyses

The MN of MS2 spectra of the Bacopa species was generated using the online workflow of the Global Natural Products Social Molecular Networking (GNPS). The MS2 spectra were then clustered with MS-Cluster with a parent mass tolerance at 0.02 Da and a fragment ion mass tolerance at 0.02 Da to create consensus spectra, and consensus spectra containing less than two spectra were discarded. A network was then created, where edges were filtered to have a cosine score above 0.7 and more than 6 matching peaks. Furthermore, the edges between two nodes were kept in the network if each of the nodes appeared in each other’s respective top 10 most similar nodes. The spectra in the network were automatically searched against GNPS spectral libraries and then against DNP-ISDB according to a previously described methodology [1]. ChemViz 1.3 plugin (freely available at [61]) was used to display the structure of the dereplication hits directly within Cytoscape 3.6.1. The generated MN in this study can be seen in [62] and the MASSIVE datasets contained all raw data was provided in the link of [63].

3.8. Purification of Candidate Bioactive Compounds

3.8.1. Extraction Procedure

The dried powder of BM4 (100 g) was macerated three times with MeOH and shaken for 24 h to give 24.2 g of MeOH extract. The polar substances (sugar) of the extract were removed using solid phase extraction prior to purification using the following protocol. The 200 g of C18 (ZEOprep® 60 C18, 40–63 µm) was packed in a column and activated by MeOH (1 L), followed by conditioning with water (1 L). Then, 2 g of Brahmi extract in 10 mL water was loaded and the column was washed with water (1 L) to remove polar substances. Remaining compounds were finally eluted with MeOH (1 L).

3.8.2. Purification Methods

The isolation steps of candidate compounds were performed by MPLC and followed by semi–preparative HPLC. A system of MPLC was carried out on an LC instrument conducted with a 681-pump module C‒615, UV-Vis module C‒640, and a fraction collector module C‒660 (Buchi, Flawil, Switzerland). Fractionation was performed with an ZEOprep® C18 column (70 × 460 mm, 15–25 μm) with elution of 0.1% formic acid in water (A) and 0.1% formic acid in acetonitrile (B). The gradient elution started from 0‒20 min of 35% B and then increased to 100% B for 284 min. The flow rate was 20 mL/min. This condition was first optimized on an analytical HPLC column (250 × 4.6 mm i.d., 15–25 μm, Zeochem, Uetikon am See, Switzerland) packed with the same stationary phase and then geometrically transferred to the preparative scale [53]. The extract was introduced into the MPLC column by dry injection by mixing 5.62 g of the extract with 18.30 g of the Zeoprep C18 stationary phase (40–63 μm, Zeochem). The mixture was conditioned in a dry-load cell (11.5 × 2.7 cm i.d.) and it was connected subsequently between the pumps and the MPLC column. Twenty-five fractions were collected by peak-based detection under UV at 205, 254 and 366 nm. When there were no peaks, 250 mL of each of the fractions was collected. The candidate compounds in the fractions were tracked down by LC-MS using the same conditions as mentioned in session 3.4.
The candidate bioactive compounds (18) and inactive compounds (911) were isolated from fraction 3 of MPLC using semi−preparative HPLC, which was performed on a HPLC-UV instrument with SPD-20A UV-Vis, a LC-20AP Pump, a FRC-10A fraction collector and a sample injector (Shimadzu, USA). The separation was carried out on an XBridge C18 OBD prep column (19 × 250 mm, 5 μm, Waters, Milford, MA, USA) with a guard column (4 × 20 mm, 5 μm), using an isocratic system of 0.1% formic acid in water and in acetonitrile at ratios of 86 and 14 as mobile phase. The separation time was 65 min with a post run of 10 min and the flow rate set at 17 mL/min. This semi−preparative HPLC condition was optimized on an analytical HPLC using a column with a similar stationary phase (XBridge C18, 4.6 × 250 mm, 5 μm) and then the optimum condition was geometrically transferred to the semi-preparative scale [54]. In order to avoid loss of resolution, the sample was loaded into the column by dry loading according to a recently developed protocol [55], which made it possible to obtain a high−resolution separation of the majority of the polar compounds to ensure a high degree of purity. Using this preparative system, eighty-four fractions were collected by peak-based detection under UV absorption of 205, 254 and scan 200–600 nm and volume based collection (8 mL of each fraction). All collected fractions were dried by speed vacuum (Genevac HT-4X, Genevac Ltd., North Carolina, USA). Isolation was achieved and afforded candidate bioactive compounds of 1 (8.5 mg), 2 (2.2 mg), 3 (0.9 mg), 4 (1.4 mg) 5 (0.1 mg) 6 (0.6 mg) and 7 (0.8 mg) and 8 (3.0 mg) and three inactive compounds of 9 (0.4 mg), 10 (3.0 mg) and 11 (1.2 mg). The purity and structure elucidation of each isolated compound was checked with HPLC, MS and NMR.

3.8.3. Identification Procedures

The NMR spectra of each isolated compound was recorded on a Bruker Avance Neo 600 MHz spectrometer equipped with a QCI 5mmCryoprobe and a SampleJet automated sample changer (Bruker BioSpin, Rheinstetten, Germany) (600). Chemical shifts (δ) were recorded in parts per million in methanol-d4 using the residual solvent signal (δH 3.31; δC 49.0) as internal standards for 1H and 13C-NMR, respectively. Mass spectrometric data were obtained on a Waters Acquity UPLC IClass system system interfaced to a Q-Exactive Focus mass spectrometer (Thermo Scientific).

4. Conclusions

In this work, the integration of MVA and multi-informative MN based on LC–HRMS2 metabolite profiling with bioactivity data was proven to be an efficient way to identify bioactive constituents in closely related plant extracts. The data generated allowed a rapid prioritization of bioactive compounds on a specific target from crude Bacopa extracts. Thanks to this approach the potential bioactivity for individual compounds could be anticipated prior to any physical separation process. This allowed the targeted isolation of six phenylethanoid glycosides 16 of Bacopa species with lipid-peroxidation inhibitory activity three of them being novel compounds i.e., monnieraside IV (4), monnieraside V (5) and monnieraside VI (6).
Additionally, the results in MVA and MN showed significant difference between Brahmi samples harvested in summer and other seasons in term of overall biological activity and amount of bioactive compounds. To our knowledge, Brahmi is collected throughout the year in Thailand and, based on our study, seasonal effects are important to consider and might affect the medicinal properties claimed for Brahmi. The described bioactive compounds could be used as biomarkers for quality control of this plant.

Supplementary Materials

The following are available online. Figure S1: Twenty candidate bioactive clusters observed by visual inspection based on dominant red color tag and five selected bioactive clusters in red square box (MN1‒MN5) were nominated based on node size; Figure S2: Representative HPLC chromatograms from method transfer between HPLC (A) and semi-preparative HPLC (B) for separation of compounds 111 in fraction 3 (from MPLC) of B. monnieri extract; Figure S3: HRESIMS spectrum of compound 4 (negative ionization); Figure S4: 1H-NMR spectrum of compound 4 in CD3OD at 600 MHz; Figure S5: COSY NMR spectrum of compound 4 in CD3OD; Figure S6. 13C‒DEPTQ NMR spectrum of compound 4 in CD3OD at 151 MHz; Figure S7: Edited‒HSQC-NMR spectrum of compound 4 in CD3OD; Figure S8: HMBC-NMR spectrum of compound 4 in CD3OD; Figure S9: ROESY NMR spectrum of compound 4 in CD3OD; Figure S10: HRESIMS spectrum of compound 5 (negative ionization); Figure S11: 1H-NMR spectrum of compound 5 in CD3OD at 600 MHz; Figure S12: COSY NMR spectrum of compound 5 in CD3OD; Figure S13: Edited‒HSQC-NMR spectrum of compound 5 in CD3OD; Figure S14: HMBC-NMR spectrum of compound 5 in CD3OD; Figure S15: ROESY NMR spectrum of compound 5 in CD3OD; Figure S16: HRESIMS spectrum of compound 6 (negative ionization); Figure S17: 1H-NMR spectrum of compound 6 in CD3OD at 600 MHz; Figure S18: COSY NMR spectrum of compound 6 in CD3OD; Figure S19: Edited‒HSQC-NMR spectrum of compound 6 in CD3OD; Figure S20: HMBC-NMR spectrum of compound 6 in CD3OD; Figure S21: ROESY NMR spectrum of compound 6 in CD3OD.

Author Contributions

T.S. performed whole experiments, data analysis, and prepared manuscript, P.-M.A. acquired UHPLC‒HRMS2 data and supervised data analysis, E.F.Q. helped for isolation, L.M. analyzed the NMR and structure elucidations, N.N. helped for data analysis, P.T. helped for data analysis, N.K. helped for data analysis, T.S., P.-M.A., J.-L.W. and K.I. conceived and designed the study. All authors reviewed the results and approved the final version of the manuscript.

Funding

This work was supported by the Royal Golden Jubilee PhD Program [PHD/0039/2557 to Tongchai Saesong and Kornkanok Ingkaninan], the Thailand Research Fund [DBG6080005, IRN61W0005], Naresuan University, the Center of Excellence for Innovation in Chemistry (PERCH-CIC), Ministry of Higher Education, Science, Research and Innovation. The School of Pharmaceutical Sciences of the University of Geneva (Jean-Luc Wolfender) is thankful to the Swiss National Science Foundation for the support in the acquisition of the NMR 600 MHz (SNF R’Equip grant 316030_164095).

Acknowledgments

We are gratefully to Pranee Nangngam for providing Bacopa samples and her help in plant identification. Additionally, we would like to thank the Bioactive Natural Products Unit, University of Geneva, Switzerland, who provided laboratory facilities.

Conflicts of Interest

The authors declare no conflict of interest.

References

  1. Allard, P.-M.; Péresse, T.; Bisson, J.; Gindro, K.; Marcourt, L.; Pham, V.C.; Roussi, F.; Litaudon, M.; Wolfender, J.-L. Integration of molecular networking and In-Silico MS/MS fragmentation for natural products dereplication. Anal. Chem. 2016, 88, 3317–3323. [Google Scholar] [CrossRef] [PubMed]
  2. Hubert, J.; Nuzillard, J.-M.; Renault, J.-H. Dereplication strategies in natural product research: How many tools and methodologies behind the same concept? Phytochem. Rev. 2017, 16, 55–95. [Google Scholar] [CrossRef]
  3. Yuliana, N.D.; Khatib, A.; Choi, Y.H.; Verpoorte, R. Metabolomics for bioactivity assessment of natural products. Phytother. Res. 2011, 25, 157–169. [Google Scholar] [CrossRef] [PubMed]
  4. Li, P.; AnandhiSenthilkumar, H.; Wu, S.-b.; Liu, B.; Guo, Z.-y.; Fata, J.E.; Kennelly, E.J.; Long, C.-l. Comparative UPLC-QTOF-MS-based metabolomics and bioactivities analyses of Garcinia oblongifolia. J. Chromatogr. B 2016, 1011, 179–195. [Google Scholar] [CrossRef] [PubMed]
  5. D’Urso, G.; Pizza, C.; Piacente, S.; Montoro, P. Combination of LC–MS based metabolomics and antioxidant activity for evaluation of bioactive compounds in Fragaria vesca leaves from Italy. J. Pharm. Biomed. Anal. 2018, 150, 233–240. [Google Scholar] [CrossRef]
  6. Ayouni, K.; Berboucha-Rahmani, M.; Kim, H.K.; Atmani, D.; Verpoorte, R.; Choi, Y.H. Metabolomic tool to identify antioxidant compounds of Fraxinus angustifolia leaf and stem bark extracts. Ind. Crops. Prod. 2016, 88, 65–77. [Google Scholar] [CrossRef]
  7. Caesar, L.K.; Kellogg, J.J.; Kvalheim, O.M.; Cech, N.B. Opportunities and Limitations for Untargeted Mass Spectrometry Metabolomics to Identify Biologically Active Constituents in Complex Natural Product Mixtures. J. Nat. Prod. 2019, 82, 469–484. [Google Scholar] [CrossRef]
  8. Patti, G.J.; Yanes, O.; Siuzdak, G. Innovation: Metabolomics: The apogee of the omics trilogy. Nat. Rev. Mol. Cell Biol. 2012, 13, 263–269. [Google Scholar] [CrossRef]
  9. Kim, H.K.; Choi, Y.H.; Verpoorte, R. NMR-based plant metabolomics: Where do we stand, where do we go? Trends Biotechnol. 2011, 29, 267–275. [Google Scholar] [CrossRef]
  10. Wolfender, J.-L.; Rudaz, S.; Hae Choi, Y.; Kyong Kim, H. Plant Metabolomics: From Holistic Data to Relevant Biomarkers. Curr. Med. Chem. 2013, 20, 1056–1090. [Google Scholar]
  11. Wolfender, J.-L.; Nuzillard, J.-M.; van der Hooft, J.J.J.; Renault, J.-H.; Bertrand, S. Accelerating Metabolite Identification in Natural Product Research: Toward an Ideal Combination of Liquid Chromatography–High-Resolution Tandem Mass Spectrometry and NMR Profiling, in Silico Databases, and Chemometrics. Anal. Chem. 2019, 91, 704–742. [Google Scholar] [CrossRef]
  12. Yang, J.Y.; Sanchez, L.M.; Rath, C.M.; Liu, X.; Boudreau, P.D.; Bruns, N.; Glukhov, E.; Wodtke, A.; de Felicio, R.; Fenner, A.; et al. Molecular networking as a dereplication strategy. J. Nat. Prod. 2013, 76, 1686–1699. [Google Scholar] [CrossRef]
  13. Wang, M.; Carver, J.J.; Phelan, V.V.; Sanchez, L.M.; Garg, N.; Peng, Y.; Nguyen, D.D.; Watrous, J.; Kapono, C.A.; Luzzatto-Knaan, T.; et al. Sharing and community curation of mass spectrometry data with Global Natural Products Social Molecular Networking. Nat. Biotechnol. 2016, 34, 828. [Google Scholar] [CrossRef]
  14. Olivon, F.; Allard, P.-M.; Koval, A.; Righi, D.; Genta-Jouve, G.; Neyts, J.; Apel, C.; Pannecouque, C.; Nothias, L.-F.; Cachet, X.; et al. Bioactive natural products prioritization using massive multi-informational molecular networks. Acs Chem. Biol. 2017, 12, 2644–2651. [Google Scholar] [CrossRef]
  15. Naman, C.B.; Rattan, R.; Nikoulina, S.E.; Lee, J.; Miller, B.W.; Moss, N.A.; Armstrong, L.; Boudreau, P.D.; Debonsi, H.M.; Valeriote, F.A.; et al. Integrating molecular networking and biological assays to target the isolation of a cytotoxic cyclic octapeptide, samoamide A, from an American Samoan Marine Cyanobacterium. J. Nat. Prod. 2017, 80, 625–633. [Google Scholar] [CrossRef]
  16. Nothias, L.-F.; Nothias-Esposito, M.; da Silva, R.; Wang, M.; Protsyuk, I.; Zhang, Z.; Sarvepalli, A.; Leyssen, P.; Touboul, D.; Costa, J.; et al. Bioactivity-based molecular networking for the discovery of drug leads in natural product bioassay-guided fractionation. J. Nat. Prod. 2018, 81, 758–767. [Google Scholar] [CrossRef]
  17. Global Natural Product Social Molecular Networking. Available online: http://gnps.ucsd.edu (accessed on 10 Aprile 2018).
  18. Olivon, F.; Elie, N.; Grelier, G.; Roussi, F.; Litaudon, M.; Touboul, D. MetGem Software for the Generation of Molecular Networks Based on the t-SNE Algorithm. Anal. Chem. 2018, 90, 13900–13908. [Google Scholar] [CrossRef]
  19. Kind, T.; Tsugawa, H.; Cajka, T.; Ma, Y.; Lai, Z.; Mehta, S.S.; Wohlgemuth, G.; Barupal, D.K.; Showalter, M.R.; Arita, M.; et al. Identification of small molecules using accurate mass MS/MS search. Mass Spectrom. Rev. 2018, 37, 513–532. [Google Scholar] [CrossRef]
  20. Tem, S. Thai Plant Names, 2014 ed.; The Forest Herbarium, Royal Forest Department: Bangkok, Thailand, 2014. [Google Scholar]
  21. Mukherjee, G.D.; Dey, C.D. Clinical trial on Brahmi. I. J. Exp. Med. Sci. 1966, 10, 5–11. [Google Scholar]
  22. Vollala, V.R.; Upadhya, S.; Nayak, S. Effect of Bacopa monniera Linn. (brahmi) extract on learning and memory in rats: A behavioral study. J. Vet. Behav. 2010, 5, 69–74. [Google Scholar] [CrossRef]
  23. Saraf, M.K.; Prabhakar, S.; Khanduja, K.L.; Anand, A. Bacopa monniera attenuates scopolamine-induced impairment of spatial memory in mice. Evid. Based Complement. Alternat. Med. 2011, 2011, 10. [Google Scholar] [CrossRef]
  24. Nathan, P.J.; Clarke, J.; Lloyd, J.; Hutchison, C.W.; Downey, L.; Stough, C. The acute effects of an extract of Bacopa monniera (Brahmi) on cognitive function in healthy normal subjects. Hum. Psychopharmacol. Clin. Exp. 2001, 16, 345–351. [Google Scholar] [CrossRef]
  25. Stough, C.; Lloyd, J.; Clarke, J.; Downey, L.A.; Hutchison, C.W.; Rodgers, T.; Nathan, P.J. The chronic effects of an extract of Bacopa monniera (Brahmi) on cognitive function in healthy human subjects. Psychopharmacology 2001, 156, 481–484. [Google Scholar] [CrossRef]
  26. Peth-Nui, T.; Wattanathorn, J.; Muchimapura, S.; Tong-Un, T.; Piyavhatkul, N.; Rangseekajee, P.; Ingkaninan, K.; Vittaya-areekul, S. Effects of 12-week Bacopa monnieri consumption on attention, cognitive processing, working memory, and functions of both cholinergic and monoaminergic systems in healthy elderly volunteers. Evid. Based Complement. Alternat. Med. 2012, 2012, 606424. [Google Scholar] [CrossRef]
  27. Kongkeaw, C.; Dilokthornsakul, P.; Thanarangsarit, P.; Limpeanchob, N.; Norman Scholfield, C. Meta-analysis of randomized controlled trials on cognitive effects of Bacopa monnieri extract. J. Ethnopharmacol. 2014, 151, 528–535. [Google Scholar] [CrossRef]
  28. Roodenrys, S.; Booth, D.; Bulzomi, S.; Phipps, A.; Micallef, C.; Smoker, J. Chronic effects of Brahmi (Bacopa monnieri) on human memory. Neuropsychopharmacology 2002, 27, 279–281. [Google Scholar] [CrossRef]
  29. Morgan, A.; Stevens, J. Does Bacopa monnieri Improve Memory Performance in Older Persons? Results of a Randomized, Placebo-Controlled, Double-Blind Trial. J. Altern. Complementary Med. 2010, 16, 753–759. [Google Scholar] [CrossRef]
  30. Gour, S.; Tembhre, M. Cholinergic inhibitory effects of bacopa monnieri and acephate in the kidney of rat. Int. J. Curr. Adv. Res. 2018, 7, 14136–14141. [Google Scholar]
  31. Teschke, R.; Bahre, R. Severe hepatotoxicity by Indian Ayurvedic herbal products: A structured causality assessment. Ann. Hepatol. 2009, 8, 258–266. [Google Scholar] [CrossRef]
  32. Sumathi, T.; Nongbri, A. Hepatoprotective effect of Bacoside-A, a major constituent of Bacopa monniera Linn. Phytomedicine 2008, 15, 901–905. [Google Scholar] [CrossRef]
  33. Menon, B.R.; Rathi, M.A.; Thirumoorthi, L.; Gopalakrishnan, V.K. Potential Effect of Bacopa monnieri on Nitrobenzene Induced Liver Damage in Rats. Indian J. Clin. Biochem. 2010, 25, 401–404. [Google Scholar] [CrossRef] [Green Version]
  34. Singh, H.; Dhawan, B.N. Neuropsychopharmacological effects of the ayurvedic nootropic Bacopa monnieri Linn. Indian J. Pharmacol. 1997, 29, 359–365. [Google Scholar]
  35. Russo, A.; Borrelli, F. Bacopa monniera, a reputed nootropic plant: An overview. Phytomedicine 2005, 12, 305–317. [Google Scholar] [CrossRef]
  36. Deepak, M.; Sangli, G.K.; Arun, P.C.; Amit, A. Quantitative determination of the major saponin mixture bacoside A in Bacopa monnieri by HPLC. Phytochem. Anal. 2005, 16, 24–29. [Google Scholar] [CrossRef]
  37. Ganzera, M.; Gampenrieder, J.; Pawar, R.S.; Khan, I.A.; Stuppner, H. Separation of the major triterpenoid saponins in Bacopa monnieri by high-performance liquid chromatography. Anal. Chim. Acta 2004, 516, 149–154. [Google Scholar] [CrossRef]
  38. Murthy, P.B.; Raju, V.R.; Ramakrisana, T.; Chakravarthy, M.S.; Kumar, K.V.; Kannababu, S.; Subbaraju, G.V. Estimation of twelve bacopa saponins in Bacopa monnieri extracts and formulations by high-performance liquid chromatography. Chem. Pharm. Bull. (Tokyo) 2006, 54, 907–911. [Google Scholar] [CrossRef]
  39. Phrompittayarat, W.; Wittaya-Areekul, S.; Jetiyanon, K.; Putalun, W.; Tanaka, H.; Ingkaninan, K. Determination of saponin glycosides in Bacopa monnieri by reversed phase high performance liquid chromatography. Thai Pharm. Health Sci. J. 2007, 2, 26–32. [Google Scholar]
  40. Bhandari, P.; Kumar, N.; Singh, B.; Singh, V.; Kaur, I. Silica-based monolithic column with evaporative light scattering detector for HPLC analysis of bacosides and apigenin in Bacopa monnieri. J. Sep. Sci. 2009, 32, 2812–2818. [Google Scholar] [CrossRef]
  41. British Pharmacopoeia Commission. The British Pharmacopoeia 2016; The Stationery Office: London, UK, 2016; Volume 1. [Google Scholar]
  42. Mathur, S.; Sharma, S.; Gupta, P.M.; Kumar, S. Evaluation of an Indian germplasm collection of the medicinal plant Bacopa monnieri (L.) Pennell by use of multivariate approaches. Euphytica 2003, 133, 255–265. [Google Scholar] [CrossRef]
  43. Bansal, M. Diversity among wild accessions of Bacopa monnieri (L.) Wettst. and their morphogenetic potential. Acta Physiol. Plant. 2014, 36, 1177–1186. [Google Scholar] [CrossRef]
  44. Bansal, M.; Reddy, M.S.; Kumar, A. Seasonal variations in harvest index and bacoside A contents amongst accessions of Bacopa monnieri (L.) Wettst. collected from wild populations. Physiol. Mol. Biol. Plants 2016, 22, 407–413. [Google Scholar] [CrossRef] [Green Version]
  45. Phrompittayarat, W.; Jetiyanon, K.; Wittaya-Areekul, S.; Putalun, W.; Tanaka, H.; Khan, I.; Ingkaninan, K. Influence of seasons, different plant parts, and plant growth stages on saponin quantity and distribution in Bacopa monnieri. SJST 2011, 33, 193–199. [Google Scholar]
  46. Bhandari, P.; Kumar, N.; Singh, B.; Kaul, V.K. Bacosterol Glycoside, a New 13,14-Seco-steroid Glycoside from Bacopa monnieri. Chem. Pharm. Bull. (Tokyo) 2006, 54, 240–241. [Google Scholar] [CrossRef]
  47. Bhandari, P.; Kumar, N.; Gupta, A.P.; Singh, B.; Kaul, V.K. A rapid RP-HPTLC densitometry method for simultaneous determination of major flavonoids in important medicinal plants. J. Sep. Sci. 2007, 30, 2092–2096. [Google Scholar] [CrossRef]
  48. Chakravarty, A.K.; Sarkar, T.; Nakane, T.; Kawahara, N.; Masuda, K. New Phenylethanoid Glycosides from Bacopa monniera. Chem. Pharm. Bull. (Tokyo) 2002, 50, 1616–1618. [Google Scholar] [CrossRef]
  49. Ohta, T.; Nakamura, S.; Nakashima, S.; Oda, Y.; Matsumoto, T.; Fukaya, M.; Yano, M.; Yoshikawa, M.; Matsuda, H. Chemical structures of constituents from the whole plant of Bacopa monniera. J. Nat. Med. 2016, 70, 404–411. [Google Scholar] [CrossRef]
  50. Limpeanchob, N.; Jaipan, S.; Rattanakaruna, S.; Phrompittayarat, W.; Ingkaninan, K. Neuroprotective effect of Bacopa monnieri on beta-amyloid-induced cell death in primary cortical culture. J. Ethnopharmacol. 2008, 120, 112–117. [Google Scholar] [CrossRef]
  51. Katajamaa, M.; Miettinen, J.; Orešič, M. MZmine: Toolbox for processing and visualization of mass spectrometry based molecular profile data. Bioinformatics 2006, 22, 634–636. [Google Scholar] [CrossRef]
  52. Schymanski, E.L.; Jeon, J.; Gulde, R.; Fenner, K.; Ruff, M.; Singer, H.P.; Hollender, J. Identifying Small Molecules via High Resolution Mass Spectrometry: Communicating Confidence. Environ. Sci. Technol. 2014, 48, 2097–2098. [Google Scholar] [CrossRef]
  53. Challal, S.; Queiroz, E.F.; Debrus, B.; Kloeti, W.; Guillarme, D.; Gupta, M.P.; Wolfender, J.L. Rational and Efficient Preparative Isolation of Natural Products by MPLC-UV-ELSD based on HPLC to MPLC Gradient Transfer. Planta Med. 2015, 81, 1636–1643. [Google Scholar] [CrossRef] [Green Version]
  54. Guillarme, D.; Nguyen, D.T.T.; Rudaz, S.; Veuthey, J.-L. Method transfer for fast liquid chromatography in pharmaceutical analysis: Application to short columns packed with small particle. Part I: Isocratic separation. Eur. J. Pharm. Biopharm. 2007, 66, 475–482. [Google Scholar] [CrossRef]
  55. Queiroz, E.F.; Alfattani, A.; Afzan, A.; Marcourt, L.; Guillarme, D.; Wolfender, J.-L. Utility of dry load injection for an efficient natural products isolation at the semi-preparative chromatographic scale. J. Chromatogr. A 2019, 1598, 85–91. [Google Scholar] [CrossRef]
  56. Tabata, M.; Umetani, Y.; Ooya, M.; Tanaka, S. Glucosylation of phenolic compounds by plant cell cultures. Phytochemistry 1988, 27, 809–813. [Google Scholar] [CrossRef]
  57. Bianco, A.; Mazzei, R.A.; Melchioni, C.; Romeo, G.; Scarpati, M.L.; Soriero, A.; Uccella, N. Microcomponents of olive oil—III. Glucosides of 2(3,4-dihydroxy-phenyl)ethanol. Food Chem. 1998, 63, 461–464. [Google Scholar] [CrossRef]
  58. Jer-Huei, L.; Yi-Chu, L.; Jiing-Ping, H.; Kuo-Ching, W. Parishins B and C from rhizomes of Gastrodia elata. Phytochemistry 1996, 42, 549–551. [Google Scholar] [CrossRef]
  59. Saluk-Juszczak, J.; Olas, B.; Nowak, P.; Staroń, A.; Wachowicz, B. Protective effects of D-glucaro-1,4-lactone against oxidative modifications in blood platelets. Nutr. Metab. Cardiovasc. Dis. 2008, 18, 422–428. [Google Scholar] [CrossRef]
  60. Smith, P.K.; Krohn, R.I.; Hermanson, G.T.; Mallia, A.K.; Gartner, F.H.; Provenzano, M.D.; Fujimoto, E.K.; Goeke, N.M.; Olson, B.J.; Klenk, D.C. Measurement of protein using bicinchoninic acid. Anal. Biochem. 1985, 150, 76–85. [Google Scholar] [CrossRef]
  61. ChemViz: Cheminformatics Plugin for Cytoscape. Available online: http://www.cgl.ucsf.edu/cytoscape/chemViz/ (accessed on 10 July 2018).
  62. Global Natural Product Social Molecular Networking. Available online: https://gnps.ucsd.edu/ProteoSAFe/status.jsp? (accessed on 19 June 2018).
  63. MASSIVE datasets. Available online: ftp://massive.ucsd.edu/MSV000083989 (accessed on 18 June 2019).
Sample Availability: Samples of the compounds 111 are available upon request from the authors.
Figure 1. Schematic diagram of lipid peroxidation inhibitor discovery from LC-HRMS2 analyses of 59 Bacopa extracts combining metabolomics MVA and multi-informative MN.
Molecules 24 02989 g001
Figure 2. Anti-lipid peroxidation activities of three Bacopa species i.e., B. monnieri (BM), B. caroliniana (BC), and B. floribunda plant (BF) collected from different regions in the (A) rainy, (B) winter and (C) summer seasons. Samples giving >40% inhibition were considered active, 30‒40% inhibition was intermediate activity, 20‒30% inhibition was low activity, and those exhibiting <20% inhibition were considered inactive. Trolox (100 µg/mL) was used as a positive control.
Molecules 24 02989 g002
Figure 3. (A) PCA score plot based on chemical profiles of 59 extracts of three Bacopa species. (B,C) PCA score plots based on chemical profiles of 36 extracts of B. monnieri and 12 extracts of B. caroliniana, respectively from different sources in three seasonal collections. (D) OPLS score plot based on the chemical profiles and anti-lipid peroxidation activity of all Bacopa extracts. (E). S-plot presenting nineteen candidate active features with high p[1] values (red filled star) and inactive features with low p[1] value (blue filled star).
Molecules 24 02989 g003
Figure 4. Multi-informational molecular map obtained from the analyses of 59 extracts of three Bacopa species mapping with taxonomy and anti-lipid peroxidation activity. Taxonomies of the samples are shown in different colors on the border of each node. Green, blue and purple represent BM, BC and BF, respectively. Bioactivities of the samples are shown in different colors inside each node. The active extracts with an inhibition higher than 40% are represented in red and inactive extracts with less than 40% inhibition are represented in gray. The size of each node is based on the peak height intensity. (A) A multi-informative massive molecular network created from MS2 datasets. (B) Five selected bioactive clusters, MN1-MN5 with two potential candidates in each cluster, (C) an inactive cluster, MN6. Chemical structures of the active compounds in Figure 4B,C are expressed with IC50 values of anti-lipid peroxidation activity.
Molecules 24 02989 g004
Figure 5. The COSY, HMBC and ROESY correlations of new compounds 46.
Molecules 24 02989 g005
Figure 6. Percentage distribution of ten bioactive compounds in each Bacopa species, calculated by division of the average MS signal intensity of the compound in each species by a sum of signal intensities of the compound in three Bacopa species ×100.
Molecules 24 02989 g006
Table 1. The nineteen bioactive candidate features (F1F19) ranked by p[1] value from S-plot of MVA and twenty-five bioactive candidates selected from prioritized clusters of MN (MN1–MN5). Ten potential bioactive compounds prioritized from the merging of MVA and MN approach are highlighted (one color per cluster). IC50 values of the compounds on anti-lipid peroxidation activity are expressed in µM and as an average from triplicate experiments ± standard deviation.
IDm/zRT (min)p[1] Value*Selected
Bioactive Cluster
Chemical FormulaΔ ppmDereplicated Compounds
(MSMS Based Identification)**
Isolated Compounds
(NMR Identification)
Anti-Lipid Peroxidation Activity (IC50 (µM))
F1191.0197[M − H]¯0.250.239MN5C6H8O70.14Idaric acid-1,4-lactone
F2217.0487[M + Cl]¯0.230.207NSC6H14O6−1.20Adduct of F18
F3477.1420[M − H]¯1.380.204MN3C23H26O11−3.91Plantainoside BbPlantainoside B (1)119.27 ± 14.03
F4377.0873[M − H]¯0.240.183NSC18H18O91.084,8-Dihydroxy-1,2,3,6,7-pentamethoxy-9H-xanthen-9-one
F5315.1099[M − H]¯0.600.166NSC14H20O8−4.312-(3,5-Dihydroxyphenyl)ethanol-3'-O-β-d-glucopyranoside3,4-dihydroxyphenethyl glucoside (8)>500
F6435.1313[M − H]¯1.280.165MN4C21H24O10−3.74Monnieraside IIIaMonnieraside III (2)101.84 ± 8.44
F7191.0197[M − H]¯0.310.163MN5C6H8O70.14Idaric acid-1,4-lactone isomer
F8955.2917[2M − H]1.380.156MN3C23H26O11−4.91Dimer of F3
F9461.1473[M − H]¯1.600.154MN1C23H26O10−4.298-O-(6’-O-trans-Coumaroyl-β-d-glucopyranosyl)-3,4-dihydroxyphenylethanol
F10491.1580[M − H]¯1.670.152MN2C24H28O11−4.51Monnieraside IIaMonnieraside II (3)65.35 ± 0.63
F111063.4467[M − H]¯3.070.128NSC49H76O23S−3.92Unidentifiedc
F12477.1420[M − H]¯1.530.119MN3C23H26O11−3.91Plantainoside BbMonnieraside IVe (4)105.03 ± 2.65
F13219.0458[M − H]¯0.230.118NSC15H8O2−3.41Unidentifiedc
F14461.1473[M − H]¯1.710.115MN1C23H26O10−4.298-O-(6’-O-trans-Coumaroyl-β-d-glucopyranosyl)-3,4-dihydroxyphenylethanolMonnieraside Ve (5)56.26 ± 1.88
F15491.1579[M − H]¯1.780.113MN2C24H28O11−4.31Monnieraside IIaMonnieraside VIe (6)80.07 ± 2.27
F16977.4458[M − H]¯3.000.112NSC46H74O20S−3.75Bacopaside Ia >1000f
F17299.0786[M − H]¯0.780.110MN4C13H16O8−4.544-Hydroxybenzoyl glucoseb4-hydroxybenzoyl glucose (7)>500
F18181.0717[M − H]¯0.230.107NSC6H14O6−0.21Mannitold
F19631.2274[M − H]¯0.600.104NSC46H32O30.74Unidentifiedc
F20497.1243[M + Cl]¯1.580.033MN1C23H26O10−4.63Adduct of F9
F21461.0749[M − H]¯1.560.003MN1C21H18O12−5.093',4',5,7-Tetrahydroxyflavone5-O-β-d-glucurono-pyranoside
F22497.1243[M + Cl]¯1.710.029MN1C23H26O10−4.63Adduct of F14
F23521.1685[M − H]¯1.660.053MN2C25H30O12−3.93Aucubigenin-10-O-(4-hydroxy-3-methoxy-cinnamoyl), 1-O-β-D-glucopyranosideb
F24983.3235[2M − H]¯1.670.084MN2C24H28O11−4.53Dimer of F10
F25527.1347[M + Cl]¯1.670.030MN2C24H28O11−4.05Adduct of F10
F26341.0893[M − H]¯0.660.064MN3C15H18O9−4.37Chaenorrhinosideb
F27477.1421[M − H]¯1.620.043MN3C23H26O11−3.90Plantainoside Bb
F28871.2706[2M − H]¯1.290.077MN4C21H24O10−4.57Dimer of F6
F29471.1084[M + Cl]¯1.290.033MN4C21H24O10−4.36Adduct of F6
F30599.1642[2M − H]¯0.790.068MN4C13H16O8−4.07Dimer of F17
F31421.0046[M − H]¯0.310.008MN5C17H10O130.63Unidentifiedc
F32405.0308[M − H]¯0.310.057MN5C14H14O140.69Unidentifiedc
F33191.0198[M − H]¯0.380.027MN5C6H8O7−0.38Idaric acid-1,4-lactone
Three isolated inactive compounds selected from inactive cluster (MN6) of the MN and in S-plot of MVA
F34727.2125[M − H]¯1.20−0.026MN6C32H40O19−4.67UnidentifiedcParishin C (9)>1000
F35995.3078[M − H]¯1.40−0.037MN6C45H56O25−4.03Parishin AdParishin A (10)>1000
F36727.2123[M − H]¯1.12−0.060MN6C32H40O19−4.40UnidentifiedcParishin B (11)>1000
* The values obtained from S-plot of OPLS and ** DNP-ISDB in silico fragmented results unless specified (Top 1 result only are reported). a,b The compound has been previously reported in B. monnieri and Plantaginaceae family, respectively, c No matching with DNP-ISDB or GNPS libraries, d Annotated compound from GNPS spectral libraries, e New compound and f Standard compound. NS: not selected from bioactive clusters (MN1–MN5) but from other clusters in MN.
Table 2. 1H- and 13C-NMR (600/151 MHz, in CD3OD) of 46.
PositionMonnieraside IV (4)Monnieraside V (5)Monnieraside VI (6)
δCδH (J in Hz)δCδH (J in Hz)δCδH (J in Hz)
1131.5 131.3 131.2
2117.06.61, d (2.1)116.86.62, d (2.1)116.66.61, d (2.1)
3146.0 145.8 145.8
4144.6 144.4 144.3
5116.36.61, d (8.1)116.16.61, d (8.1)116.26.60, d (8.1)
6121.46.49, dd (8.1, 2.1)121.16.50, dd (8.1, 2.1)121.16.48, dd (8.1, 2.1)
736.52.68, t (7.2)36.32.68, m36.32.67, t (7.1)
871.93.64, dt (9.8, 7.2)
4.00, dt (9.8, 7.2)
71.53.63, dt (9.4, 7.3)
4.01, dt (9.4, 6.9)
71.63.63, dt (9.8, 7.1)
4.00, dt (9.8, 7.1)
1'102.34.45, d (8.1)102.04.44, d (8.1)102.14.46, d (8.0)
2'74.94.79, dd (9.3, 8.1)74.64.79, dd (9.3, 8.1)74.74.79, dd (9.3, 8.0)
3'76.23.51, t (9.3)75.93.50, t (9.3)76.03.52, t (9.3)
4'71.83.38, t (9.3)71.53.38, t (9.3)71.53.38, t (9.3)
5'78.13.29 (overlapped)77.93.28 (overlapped)77.93.30 (overlapped)
6'62.63.69, dd (12.0, 5.7)
3.88, dd (12.0, 2.3)
62.43.69, dd (11.9, 5.8)
3.88, dd (11.9, 1.8)
62.43.69, dd (12.0, 5.8)
3.88, dd (12.0, 2.3)
1"128.2 127.6 127.9
2"118.77.38, d (2.1)133.47.60, d (8.7)114.87.72, d (2.0)
3"145.7 115.56.74, d (8.7)148.0
4"148.3 159.8 149.1
5"115.76.72, d (8.2)115.56.74, d (8.7)115.46.76, d (8.2)
6"125.17.08, dd (8.2, 2.1)133.47.60, d (8.7)126.47.12, dd (8.2, 2.0)
7"145.16.81, d (12.8)144.66.88 d (12.7)145.16.87, d (12.8)
8"116.75.73, d (12.8)116.65.76, d (12.7)116.55.77, d (12.8)
9"167.4 167.3 167.1
OCH3 56.23.85, s
Table 3. The geographical details of the Bacopa samples collected in this study. Samples 1–16 were collected in 3 seasons i.e., winter, summer, and rainy season (48 samples). Only sample 17 was collected in summer (1 sample). Plant tissue cultures of B. floribunda (samples 18–27) were collected in April, 2017 (10 samples).
No.CodeBacopa spp.Sources
1BM1B. monnieriPerth, Australia
2BM2B. monnieriWat Phra Sri Mahathat, Bangkok, Thailand
3BM3B. monnieriSamphan garden, Nakhon Pathom, Thailnd
4BM4B. monnieriNaresuan University, Phitsanulok, Thailand
5BM5B. monnieriKasetsart University, Bangkok, Thailand
6BM6B. monnieriNakhon Nayok, Thailand
7BM7B. monnieriChatuchak Market, Bangkok, Thailand
8BM8B. monnieriAyutthaya, Thailand
9BM9B. monnieriFukuoka, Japan (originated in India)
10BM10B. monnieriSiriraj hospital, Bangkok, Thailand
11BM11B. monnieriChatuchak Market, Bangkok, Thailand
12BM12B. monnieriPhetchabun, Thailand (originated in India)
13BC1B. carolinianaNaresuan University, Phitsanulok, Thailand
14BC2B. carolinianaNakhon Nayok, Thailand
15BC3B. carolinianaChiang Mai, Thailand
16BC4B. carolinianaBangkok, Thailand
17BF1B. floribundaSakolnakorn, Thailand
18–27BF2 to BF11B. floribundaPlant tissue cultures obtained from Department of Biology, Faculty of Science, Naresuan University

