Article

Quality Analysis of American Ginseng Cultivated in Heilongjiang Using UPLC-ESI-MRM-MS with Chemometric Methods

Key Laboratory of Chinese Materia Medica, Heilongjiang University of Chinese Medicine, Ministry of Education, Harbin 150040, China
*
Author to whom correspondence should be addressed.
Molecules 2018, 23(9), 2396; https://doi.org/10.3390/molecules23092396
Submission received: 27 August 2018 / Revised: 13 September 2018 / Accepted: 17 September 2018 / Published: 19 September 2018

Abstract

:
American ginseng (Panax quinquefolium) has long been cultivated in China for the function food and medicine. Here, ultra-high performance liquid chromatography was coupled with electrospray ionization and triple quadrupole mass spectrometry (UPLC-ESI-TQ-MS) for simultaneous detection of 22 ginsenosides in American ginseng cultivated in Mudanjiang district of Heilongjiang. The extraction conditions also were optimized by a Box Behnken design experiment. The optimized result was 31.8 mL/g as ratio of liquid to raw materials, 20.3 min of extraction time, and 235.0 W of extraction powers. The quantitative MS parameters for these 22 compounds were rapidly optimized by single factor experiments employing UPLC-ESI-multiple reaction monitoring or multiple ion monitoring (MRM/MIM) scans. Furthermore, the established UPLC-ESI-MRM-MS method showed good linear relationships (R2 > 0.99), repeatability (RSD < 3.86%), precision (RSD < 2.74%), and recovery (94–104%). This method determined 22 bioactive ginsenosides in different parts of the plant (main roots, hairy roots, rhizomes, leaves, and stems) and growth years (one year to four years) of P. quinquefolium. The highest total content of the 22 analytes was in the hairy roots (1.3 × 10⁵ µg/g) followed by rhizomes (7.1 × 10⁴ µg/g), main roots (6.5 × 10⁴ µg/g), leaves (4.2 × 10⁴ µg/g), and stems (2.4 × 10⁴ µg/g). Finally, chemometric methods, hierarchical clustering analysis (HCA) and partial least squares discrimination analysis (PLS-DA), were successfully used to classify and differentiate American ginseng attributed to different growth years. The proposed UPLC-ESI-MRM-MS coupled with HCA and PLS-DA methods was elucidated to be a simple and reliable method for quality evaluation of American ginseng.

1. Introduction

American ginseng, the root of Panax quinquefolium L, belongs to the family Araliaceae and possesses the function of reducing blood sugar, regulating immunity, and decreasing tension [1,2,3,4]. It has been an important traditional Chinese medicine for more than 200 years (since the Qing Dynasty) [5]. American ginseng originated in southeast Canada and the northern USA, but it is now widely cultivated in most regions of China [6]. Many factors such as germplasm, soil, age, climate, and water source can greatly influence the growth of P. quinquefolium [7]. This may result in different chemical components in American ginseng and, thereby, diversity in its quality [8,9]. Heilongjiang province is located in the northeast of China, which has a unique natural climate and soil structure. The impact of this climate on American ginseng cultivated in Heilongjiang is worthy of further research. Therefore, it is necessary to identify and quantify these biological constituents to guarantee the quality, safety, and efficacy of American ginseng cultivated in the Heilongjiang province of China.
Ginsenosides are distinctive and cardinal ingredients that illuminate a series of pharmacological activities of American ginseng. These compounds can be used to assess the quality of its related products [10,11]. Many saponins have been isolated from American ginseng and its processed products, and most of them are naturally classified into protopanaxatriol (PPT), protopanaxadiol (PPD), oleanolic acid (OA), and ocotillol (OCO), according to their aglycones skeletons [12,13]. The contents of some saponins in P. quinquefolium may show a noticeable diversity with the following changes at cultivation ages and medical parts, and even natural climate and soil structure. In addition, it is reported that an ocotillol type of ginsenoside (pseudoginsenoside F11) is a chemical marker of American ginseng, to distinguish other Panax species, while ginsenoside Rf is a characteristic component of Asian ginseng [14,15,16]. High performance liquid chromatography (HPLC) methods [17,18] have been previously established for the detection of ginsenosides in different Panax species, but some methods suffer from low resolution, low sensitivity, and long analytical time. With superior performances in sensitivity and selectivity, ultra performance liquid chromatography coupled with tandem mass spectrometry (UPLC-MS/MS) has been confirmed to be a powerful tool for the analysis of active substances in traditional Chinese medicines [19,20,21,22]. Multiple reaction monitoring (MRM) in triple quadrupole mass spectrometry is frequently employed for quantitative analysis [15,23,24].
In this study, a new quality evaluation method based on UPLC-ESI-MRM-MS is readily developed for the simultaneous determination of 22 ginsenosides in different medical parts (main roots, hairy roots, rhizomes, leaves, and stems) and growth years (one year to four years) of P. quinquefolium. It aims to determine the optimal harvesting time and the best medical parts of American ginseng cultivated in the Heilongjiang districts of China. The results may provide a reason for the sustainable development and utilization of this medicinal resource in order to serve the health of the people. It could also increase the economic income of local pharmaceutical farmers. Finally, it is demonstrated that the UPLC-ESI-MRM-MS with chemometric methods is a credible tool to evaluate American ginseng cultivated in the Heilongjiang province of China.

2. Results and Discussion

2.1. Optimization of Separation and MS Conditions by UPLC-MIM/MRM-EPI

To obtain satisfactory chromatographic separations, UPLC conditions were optimized by selecting columns and adjusting the gradient elution for the separation of all of the compounds in this study. A Waters T3 column (1.8 µm, 2.1 × 150 mm) was selected for the analysis of 22 ginsenosides to achieve smooth baseline separation. Their structural information is shown in Figure 1. Formic acid was effective for chromatographic separation, but it was necessary to find a compromise for the ionization of the compounds under ESI modes. The results showed that 0.1% formic acid in both water and acetonitrile produce the highest MS intensity and the best resolutions for most of the peaks tested. Therefore, an optimized gradient elution program was applied for the separation of the 22 ginsenosides in 20 min, resulting from 0.1% formic acid in both water and acetonitrile at a flow rate of 0.3 mL/min with a column temperature of 30 °C. The total ion chromatography (TIC) of the 22 standard analytes is depicted in Figure 2A.
Fine tuning declustering potential (DP) and collision energy (CE) were conducted by the direct infusion of targeted substance into mass spectrometers. However, this method is time-consuming, labor-intensive, and a massive waste of standards [24,25]. In a previous report, a stepped MSall technique determined the optimal CE values in triple time-of-flight MS, and then these optimal CE values were validated on a TQ-MS [24]. An issue was obviously seen in the simultaneous use of two different MS instruments.
However, in this study, all of the targeted compounds of the MS/MS parameters (precursors, product ions, DP, and CE) were rapidly optimized for each analyte by several multiple reaction monitoring (MRM) and multiple ion monitoring (MIM)-EPI runs in a UPLC-TQ-MS. The MRM and MIM scans were specialized and sensitive modes for the TQ-MS. Because DP values played an essential role in the formation of [M − H] or [M + HCOO] precursor ions, the DP values for each compound were investigated at 70, 80, 90, 100, 110, 120, and 130 V with a fixed CE value of 5 eV employing UPLC-MIM-IDA-EPI scans. The results are shown in Figure S1A, and the optimal DP values for the 22 ginsenosides were between 90 and 120 eV. Because the CE values could fragment [M − H] or [M + HCOO] precursor ions to give Q3 product ions, the different CE values (40, 60, 80, and 100 eV) were applied with fixed DP values to determine the optimal Q1/Q3 ion pairs and CE values using several UPLC-MRM-IDA-EPI scans. Here, the selection criterions of Q3 ions were characterized by both high intensity and good stability using appropriate CE values.
The [M–H − 162] ions were chosen as Q3 product ions for peaks 13, 5, 10, 1316, and 2022, while the [M–H − 132] as Q3 ions were used for peaks 68, 11, 12, 17, and 18. With regard to peaks 4, 9, and 19, the [M–H − 146] ions were readily suitable for quantitative Q3 ions. The optimal CE values were further investigated using Q1/Q3 ion pairs in MRM mode, based on estimating their values as medians with an interval of 5 V. As shown in Figure S1B,C, the CE values of compounds 2, 4, 6, 7, 9, 10, 14, and 1722 were determined to be between 40 and 55 eV, but there were relatively large molecular weights of ginsenosides 1, 3, 5, 8, 1113, and 16, and the ranges of the CE values were applied between 60 to 75 eV. The results of all optimal parameters for the 22 ginsenosides are shown in Table 1. This method showed that it could reconcile the optimal instrumental parameters obtained by direct infusions being different from those in real sample analysis.

2.2. Optimization of Saponin Extraction

In this study, we used the Box-beckon design (BBD), the most popular form of response surface methodology (RSM), to optimize the extraction conditions and to obtain the highest content of ginsenosides. Thus, the total peak areas of the 10 most intensive compounds were selected as an index to evaluate the total extraction yields of ginsenosides.
The effects, such as extraction temperatures, extraction time, ultrasonic power, ratio of liquid to raw materials, and ethanol concentrations were systematically investigated by the single factor method. Figure S2 showed that ultrasonic temperatures (70–90 °C) and ethanol concentrations (80–100%) had weak effects on extraction yields of these active compounds. Thus, extraction time, ultrasonic power, and the ratio of liquid to raw materials were selected as the BBD factors. On the basis of single-factor experimental results, 15 min to 25 min for extraction time, 200 W to 300 W for ultrasonic power, and 20 mL/g to 40 mL/g for the ratio of liquid to raw materials were used in a BBD method to design the experimental project.
The BBD experimental results showed that a second-order polynomial equation was fitted to analyze the data. A mathematical regression model about Y was obtained, as follows:
Y = 3.869 × 10⁷ + 2.957 × 10⁶ × X1 + 6.761 ×10⁴ × X2 − 3.909 × 10⁵ × X3 − 4.240 × 10⁵ × X1X2 − 1.365 × 10⁶ × X1X3 − 2.487 × 10⁵ × X2X3 − 9.085 × 10⁶ × X12 − 5.219 × 10⁵ × X22 − 1.124 × 10⁶ × X32.
Here, Y is the response, which was the overall peak intensity of 10 target compounds, and X1, X2 and X3 were assigned to test the variables of the ratio of liquid to raw materials, extraction time, and ultrasonic power, respectively.
The three-dimensional profiles of the multiple non-linear regression models were depicted in Figure S3. The results displayed that that ratio of liquid to raw materials played a more prominent effect on the extraction yields than those of the extraction time and ultrasonic power. By applying the second-order polynomial equation, prediction optimization values were evaluated, and the result was that X1 (ratio of liquid to raw materials) was 31.8 mL/g, X2 (extraction time) was 20.3 min, and X3 (ultrasonic powers) was 235.0 W. Finally, to validate the optimal conditions prepared via RSM, parallel experiments were performed three times to verify the predicted optimum conditions. The predicted values were in excellent agreement with the experimental results.

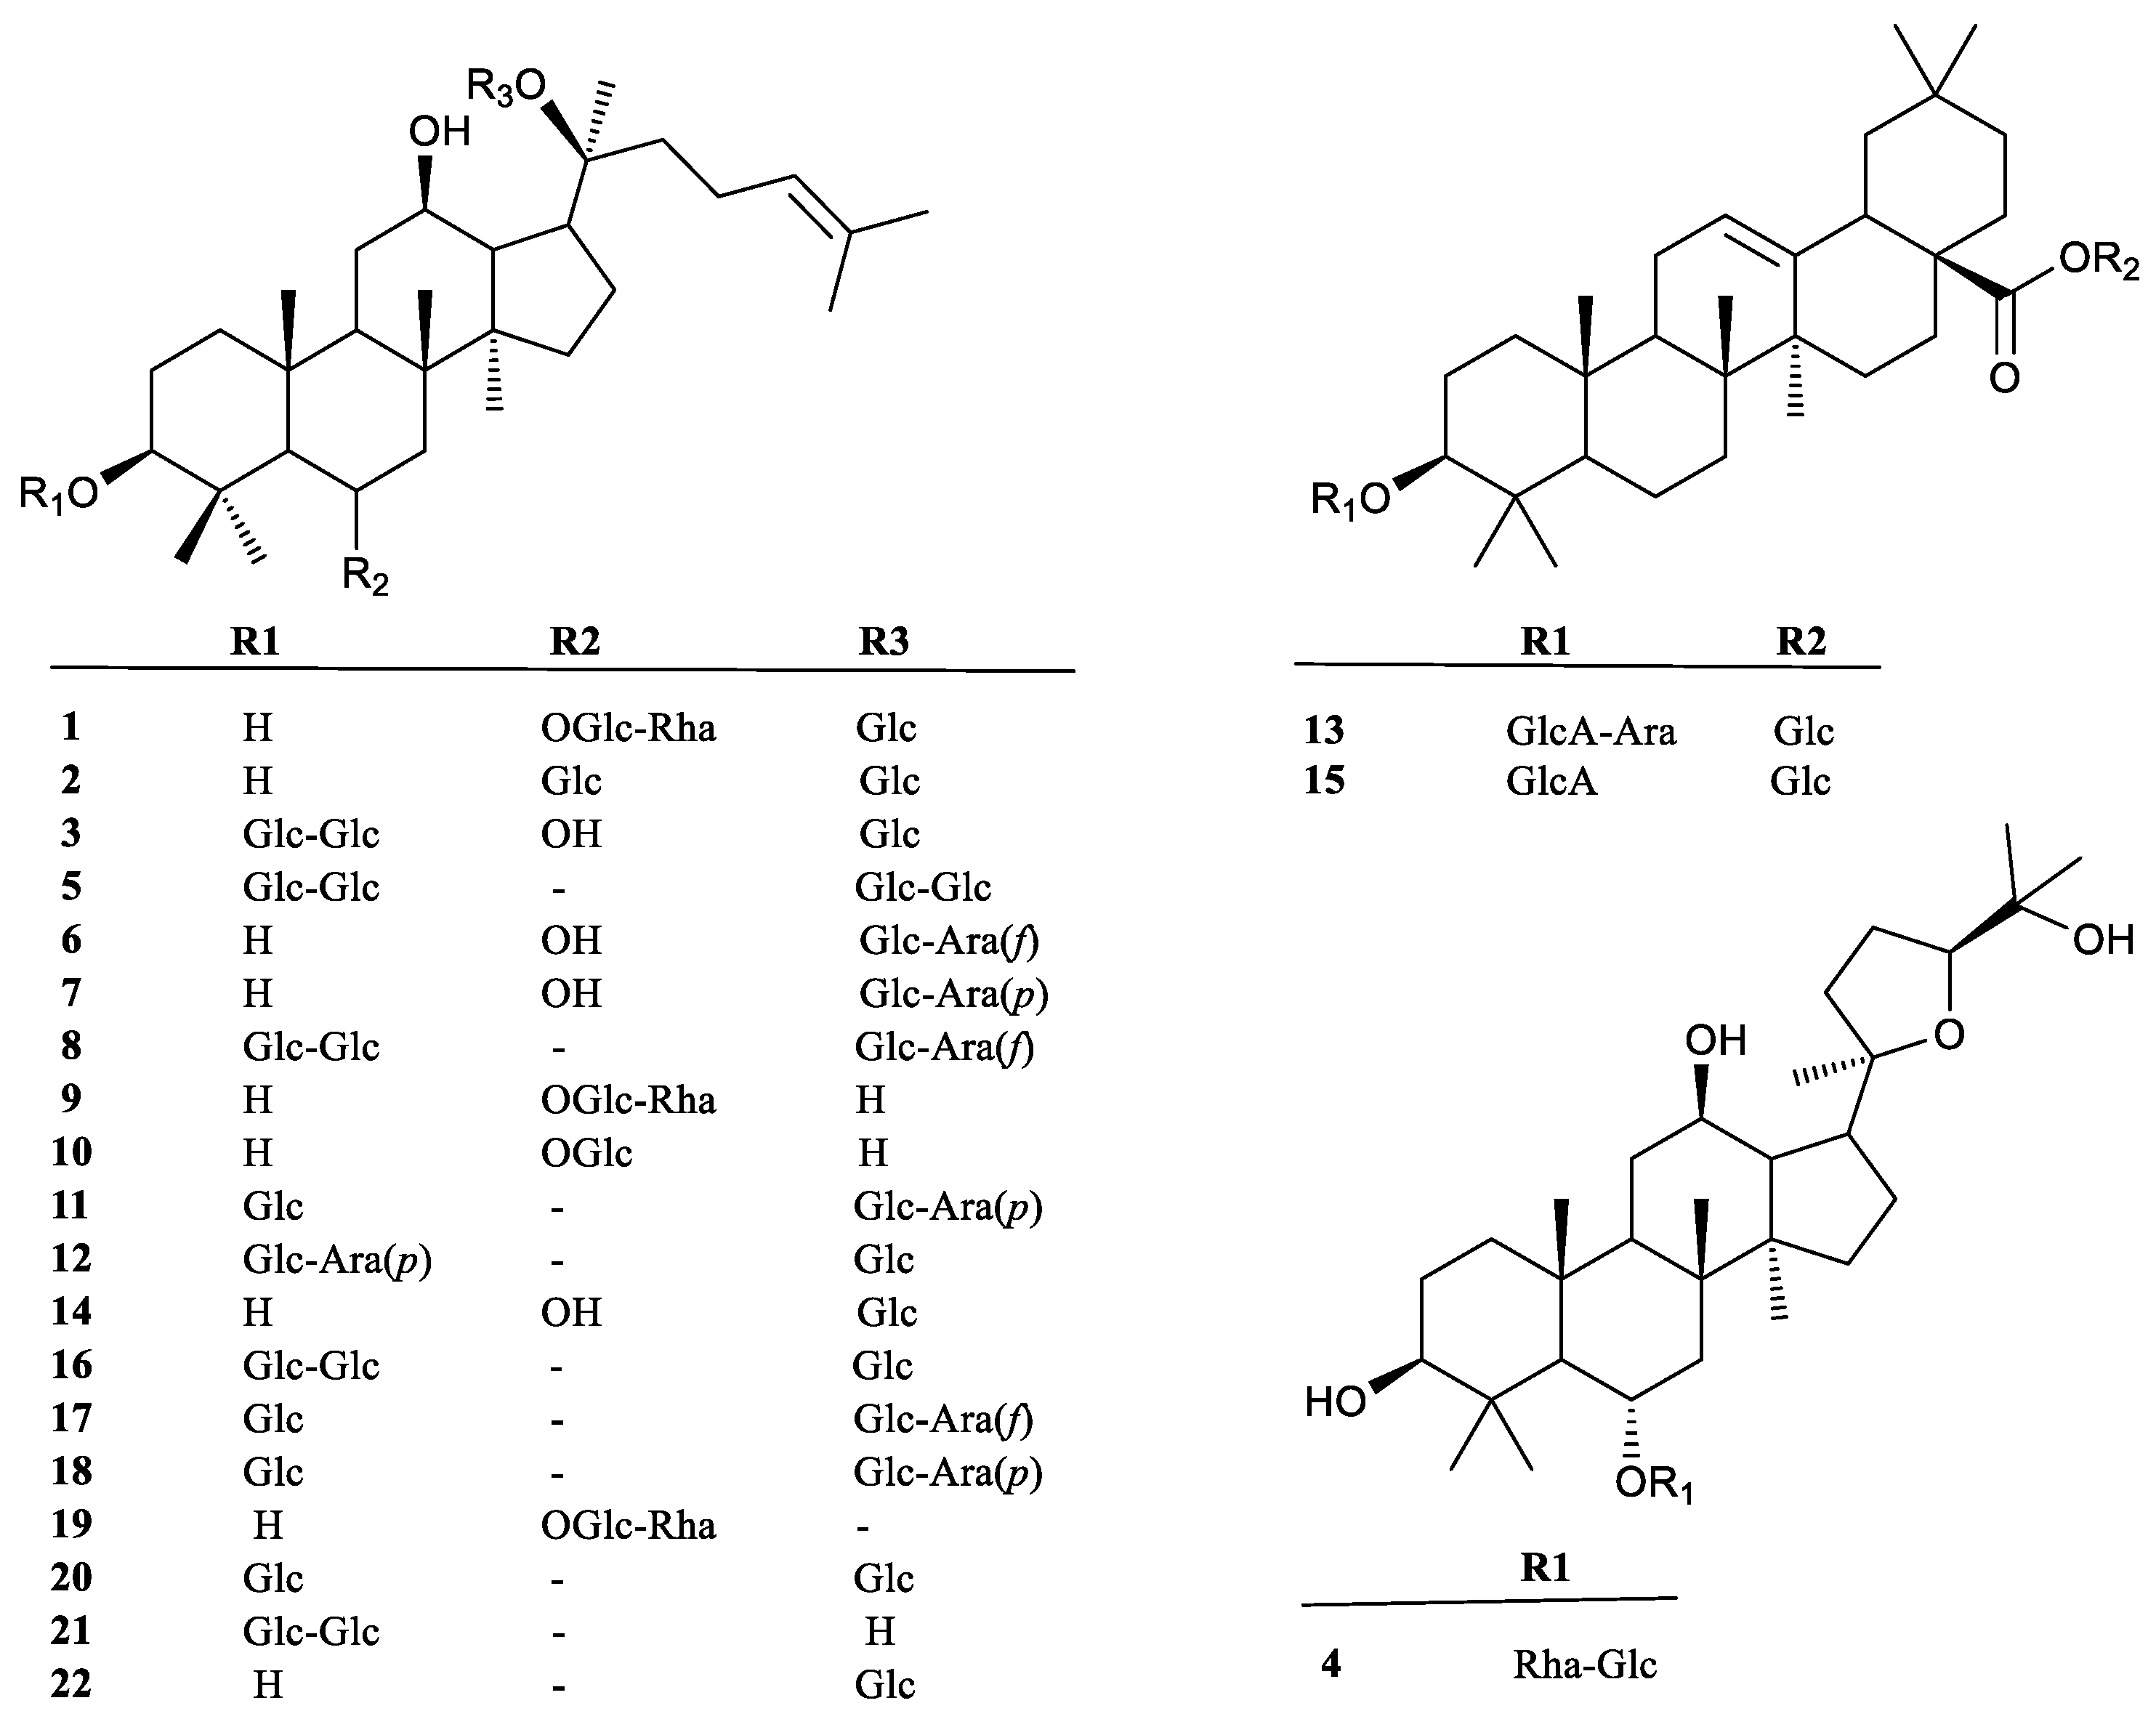
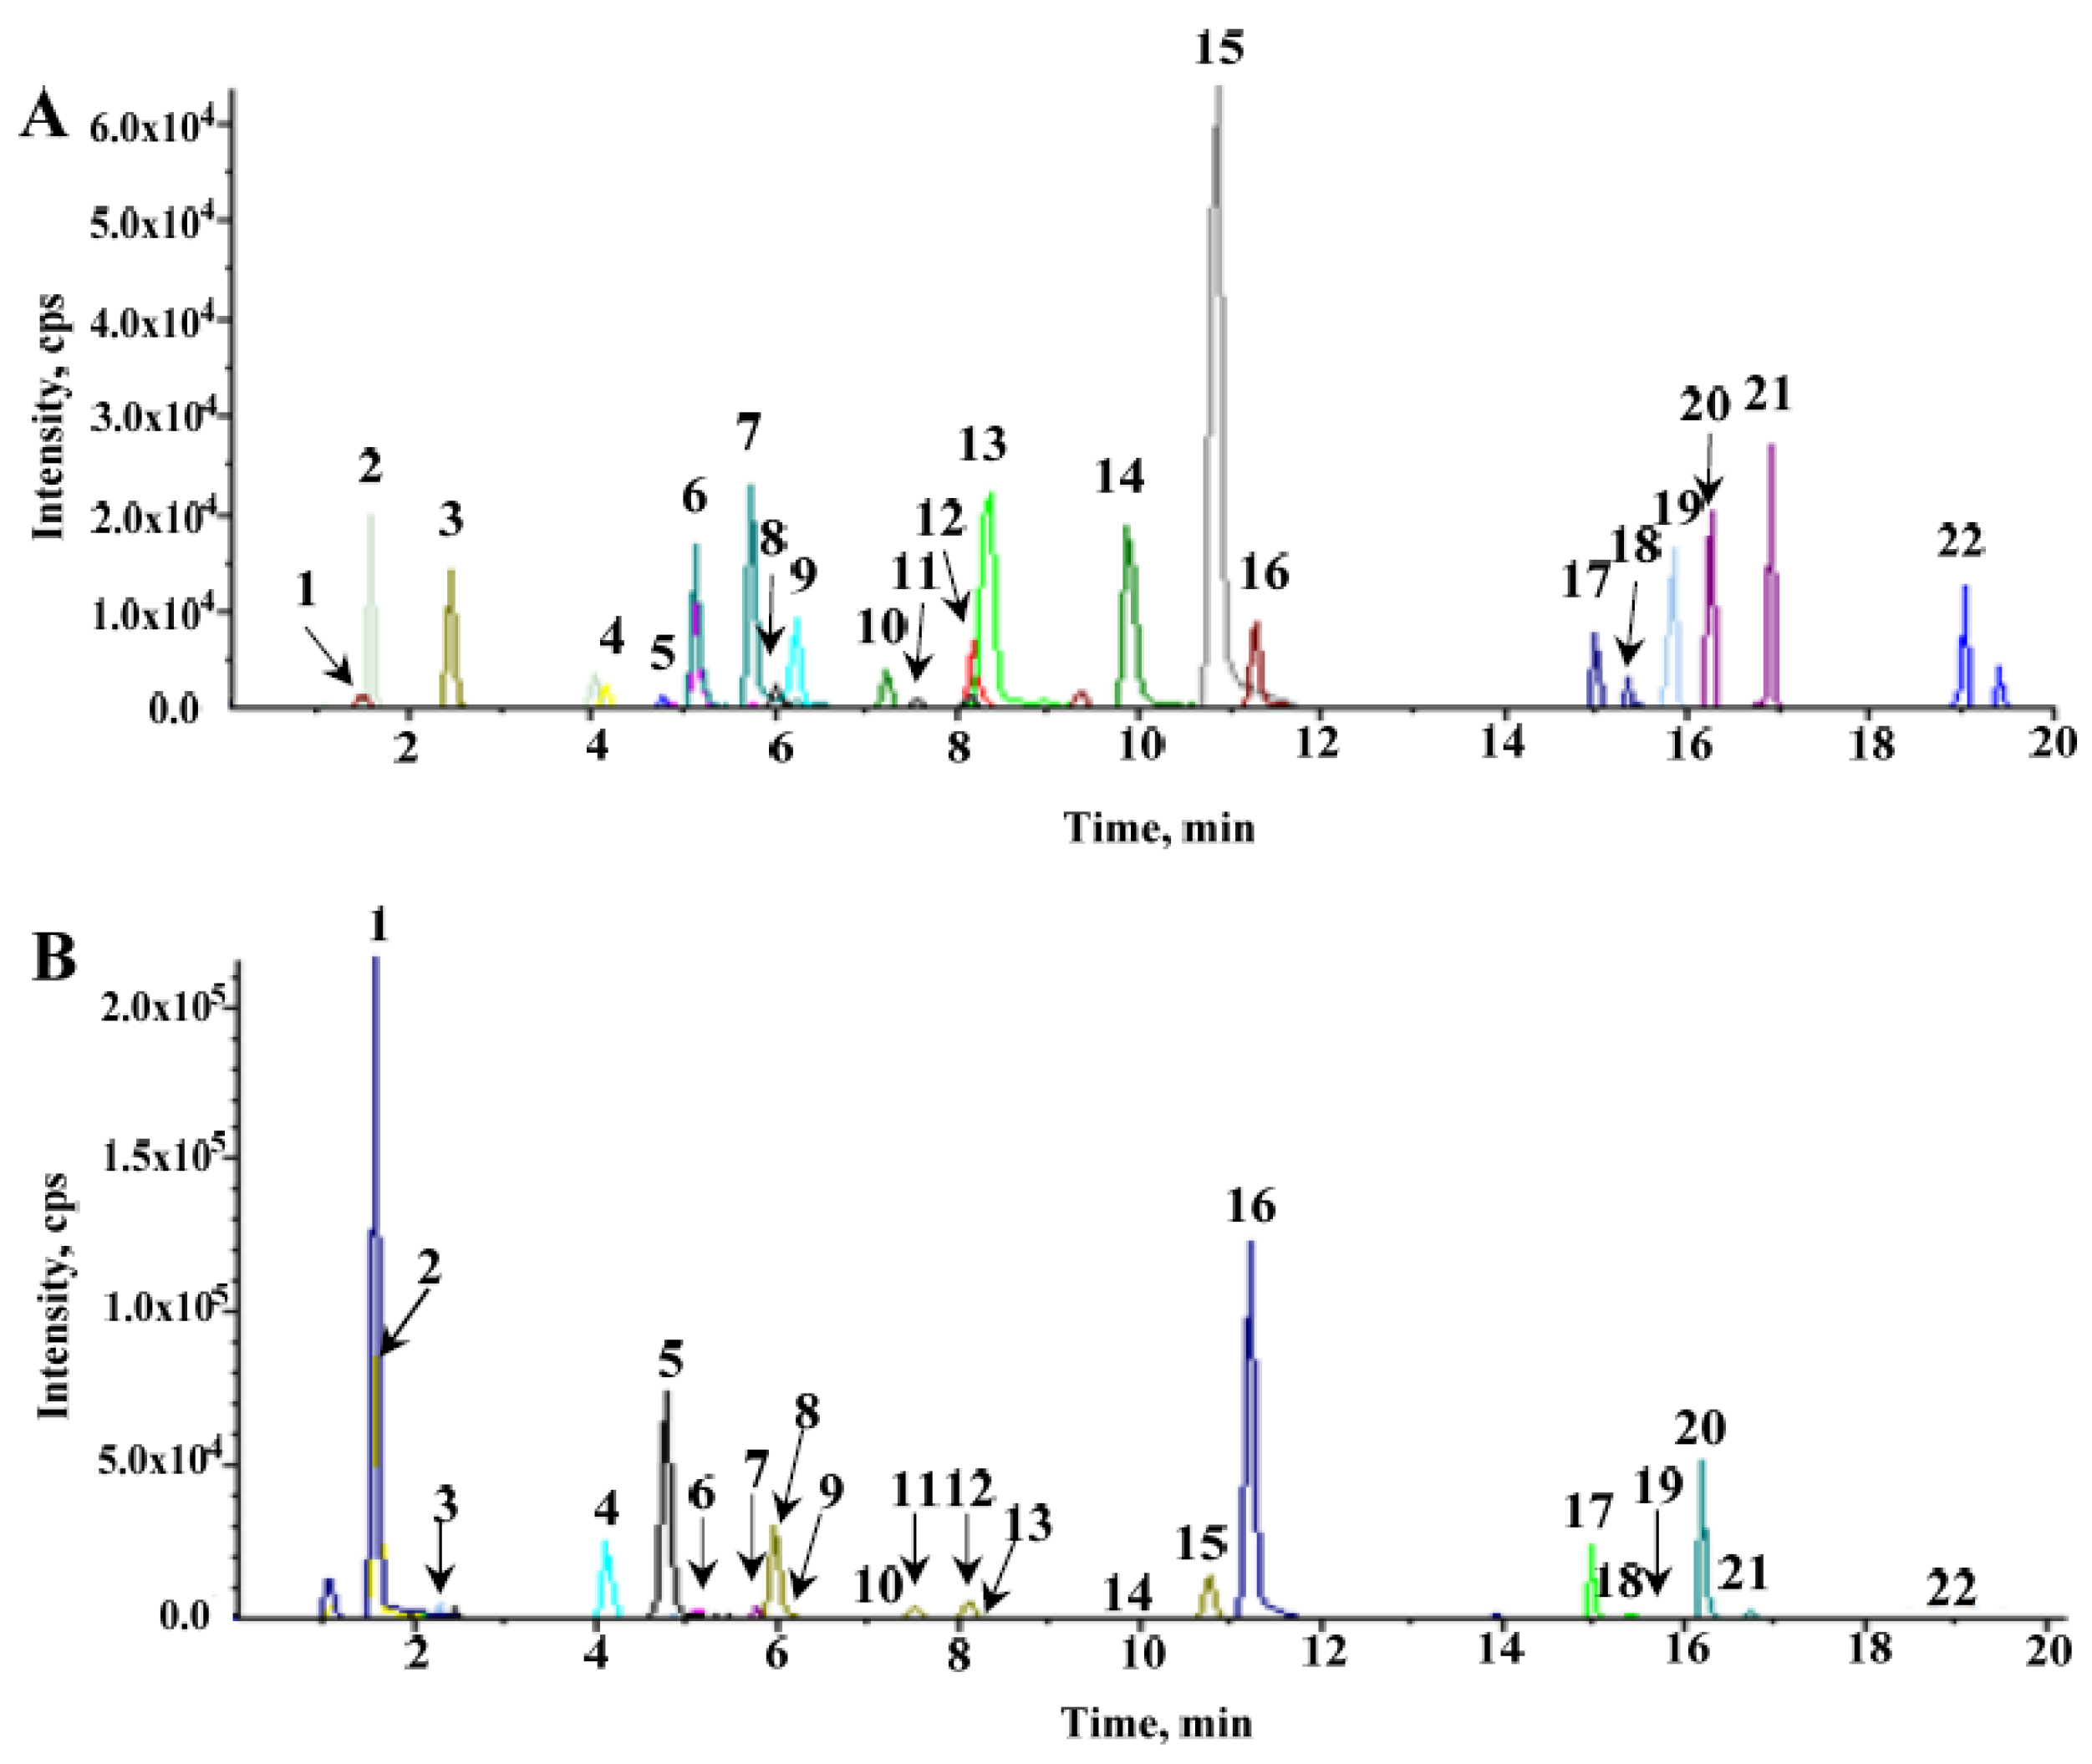
2.3. Qualitative Analysis of Investigated Ginsenosides in Cultivated P. quinquefolium

As shown in the total ion chromatography of hairy roots (Figure 2B), comparison of their retention time with those of the authentic saponin standards, peaks 122 were unambiguously identified as ginsenoside Re, Rg1, vinaR4, pseudo F11, Rb1, F5, F3, Rc, 20-R-Rg2, 20-R-Rh1, Rb2, Rb3, pseudo-Rt1, F1, chikusetsu saponin Iva, Rd, notoginseng-Fe, Rd2, F4, F2, Rg3, and CK, respectively. Their major fragment ions are described in Figure S4 and Table S1, respectively. The ESI-MS/MS spectra were obtained from fragmentation of [M − H] or [M + HCOO] precursors, and the results exhibited a successive loss of the glycosidic units until the formation of [aglycone − H] ions. According to the structural properties, the PPT type compounds had an aglycone ion at m/z 475, which was evident in peaks 13, 6, 7, 9, 10, 14, and 19. The MS/MS spectrum, for Rg1 (Figure S4A; peak 2) gave [PPT − H] at m/z 475.4 via the successive elimination of two glucosyl groups. However, PPD-type saponins, peaks 5, 8, 11, 12, 1618, and 2022, produced an aglycone ion at m/z 459. The MS/MS spectrum of Rd2 (Figure S4B, peak 18) produced a [PPD − H] at m/z 459.4 via continuous losses of an arabinosyl (132 Da), a glucosyl (162 Da), and a glucosyl (162 Da). Meanwhile, the OA-type compounds, including peaks 13 and 15, produced a m/z 455 [OA − H] aglycone ion. For instance, chikusetsu saponin Iva (peak 15) shown in Figure S4C, gave diagnostic aglycone at m/z 455.4, which was formed through the losses of a glucosyl (162 Da) and a GlcUA (176 Da). In contrast, compound 4 (Figure S4D) was OCO type, and it yielded an aglycone ion at m/z 491.3, which was formed by the losses of a rhamnosyl (146 Da) and a glucosyl (162 Da). Therefore, these diagnostic product ions could be used for the identification of triterpenoid aglycones. The corresponding neutral loss could be further employed to determine sugar unit moieties.

2.4. Quantitative Analysis of Real Samples

2.4.1. Validation of Analytical Methods
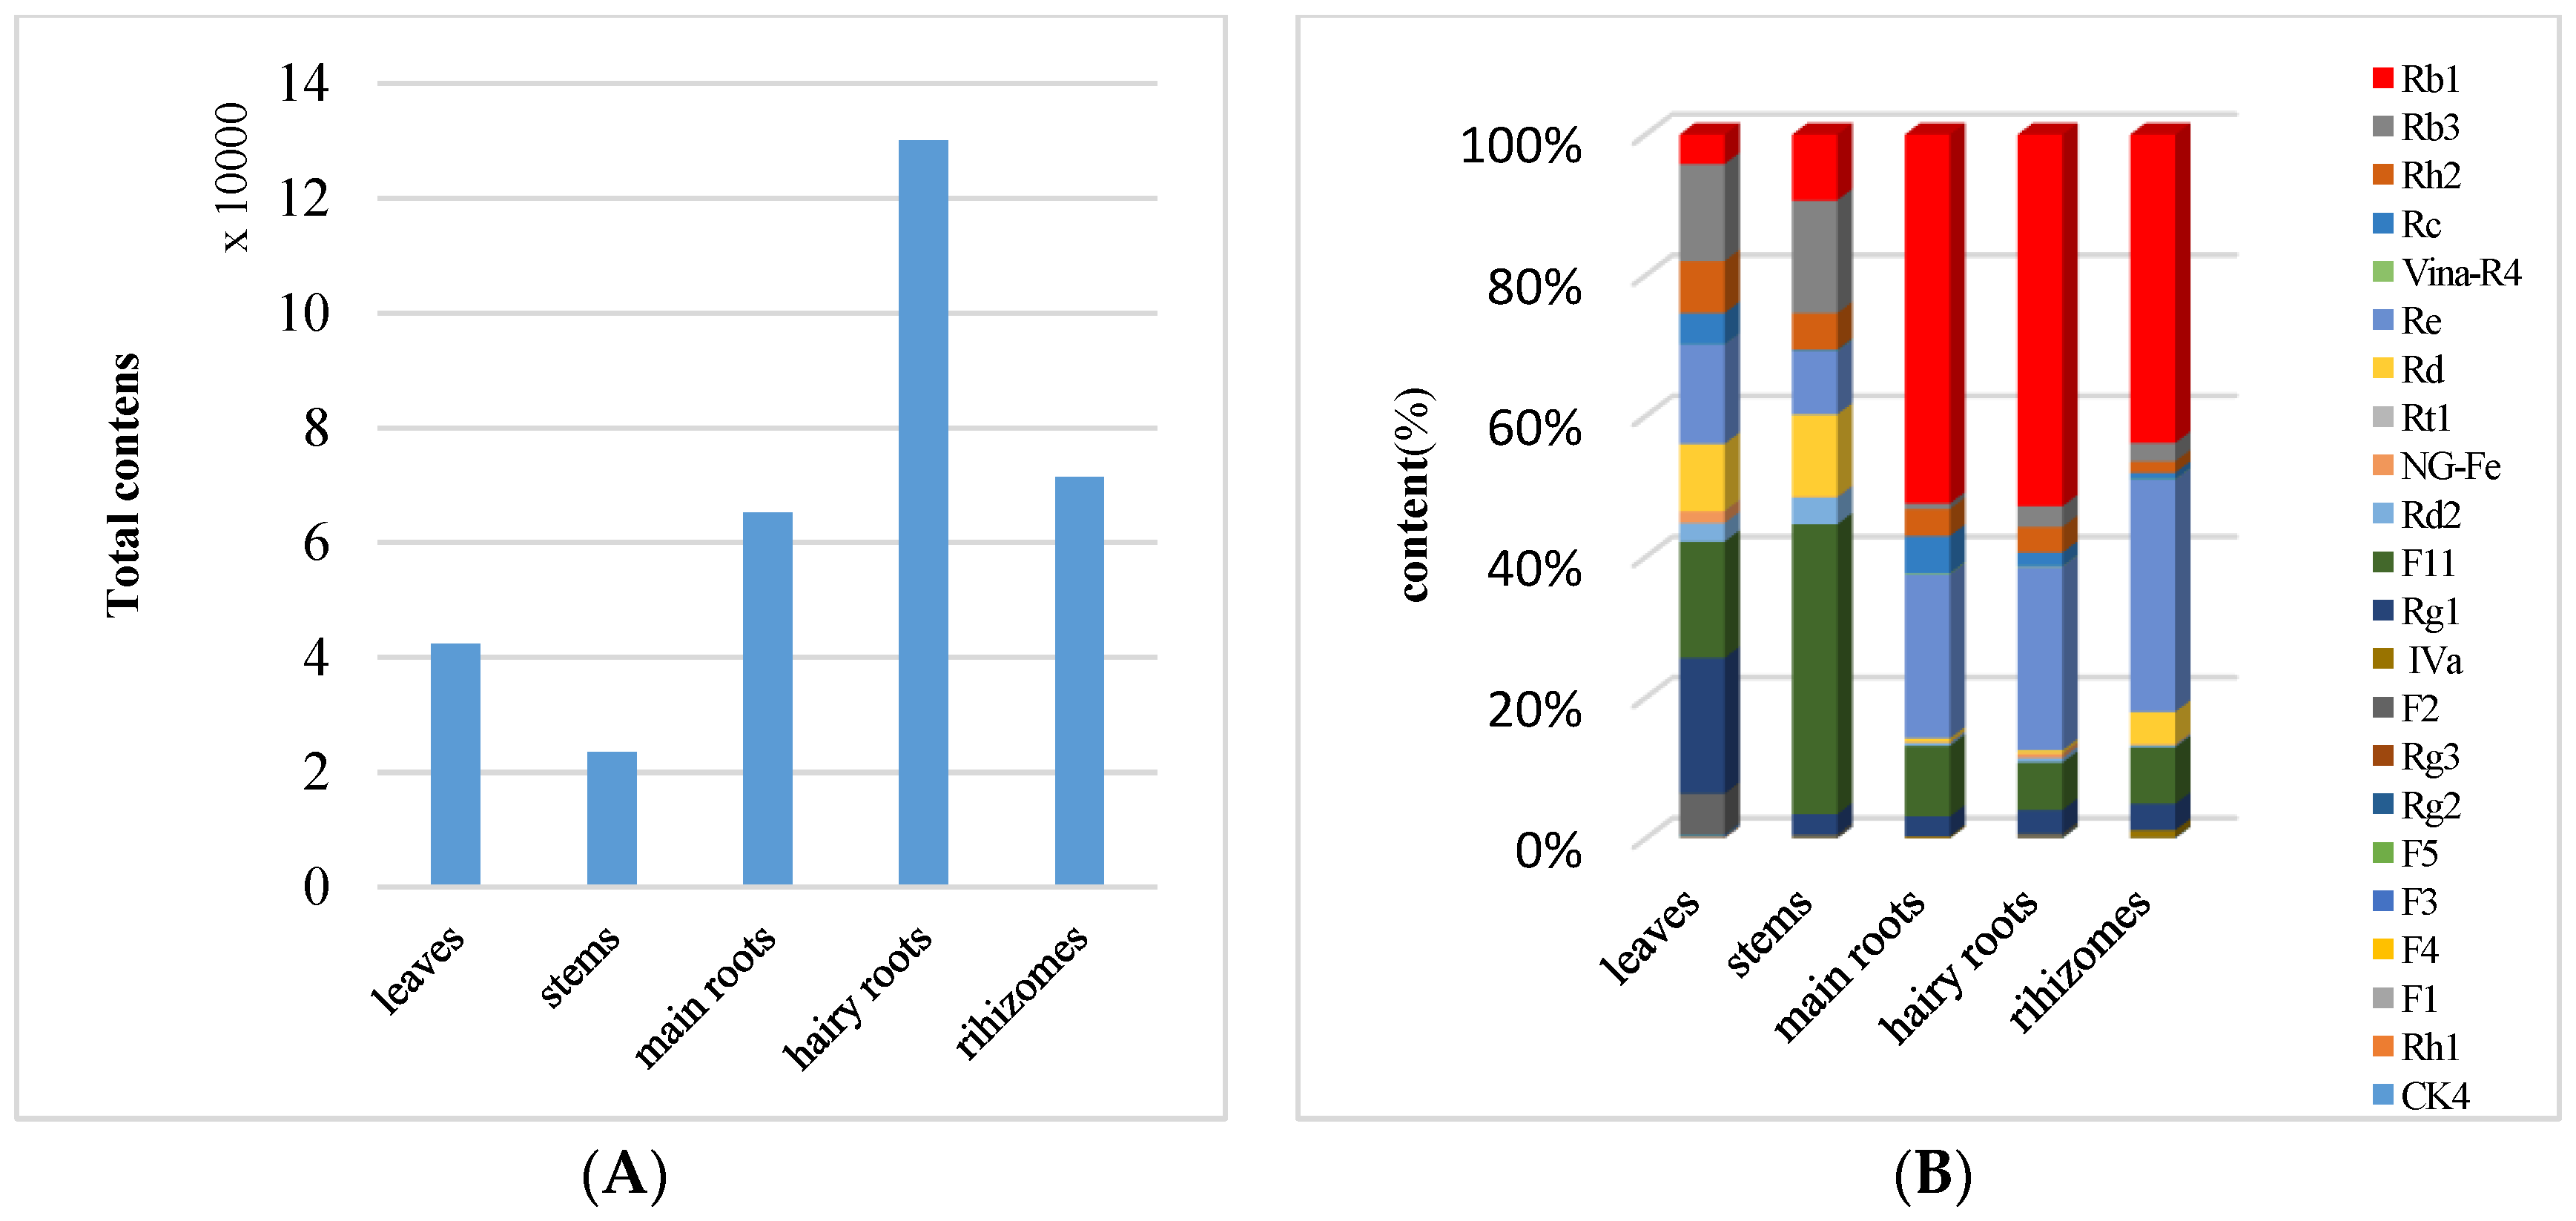
As shown Table 2, all coefficients of determination (R2) higher than 0.995 for all the ginsenosides 122 displayed good linearity over certain concentration ranges. The limits of quantification (LOQ) and the limits of detection (LOD) for all of the investigated compounds are shown in Table 2. The RSDs of inter- and intra-day precisions (n = 6) were less than 2.72% and 2.74%, respectively. This showed good precision for the entire method. The compounds showed to be good stability with a variation of 0.19–3.86% at least 6 h at room temperature. In addition, the sample recoveries ranged from 97–105% for all sample with an RSD within 4% (Table S2). A matrix effect was assayed by relative recoveries in methanol solvent for all compounds ranged between 96% and 103%, thus showing the minimal matrix suppression or enhancement. Hence, this verified UPLC-ESI-MRM-MS method was feasible for the quantitative assessment of P. quinquefolium.

2.4.2. Distribution of Compounds 122 in Different Parts from P. quinquefolium

In this study, 22 bioactive ginsenosides were quantified in main roots, hairy roots, rhizomes, leaves, and stems of P. quinquefolium cultivated in Heilongjiang province by employing a developed UPLC-ESI-MRM-MS method. Therefore, we studied these 22 compounds in different plant parts, which could be calculated using the corresponding calibration curve and data, as listed in Table S3. A graphical representation of this observation is shown in Figure 3A,B, which indicated their remarkable content variations. The highest total content of the 22 analytes was in the hairy roots (1.3 × 10⁵ µg/g), followed by the rhizomes (7.1 × 10⁴ µg/g), the main roots (6.5 × 10⁴ µg/g), leaves (4.2 × 10⁴ µg/g), and stems (2.4 × 10⁴ µg/g) (Figure 3A). These results indicated that the contents of the fibrous roots were five-fold that of the stems, which agreed with previous reports [26]. However, compared to P. notoginsen in literature, the higher content of the total ginsenosides was located in the rhizome, followed by the main roots and hairy roots [27]. As a contrast, the content of total ginsenosides was higher in the leaves and hairy roots than in other parts of P. ginseng [28].
As shown in Figure 3B and Table S3, it was further observed that ginsenoside Re (1), Rg1 (2), pseudo-F11 (4), Rb1 (5), Rc (8), Rb2 (11), and Rb3 (12), were major constituents in the roots, especially in the hairy roots. However, some trace compounds 6, 7, 9, 10, 13, 14, 19, and 22 were also detected in this study. In previous studies, pseudo-F11 (4) was a typical marker constituent of American ginseng [15,29]. Pseudo-F11 (4) was detected in all parts of cultivated P. quinquefolium and the content of peak 4 (9677 µg/g) in stems was much higher than in the hairy roots (8744.3 µg/g), leaves (6992.2 µg/g), roots (6528.5 µg/g), and rhizomes (5737.6 µg/g). In contrast, the contents of peaks 2 (8186 µg/g), 12 (5841 µg/g), 16 (4046 µg/g), 18 (1122 µg/g), and 20 (2421 µg/g) in the cultivated plant leaves were relatively higher than those in main roots, hairy roots, and rhizomes. Nevertheless, the content of peak 5 (1773 µg/g) in the leaves was relatively low.

2.5. Multivariate Statistical Analysis of P. quinquefolium in Different Growth Years

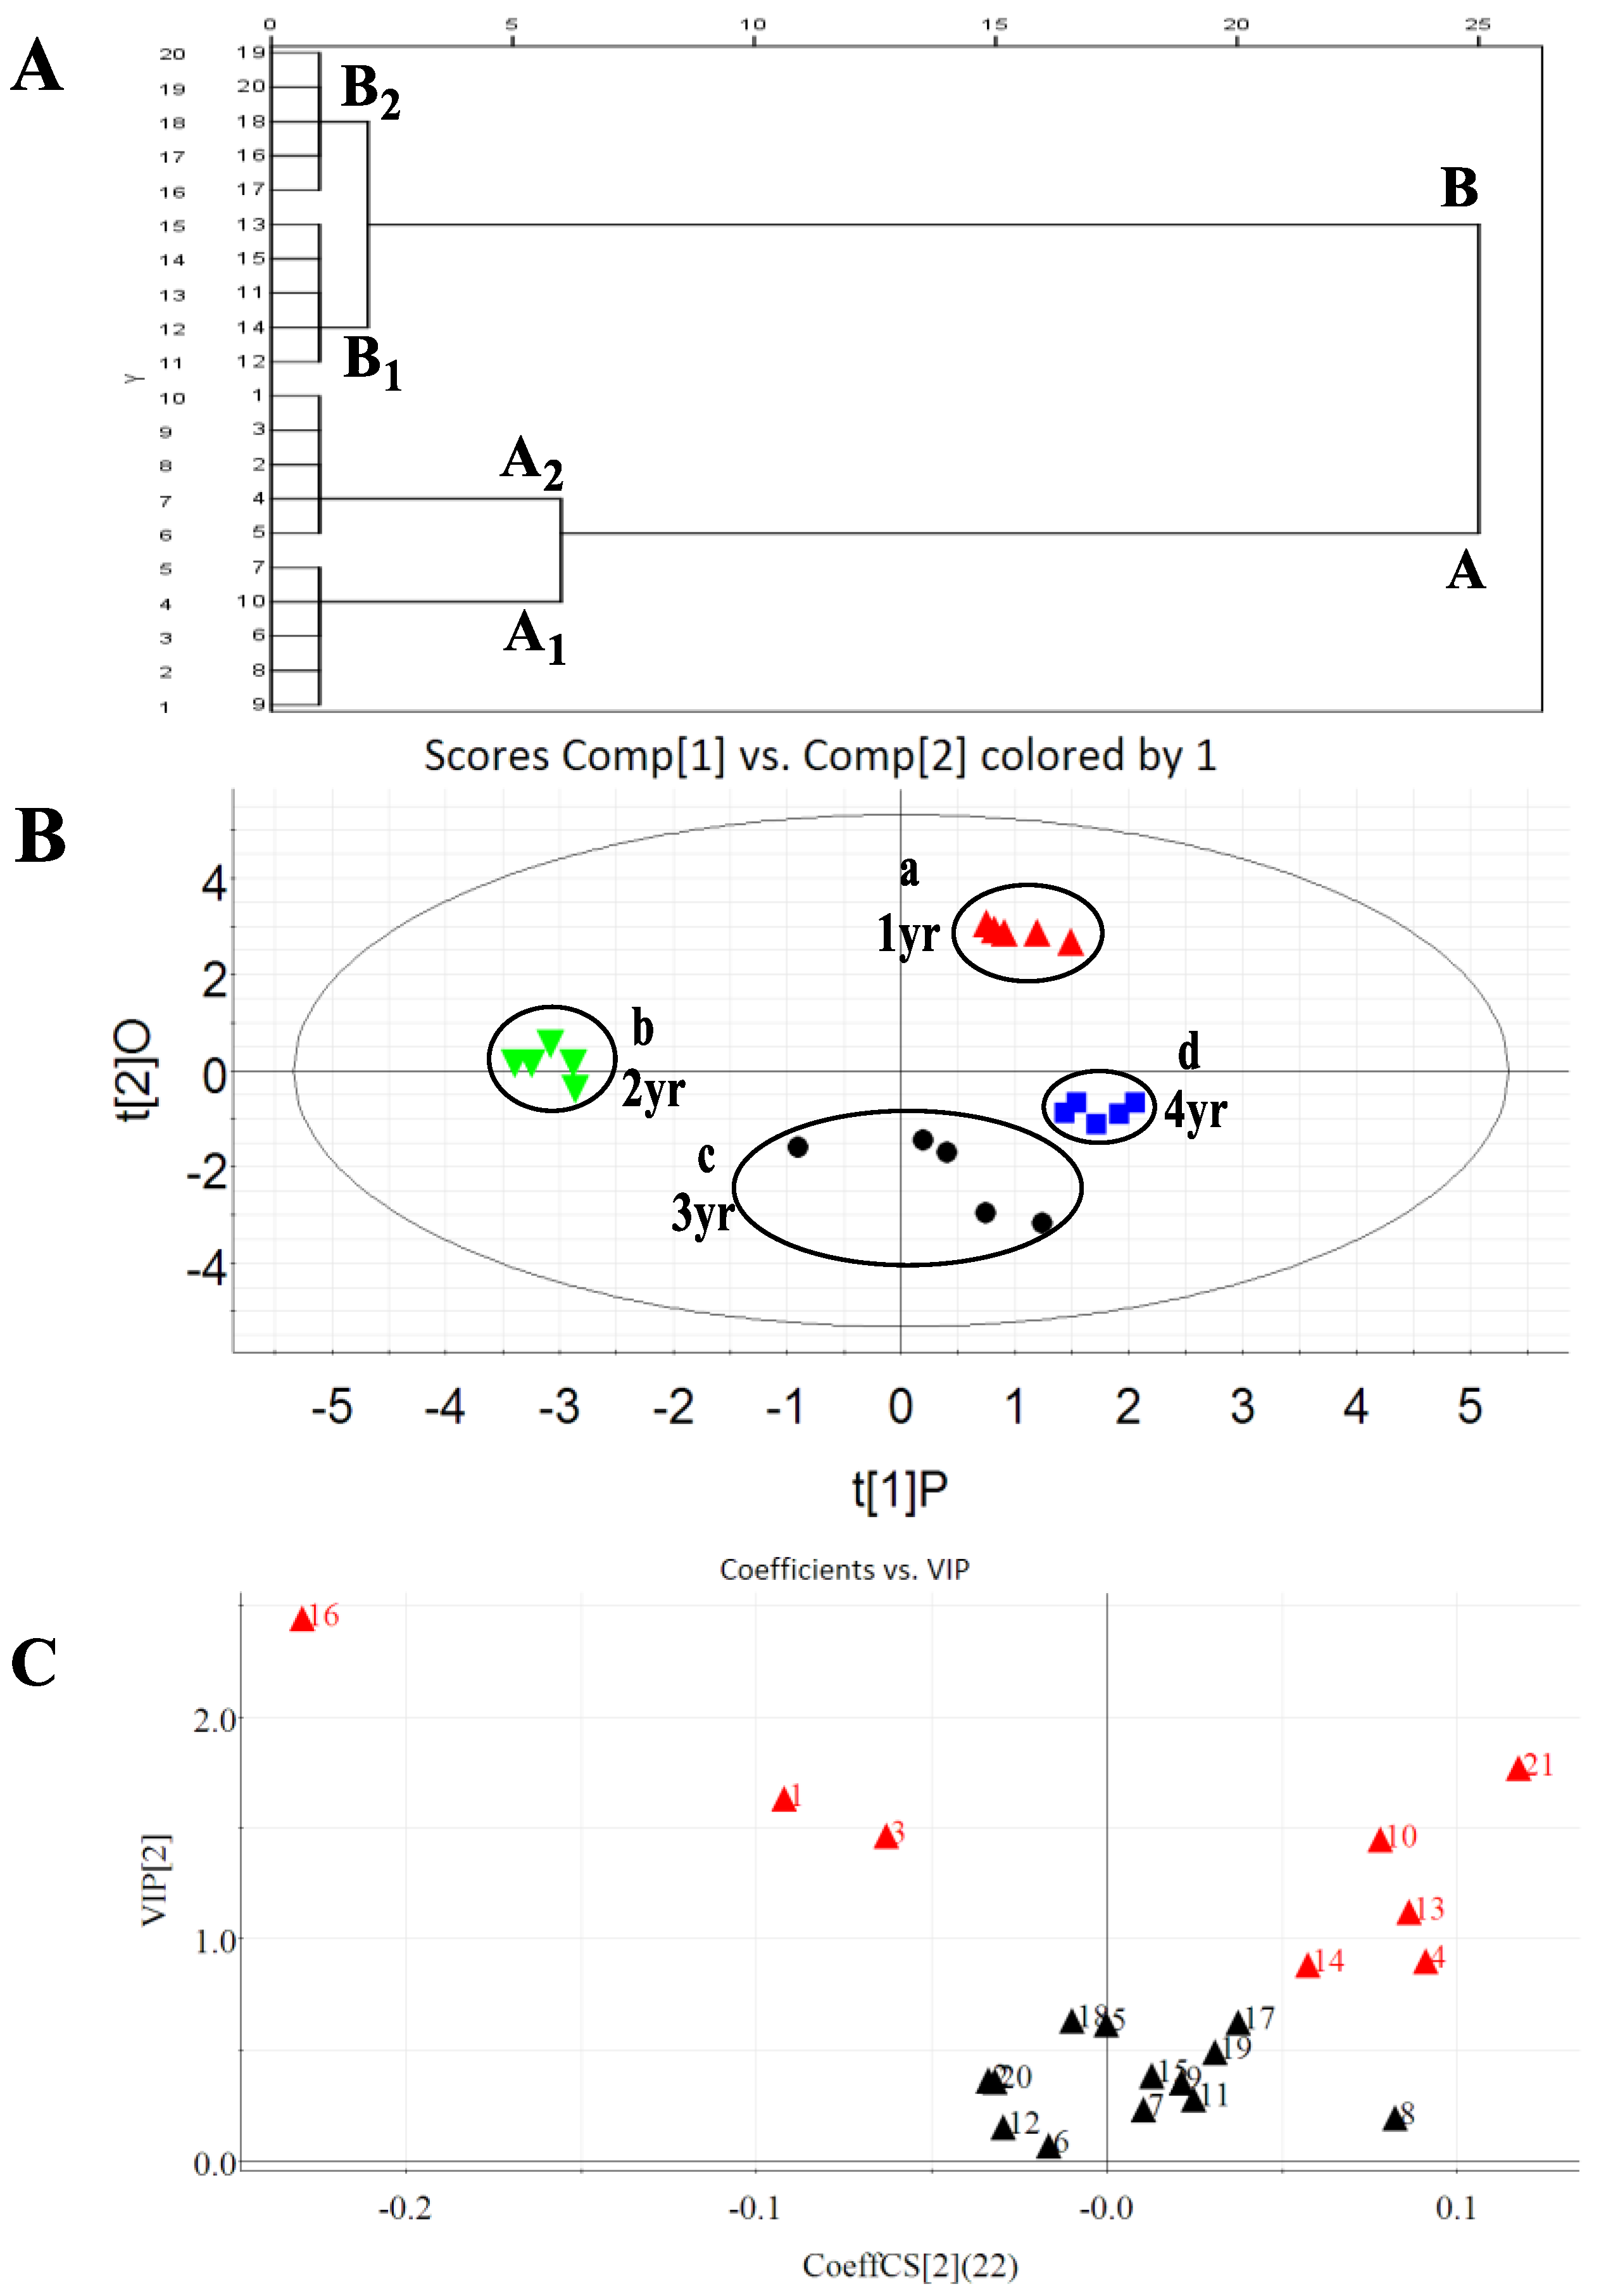
2.5.1. Hierarchical Clustering Analysis

Hierarchical clustering analysis (HCA) emphasizes relatively homogeneous clusters of samples based on measured characteristics for the present data. HCA was performed on the data from samples grown in different years. By employing Ward’s method with the Euclidean distance as measurement indicators, the samples were categorized based on the content of 22 investigated saponins. The dendrogram of HCA is shown in Figure 4A, from which the quality characteristics could be revealed more clearly. The 20 samples were grouped into two main clusters. Namely, samples 1–10 were in cluster A from P. quinquefolium grown in Year 1 to Year 2, and the others were in cluster B from Year 3 to Year 4; both were further clustered into two corresponding subgroups, respectively. In this case, samples 1–5, 6–10, 11–15, and 16–20 were clearly labelled as A1, A2, B1, and B2, respectively. From Figure 4A, it could be easily seen that all the tested samples that were collected from the same years were unambiguously classified into a cluster, which indicated that the quality of these samples were homogenous and stable.

2.5.2. Partial Least Squares Discrimination Analysis

The content distribution of the 22 investigated ginsenosides in roots as a function of different growth years was visualized by performing a partial least squares discrimination analysis (PLS-DA) in Figure 4B,C. PLS-DA is a supervised pattern recognition method using chemometrics to compress the data and to extract information. PLS-DA was employed to compare and evaluate the quality of P. quinquefolium roots grown for one to four years based on the content of 22 targeted ginsenosides. The PLS-DA score plot of the final combined dataset is illustrated in Figure 4B, and it was obvious that these 20 samples were distinctively grouped into four clusters a–d on the basis of their different years as assigned to P. quinquefolium roots grown in 1, 2, 3, or 4 years, respectively. This means the holistic qualities of P. quinquefolium roots grown in the same number of years were consistent with each other. The different growth years indeed produced diverse levels and variations of the investigated ginsenosides.
The variable importance plot (VIP) (Figure 4C) was used to identify the most relevant variables that were distinguished among the one year and four year samples. The VIP values presented the significance of variables in the PLS-DA model and with respect to Y. Here, a relatively larger VIP value was defined at 0.8, so a total of eight potential makers were readily discovered as ginseng Re (1), vina R4 (3), pseudo-F11 (4), Rh1 (10), pseudo-Rt1 (13), F1 (14), Rd (16), and Rg3 (21). Meanwhile, these markers should play essential roles in the discrimination of P. quinquefolium roots in different growth years. Table S3 shows that the total contents of these marker saponins for a 3 year sample reached the maximum value, which were 2-, 1.5-, and 1-folds that of 1 year, 2 year, and 4 year samples, respectively. Furthermore, the total contents of ginsenosides 1 and 16 showed the maximum value in the 3 year samples, whereas the content of pseudo-F11 (4) in 2 year was higher than that in other ages. These obvious variations could result from the specific climates and soil characteristics of the Heilongjiang province of China.

3. Experimental

3.1. Plants and Reagents

P. quinquefolium plants were collected in September 2016, from Mudanjiang (43°49′–44°35′ N, 129°46′–130°32′ E), Heilongjiang, China. All parts of P. quinquefolium were dried naturally in the shade and achieved a constant weight. Ginsenosides Re, Rg1, vina R4, pseudo F11, Rb1, F5, F3, Rc, Rg2, Rh1, Rb2, Rb3, pseudo-Rt1, F1, chikusetsu saponin Iva, Rd, notoginseng (NG)-Fe, Rd2, F4, F2, Rg3, and CK were purchased from Chengdu Must Bio-technology Co. (Chengdu, China). The structural information of these compounds were observed in Figure 1.
HPLC-grade formic acid and acetonitrile were supplied from Fisher Scientific (Watham, MA, USA). Deionized water was obtained by a Mill-Q system, purchased from Millipore, Billerica, MA, USA. Other chemicals were of analytical purity.

3.2. Extraction Procedures

Ultrasound-assisted extraction was carried out in an ultrasonic device with a thermostat. P. quinquefolium (0.1 g) was extracted with 3.2 mL of 80% ethanol, 70.0 °C and 235.0 W for 20.3 min. Then, the samples were centrifuged at 12,000 rpm for 10 min to remove the insoluble materials. The supernatants were filtered through a 0.22 µm nylon syringe filter before being injected into the UPLC system for analysis.

3.3. UPLC-MS/MS System

An Acquity UPLC H-Class system (Waters Corp., Milford, MA, USA) was applied for analysis. A HSS T3 column (2.1 × 150 mm, 1.8 μm) equipped with a HSS T3 guard column (2.1 × 5 mm, 1.8 μm) was employed to achieve separation at 35 °C. The binary system phase consisted of solvent A (water with 0.1% formic acid) and solvent B (acetonitrile with 1.0% formic acid). The gradient elution was used as follows: 0–6 min, 30–35% B; 6–12 min, 35–40% B; 12–16 min, 40–75% B; 16–21 min, 75–85% B, 21–26 min, 85–95% B, 26–26.1 min, 95–30% B. Other parameters were: flow rate 0.3 mL/min, injection volume 2.0 μL, and sample room temperature 10 °C.
A 4000 Qtrap mass spectrometer (SCIEX Corp., Framingham, MA, USA) with an electrospray ionization (ESI) interface was utilized for Mass spectrometric analysis in negative ion mode. All instrument data were acquired and processed by Analyst software (version 1.6, SCIEX). The parameters were set for all analytes in negative mode as follows: an ion spray voltage of 5500 V, a turbo spray temperature of 300 °C, and the interface heater was on. The pressures of the heater gas and the nebulizer gas were set to 40 psi. Nitrogen was used as a nebulizer and an auxiliary gas. Other parameters were set, such as an entrance potential (EP) and a cell exit potential (CXP) of 15 and 10, respectively.

3.4. Validation of Methods

A mixed stock solution containing all 22 compounds was obtained in methanol. A series of appropriate concentrations of working solutions were prepared by dilutions with methanol. The LOQ and LOD of each compound under same chromatographic conditions were determined at an S/N (Signal/Noise) of about 10 and 3, respectively.
The measurements of interday and intraday precisions were employed to determine the precision by analyzing the sample six times within a single day, and over three consecutive days for all mixed standards, respectively. In order to test its repeatability, six sample solutions (P. quinquefolium hairy roots) were prepared under the same condition, and then they were extracted by ultrasound assisted methods, and determined by UPLC-MS/MS, as mentioned above. A recovery was used to assess the accuracy of the analysis method by employing the standards addition method. Known amounts of reference standards (approximately equivalent to 80%, 100%, and 120% levels of each compound) were added into the samples with the same procedures, including extraction, and analyzed by UPLC-MS/MS. Each set of addition was repeated three times. The extraction recovery was calculated as follows: recovery = (sample contents after adding − original contents)/contents of standard solutions for adding.

3.5. Data Processing

Chemometric methods were used to evaluate the cultivated American ginseng in different growth years. The HCA was carried out using SPSS version 16.0 (SPSS, Inc., Chicago, IL, USA). Meanwhile, PLS-DA was performed by employing Masslynx 4.1 extended statistics (Waters MS Technologies, Milford, MA, USA).

4. Conclusions

A simple and feasible UPLC-ESI-MRM-MS method was for the first time developed and validated for the simultaneous quantification of 22 saponins in different medicine parts and growth years of P. quinquefolium cultivated in the Heilongjiang province in northeast China. By comparison with other previous analytical methods, the major merits of this investigation can be further summarized as followed: (1) simultaneous determination of a large and trace amount of chemical compositions up to 22 ginsenosides containing PPT, PPD, OA, and OCO types, along with multiple pairs of structural isomers; (2) rapid determination of the optimal DP and CE values of 22 compounds by single-factor experiments employing UPLC-ESI-MRM/MIM scans; (3) direct application of optimal DP and CE parameters in real sample analysis due to injection solutions during the process of online optimization with the same as those used in the sample. The UPLC-ESI-MRM-MS results showed that the total contents of all 22 compounds were the most abundant in hairy roots followed by rhizomes, main roots, leaves, and stems. Comparative analysis of these major bioactive compounds in different medical parts indicated that it was quite significant for in-depth exploitation of leaves and stems from American ginseng cultivated in the Heilongjiang districts of China. Thus, this valuable medical plant resource will be sustainably utilized and will serve the health of the people. It could also increase the economic income of local pharmaceutical farmers.

Supplementary Materials

The following are available online, Figure S1: Single factor optimizations of DP (A) and CE (B and C) by UPLC-MIM/MRM-EPI. Figure S2: Effect of temperature (A), ethanol concentration (B), ultrasonic time (C), ultrasonic power (D), and ratio of liquid to raw materials (E) on extraction efficiency. Figure S3: Response surface plots showing the predicted value of total saponins yield. Figure S4: MS/MS spectra and fragmentations of peaks for 2 (A), 18 (B), 15 (C) and 4 (D). Table S1: Chemical information and major fragment ions of 22 ginsenosides. Table S2: Precision, stability, and recovery of 22 saponins in P. quinquefolium. Table S3: Contents of 22 compounds from different medicine parts and growth years in P. quinquefolium cultivated in Heilongjiang province.

Author Contributions

Y.-G.X., B.-Y.Y. and H.-X.K. designed this experiment. Y.S., J.L. and X-D.G participated in data analysis and wrote this paper. All authors read and approved the final manuscript.

Funding

Our work was funded by Heilongjiang Natural Science Funds for Distinguished Young Scholar (JC2016020), the University Research and Development Projects of Heilongjiang Province (TSTAU-R2018026), the University Nursing Program for Young Scholars with Creative Talents in Heilongjiang Province (2016209), and the Heilongjiang Graduate Foundation Project (LBH-Z15209 and 2018YJSCX056).

Conflicts of Interest

The authors declare no conflict of interest.

References

  1. Chinese Pharmacopoeia Commission. Pharmacopoeia of People’s Republic of China Beijing; Chemical Industry Press: Beijing, China, 2015. [Google Scholar]
  2. Qi, L.W.; Wang, C.Z.; Yuan, C.S. Ginsenosides from American ginseng: Chemical and pharmacological diversity. Phytochemistry 2011, 72, 689–699. [Google Scholar] [CrossRef] [PubMed] [Green Version]
  3. Vuksan, V.; Sievenpiper, J.L.; Koo, V.Y.; Francis, T.; Beljanzdravkovic, U.; Zheng, X.; Vidgen, E. American ginseng (Panax quinquefolius L.) reduces postprandial glycemia in nondiabetic subjects and subjects with type 2 diabetes mellitus. Arch. Intern. Med. 2000, 160, 1009–1013. [Google Scholar] [CrossRef] [PubMed]
  4. Yuan, C.S.; Wang, C.Z.; Wicks, S.M.; Qi, L.W. Chemical and pharmacological studies of saponins with a focus on American ginseng. J. Ginseng Res. 2010, 34, 160. [Google Scholar] [CrossRef] [PubMed]
  5. Ko, S.K.; Cho, O.S.; Bae, H.M.; Sohn, U.D.; Im, B.O.; Cho, S.H.; Lee, B.Y. Change of Ginsenoside Composition of Various American Ginseng Roots. J. Korean Soc. Appl. Biol. Chem. 2009, 52, 198–201. [Google Scholar] [CrossRef]
  6. Sun, X.; Chen, P.; Cook, S.L.; Jackson, G.P.; Harnly, J.M.; Harrington, P.B. Classification of cultivation locations of Panax quinquefolius L. samples using high performance liquid chromatography-electrospray ionization mass spectrometry and chemometric analysis. Anal. Chem. 2012, 84, 3628–3634. [Google Scholar] [CrossRef] [PubMed]
  7. Li, T.; Mazza, G.; Cottrell, A.C.; Gao, L. Ginsenosides in roots and leaves of American ginseng. J. Agric. Food Chem. 1996, 44, 717–720. [Google Scholar] [CrossRef]
  8. Xu, X.F.; Cheng, X.L.; Lin, Q.H.; Li, S.S.; Jia, Z.; Han, T.; Lin, R.C.; Wang, D.; Wei, F.; Li, X.R. Identification of mountain-cultivated ginseng and cultivated ginseng using UPLC/oa-TOF MSE with a multivariate statistical sample-profiling strategy. J. Ginseng Res. 2016, 40, 344–350. [Google Scholar] [CrossRef] [PubMed]
  9. Liu, Z.; Wang, C.Z.; Zhu, X.Y.; Wan, J.Y.; Zhang, J.; Li, W.; Ruan, C.C.; Yuan, C.S. Dynamic changes in neutral and acidic ginsenosides with different cultivation ages and harvest seasons: Identification of chemical characteristics for Panax ginseng quality control. Molecules 2017, 22, 734. [Google Scholar] [CrossRef] [PubMed]
  10. Kim, S.N.; Ha, Y.W.; Shin, H.; Son, S.H.; Wu, S.J.; Kim, Y.S. Simultaneous quantification of 14 ginsenosides in Panax ginseng C.A. Meyer (Korean red ginseng) by HPLC-ELSD and its application to quality control. J. Pharm. Biomed. Anal. 2007, 45, 164–170. [Google Scholar] [CrossRef] [PubMed]
  11. Lee, C.R.; Wan, K.W.; Shin, C.G.; Lee, H.S.; Han, S.T.; Im, B.O.; Ko, S.K. Comparison of ginsenoside composition and contents in fresh ginseng roots cultivated in Korea, Japan, and China at various ages. Korean J. Food Sci. Technol. 2004, 36, 508–515. [Google Scholar]
  12. Leung, K.S.; Chan, K.; Bensoussan, A.; Munroe, M.J. Application of atmospheric pressure chemical ionisation mass spectrometry in the identification and differentiation of Panax species. Phytochem. Anal. 2007, 18, 146–150. [Google Scholar] [CrossRef] [PubMed]
  13. Qi, L.W.; Wang, C.Z.; Yuan, C.S. Isolation and analysis of ginseng: Advances and challenges. Nat. Prod. Rep. 2011, 28, 467–495. [Google Scholar] [CrossRef] [PubMed]
  14. Chan, T.W.; But, P.P.; Cheng, S.W.; Kwok, I.M.; Lau, F.W.; Xu, H.X. Differentiation and authentication of Panax ginseng, Panax quinquefolius, and ginseng products by using HPLC/MS. Anal. Chem. 2000, 72, 1281–1287. [Google Scholar] [CrossRef] [PubMed]
  15. Li, L.; Luo, G.A.; Liang, Q.L.; Hu, P.; Wang, Y.M. Rapid qualitative and quantitative analyses of Asian ginseng in adulterated American ginseng preparations by UPLC/Q-TOF-MS. J. Pharm. Biomed. Anal. 2010, 52, 66–72. [Google Scholar] [CrossRef] [PubMed]
  16. Li, W.; Gu, C.; Zhang, H.; Awang, D.V.; Fitzloff, J.F.; Fong, H.H.; Van Breemen, R.B. Use of high performance liquid chromatography tandem mass spectrometry to distinguish Panax ginseng C. A. Meyer (Asian ginseng) and Panax quinquefolius L. (North American ginseng). Anal. Chem. 2000, 72, 5417–5422. [Google Scholar] [CrossRef] [PubMed]
  17. Li, W.; Fitzloff, J.F. HPLC analysis of ginsenosides in the roots of Asian ginseng (Panax ginseng) and north American ginseng (Panax quinquefolius) with in-line photodiode array and evaporative light scattering detection. J. Liq. Chromatogr. Relat. Technol. 2002, 25, 29–41. [Google Scholar] [CrossRef]
  18. Yu, C.; Wang, C.Z.; Zhou, C.J.; Wang, B.; Han, L.; Zhang, C.F.; Wu, X.H.; Yuan, C.S. Adulteration and cultivation region identification of American ginseng using HPLC coupled with multivariate analysis. J. Pharm. Biomed. Anal. 2014, 99, 8–15. [Google Scholar] [CrossRef] [PubMed] [Green Version]
  19. Huang, X.; Liu, Y.; Zhang, N.; Sun, X.; Yue, H.; Chen, C.B.; Liu, S.Y. UPLC Orbitrap HRMS Analysis of Panax quinquefolium L. for authentication of Panax genus with chemometric methods. J. Chromatogr. Sci. 2017, 56, 25–35. [Google Scholar] [CrossRef] [PubMed]
  20. Shi, Y.; Sun, C.J.; Zheng, B.; Gao, B.; Sun, A.M. Simultaneous determination of ten ginsenosides in American ginseng functional foods and ginseng raw plant materials by liquid chromatography tandem mass spectrometry. Food Anal. Methods 2013, 6, 112–122. [Google Scholar] [CrossRef]
  21. Steinmann, D.; Ganzera, M. Recent advances on HPLC/MS in medicinal plant analysis. J. Pharm. Biomed. Anal. 2011, 55, 744–757. [Google Scholar] [CrossRef] [PubMed]
  22. Yang, W.Z.; Ye, M.; Qiao, X.; Liu, C.F.; Miao, W.J.; Bo, T.; Tao, H.Y.; Guo, D.A. A strategy for efficient discovery of new natural compounds by integrating orthogonal column chromatography and liquid chromatography/mass spectrometry analysis: Its application in Panax ginseng, Panax quinquefolium and Panax notoginseng to characterize 437 potential new ginsenosides. Anal. Chim. Acta 2012, 739, 56–66. [Google Scholar] [PubMed]
  23. Lai, C.M.; Li, S.P.; Yu, H.; Wan, J.B.; Kan, K.W.; Wang, Y.T. A rapid HPLC-ESI-MS/MS for qualitative and quantitative analysis of saponins in “XUESETONG” injection. J. Pharm. Biomed. Anal. 2006, 40, 669–678. [Google Scholar] [CrossRef] [PubMed]
  24. Ye, H.; Zhu, L.; Wang, L.; Liu, H.; Zhang, J.; Wu, M.; Wang, G.; Hao, H. Stepped MSAll Relied Transition (SMART): An approach to rapidly determine optimal multiple reaction monitoring mass spectrometry parameters for small molecules. Anal. Chim. Acta 2016, 907, 60–68. [Google Scholar] [CrossRef] [PubMed]
  25. Wei, R.; Li, G.; Seymour, A.B. High-throughput and multiplexed LC/MS/MRM method for targeted metabolomics. Anal. Chem. 2010, 82, 5527–5533. [Google Scholar] [CrossRef] [PubMed]
  26. Qu, C.L.; Bai, Y.P.; Jin, X.Q.; Wang, Y.T.; Zhang, K.; You, J.Y.; Zhang, H.Q. Study on ginsenosides in different parts and ages of Panax quinquefolius L. Food Chem. 2009, 115, 340–346. [Google Scholar] [CrossRef]
  27. Wang, J.R.; Yau, L.F.; Gao, W.N.; Liu, Y.; Yick, P.W.; Liu, L.; Jiang, Z.H. Quantitative comparison and metabolite profiling of saponins in different parts of the root of Panax notoginseng. J. Agric. Food Chem. 2014, 62, 9024–9034. [Google Scholar] [CrossRef] [PubMed]
  28. Shi, W.; Wang, Y.; Li, J.; Zhang, H.; Ding, L. Investigation of ginsenosides in different parts and ages of Panax ginseng. Food Chem. 2007, 102, 664–668. [Google Scholar] [CrossRef]
  29. Lai, Y.H.; So, P.K.; Lo, S.C.; Ng, E.W.; Poon, T.C.; Yao, Z.P. Rapid differentiation of Panax ginseng and Panax quinquefolius by matrix-assisted laser desorption/ionization mass spectrometry. Anal. Chim. Acta 2012, 753, 73–81. [Google Scholar] [CrossRef] [PubMed]
Sample Availability: Samples of the compounds are not available from the authors.
Figure 1. Chemical structures of the 22 investigated saponins in P. quinquefolium cultivated in the Heilongjiang province.
Molecules 23 02396 g001
Figure 2. UPLC-MRM-MS TIC of reference standards (A) and the hairy root of American ginseng (B).
Molecules 23 02396 g002
Figure 3. (A) Total content of 22 investigated ginsenosides detected in different plant parts of P. quinquefolium; (B) Graphic representation of 22 investigated ginsenosides in different plant parts of P. quinquefolium.
Molecules 23 02396 g003
Figure 4. (A) HCA of different growth years of P quinquefolium; (B) PLS-DA score of different growth years of P. quinquefolium; (C) VIP plot of the 22 ginsenosides based on PLS-DA.
Molecules 23 02396 g004
Table 1. The optimized MRM parameters and transitions for each analyst in UPLC-ESI-MRM-MS.
Peaks 1AdductsParents (m/z)Daughters (m/z) (Q/I) 2DP (V)CE (eV)
1[M + HCOO]991.5783.2/621.2−110−60
2[M + HCOO]845.5637.2/475.2−120−50
3[M + HCOO]1007.5799.3/475.3−100−60
4[M + HCOO]799.2653.0/491.2−100−50
5[M + HCOO]1153.6945.4/783.2−100−75
6[M + HCOO]815.5637.2/475.2−120−40
7[M + HCOO]815.5637.2/475.2−120−40
8[M + HCOO]1123.6945.4/783.4−100−65
9[M + HCOO]829.5637.2/475.2−90−45
10[M + HCOO]683.4475.2/637.2−100−40
11[M + HCOO]1123.6945.4/783.4−110−60
12[M + HCOO]1123.6945.4/783.4−100−65
13[M − H]925.5763.2/613.1−120−65
14[M + HCOO]683.4475.2/637.1−100−40
15[M − H]793.4631.1/455.2−120−65
16[M + HCOO]991.5783.2/621.2−100−65
17[M + HCOO]961.5783.2/621.3−120−45
18[M + HCOO]961.5783.2/621.2−120−45
19[M + HCOO]811.5619.4/457.1−100−45
20[M + HCOO]829.5621.4/459.2−100−40
21[M + HCOO]829.5621.4/459.2−100−55
22[M + HCOO]667.4459.4/621.4−100−40
1: 1. G-Re; 2. G-Rg1; 3. Vina-G-R4; 4. Pseudo-G-F11; 5. G-Rb1; 6. G-F5; 7. G-F3; 8. G-Rc; 9. G-Rg2; 10. G-Rh1; 11. G-Rb2; 12. G-Rb3; 13. Pseudo-G-Rt1; 14. G-F1; 15. ChikusetsuIva; 16. G-Rd; 17. NG-Fe; 18. G-Rd2; 19. G-F4; 20. G-F2; 21. G-Rg3; 22. G-CK. G: Ginsenoside; NG: notoginsenoside. 2: Q: transitions for quantification; I: transitions for identification.
Table 2. Calibration curves and detection limit of 22 saponins in P. quinquefolium.
PeakstR1Regression EquationsR2Linear Ranges 2LOD 2LOQ 2
11.47y = 10,699x + 3370.999231–10001.953.91
21.57y = 76,280x + 8640.997634–10902.134.26
32.42y = 86,118x − 7160.995216–5257.8115.63
44.03y = 17,787x + 5690.996731–10001.913.90
54.79y = 6627.9x + 250.996863–20007.8115.63
65.11y = 86,679x − 15140.999115–4752.014.02
75.72y = 184,024x − 13210.99508–5151.012.01
85.98y = 26,538x + 1380.998214–4501.763.52
96.20y = 1,000,000x − 3160.99974–2251.953.91
107.19y = 39,302x − 790.995034–5504.298.59
117.56y = 4487.7x + 1380.9970138–220034.7868.75
128.10y = 7394.2x − 2210.995361–196015.3130.63
138.29y = 241,665x − 1830.99969–2751.953.91
149.86y = 171,530x + 430.99658–2500.981.95
1510.80y = 539,951x + 15150.99979–2750.521.07
1611.22y = 80,694x + 5670.997631–10001.953.91
1714.99y = 52,124x + 3360.999616–5001.953.91
1815.34y = 6715.3x + 5520.997963–202015.7831.56
1915.82y = 88,679x + 1370.998015–4751.863.71
2016.26y = 152,918x − 7810.999416–5001.933.96
2116.91y = 107,317x + 11720.99667–2480.971.93
2219.02y = 60,120x + 920.998915–4753.717.42
1, min; 2, ng/mL.

