Antimicrobial Photodynamic Inactivation Mediated by Rose Bengal and Erythrosine Is Effective in the Control of Food-Related Bacteria in Planktonic and Biofilm States

 ,
,  , , , and
Abstract
:
1. Introduction
2. Results
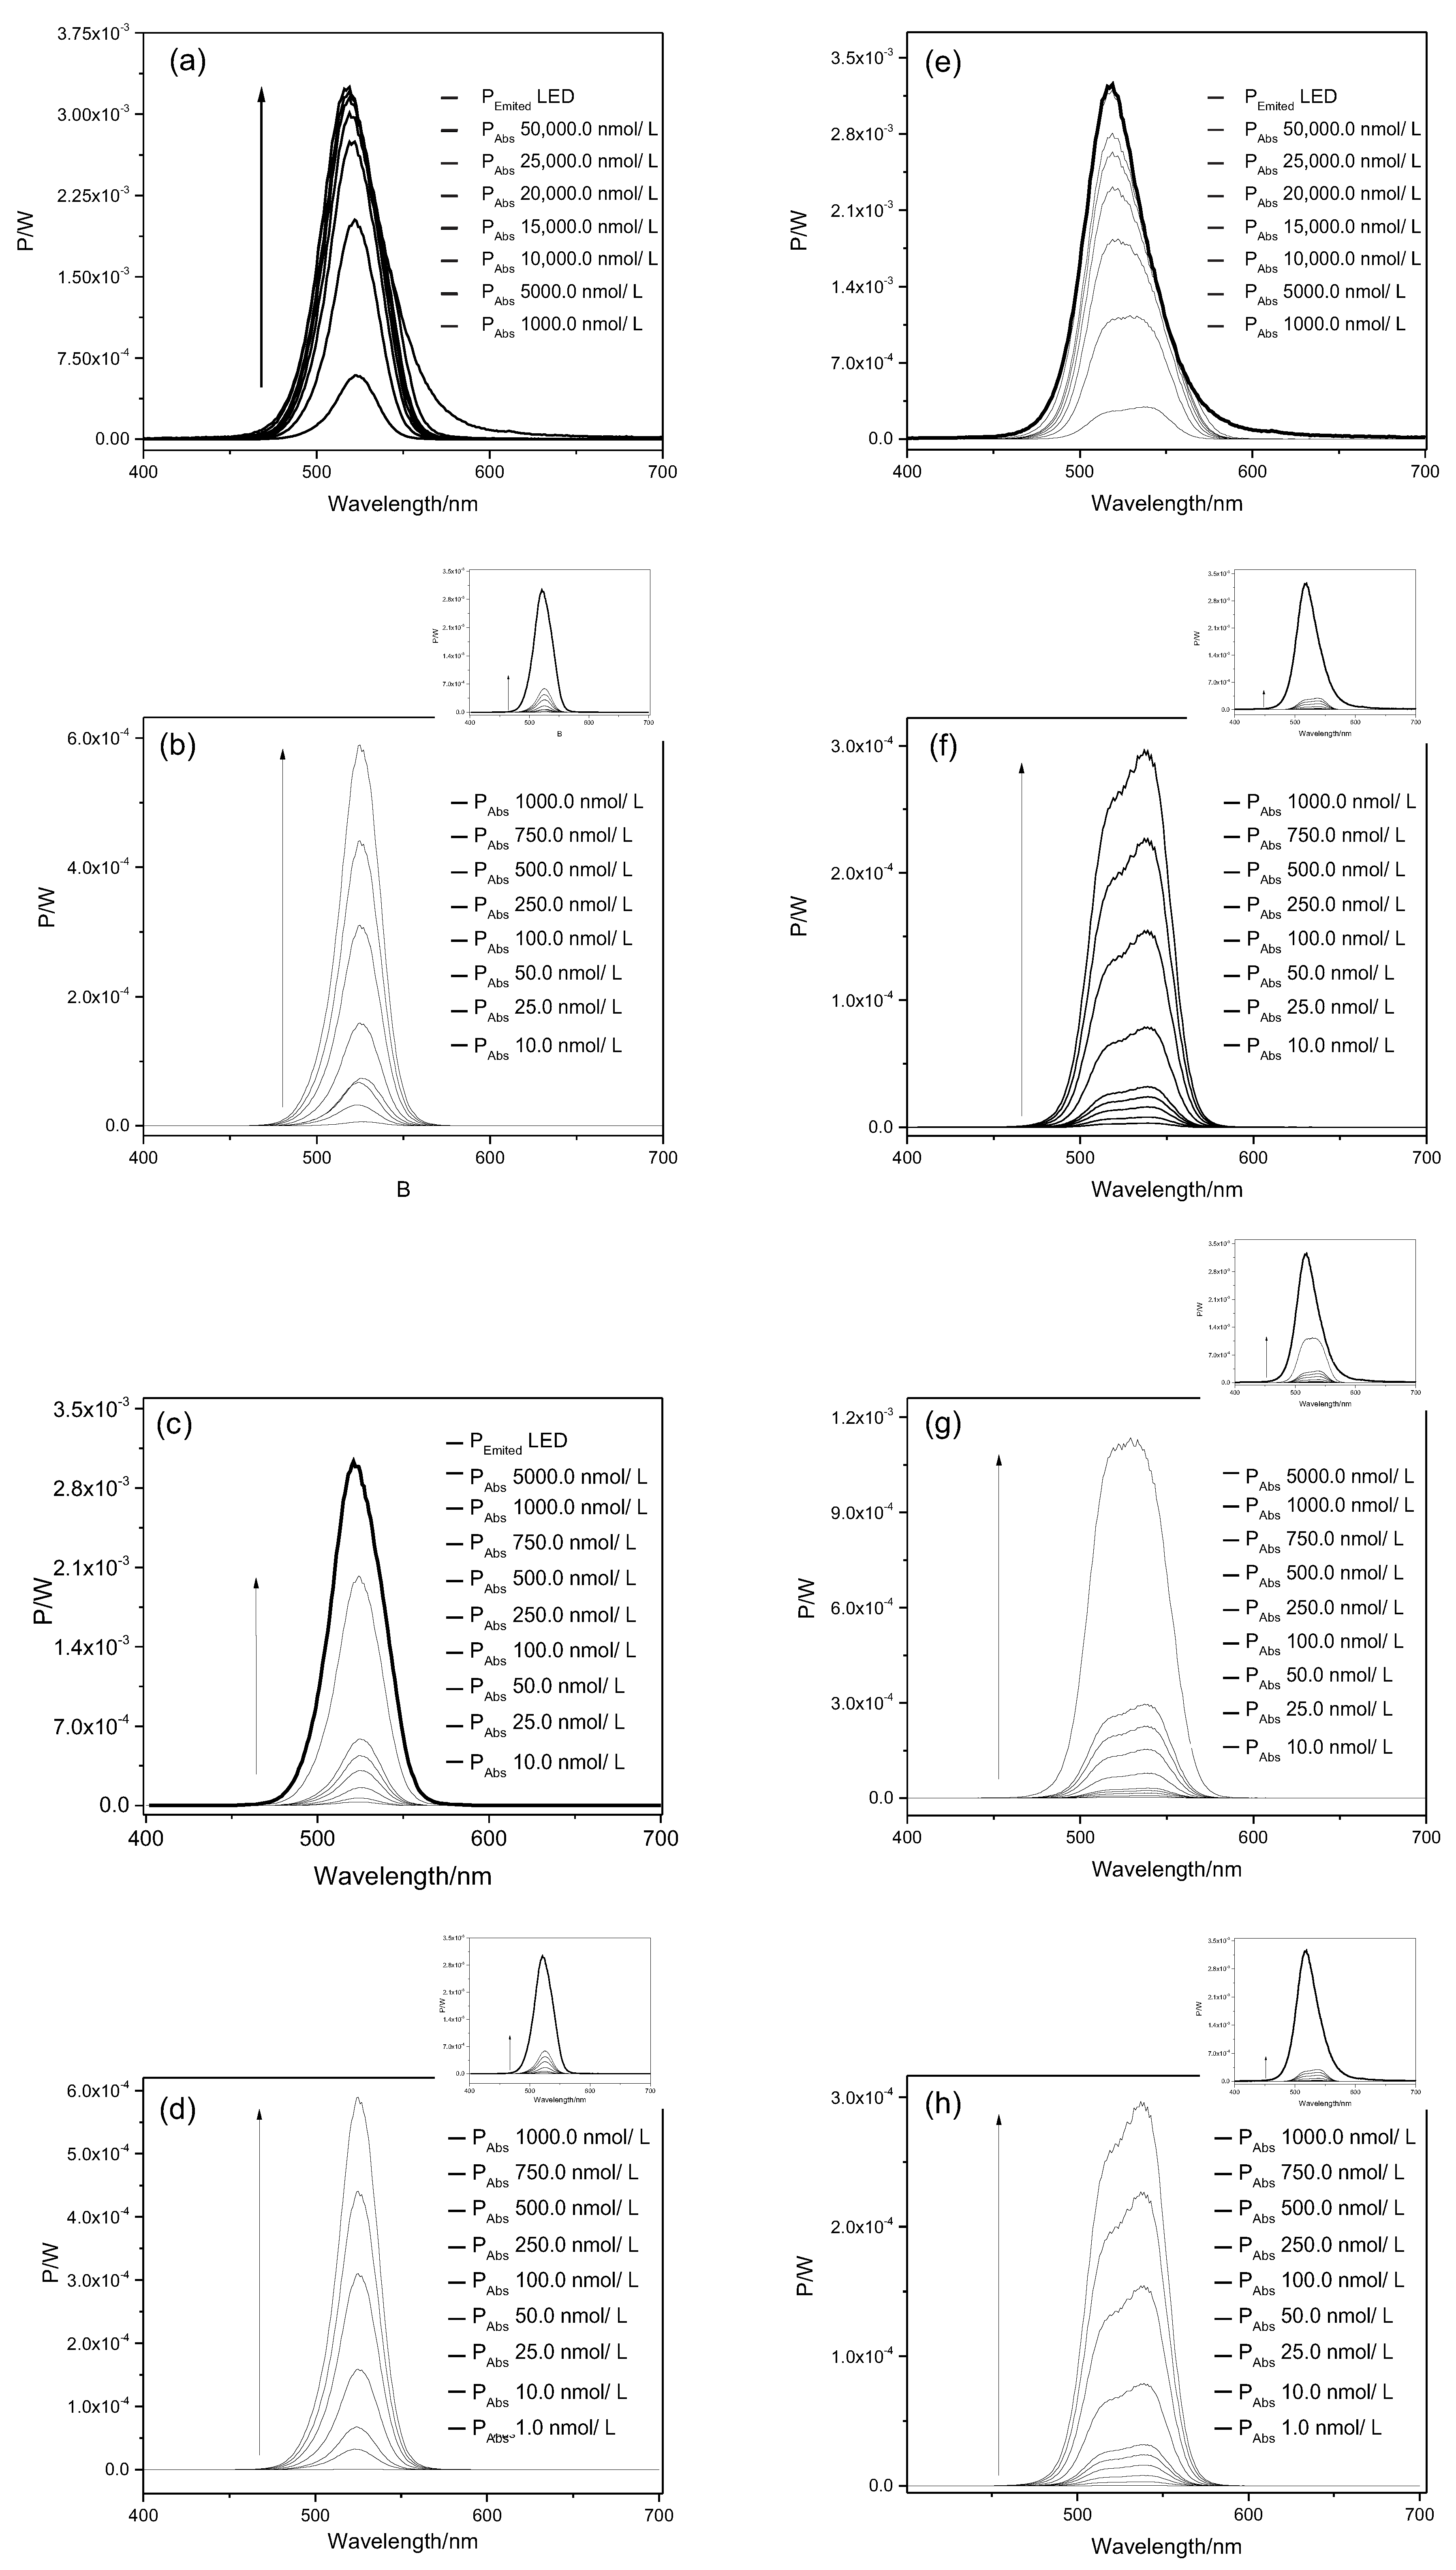
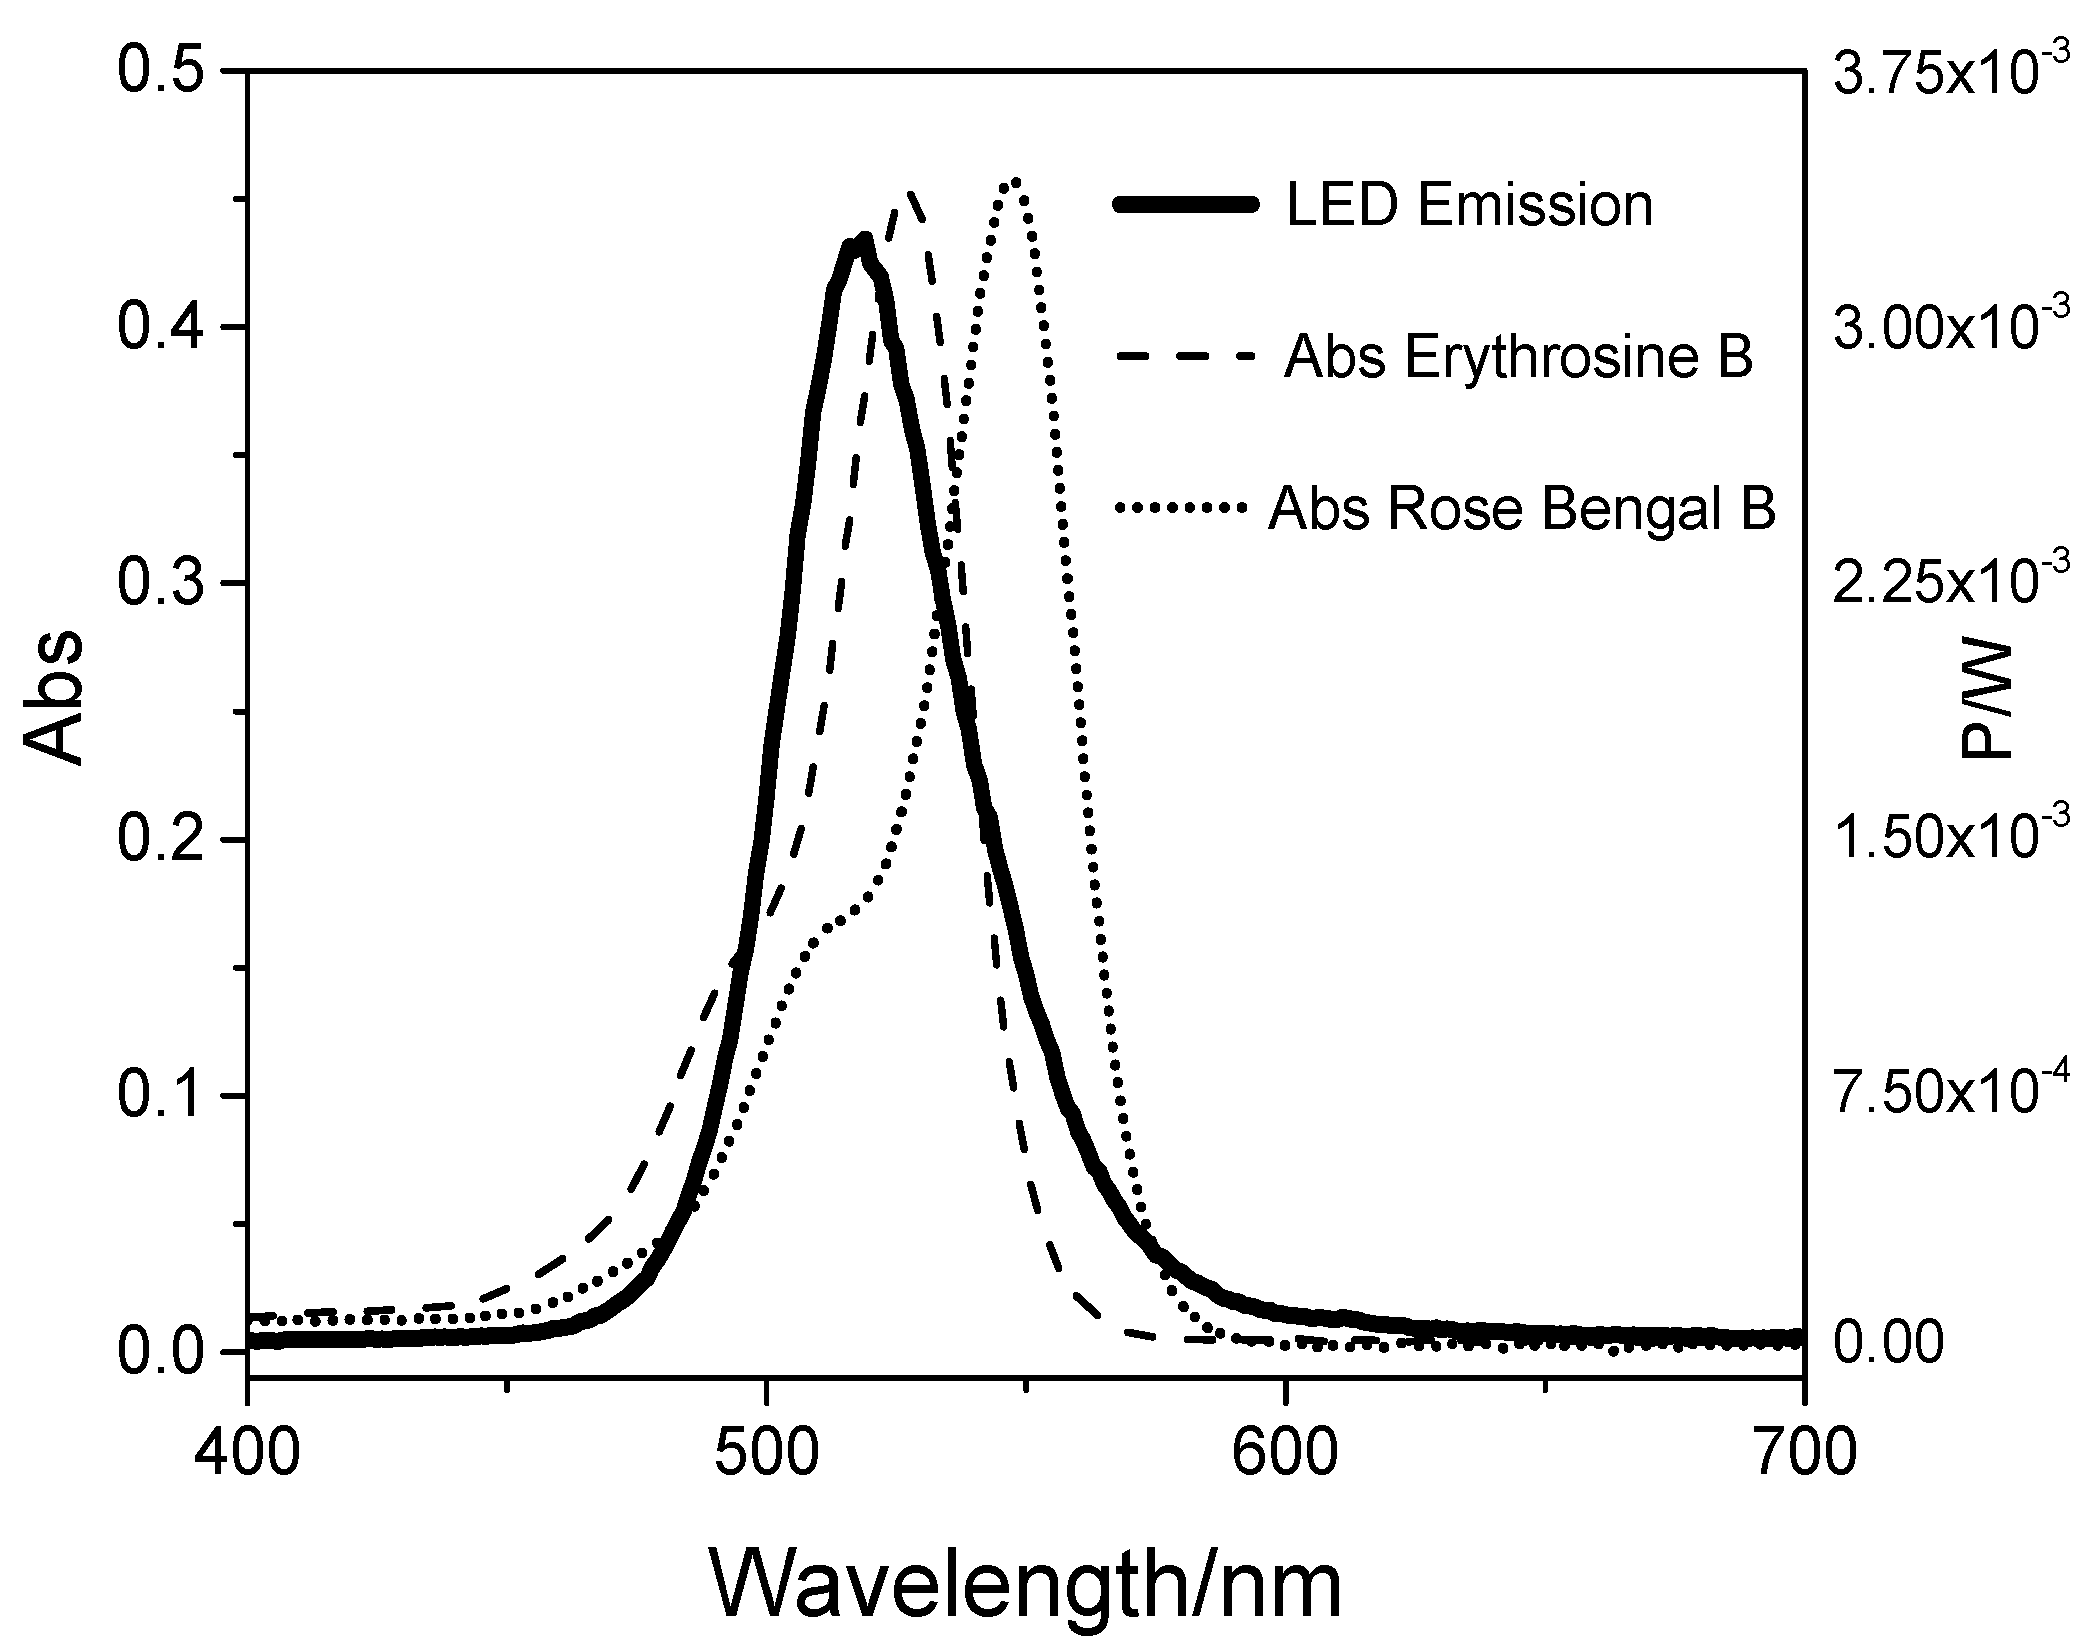
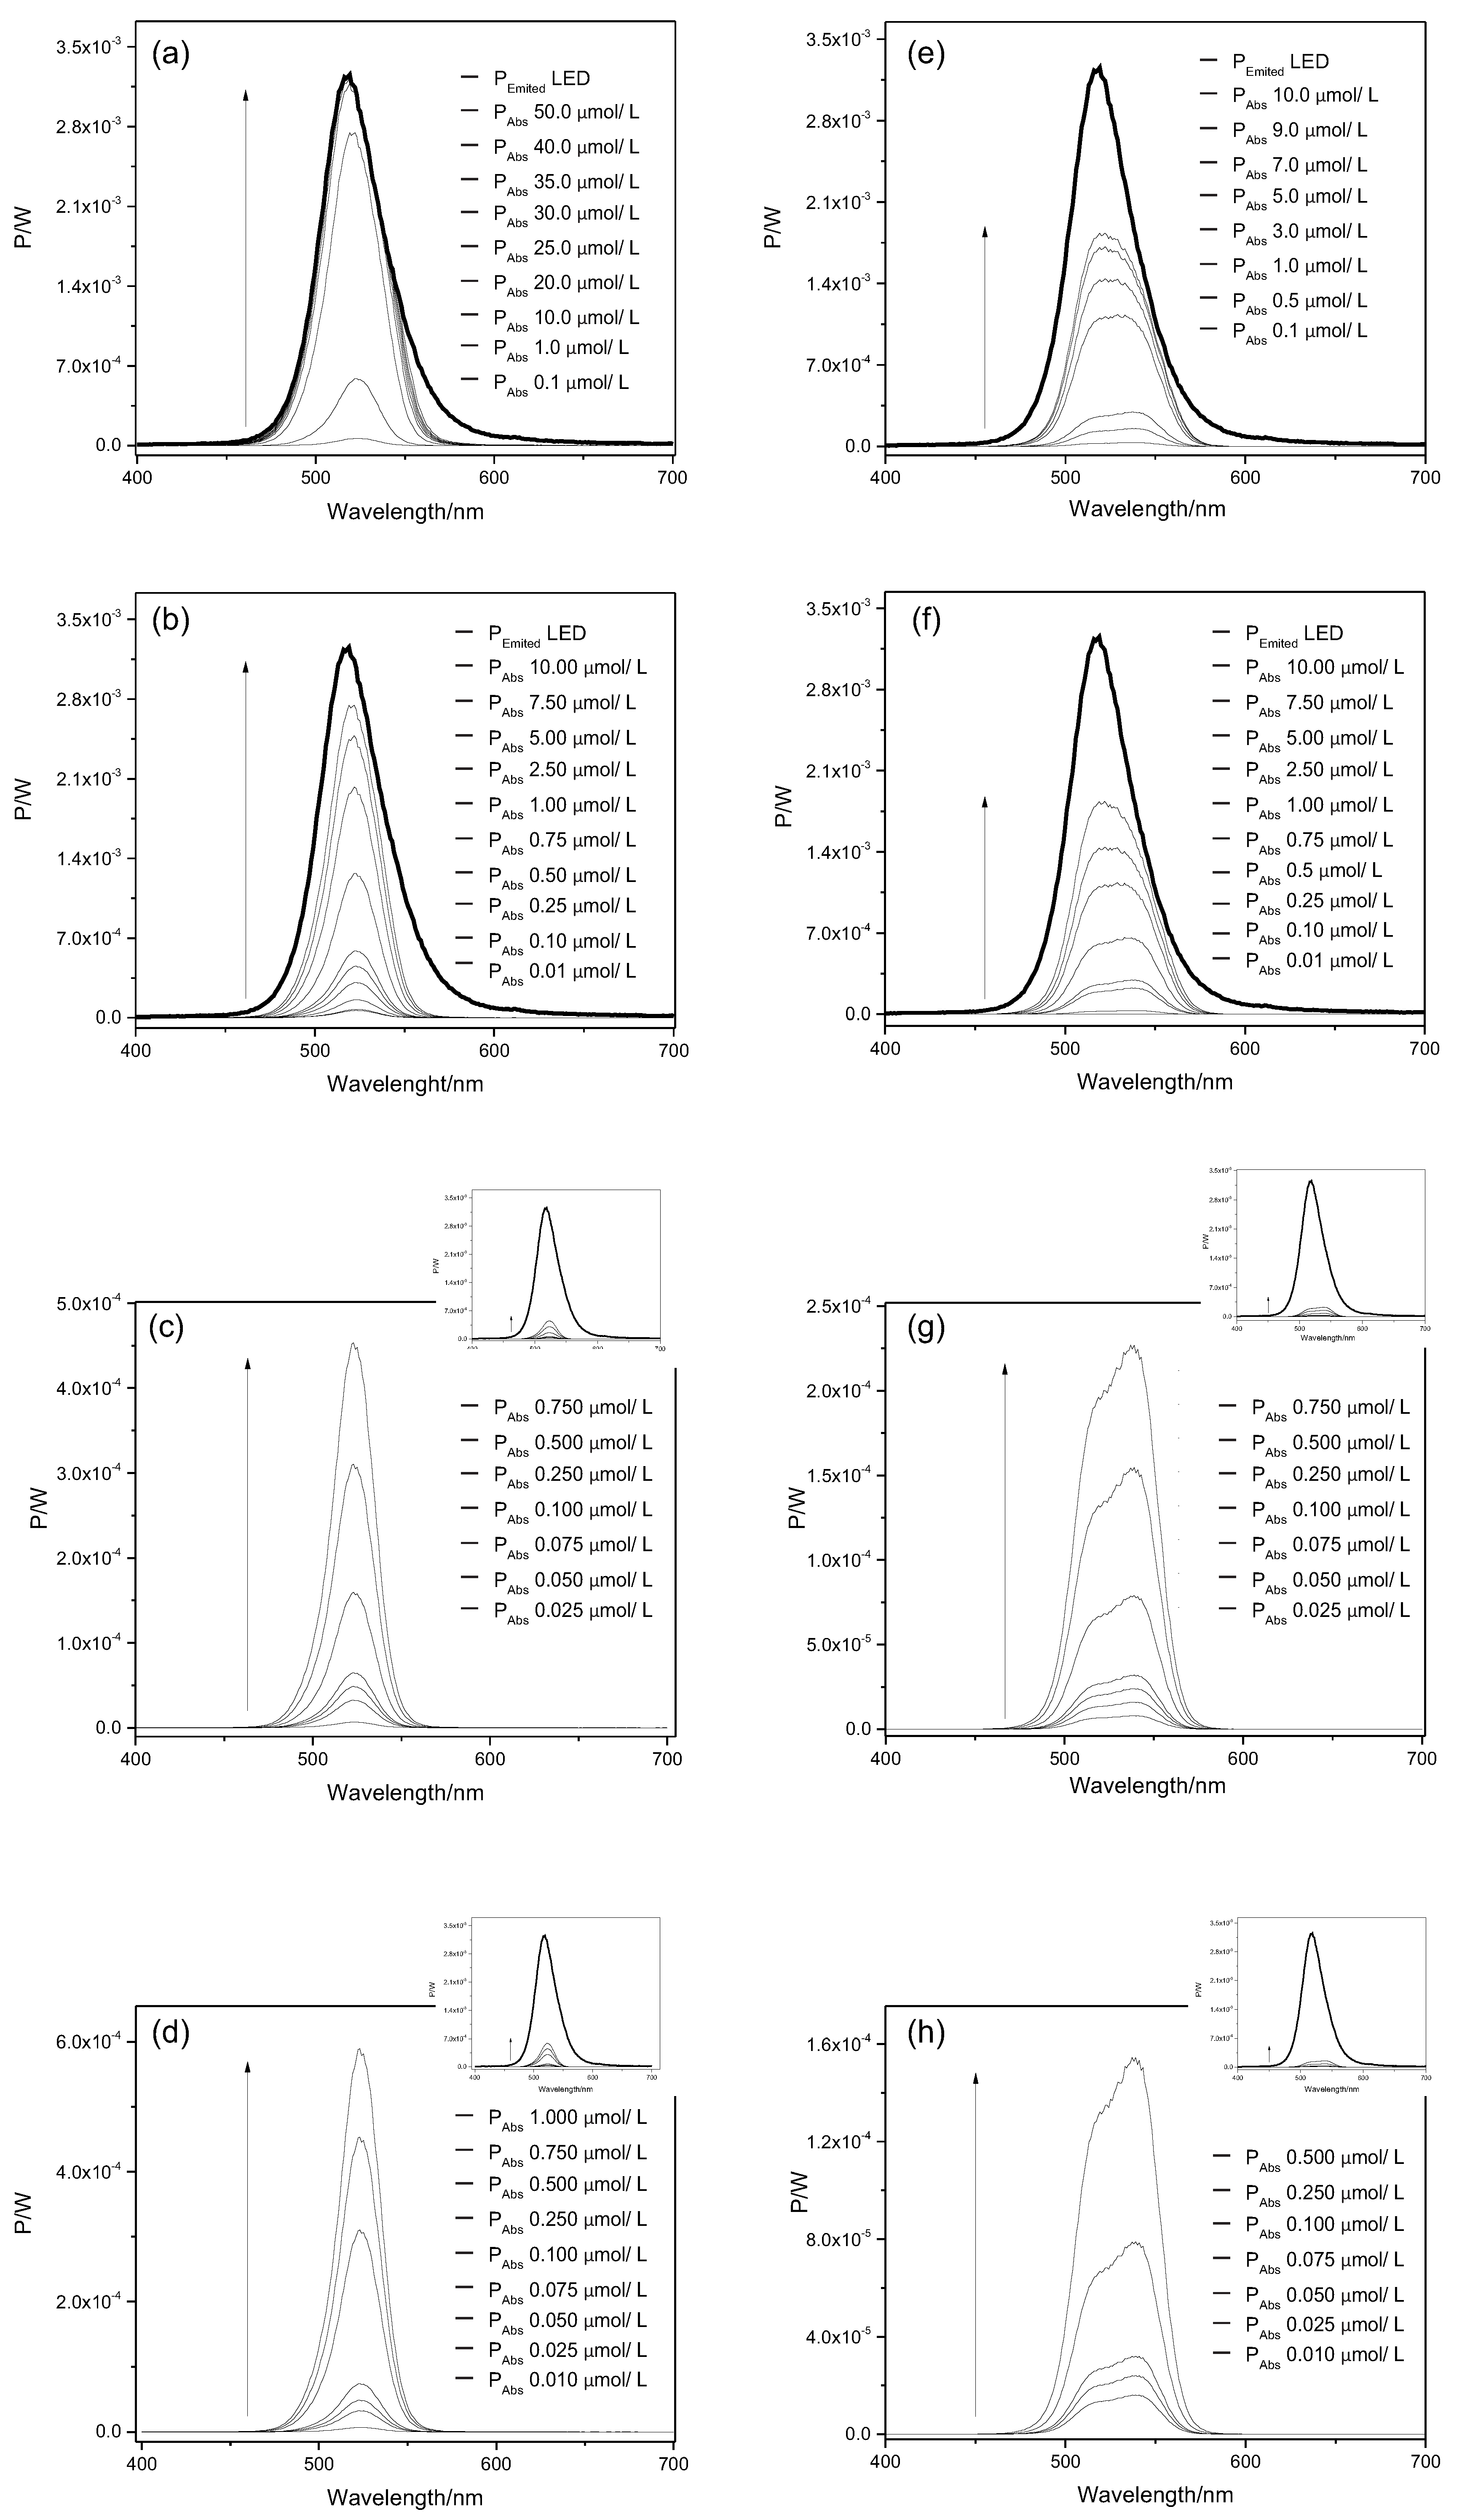
2.1. Light Doses
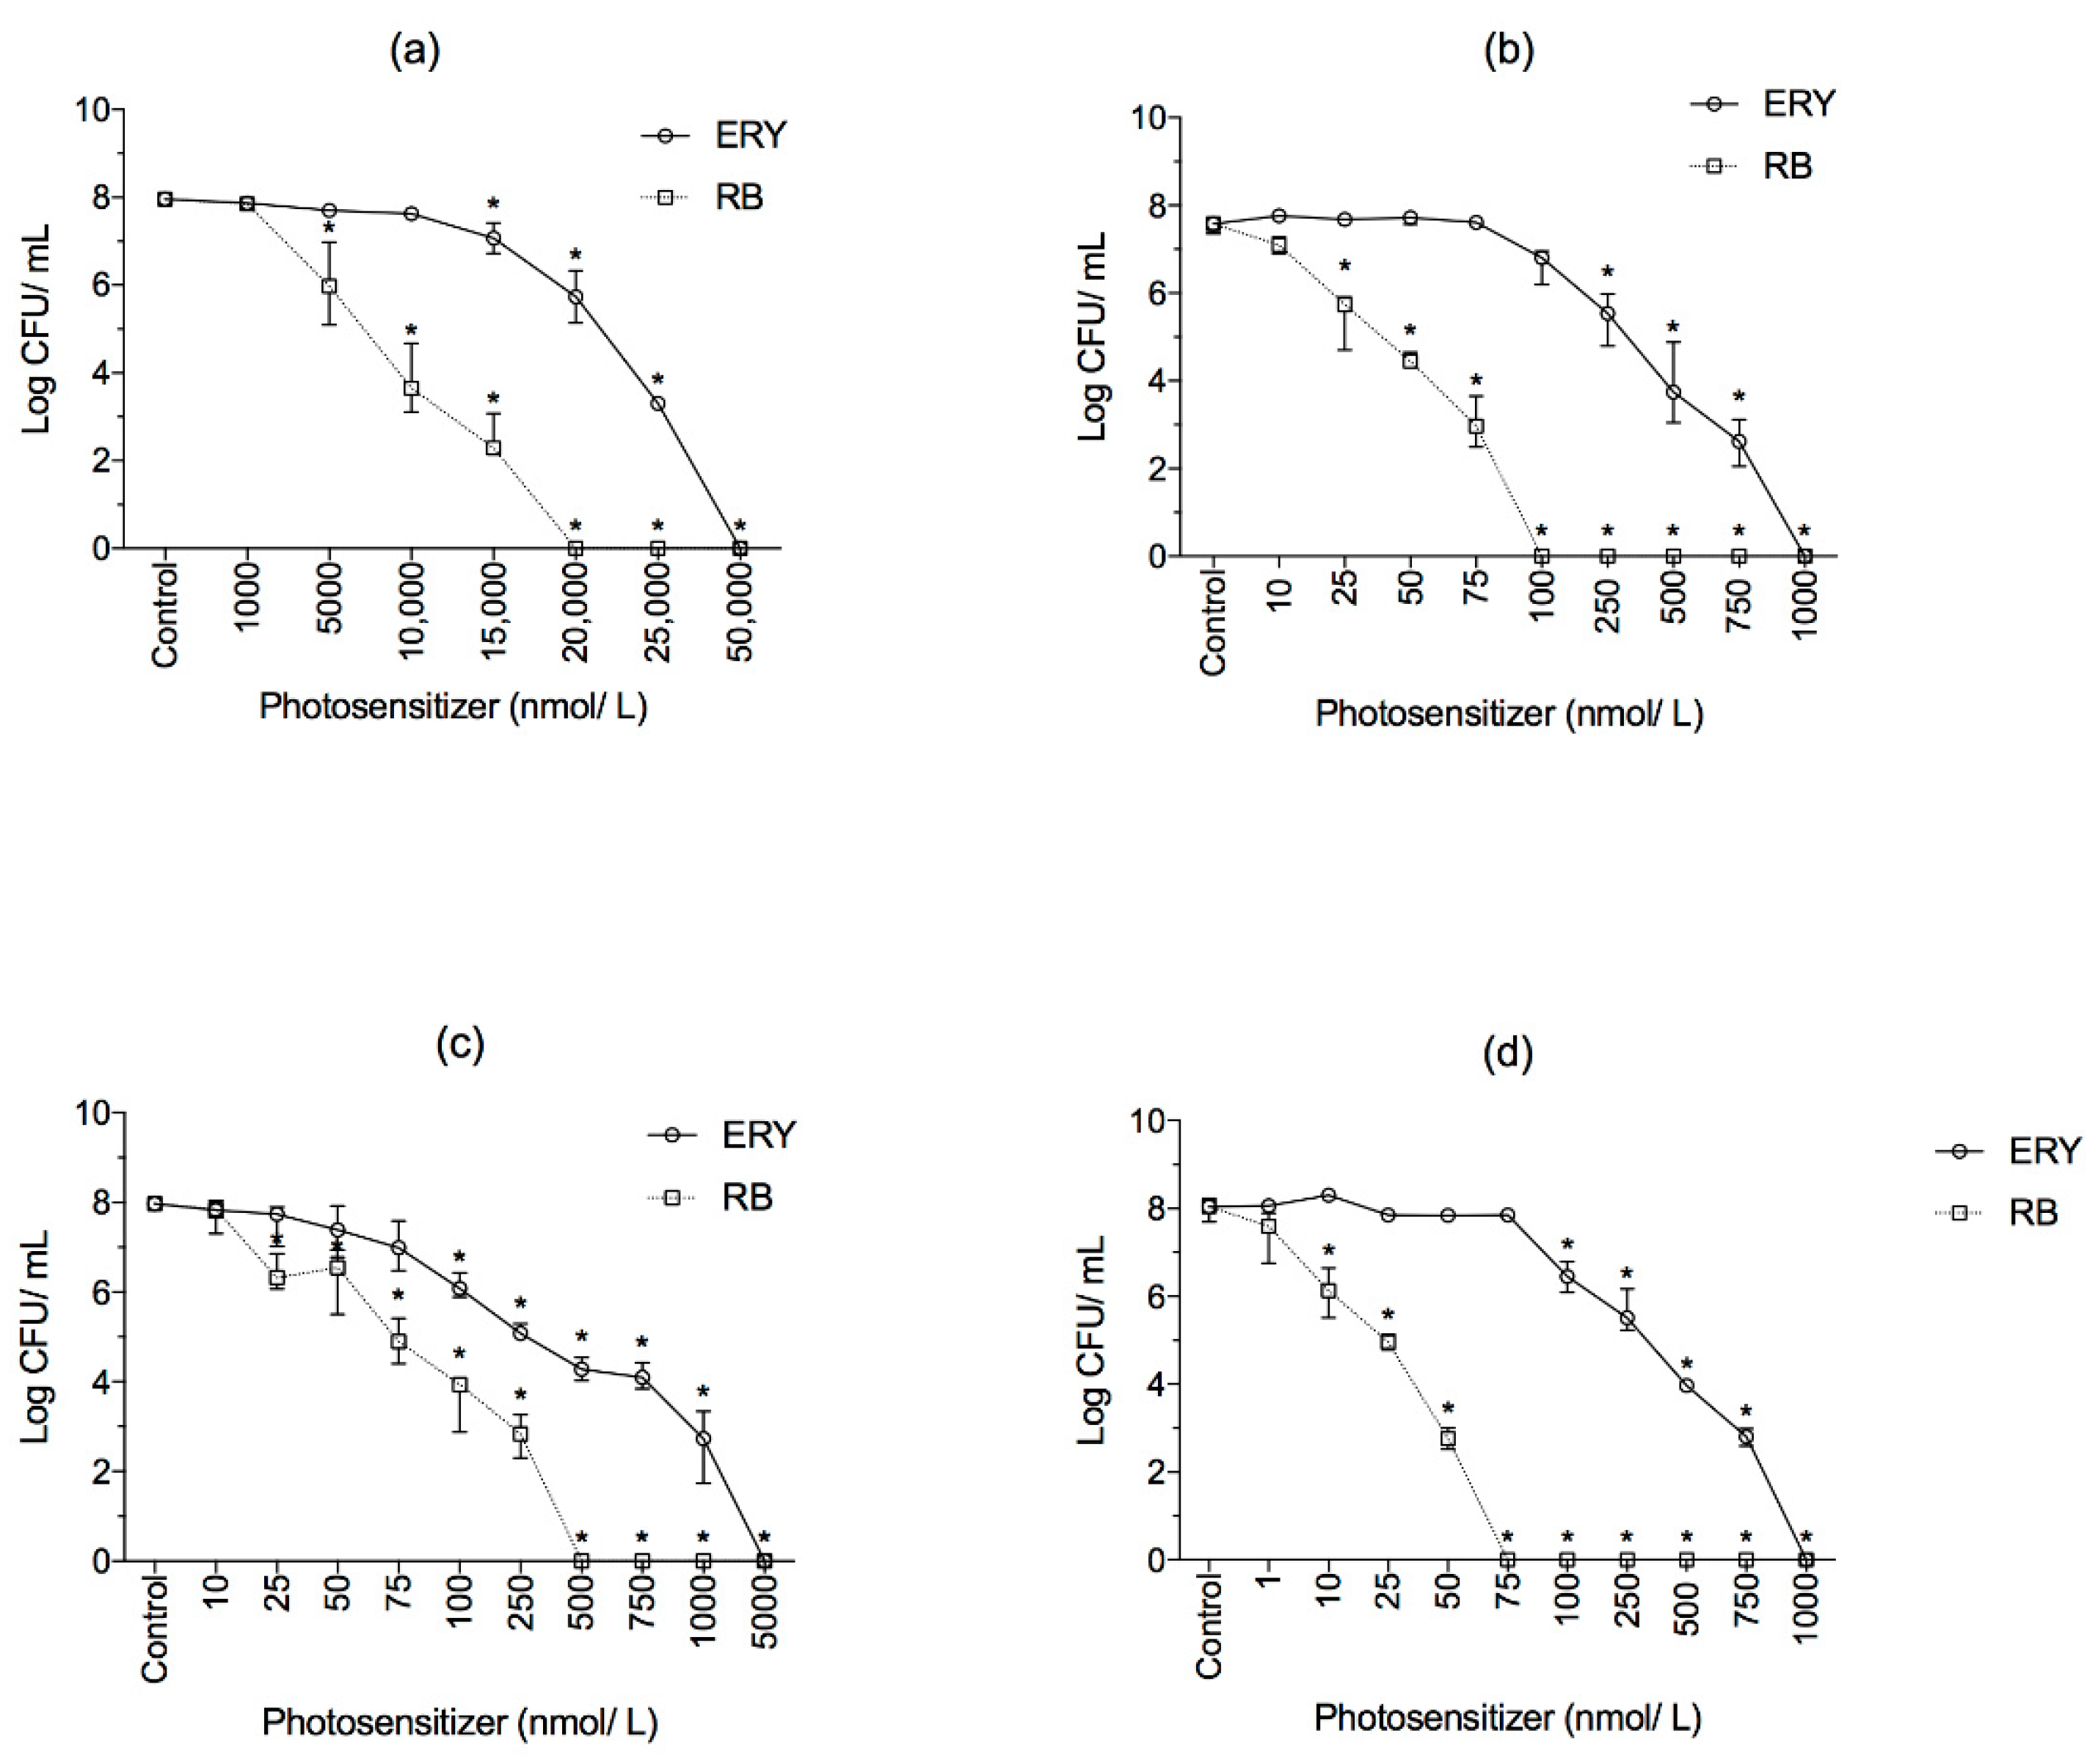
2.2. Effect of RB and ERY Photosensitizers on Planktonic Cells
2.2.1. Physicochemical Characterization of the Bacterial Surfaces
2.2.2. Intracellular Potassium Leakage
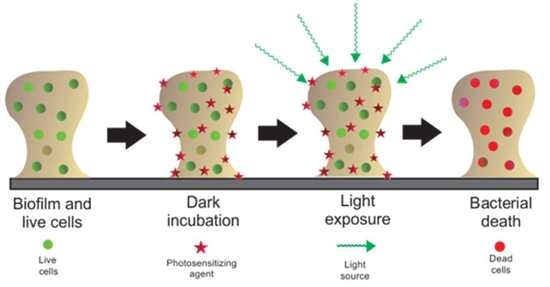
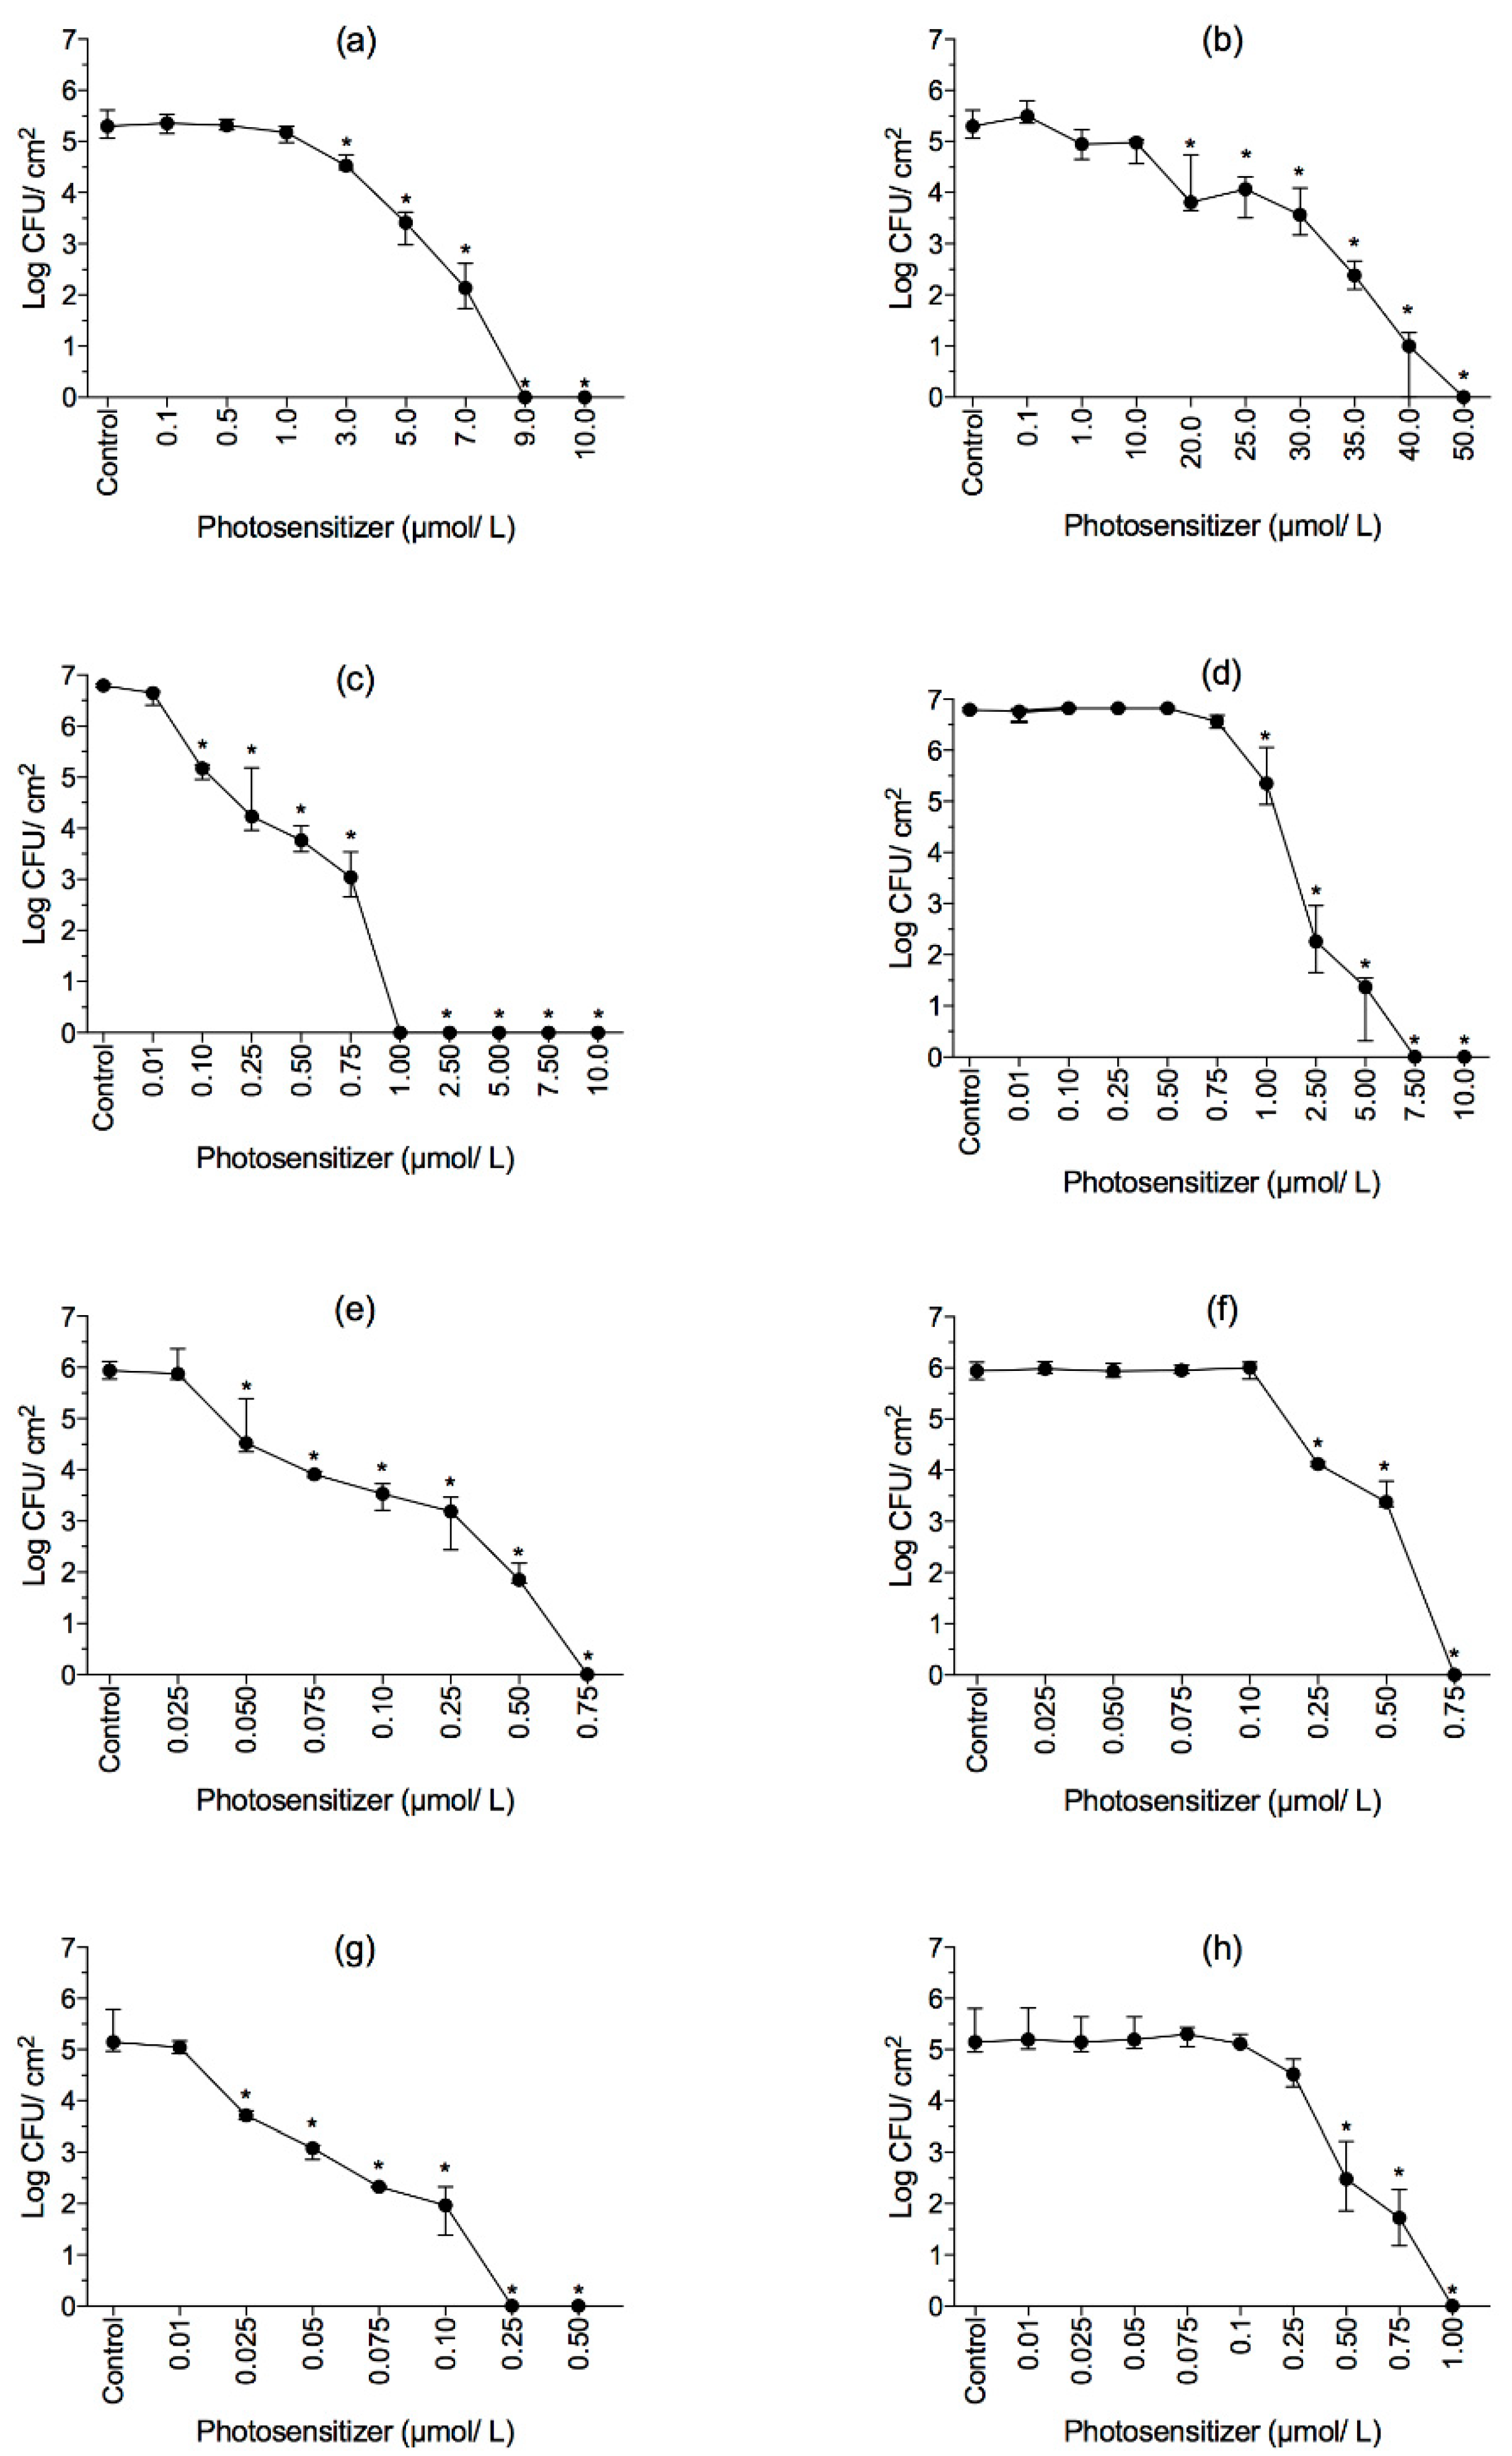
2.3. Effect of aPDI on Biofilms
2.4. Effect of aPDI on Membrane Integrity of Biofilms
3. Discussion
4. Materials and Methods
4.1. Bacterial Strains and Culture Conditions
4.2. Photosensitizers and Light Source
4.3. Photosensitization of Planktonic Cells
4.3.1. Sessile Drop Contact Angle Measurements
4.3.2. Potassium Leakeage Determination
4.4. Photosensitization of Biofilm Cells
4.4.1. Enumeration of Culturable Cells
4.4.2. Assessment of Membrane Integrity of Biofilm Cells
4.5. Statistics
5. Conclusions
Supplementary Materials
Author Contributions
Funding
Conflicts of Interest
References
- European Food Safety Authority Food-Borne Zoonotic Diseases | European Food Safety Authority. Available online: https://www.efsa.europa.eu/en/topics/topic/food-borne-zoonotic-diseases (accessed on 26 May 2018).
- WHO Food Safety. Available online: http://www.who.int/en/news-room/fact-sheets/detail/food-safety (accessed on 29 May 2018).
- FDA Foodborne Illnesses: What You Need to Know. Available online: https://www.fda.gov/Food/FoodborneIllnessContaminants/FoodborneIllnessesNeedToKnow/default.htm (accessed on 29 May 2018).
- Bridier, A.; Sanchez-Vizuete, P.; Guilbaud, M.; Piard, J.C.; Naitali, M.; Briandet, R. Biofilm-associated persistence of food-borne pathogens. Food Microbiol. 2015, 45, 167–178. [Google Scholar] [CrossRef] [PubMed]
- Van Houdt, R.; Michiels, C.W. Biofilm formation and the food industry, a focus on the bacterial outer surface. J. Appl. Microbiol. 2010, 109, 1117–1131. [Google Scholar] [CrossRef] [PubMed] [Green Version]
- Simões, M.; Simões, L.C.; Vieira, M.J. A review of current and emergent biofilm control strategies. LWT Food Sci. Technol. 2010, 43, 573–583. [Google Scholar] [CrossRef] [Green Version]
- Wang, H.; Cai, L.; Li, Y.; Xu, X.; Zhou, G. Biofilm formation by meat-borne Pseudomonas fluorescens on stainless steel and its resistance to disinfectants. Food Control 2018, 91, 397–403. [Google Scholar] [CrossRef]
- Charlebois, A.; Jacques, M.; Boulianne, M.; Archambault, M. Tolerance of Clostridium perfringens biofilms to disinfectants commonly used in the food industry. Food Microbiol. 2017, 62, 32–38. [Google Scholar] [CrossRef] [PubMed]
- Pereira, R.N.; Vicente, A.A. Environmental impact of novel thermal and non-thermal technologies in food processing. Food Res. Int. 2010, 43, 1936–1943. [Google Scholar] [CrossRef] [Green Version]
- Li, X.; Farid, M. A review on recent development in non-conventional food sterilization technologies. J. Food Eng. 2016, 182, 33–45. [Google Scholar] [CrossRef]
- Meireles, A.; Giaouris, E.; Simões, M. Alternative disinfection methods to chlorine for use in the fresh-cut industry. Food Res. Int. 2016, 82, 71–85. [Google Scholar] [CrossRef] [Green Version]
- Bonin, E.; dos Santos, A.R.; Fiori da Silva, A.; Ribeiro, L.H.; Favero, M.E.; Campanerut-Sá, P.A.Z.; de Freitas, C.F.; Caetano, W.; Hioka, N.; Mikcha, J.M.G. Photodynamic inactivation of foodborne bacteria by eosin Y. J. Appl. Microbiol. 2018, 1–12. [Google Scholar] [CrossRef] [PubMed]
- Miñán, A.; Lorente, C.; Ipiña, A.; Thomas, A.H.; Fernández Lorenzo de Mele, M.; Schilardi, P.L. Photodynamic inactivation induced by carboxypterin: A novel non-toxic bactericidal strategy against planktonic cells and biofilms of Staphylococcus aureus. Biofouling 2015, 31, 459–468. [Google Scholar] [CrossRef] [PubMed]
- Castro, K.A.D.F.; Moura, N.M.M.; Fernandes, A.; Faustino, M.A.F.; Simões, M.M.Q.; Cavaleiro, J.A.S.; Nakagaki, S.; Almeida, A.; Cunha, Â.; Silvestre, A.J.D.; et al. Control of Listeria innocua biofilms by biocompatible photodynamic antifouling chitosan based materials. Dye Pigments 2017, 137, 265–276. [Google Scholar] [CrossRef]
- Penha, C.B.; Bonin, E.; da Silva, A.F.; Hioka, N.; Zanqueta, É.B.; Nakamura, T.U.; de Abreu Filho, B.A.; Campanerut-Sá, P.A.Z.; Mikcha, J.M.G. Photodynamic inactivation of foodborne and food spoilage bacteria by curcumin. LWT Food Sci. Technol. 2016, 1–5. [Google Scholar] [CrossRef]
- Wainwright, M.; Maisch, T.; Nonell, S.; Plaetzer, K.; Almeida, A.; Tegos, G.P.; Hamblin, M.R. Photoantimicrobial—Are we afraid of the light? Lancet Infect. Dis. 2017, 17, 49–55. [Google Scholar] [CrossRef]
- Luksiene, Z.; Brovko, L. Antibacterial photosensitization-based treatment for food safety. Food Eng. Rev. 2013, 5, 185–199. [Google Scholar] [CrossRef]
- Abrahamse, H.; Hamblin, M.R. New photosensitizers for photodynamic therapy. Biochem. J. 2016, 28, 1304–1314. [Google Scholar] [CrossRef] [PubMed]
- Gerola, A.P.; Semensato, J.; Pellosi, D.S.; Batistela, V.R.; Rabello, B.R.; Hioka, N.; Caetano, W. Chemical determination of singlet oxygen from photosensitizers illuminated with LED: New calculation methodology considering the influence of photobleaching. J. Photochem. Photobiol. A Chem. 2012, 232, 14–21. [Google Scholar] [CrossRef]
- Cieplik, F.; Pummer, A.; Regensburger, J.; Hiller, K.A.; Späth, A.; Tabenski, L.; Buchalla, W.; Maisch, T. The impact of absorbed photons on antimicrobial photodynamic efficacy. Front. Microbiol. 2015, 6. [Google Scholar] [CrossRef] [PubMed] [Green Version]
- Ormond, A.B.; Freeman, H.S. Dye sensitizers for photodynamic therapy. Materials 2013, 6, 817–840. [Google Scholar] [CrossRef] [PubMed]
- Yassunaka, N.N.; de Freitas, C.F.; Rabello, B.R.; Santos, P.R.; Caetano, W.; Hioka, N.; Nakamura, T.U.; de Abreu Filho, B.A.; Mikcha, J.M.G. Photodynamic inactivation mediated by erythrosine and its derivatives on foodborne pathogens and spoilage bacteria. Curr. Microbiol. 2015, 71, 243–251. [Google Scholar] [CrossRef] [PubMed]
- Silva, J.R.; Cardoso, G.; Maciel, R.R.G.; de Souza, N.C. Morphological alterations on Citrobacter freundii bacteria induced by erythrosine dye and laser light. Lasers Med. Sci. 2013, 30, 469–473. [Google Scholar] [CrossRef] [PubMed]
- Leite, H.L.A.; Cavalcante, S.I.A.; de Sousa, E.M.; Gonçalves, L.M.; Paschoal, M.A. Streptococcus mutans photoinactivation using a combination of a high potency photopolymerizer and rose bengal. Photodiagnosis Photodyn. Ther. 2016, 15, 11–12. [Google Scholar] [CrossRef] [PubMed]
- Pérez-Laguna, V.; Pérez-Artiaga, L.; Lampaya-Pérez, V.; López, S.C.; García-Luque, I.; Revillo, M.J.; Nonell, S.; Gilaberte, Y.; Rezusta, A. Comparative effect of photodynamic therapy on separated or mixed cultures of Streptococcus mutans and Streptococcus sanguinis. Photodiagnosis Photodyn. Ther. 2017, 19, 98–102. [Google Scholar] [CrossRef] [PubMed]
- Kato, H.; Komagoe, K.; Nakanishi, Y.; Inoue, T.; Katsu, T. Xanthene Dyes Induce Membrane Permeabilization of Bacteria and Erythrocytes by Photoinactivation. Photochem. Photobiol. 2012, 423–431. [Google Scholar] [CrossRef] [PubMed]
- Ergaieg, K.; Seux, R. A comparative study of the photoinactivation of bacteria by meso-substituted cationic porphyrin, rose Bengal and methylene blue. Desalination 2009, 246, 353–362. [Google Scholar] [CrossRef]
- Zhang, Q.Z.; Zhao, K.Q.; Wu, Y.; Li, X.H.; Yang, C.; Guo, L.M.; Liu, C.H.; Qu, D.; Zheng, C.Q. 5-aminolevulinic acid-mediated photodynamic therapy and its straindependent combined effect with antibiotics on Staphylococcus aureus biofilm. PLoS ONE 2017, 12, e174627. [Google Scholar] [CrossRef]
- Usacheva, M.N.; Teichert, M.C.; Biel, M.A. Comparison of the Methylene Blue and Toluidine Blue Photobactericidal Eficacy against Gram-Positive and Gram-Negative Microorganisms. Lasers Surg. Med. 2001, 173, 165–173. [Google Scholar] [CrossRef] [PubMed]
- Awad, M.M.; Tovmasyan, A.; Craik, J.D.; Batinic-Haberle, I.; Benov, L.T. Important cellular targets for antimicrobial photodynamic therapy. Appl. Microbiol. Biotechnol. 2016, 100, 7679–7688. [Google Scholar] [CrossRef] [PubMed]
- Sharma, S.K.; Chiang, L.Y.; Hamblin, M.R. Photodynamic therapy with fullerenes in vivo: reality or a dream? Nanomedicine 2011, 6, 1813–1825. [Google Scholar] [CrossRef] [PubMed]
- Van Oss, C.J. Hydrophobicity of biosurfaces—Origin, quantitative determination and interaction energies. Colloids Surf. B 1995, 5, 91–110. [Google Scholar] [CrossRef]
- Borges, A.; Abreu, A.C.; Ferreira, C.; Saavedra, M.J.; Simões, L.C.; Simões, M. Antibacterial activity and mode of action of selected glucosinolate hydrolysis products against bacterial pathogens. J. Food Sci. Technol. 2015, 52, 4737–4748. [Google Scholar] [CrossRef] [PubMed] [Green Version]
- Le Guern, F.; Sol, V.; Ouk, C.; Arnoux, P.; Frochot, C.; Ouk, T.S. Enhanced Photobactericidal and Targeting Properties of a Cationic Porphyrin following the Attachment of Polymyxin B. Bioconjug. Chem. 2017, 28, 2493–2506. [Google Scholar] [CrossRef] [PubMed] [Green Version]
- Ragàs, X.; Agut, M.; Nonell, S. Singlet oxygen in Escherichia coli: New insights for antimicrobial photodynamic therapy. Free Radic. Biol. Med. 2010, 49, 770–776. [Google Scholar] [CrossRef] [PubMed]
- De Freitas, L.M.; Lorenzón, E.N.; Santos-Filho, N.A.; Zago, L.H.D.P.; Uliana, M.P.; De Oliveira, K.T.; Cilli, E.M.; Fontana, C.R. Antimicrobial Photodynamic therapy enhanced by the peptide aurein. Sci. Rep. 2018, 8, 1–15. [Google Scholar] [CrossRef] [PubMed]
- Liu, Y.; Ho, K.K.; Su, J.; Gong, H.; Chang, A.C.; Lu, S. Potassium transport of Salmonella is important for type III secretion and pathogenesis. Microbiology 2013, 159, 1705–1719. [Google Scholar] [CrossRef] [PubMed]
- Lambert, P.A.; Hammond, S.M. Potassium fluxes, first indications of membrane damage in micro-organisms. Biochem. Biophys. Res. Commun. 1973, 54, 796–799. [Google Scholar] [CrossRef]
- Omarova, E.O.; Nazarov, P.A.; Firsov, A.M.; Strakhovskaya, M.G.; Arkhipova, A.Y.; Moisenovich, M.M.; Agapov, I.I.; Ol’Shevskaya, V.A.; Zaitsev, A.V.; Kalinin, V.N.; et al. Carboranyl-chlorin e6 as a potent antimicrobial photosensitizer. PLoS ONE 2015, 10, e0141990. [Google Scholar] [CrossRef] [PubMed]
- Tanaka, M.; Kinoshita, M.; Yoshihara, Y.; Shinomiya, N.; Seki, S.; Nemoto, K.; Hirayama, T.; Dai, T.; Huang, L.; Hamblin, M.R.; et al. Optimal Photosensitizers for Photodynamic Therapy of Infections Should Kill Bacteria but Spare Neutrophils. Photochem. Photobiol. 2012, 88, 227–232. [Google Scholar] [CrossRef] [PubMed]
- Hamamoto, H.; Urai, M.; Ishii, K.; Yasukawa, J.; Paudel, A.; Murai, M.; Kaji, T.; Kuranaga, T.; Hamase, K.; Katsu, T.; et al. Lysocin e is a new antibiotic that targets menaquinone in the bacterial membrane. Nat. Chem. Biol. 2015, 11, 127–133. [Google Scholar] [CrossRef] [PubMed]
- Malanovic, N.; Lohner, K. Antimicrobial peptides targeting Gram-positive bacteria. Pharmaceuticals 2016, 9. [Google Scholar] [CrossRef] [PubMed]
- Ronqui, M.R.; De Aguiar Coletti, T.M.S.F.; De Freitas, L.M.; Miranda, E.T.; Fontana, C.R. Synergistic antimicrobial effect of photodynamic therapy and ciprofloxacin. J. Photochem. Photobiol. B Biol. 2016, 158, 122–129. [Google Scholar] [CrossRef] [PubMed]
- Vilela, S.F.G.; Junqueira, J.C.; Barbosa, J.O.; Majewski, M.; Munin, E.; Jorge, A.O.C. Photodynamic inactivation of Staphylococcus aureus and Escherichia coli biofilms by malachite green and phenothiazine dyes: An in vitro study. Arch. Oral Biol. 2012, 57, 704–710. [Google Scholar] [CrossRef] [PubMed]
- Cossu, A.; Ercan, D.; Wang, Q.; Peer, W.A.; Nitin, N.; Tikekar, R.V. Antimicrobial effect of synergistic interaction between UV-A light and gallic acid against Escherichia coli O157:H7 in fresh produce wash water and biofilm. Innov. Food Sci. Emerg. Technol. 2016, 37, 44–52. [Google Scholar] [CrossRef]
- Wood, S.; Metcalf, D.; Devine, D.; Robinson, C.; Pellosi, D.S.; Batistela, V.R.; De Souza, V.R.; Scarminio, I.S.; Caetano, W.; Hioka, N. Erythrosine is a potential photosensitizer for the photodynamic therapy of oral plaque biofilms. J. Antimicrob. Chemother. 2006, 85, 680–684. [Google Scholar] [CrossRef] [PubMed]
- Di Poto, A.; Sbarra, M.S.; Provenza, G.; Visai, L.; Speziale, P. The effect of photodynamic treatment combined with antibiotic action or host defence mechanisms on Staphylococcus aureus biofilms. Biomaterials 2009, 30, 3158–3166. [Google Scholar] [CrossRef] [PubMed]
- Luksiene, Z.; Paskeviciute, E. Microbial control of food-related surfaces: Na-Chlorophyllin-based photosensitization. J. Photochem. Photobiol. B Biol. 2011, 105, 69–74. [Google Scholar] [CrossRef] [PubMed]
- Bonifácio, D.; Martins, C.; David, B.; Lemos, C.; Neves, M.G.P.M.; Almeida, A.; Pinto, D.C.G.; Faustino, M.A.; Cunha, Â. Photodynamic inactivation of Listeria innocua biofilms with food-grade photosensitizers: A curcumin-rich extract of Curcuma longa versus commercial curcumin. J. Appl. Microbiol. 2018. [Google Scholar] [CrossRef] [PubMed]
- Shrestha, A.; Hamblin, M.R.; Kishen, A. Characterization of a conjugate between rose bengal and chitosan for targeted antibiofilm and tissue stabilization effects as a potential treatment of infected dentin. Antimicrob. Agents Chemother. 2012, 56, 4876–4884. [Google Scholar] [CrossRef] [PubMed]
- Kishen, A.; Upadya, M.; Tegos, G.P.; Hamblin, M.R. Efflux pump inhibitor potentiates antimicrobial photodynamic inactivation of Enterococcus faecalis biofilm. Photochem. Photobiol. 2010, 86, 1343–1349. [Google Scholar] [CrossRef] [PubMed]
- Cieplik, F.; Steinwachs, V.-S.; Muehler, D.; Hiller, K.-A.; Thurnheer, T.; Belibasakis, G.N.; Buchalla, W.; Maisch, T. Phenalen-1-one-Mediated Antimicrobial Photodynamic Therapy: Antimicrobial Efficacy in a Periodontal Biofilm Model and Flow Cytometric Evaluation of Cytoplasmic Membrane Damage. Front. Microbiol. 2018, 9, 688. [Google Scholar] [CrossRef] [PubMed]
- Azeredo, J.; Azevedo, N.F.; Briandet, R.; Cerca, N.; Coenye, T.; Costa, A.R.; Desvaux, M.; Di Bonaventura, G.; Hébraud, M.; Jaglic, Z.; et al. Critical review on biofilm methods. Crit. Rev. Microbiol. 2017, 43, 313–351. [Google Scholar] [CrossRef] [PubMed] [Green Version]
- Wu, J.; Xu, H.; Tang, W.; Kopelman, R.; Philbert, M.A.; Xi, C. Eradication of bacteria in suspension and biofilms using methylene blue-loaded dynamic nanoplatforms. Antimicrob. Agents Chemother. 2009, 53, 3042–3048. [Google Scholar] [CrossRef] [PubMed]
- Ke, E.S.; Nazzal, S.; Tseng, Y.H.; Chen, C.P.; Tsai, T. Erythrosine-mediated photodynamic inactivation of bacteria and yeast using green light-emitting diode light. J. Food Drug Anal. 2012, 20, 951–956. [Google Scholar] [CrossRef]
- Bulit, F.; Grad, I.; Manoil, D.; Simon, S.; Wataha, J.C.; Filieri, A.; Feki, A.; Schrenzel, J.; Lange, N.; Bouillaguet, S. Antimicrobial activity and cytotoxicity of 3 photosensitizers activated with blue light. J. Endod. 2014, 40, 427–431. [Google Scholar] [CrossRef] [PubMed]
- Jeffet, U.; Nasrallah, R.; Sterer, N. Effect of red dyes on blue light phototoxicity against VSC producing bacteria in an experimental oral biofilm. J. Breath Res. 2016, 10. [Google Scholar] [CrossRef] [PubMed]
- Ishiyama, K.; Nakamura, K.; Ikai, H.; Kanno, T.; Kohno, M.; Sasaki, K.; Niwano, Y. Bactericidal action of photogenerated singlet oxygen from photosensitizers used in plaque disclosing agents. PLoS ONE 2012, 7, e037871. [Google Scholar] [CrossRef] [PubMed]
- Gandin, E.; Lion, Y.; van de Vorst, A. Quantum Yield of Singlet Oxygen Production by Xanthene Derivatives. Photochem. Photobiol. 1983, 37, 271–278. [Google Scholar] [CrossRef]
- Buck, S.T.G.; Bettanin, F.; Orestes, E.; Homem-De-Mello, P.; Imasato, H.; Viana, R.B.; Perussi, J.R.; Da Silva, A.B.F. Photodynamic Efficiency of Xanthene Dyes and Their Phototoxicity against a Carcinoma Cell Line: A Computational and Experimental Study. J. Chem. 2017, 2017. [Google Scholar] [CrossRef]
- Busscher, H.J.; Weerkamp, A.H.; Hc, V.D.M.; van Pelt, A.W.; de Jong, H.P.; Arends, J. Measurement of the surface free energy of bacterial cell surfaces and its relevance for adhesion. Appl. Environ. Microbiol. 1984, 48, 980–983. [Google Scholar] [PubMed]
- Simões, M.; Pereira, M.O.; Sillankorva, S.; Azeredo, J.; Vieira, M.J. The effect of hydrodynamic conditions on the phenotype of Pseudomonas fluorescens biofilms. Biofouling 2007, 23, 249–258. [Google Scholar] [CrossRef] [PubMed] [Green Version]
- Janczuk, B.; Chibowski, E.; Bruque, J.M.; Kerkeb, M.L.; Caballero, F.G. On the Consistency of Surface Free Energy Components as Calculated from Contact Angles of Different Liquids: An Application to the Cholesterol Surface. J. Colloid Interface Sci. 1993, 159, 421–428. [Google Scholar] [CrossRef]
- Van Oss, C.J.; Chaudhury, M.K.; Good, R.J. Monopolar surfaces. Adv. Colloid Interface Sci. 1987, 28, 35–64. [Google Scholar] [CrossRef]
- Van Oss, C.; Good, R.; Chaudhury, M.; Oss, C. Additive and nonadditive surface tension components and the interpretation of contact angles. Langmuir 1988, 4, 884–891. [Google Scholar] [CrossRef]
- Van Oss, C.J.; Ju, L.; Chaudhury, M.K.; Good, R.J. Estimation of the polar parameters of the surface tension of liquids by contact angle measurements on gels. J. Colloid Interface Sci. 1989, 128, 313–319. [Google Scholar] [CrossRef]
- Stepanović, S.; Vuković, D.; Dakić, I.; Savić, B.; Švabić-Vlahović, M. A modified microtiter-plate test for quantification of staphylococcal biofilm formation. J. Microbiol. Methods 2000, 40, 175–179. [Google Scholar] [CrossRef]
- Da SILVA Meira, Q.G.; de Medeiros Barbosa, I.; Alves Aguiar Athayde, A.J.; de Siqueira-Júnior, J.P.; de Souza, E.L. Influence of temperature and surface kind on biofilm formation by Staphylococcus aureus from food-contact surfaces and sensitivity to sanitizers. Food Control 2012, 25, 469–475. [Google Scholar] [CrossRef]
- Rodríguez-Melcón, C.; Riesco-Peláez, F.; Carballo, J.; García-Fernández, C.; Capita, R.; Alonso-Calleja, C. Structure and viability of 24- and 72-h-old biofilms formed by four pathogenic bacteria on polystyrene and glass contact surfaces. Food Microbiol. 2018. [Google Scholar] [CrossRef] [PubMed]
- Simões, M.; Pereira, M.O.; Vieira, M.J. Validation of respirometry as a short-term method to assess the efficacy of biocides. Biofouling 2005, 21, 9–17. [Google Scholar] [CrossRef] [PubMed] [Green Version]
Sample Availability: Samples of the compounds rose bengal and erythrosine are not available from the authors. |


| Planktonic Cells a | Biofilms b | ||||
|---|---|---|---|---|---|
| PS Concentration (nmol/L) | Light Dose | PS Concentration (μmol/L) | Light Dose | ||
| ERY | RB | ERY | RB | ||
| 10.0 | 0.22 | 0.17 | 0.010 | 0.65 | 0.53 |
| 25.0 | 0.55 | 0.43 | 0.025 | 1.53 | 1.31 |
| 50.0 | 1.21 | 0.87 | 0.050 | 3.34 | 2.62 |
| 75.0 | 1.67 | 1.31 | 0.075 | 4.99 | 3.93 |
| 100.0 | 2.54 | 1.74 | 0.100 | 7.61 | 5.24 |
| 250.0 | 5.47 | 4.33 | 0.250 | 16.41 | 12.99 |
| 500.0 | 10.73 | 8.55 | 0.500 | 32.30 | 25.65 |
| 750.0 | 15.77 | 12.61 | 0.750 | 47.31 | 38.00 |
| 1000.0 | 20.52 | 16.54 | 1.000 | 61.56 | 49.59 |
| 5000.0 | 77.14 | 57.79 | 2.500 | 138.13 | 113.43 |
| 10,000.0 | 113.81 | 102.98 | 3.000 | - | 132.24 |
| 15,000.0 | 132.24 | 125.40 | 5.000 | 231.42 | 197.41 |
| 20,000.0 | 141.17 | 139.46 | 7.000 | - | 249.28 |
| 25,000.0 | 148.01 | 147.06 | 7.500 | 295.83 | 260.49 |
| 50,000.0 | 162.07 | 166.44 | 9.000 | - | 291.08 |
| - | - | - | 10.00 | 338.58 | 308.75 |
| - | - | - | 20.00 | 423.51 | - |
| - | - | - | 25.00 | 444.03 | - |
| - | - | - | 30.00 | 462.27 | - |
| - | - | - | 35.00 | 471.96 | - |
| - | - | - | 40.00 | 478.80 | - |
| - | - | - | 50.00 | 486.40 | - |
| Bacteria | Treatment | Hydrophobicity (mJ/m2) | Surface Tension Parameters (mJ/m2) | |||
|---|---|---|---|---|---|---|
| ΔGiWi | γLW | γ+ | γ− | γAB | ||
| E. coli | Control | 24.48 ± 1.21 a | 25.41 ± 0.16 a | 5.06 ± 0.35 a | 52.68 ± 0.72 a | 32.63 ± 0.90 a |
| Light | 23.30 ± 0.62 a | 25.23 ± 1.63 a | 5.19 ± 0.83 a | 51.49 ± 0.91 a | 32.65 ± 2.90 a | |
| ERY (L−P+) | 20.06 ± 2.58 b | 21.83 ± 2.06 a | 7.12 ± 1.23 a | 51.17 ± 0.95 a | 38.09 ± 2.95 a | |
| ERY (L+P+) | 27.43 ± 0.69 a | 30.98 ± 1.09 b | 3.03 ± 0.37 a | 52.46 ± 0.12 a | 25.19 ± 1.51 b | |
| RB (L−P+) | 25.01 ± 1.73 a | 23.24 ± 0.35 a | 5.54 ± 0.34 a | 54.34 ± 1.47 a | 34.68 ± 0.60 a | |
| RB (L+P+) | 28.55 ± 1.77 a | 30.28 ± 1.14 b | 2.87 ± 0.21 b | 53.03 ± 2.14 a | 24.66 ± 1.38 b | |
| S. aureus | Control | 29.57 ± 2.32 a | 31.83 ± 0.40 a | 2.03 ± 0.44 a | 52.05 ± 1.11 a | 20.46 ± 2.02 a |
| Light | 36.28 ± 1.61 b | 32.64 ± 0.23 a | 1.32 ± 0.05 a | 56.48 ± 1.69 a | 17.26 ± 0.60 a | |
| ERY (L−P+) | 30.65 ± 2.18 a | 31.51 ± 0.37 a | 2.35 ± 0.33 a | 54.06 ± 1.38 a | 22.50 ± 1.28 a | |
| ERY (L+P+) | 21.76 ± 0.86 b | 27.95 ± 4.58 a | 4.01 ± 0.91 a | 47.78 ± 1.71 b | 27.64 ± 3.66 b | |
| RB (L−P+) | 32.00 ± 2.14 a | 31.94 ± 0.87 a | 2.13 ± 0.46 a | 54.90 ± 0.98 a | 21.58 ± 2.16 a | |
| RB (L+P+) | 22.44 ± 0.47 b | 28.40 ± 0.62 a | 3.64 ± 0.62 a | 47.66 ± 0.64 b | 26.29 ± 2.42 b | |
| E. hirae | Control | 32.50 ± 1.45 a | 33.47 ± 0.95 a | 1.53 ± 0.10 a | 53.95 ± 1.41 a | 18.18 ± 0.33 a |
| Light | 34.69 ± 0.14 a | 34.23 ± 0.19 a | 1.35 ± 0.09 a | 55.66 ± 0.40 a | 17.36 ± 0.62 a | |
| ERY (L−P+) | 27.85 ± 0.96 a | 26.76 ± 0.63 a | 3.79 ± 0.19 a | 53.82 ± 1.52 a | 28.56 ± 1.13 a | |
| ERY (L+P+) | 30.04 ± 0.04 a | 32.07 ± 2.10 a | 2.18 ± 0.41 a | 53.14 ± 0.49 a | 21.47 ± 2.15 a | |
| RB (L−P+) | 27.41 ± 0.67 a | 30.02 ± 0.31 a | 2.96 ± 0.10 a | 51.93 ± 0.89 a | 24.78 ± 0.63 a | |
| RB (L+P+) | 34.38 ± 3.05 a | 33.39 ± 0.71 a | 1.56 ± 0.32 a | 55.81 ± 1.50 a | 18.60 ± 1.68 a | |
| L. innocua | Control | 29.97 ± 4.83 a | 27.80 ± 0.82 a | 2.96 ± 0.78 a | 53.98 ± 3.22 a | 29.98 ± 2.60 a |
| Light | 32.79 ± 3.53 a | 28.98 ± 3.13 a | 2.30 ± 0.94 a | 55.28 ± 1.43 a | 32.80 ± 4.38 a | |
| ERY (L−P+) | 31.54 ± 3.38 a | 27.67 ± 1.86 a | 2.88 ± 0.99 a | 55.43 ± 1.09 a | 31.55 ± 4.12 a | |
| ERY (L+P+) | 26.32 ± 3.77 a | 32.05 ± 1.94 a | 2.62 ± 0.09 a | 50.60 ± 2.97 a | 26.32 ± 0.30 a | |
| RB (L−P+) | 31.66 ± 3.08 a | 29.95 ± 0.42 a | 2.41 ± 0.53 a | 54.76 ± 1.69 a | 31.66 ± 2.17 a | |
| RB (L+P+) | 27.40 ± 1.91 a | 30.44 ± 3.23 a | 2.86 ± 0.90 a | 51.77 ± 0.66 a | 27.40 ± 3.69 a | |
| E. coli | S. aureus | E. hirae | L. innocua | |
|---|---|---|---|---|
| Control | 0.00 ± 0.00 | 0.00 ± 0.00 | 0.00 ± 0.00 | 0.00 ± 0.00 |
| Light | 0.00 ± 0.00 | 0.00 ± 0.00 | 0.00 ± 0.00 | 0.00 ± 0.00 |
| ERY (L−P+) | 0.00 ± 0.00 | 0.00 ± 0.00 | 0.00 ± 0.00 | 0.00 ± 0.00 |
| ERY L+P+) | 0.64 ± 0.06 * | 1.23 ± 0.03 * | 1.09 ± 0.09 * | 0.86 ± 0.18 * |
| RB (L−P+) | 0.00 ± 0.00 | 0.00 ± 0.00 | 0.00 ± 0.00 | 0.00 ± 0.00 |
| RB L+P+) | 0.20 ± 0.03 * | 1.22 ± 0.16 * | 0.52 ± 0.09 * | 0.53 ± 0.14 * |
| E. coli | S. aureus | E. hirae | L. innocua | |
|---|---|---|---|---|
| Control | 6.72 ± 3.14 | 1.65 ± 2.85 | 2.10 ±3.27 | 9.47 ± 4.56 |
| ERY a | 7.37 ± 4.91 | 5.46 ± 7.06 | 0.41 ± 1.29 | 17.2 ± 12.3 |
| ERY b | 98.2 ± 3.68 * | 100 ± 0.00 * | 100 ± 0.00 * | 100 ± 0.00 * |
| RB a | 1.46 ± 2.94 * | 6.06 ± 8.38 | 2.20 ± 2.67 | 2.98 ± 4.44 |
| RB c | 99.5 ± 1.51 * | 100 ± 0.00 * | 100 ± 0.00 * | 99.1 ± 1.77 * |
© 2018 by the authors. Licensee MDPI, Basel, Switzerland. This article is an open access article distributed under the terms and conditions of the Creative Commons Attribution (CC BY) license (http://creativecommons.org/licenses/by/4.0/).
Share and Cite
Silva, A.F.; Borges, A.; Freitas, C.F.; Hioka, N.; Mikcha, J.M.G.; Simões, M. Antimicrobial Photodynamic Inactivation Mediated by Rose Bengal and Erythrosine Is Effective in the Control of Food-Related Bacteria in Planktonic and Biofilm States. Molecules 2018, 23, 2288. https://doi.org/10.3390/molecules23092288
Silva AF, Borges A, Freitas CF, Hioka N, Mikcha JMG, Simões M. Antimicrobial Photodynamic Inactivation Mediated by Rose Bengal and Erythrosine Is Effective in the Control of Food-Related Bacteria in Planktonic and Biofilm States. Molecules. 2018; 23(9):2288. https://doi.org/10.3390/molecules23092288
Chicago/Turabian StyleSilva, Alex Fiori, Anabela Borges, Camila Fabiano Freitas, Noboru Hioka, Jane Martha Graton Mikcha, and Manuel Simões. 2018. "Antimicrobial Photodynamic Inactivation Mediated by Rose Bengal and Erythrosine Is Effective in the Control of Food-Related Bacteria in Planktonic and Biofilm States" Molecules 23, no. 9: 2288. https://doi.org/10.3390/molecules23092288