
Theoretical Prediction of the Complex P-Glycoprotein Substrate Efflux Based on the Novel Hierarchical Support Vector Regression Scheme


Abstract
:
1. Introduction
2. Results
2.1. Data Compilation
2.2. Data Partition
2.3. SVRE
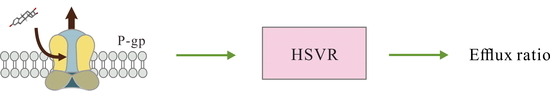
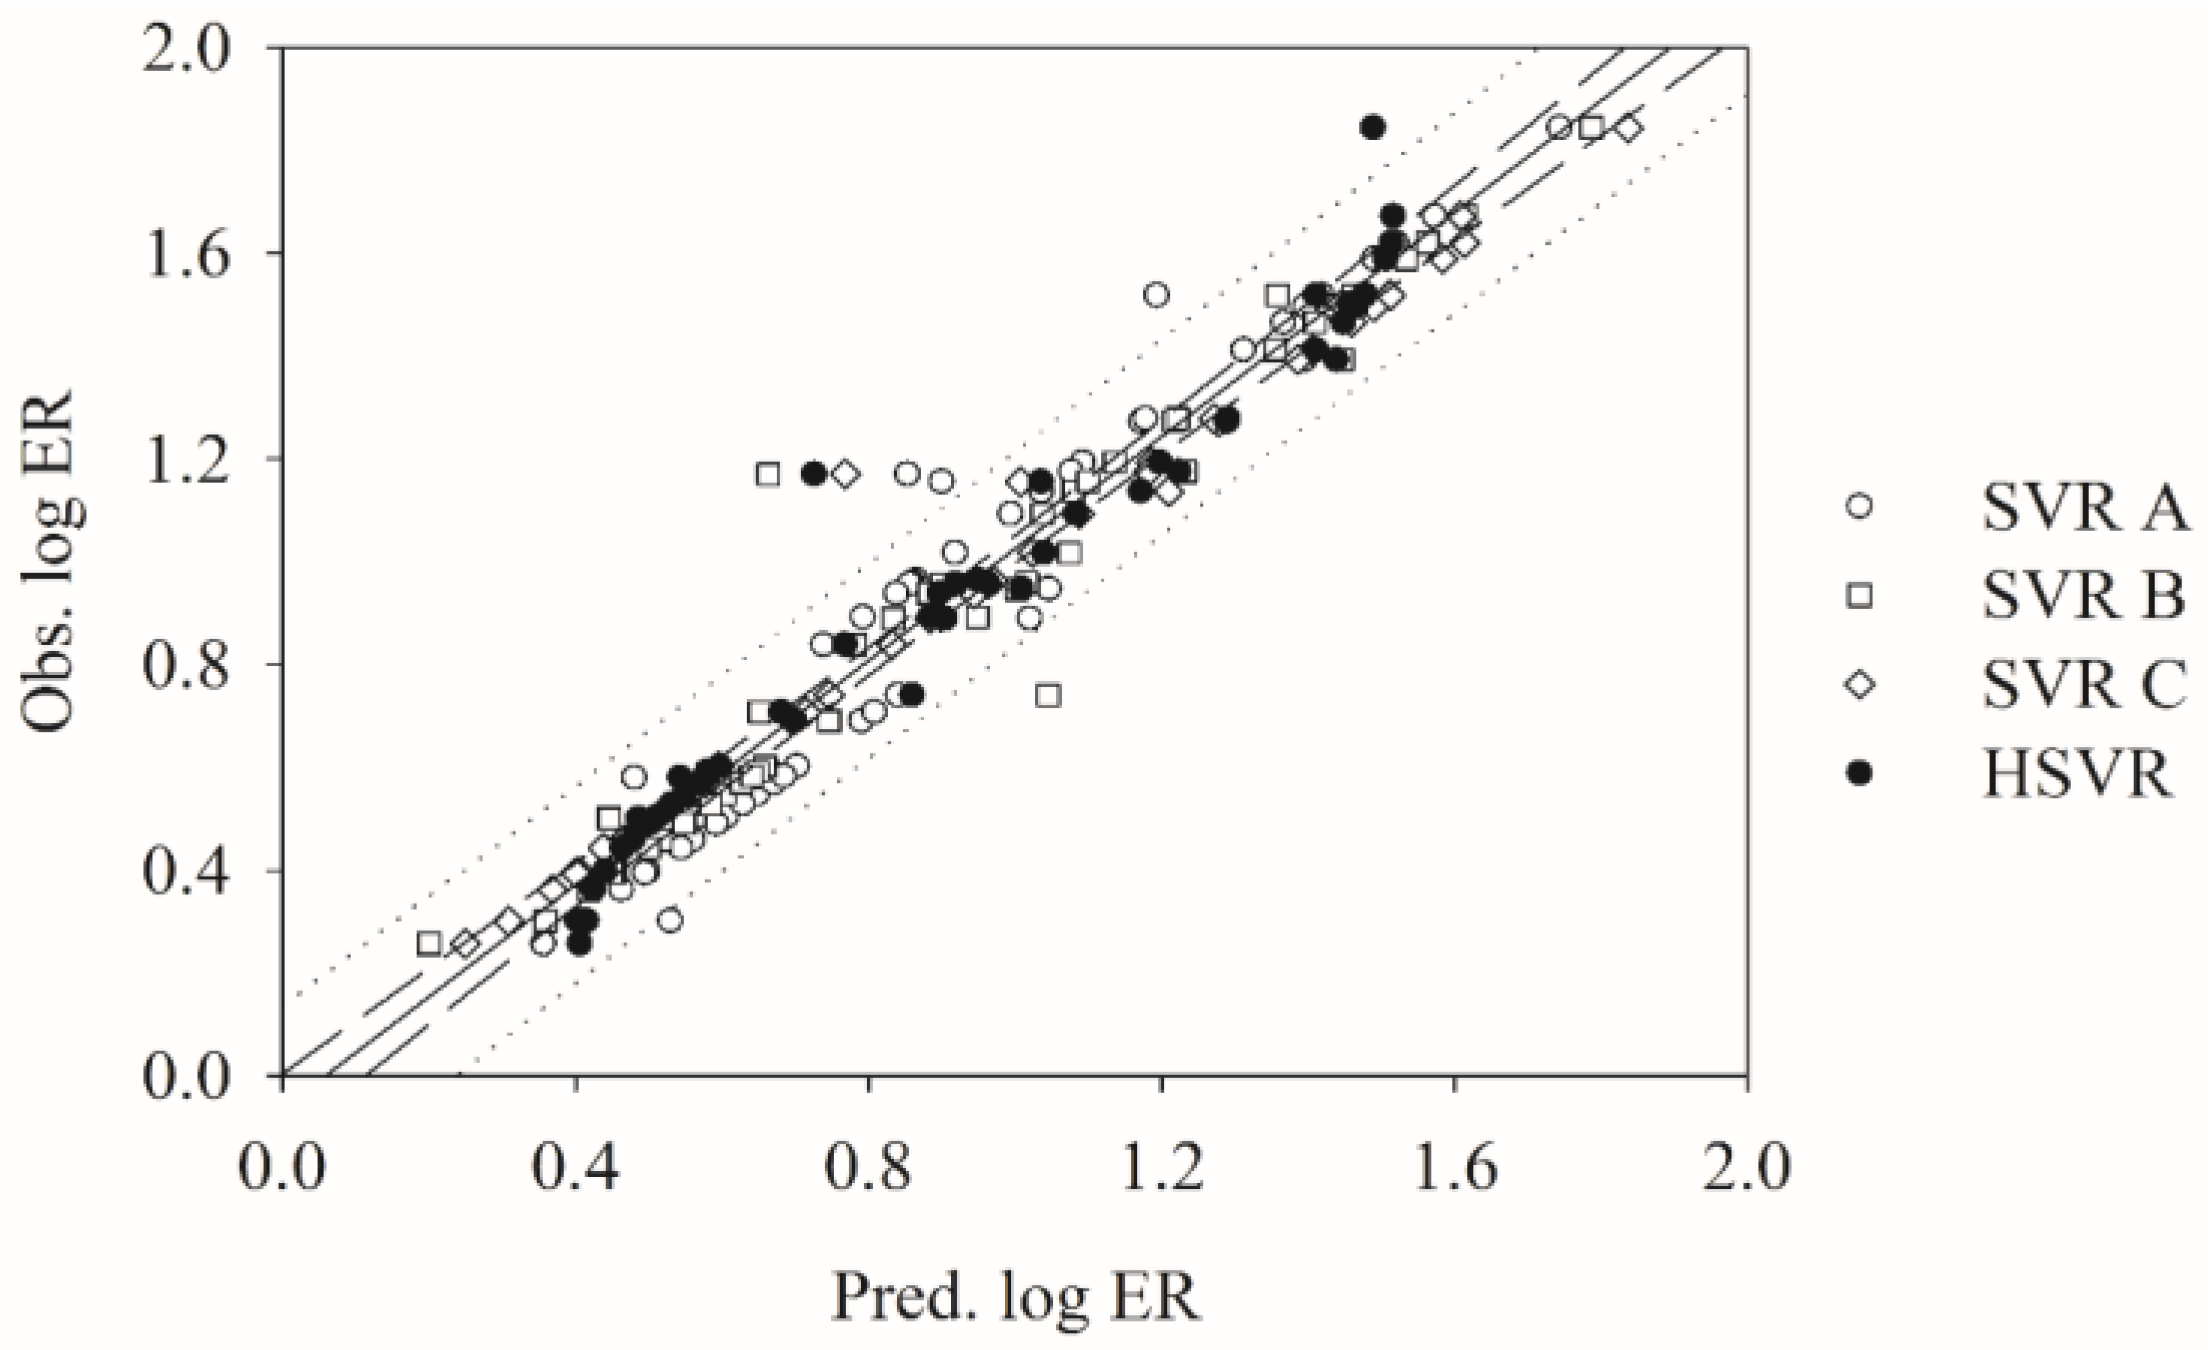
2.4. HSVR
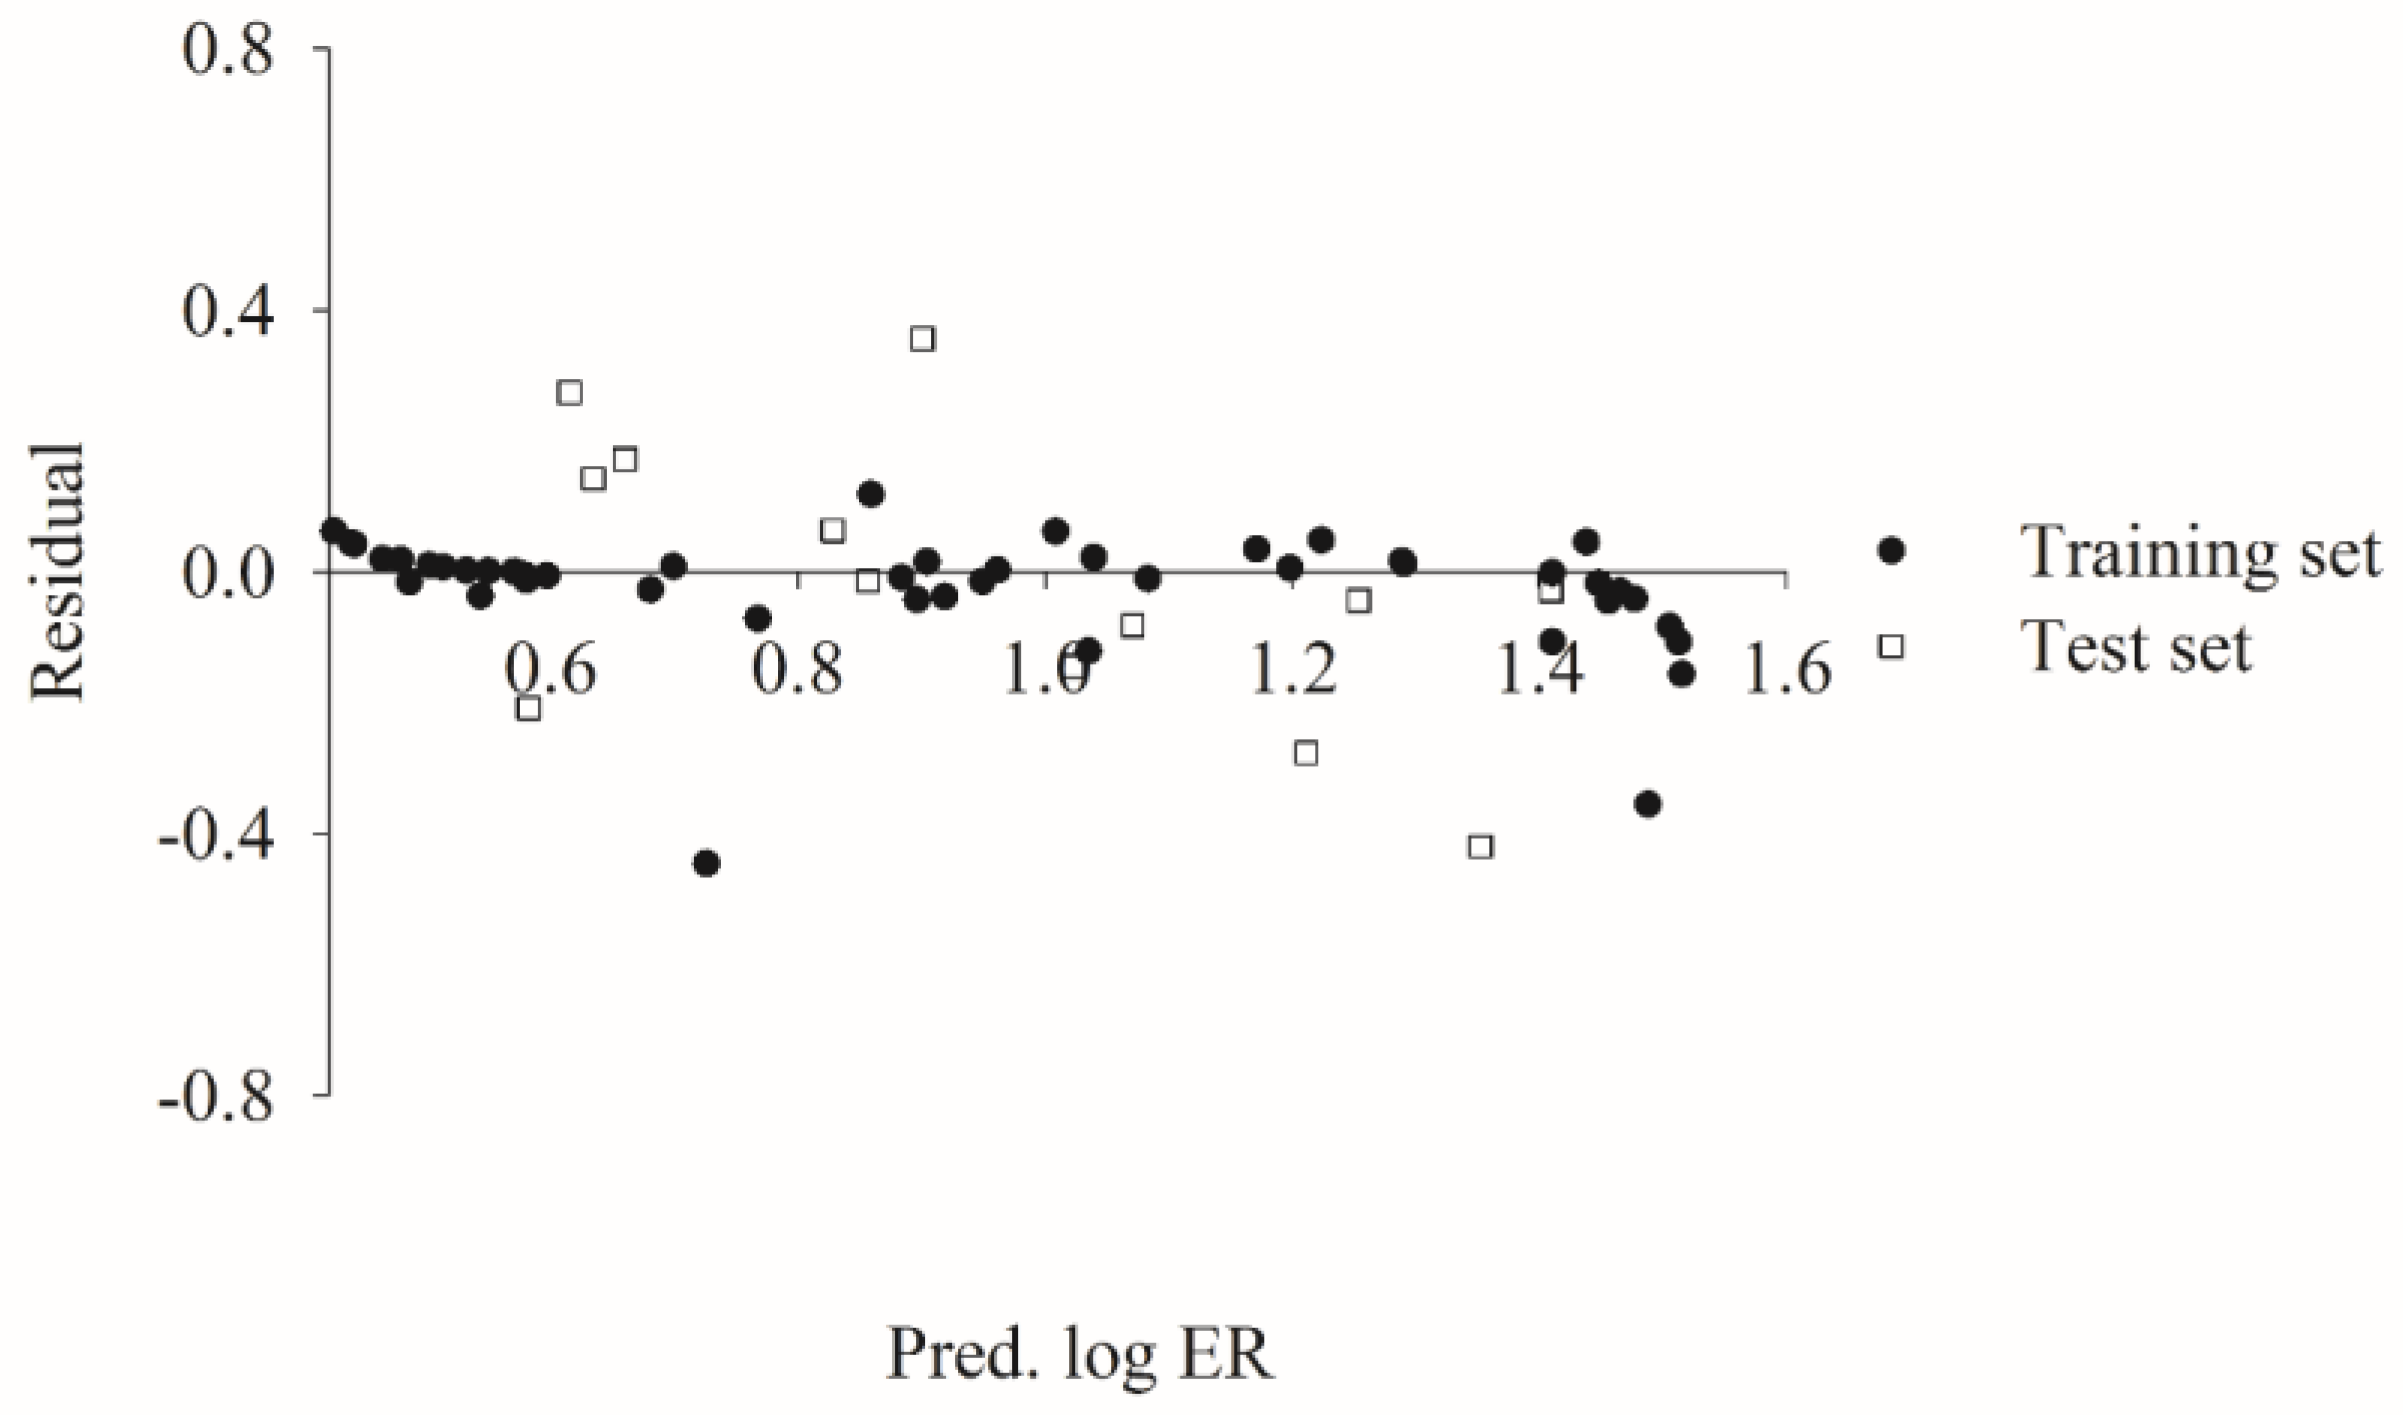
2.5. Predictive Evaluations
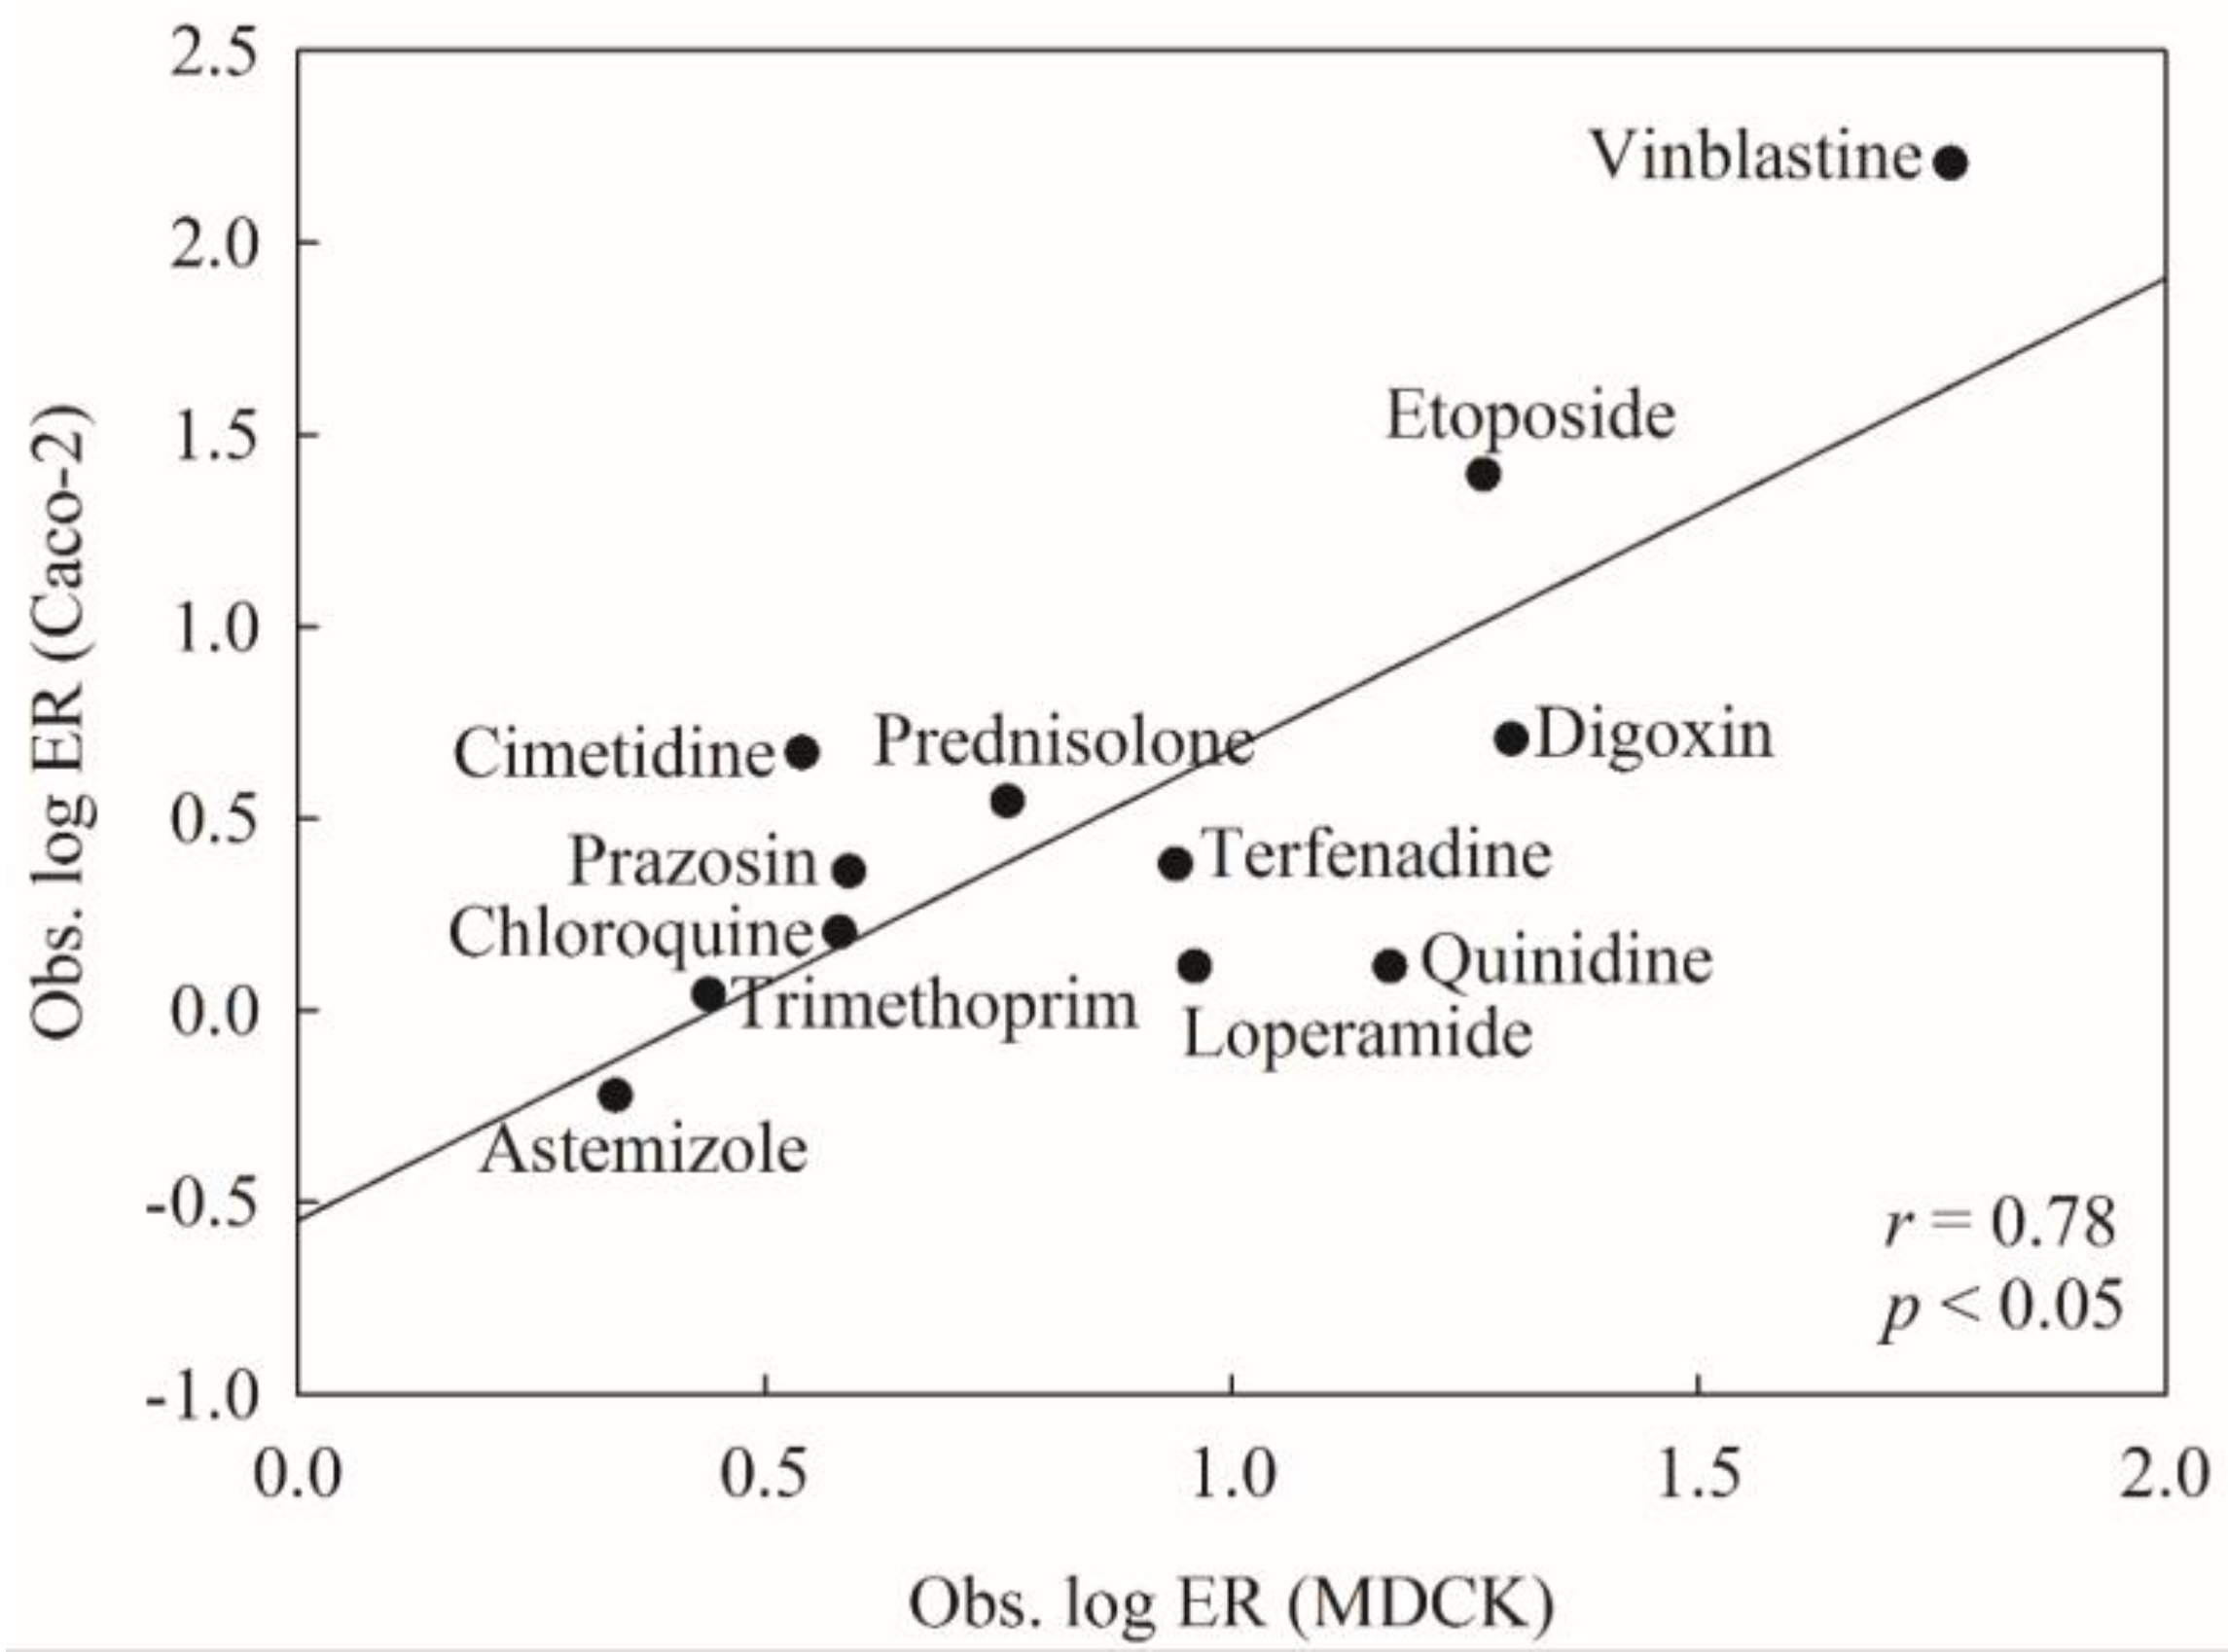
2.6. Mock Test
3. Discussion
4. Materials and Methods
4.1. Data Compilation
4.2. Molecular Descriptors
4.3. Data Partition
4.4. Hierarchical Support Vector Regression
4.5. Predictive Evaluation
5. Conclusions
Supplementary Materials
Author Contributions
Acknowledgments
Conflicts of Interest
References
- Schinkel, A.H.; Jonker, J.W. Mammalian drug efflux transporters of the atp binding cassette (abc) family: An overview. Adv. Drug Deliv. Rev. 2003, 55, 3–29. [Google Scholar] [CrossRef]
- Thiebaut, F.; Tsuruo, T.; Hamada, H.; Gottesman, M.M.; Pastan, I.; Willingham, M.C. Cellular localization of the multidrug-resistance gene product p-glycoprotein in normal human tissues. Proc. Natl. Acad. Sci. USA 1987, 84, 7735–7738. [Google Scholar] [CrossRef] [PubMed]
- Kim, R.B.; Fromm, M.F.; Wandel, C.; Leake, B.; Wood, A.J.; Roden, D.M.; Wilkinson, G.R. The drug transporter p-glycoprotein limits oral absorption and brain entry of hiv-1 protease inhibitors. J. Clin. Investig. 1998, 101, 289–294. [Google Scholar] [CrossRef] [PubMed]
- Cordon-Cardo, C.; O′Brien, J.P.; Casals, D.; Rittman-Grauer, L.; Biedler, J.L.; Melamed, M.R.; Bertino, J.R. Multidrug-resistance gene (p-glycoprotein) is expressed by endothelial cells at blood-brain barrier sites. Proc. Natl. Acad. Sci. USA 1989, 86, 695–698. [Google Scholar] [CrossRef] [PubMed]
- Schinkel, A.H. P-glycoprotein, a gatekeeper in the blood-brain barrier. Adv. Drug Deliv. Rev. 1999, 36, 179–194. [Google Scholar] [CrossRef]
- Vähäkangas, K.; Myllynen, P. Drug transporters in the human blood-placental barrier. Br. J. Pharmacol. 2009, 158, 665–678. [Google Scholar] [CrossRef] [PubMed]
- Gosselet, F.; Saint-Pol, J.; Candela, P.; Fenart, L. Amyloid-β peptides, alzheimer’s disease and the blood-brain barrier. Curr. Alzheimer Res. 2013, 10, 1015–1033. [Google Scholar] [CrossRef] [PubMed]
- Mawuenyega, K.G.; Sigurdson, W.; Ovod, V.; Munsell, L.; Kasten, T.; Morris, J.C.; Yarasheski, K.E.; Bateman, R.J. Decreased clearance of cns β-amyloid in alzheimer’s disease. Science 2010, 330, 1774. [Google Scholar] [CrossRef] [PubMed]
- van Assema, D.M.E.; Lubberink, M.; Bauer, M.; van der Flier, W.M.; Schuit, R.C.; Windhorst, A.D.; Comans, E.F.I.; Hoetjes, N.J.; Tolboom, N.; Langer, O.; et al. Blood–brain barrier p-glycoprotein function in alzheimer′s disease. Brain 2012, 135, 181–189. [Google Scholar] [CrossRef] [PubMed]
- Jedlitschky, G.; Vogelgesang, S.; Kroemer, H.K. Mdr1-p-glycoprotein (abcb1)-mediated disposition of amyloid-β peptides: Implications for the pathogenesis and therapy of alzheimer′s disease. Clin. Pharmacol. Ther. 2010, 88, 441–443. [Google Scholar] [CrossRef] [PubMed]
- Cascorbi, I.; Flüh, C.; Remmler, C.; Haenisch, S.; Faltraco, F.; Grumbt, M.; Peters, M.; Brenn, A.; Thal, D.R.; Warzok, R.W.; et al. Association of atp-binding cassette transporter variants with the risk of alzheimer’s disease. Pharmacogenomics 2013, 14, 485–494. [Google Scholar] [CrossRef] [PubMed]
- Brenn, A.; Grube, M.; Peters, M.; Fischer, A.; Jedlitschky, G.; Kroemer, H.K.; Warzok, R.W.; Vogelgesang, S. Beta-amyloid downregulates mdr1-p-glycoprotein (abcb1) expression at the blood-brain barrier in mice. Int. J. Alzheimers Dis. 2011, 2011. [Google Scholar] [CrossRef] [PubMed]
- Neuwelt, E.A.; Bauer, B.; Fahlke, C.; Fricker, G.; Iadecola, C.; Janigro, D.; Leybaert, L.; Molnár, Z.; O′Donnell, M.E.; Povlishock, J.T.; et al. Engaging neuroscience to advance translational research in brain barrier biology. Nat. Rev. Neurosci. 2011, 12, 169–182. [Google Scholar] [CrossRef] [PubMed] [Green Version]
- Wolf, A.; Bauer, B.; Hartz, A. Abc transporters and the alzheimer′s disease enigma. Front. Psychiatry 2012, 3. [Google Scholar] [CrossRef] [PubMed]
- Selick, H.E.; Beresford, A.P.; Tarbit, M.H. The emerging importance of predictive adme simulation in drug discovery. Drug Discov. Today 2002, 7, 109–116. [Google Scholar] [CrossRef]
- Montanari, F.; Ecker, G.F. Prediction of drug–abc-transporter interaction—recent advances and future challenges. Adv. Drug Deliv. Rev. 2015, 86, 17–26. [Google Scholar] [CrossRef] [PubMed]
- Greiner, B.; Eichelbaum, M.; Fritz, P.; Kreichgauer, H.P.; von Richter, O.; Zundler, J.; Kroemer, H.K. The role of intestinal p-glycoprotein in the interaction of digoxin and rifampin. J. Clin. Investig. 1999, 104, 147–153. [Google Scholar] [CrossRef] [PubMed]
- Padowski, J.M.; Pollack, G.M. Influence of time to achieve substrate distribution equilibrium between brain tissue and blood on quantitation of the blood–brain barrier p-glycoprotein effect. Brain Res. 2011, 1426, 1–17. [Google Scholar] [CrossRef] [PubMed]
- Bagal, S.; Bungay, P. Restricting cns penetration of drugs to minimise adverse events: Role of drug transporters. Drug Discov. Today Technol. 2014, 12, e79–e85. [Google Scholar] [CrossRef] [PubMed]
- Hochman, J.H.; Ha, S.N.; Sheridan, R.P. Establishment of p-glycoprotein structure–transport relationships to optimize cns exposure in drug discovery. In Blood-Brain Barrier in Drug Discovery: Optimizing Brain Exposure of Cns Drugs and Minimizing Brain Side Effects for Peripheral Drugs; Di, L., Kerns, E.H., Eds.; John Wiley & Sons, Inc.: Hoboken, NJ, USA, 2015; pp. 113–124. [Google Scholar]
- Schinkel, A.H.; Wagenaar, E.; Mol, C.A.; van Deemter, L. P-glycoprotein in the blood-brain barrier of mice influences the brain penetration and pharmacological activity of many drugs. J. Clin. Investig. 1996, 97, 2517–2524. [Google Scholar] [CrossRef] [PubMed]
- Aszalos, A. Drug–drug interactions affected by the transporter protein, p-glycoprotein (abcb1, mdr1): II. Clinical aspects. Drug Discov. Today 2007, 12, 838–843. [Google Scholar] [CrossRef] [PubMed]
- Doan, K.M.M.; Humphreys, J.E.; Webster, L.O.; Wring, S.A.; Shampine, L.J.; Serabjit-Singh, C.J.; Adkison, K.K.; Polli, J.W. Passive permeability and p-glycoprotein-mediated efflux differentiate central nervous system (cns) and non-cns marketed drugs. J. Pharmacol. Exp. Ther. 2002, 303, 1029–1037. [Google Scholar] [CrossRef] [PubMed]
- Hennessy, M.; Spiers, J.P. A primer on the mechanics of p-glycoprotein the multidrug transporter. Pharmacol. Res. 2007, 55, 1–15. [Google Scholar] [CrossRef] [PubMed]
- Gottesman, M.M.; Pastan, I. Biochemistry of multidrug resistance mediated by the multidrug transporter. Ann. Rev. Biochem. 2003, 62, 385–427. [Google Scholar] [CrossRef] [PubMed]
- Breier, A.; Gibalova, L.; Seres, M.; Barancik, M.; Sulova, Z. New insight into p-glycoprotein as a drug target. Anticancer Agents Med. Chem. 2013, 13, 159–170. [Google Scholar] [CrossRef] [PubMed]
- Ambudkar, S.V.; Dey, S.; Hrycyna, C.A.; Ramachandra, M.; Pastan, I.; Gottesman, M.M. Biochemical, cellular, and pharmacological aspects of the multidrug transporter. Annu. Rev. Pharmacol. Toxicol. 1999, 39, 361–398. [Google Scholar] [CrossRef] [PubMed]
- Siegel, R.L.; Miller, K.D.; Jemal, A. Cancer statistics, 2017. CA Cancer J. Clin. 2017, 67, 7–30. [Google Scholar] [CrossRef] [PubMed]
- Clarke, J.; Penas, C.; Pastori, C.; Komotar, R.J.; Bregy, A.; Shah, A.H.; Wahlestedt, C.; Ayad, N.G. Epigenetic pathways and glioblastoma treatment. Epigenetics 2013, 8, 785–795. [Google Scholar] [CrossRef] [PubMed] [Green Version]
- Wang, T.; Agarwal, S.; Elmquist, W.F. Brain distribution of cediranib is limited by active efflux at the blood-brain barrier. J. Pharmacol. Exp. Ther. 2012, 341, 386–395. [Google Scholar] [CrossRef] [PubMed]
- Palmeira, A.; Sousa, E.H.; Vasconcelos, M.M.; Pinto, M. Three decades of p-gp inhibitors: Skimming through several generations and scaffolds. Curr. Med. Chem. 2012, 19, 1946–2025. [Google Scholar] [CrossRef] [PubMed]
- van Hoppe, S.; Schinkel, A.H. What next? Preferably development of drugs that are no longer transported by the abcb1 and abcg2 efflux transporters. Pharmacol. Res. 2017, 122–144. [Google Scholar] [CrossRef] [PubMed]
- Crivori, P. Computational models for p-glycoprotein substrates and inhibitors. In Antitargets: Prediction and Prevention of Drug Side Effects; Vaz, R.J., Klabunde, T., Eds.; Wiley-VCH Verlag GmbH & Co. KGaA: Weinheim, Germany, 2008; Volume 38, pp. 367–397. [Google Scholar]
- Terasaki, T.; Hosoya, K.I. The blood-brain barrier efflux transporters as a detoxifying system for the brain. Adv. Drug Deliv. Rev. 1999, 36, 195–209. [Google Scholar] [CrossRef]
- Garg, P.; Verma, J. In silico prediction of blood brain barrier permeability: An artificial neural network model. J. Chem. Inf. Model. 2006, 46, 289–297. [Google Scholar] [CrossRef] [PubMed]
- Kalvass, J.C.; Maurer, T.S.; Pollack, G.M. Use of plasma and brain unbound fractions to assess the extent of brain distribution of 34 drugs: Comparison of unbound concentration ratios to in vivo p-glycoprotein efflux ratios. Drug Metab. Dispos. 2007, 35, 660–666. [Google Scholar] [CrossRef] [PubMed]
- Di, L.; Rong, H.; Feng, B. Demystifying brain penetration in central nervous system drug discovery. J. Med. Chem. 2013, 56, 2–12. [Google Scholar] [CrossRef] [PubMed]
- Inoue, T.; Osada, K.; Tagawa, M.; Ogawa, Y.; Haga, T.; Sogame, Y.; Hashizume, T.; Watanabe, T.; Taguchi, A.; Katsumata, T.; et al. Blonanserin, a novel atypical antipsychotic agent not actively transported as substrate by p-glycoprotein. Prog. Neuropsychopharmacol. Biol. Psychiatry 2012, 39, 156–162. [Google Scholar]
- Polli, J.W.; Wring, S.A.; Humphreys, J.E.; Huang, L.; Morgan, J.B.; Webster, L.O.; Serabjit-Singh, C.S. Rational use of in vitro p-glycoprotein assays in drug discovery. J. Pharmacol. Exp. Ther. 2001, 299, 620–628. [Google Scholar] [PubMed]
- Hochman, J.H.; Yamazaki, M.; Ohe, T.; Lin, J.H. Evaluation of drug interactions with p-glycoprotein in drug discovery: In vitro assessment of the potential for drug-drug interactions with p-glycoprotein. Curr. Drug MeTable 2002, 3, 257–273. [Google Scholar] [CrossRef]
- Schwab, D.; Fischer, H.; Tabatabaei, A.; Poli, S.; Huwyler, J. Comparison of in vitro p-glycoprotein screening assays: Recommendations for their use in drug discovery. J. Med. Chem. 2003, 46, 1716–1725. [Google Scholar] [CrossRef] [PubMed]
- Zhang, Y.; Bachmeier, C.; Miller, D.W. In vitro and in vivo models for assessing drug efflux transporter activity. Adv. Drug Deliv. Rev. 2003, 55, 31–51. [Google Scholar] [CrossRef]
- Sugano, K.; Shirasaka, Y.; Yamashita, S. Estimation of michaelis–menten constant of efflux transporter considering asymmetric permeability. Int. J. Pharm. 2011, 418, 161–167. [Google Scholar] [CrossRef] [PubMed]
- Storch, C.H.; Nikendei, C.; Schild, S.; Haefeli, W.E.; Weiss, J.; Herzog, W. Expression and activity of p-glycoprotein (mdr1/abcb1) in peripheral blood mononuclear cells from patients with anorexia nervosa compared with healthy controls. Int. J. Eating Disord. 2008, 41, 432–438. [Google Scholar] [CrossRef] [PubMed]
- Egan, W.J. Computational models for adme. In Annual Reports in Medicinal Chemistry; John, E.M., Ed.; Academic Press: San Diego, CA, USA, 2007; Volume 42, pp. 449–467. [Google Scholar]
- Sliwoski, G.; Kothiwale, S.; Meiler, J.; Lowe, E.W. Computational methods in drug discovery. Pharmacol. Rev. 2014, 66, 334–395. [Google Scholar] [CrossRef] [PubMed]
- Penzotti, J.E.; Lamb, M.L.; Evensen, E.; Grootenhuis, P.D.J. A computational ensemble pharmacophore model for identifying substrates of p-glycoprotein. J. Med. Chem. 2002, 45, 1737–1740. [Google Scholar] [CrossRef] [PubMed]
- Gombar, V.K.; Polli, J.W.; Humphreys, J.E.; Wring, S.A.; Serabjit-Singh, C.S. Predicting p-glycoprotein substrates by a quantitative structure-activity relationship model. J. Pharm. Sci. 2004, 93, 957–968. [Google Scholar] [CrossRef] [PubMed]
- Xue, Y.; Yap, C.W.; Sun, L.Z.; Cao, Z.W.; Wang, J.F.; Chen, Y.Z. Prediction of p-glycoprotein substrates by a support vector machine approach. J. Chem. Inf. Comput. Sci. 2004, 44, 1497–1505. [Google Scholar] [CrossRef] [PubMed]
- Wang, Y.H.; Li, Y.; Yang, S.L.; Yang, L. Classification of substrates and inhibitors of p-glycoprotein using unsupervised machine learning approach. J. Chem. Inf. Model. 2005, 45, 750–757. [Google Scholar] [CrossRef] [PubMed]
- Crivori, P.; Reinach, B.; Pezzetta, D.; Poggesi, I. Computational models for identifying potential p-glycoprotein substrates and inhibitors. Mol. Pharma. 2006, 3, 33–44. [Google Scholar] [CrossRef]
- de Cerqueira Lima, P.; Golbraikh, A.; Oloff, S.; Xiao, Y.; Tropsha, A. Combinatorial qsar modeling of p-glycoprotein substrates. J. Chem. Inf. Model. 2006, 46, 1245–1254. [Google Scholar] [CrossRef] [PubMed]
- Huang, J.; Ma, G.; Muhammad, I.; Cheng, Y. Identifying p-glycoprotein substrates using a support vector machine optimized by a particle swarm. J. Chem. Inf. Model. 2007, 47, 1638–1647. [Google Scholar] [CrossRef] [PubMed]
- Li, W.-X.; Li, L.; Eksterowicz, J.; Ling, X.B.; Cardozo, M. Significance analysis and multiple pharmacophore models for differentiating p-glycoprotein substrates. J. Chem Inf. Model. 2007, 47, 2429–2438. [Google Scholar] [CrossRef] [PubMed]
- Wang, Z.; Chen, Y.; Liang, H.; Bender, A.; Glen, R.C.; Yan, A. P-glycoprotein substrate models using support vector machines based on a comprehensive data set. J. Chem. Inf. Model. 2011, 51, 1447–1456. [Google Scholar] [CrossRef] [PubMed]
- Desai, P.V.; Sawada, G.A.; Watson, I.A.; Raub, T.J. Integration of in silico and in vitro tools for scaffold optimization during drug discovery: Predicting p-glycoprotein efflux. Mol. Pharmaceutics 2013, 10, 1249–1261. [Google Scholar] [CrossRef] [PubMed]
- Ecker, G.F.; Stockner, T.; Chiba, P. Computational models for prediction of interactions with abc-transporters. Drug Discov. Today 2008, 13, 311–317. [Google Scholar] [CrossRef] [PubMed]
- Adenot, M. A practical approach to computational models of the blood–brain barrier. In Handbook of Neurochemistry and Molecular Neurobiology: Neural Membranes and Transport; Lajtha, A., Reith, M.E.A., Eds.; Springer: New York, NY, USA, 2007; pp. 109–150. [Google Scholar]
- Ivanciuc, O. Artificial immune systems in drug design: Recognition of p-glycoprotein substrates with airs (artificial immune recognition system). Internet Electron. J. Mol. Des. 2006, 5, 542–554. [Google Scholar]
- Bikadi, Z.; Hazai, I.; Malik, D.; Jemnitz, K.; Veres, Z.; Hari, P.; Ni, Z.; Loo, T.W.; Clarke, D.M.; Hazai, E.; et al. Predicting p-glycoprotein-mediated drug transport based on support vector machine and three-dimensional crystal structure of p-glycoprotein. PLoS ONE 2011, 6, e25815. [Google Scholar] [CrossRef] [PubMed]
- Erić, S.; Kalinić, M.; Ilić, K.; Zloh, M. Computational classification models for predicting the interaction of drugs with p-glycoprotein and breast cancer resistance protein. SAR QSAR Environ. Res. 2014, 25, 939–966. [Google Scholar] [CrossRef] [PubMed]
- Pan, X.; Mei, H.; Qu, S.; Huang, S.; Sun, J.; Yang, L.; Chen, H. Prediction and characterization of p-glycoprotein substrates potentially bound to different sites by emerging chemical pattern and hierarchical cluster analysis. Int. J. Pharm. 2016, 502, 61–69. [Google Scholar] [CrossRef] [PubMed]
- Didziapetris, R.; Japertas, P.; Avdeef, A.; Petrauskas, A. Classification analysis of p-glycoprotein substrate specificity. J. Drug Target. 2003, 11, 391–406. [Google Scholar] [CrossRef] [PubMed]
- Broccatelli, F. Qsar models for p-glycoprotein transport based on a highly consistent data set. J. Chem. Inf. Model. 2012, 2, 2462–2470. [Google Scholar] [CrossRef] [PubMed]
- Poongavanam, V.; Haider, N.; Ecker, G.F. Fingerprint-based in silico models for the prediction of p-glycoprotein substrates and inhibitors. Bioorg. Med. Chem. 2012, 20, 5388–5395. [Google Scholar] [CrossRef] [PubMed]
- Li, D.; Chen, L.; Li, Y.; Tian, S.; Sun, H.; Hou, T. Admet evaluation in drug discovery. 13. Development of in silico prediction models for p-glycoprotein substrates. Mol. Pharm. 2014, 11, 716–726. [Google Scholar] [PubMed]
- Estrada, E.; Molina, E.; Nodarse, D.; Uriarte, E. Structural contributions of substrates to their binding to p-glycoprotein. A topsmode approach. Curr. Pharm. Des. 2010, 16, 2676–2709. [Google Scholar] [CrossRef] [PubMed]
- Joung, J.Y.; Kim, H.; Kim, H.M.; Ahn, S.K.; Nam, K.-Y.; No, K.T. Prediction models of p-glycoprotein substrates using simple 2d and 3d descriptors by a recursive partitioning approach. Bull. Korean Chem. Soc. 2012, 33, 1123–1127. [Google Scholar] [CrossRef]
- Gunaydin, H.; Weiss, M.M.; Sun, Y. De novo prediction of p-glycoprotein-mediated efflux liability for druglike compounds. ACS Med. Chem. Lett. 2013, 4, 108–112. [Google Scholar] [CrossRef] [PubMed]
- Dolghih, E.; Jacobson, M.P. Predicting efflux ratios and blood-brain barrier penetration from chemical structure: Combining passive permeability with active efflux by p-glycoprotein. ACS Chem. Neurosci. 2012, 4, 361–367. [Google Scholar] [CrossRef] [PubMed]
- Dolghih, E.; Bryant, C.; Renslo, A.R.; Jacobson, M.P. Predicting binding to p-glycoprotein by flexible receptor docking. PLoS Comput. Biol. 2011, 7, e1002083. [Google Scholar] [CrossRef] [PubMed]
- Subramanian, N.; Condic-Jurkic, K.; O’Mara, M.L. Structural and dynamic perspectives on the promiscuous transport activity of p-glycoprotein. Neurochem. Int. 2016, 98, 146–152. [Google Scholar] [CrossRef] [PubMed]
- Leong, M.K.; Chen, H.B.; Shih, Y.H. Prediction of promiscuous p-glycoprotein inhibition using a novel machine learning scheme. PLoS ONE 2012, 7, e33829. [Google Scholar] [CrossRef] [PubMed]
- Garrigues, A.; Loiseau, N.; Delaforge, M.; Ferté, J.; Garrigos, M.; André, F.; Orlowski, S. Characterization of two pharmacophores on the multidrug transporter p-glycoprotein. Mol. Pharmacol. 2002, 62, 1288–1298. [Google Scholar] [CrossRef] [PubMed]
- Chufan, E.E.; Sim, H.M.; Ambudkar, S.V. Molecular basis of the polyspecificity of p-glycoprotein (abcb1): Recent biochemical and structural studies. In Advances in Cancer Research: Abc Transporters and Cancer; John, D.S., Toshihisa, I., Eds.; Academic Press: San Diego, CA, USA, 2015; Volume 125, pp. 71–96. [Google Scholar]
- Ferreira, R.J.; Ferreira, M.J.U.; dos Santos, D.J.V.A. Molecular docking characterizes substrate-binding sites and efflux modulation mechanisms within p-glycoprotein. J. Chem. Inf. Model. 2013, 53, 1747–1760. [Google Scholar] [CrossRef] [PubMed]
- Aller, S.G.; Yu, J.; Ward, A.; Weng, Y.; Chittaboina, S.; Zhuo, R.; Harrell, P.M.; Trinh, Y.T.; Zhang, Q.; Urbatsch, I.L.; et al. Structure of p-glycoprotein reveals a molecular basis for poly-specific drug binding. Science 2009, 323, 1718–1722. [Google Scholar] [CrossRef] [PubMed]
- Edwards, G. Ivermectin: Does p-glycoprotein play a role in neurotoxicity? Filaria J. 2003, 2 Suppl. 1, S8. [Google Scholar] [CrossRef] [PubMed]
- Balimane, P.V.; Han, Y.H.; Chong, S. Current industrial practices of assessing permeability and p-glycoprotein interaction. AAPS J. 2006, 8, E1–E13. [Google Scholar] [CrossRef] [PubMed]
- Roger, P.; Sahla, M.E.; Mäkelä, S.; Gustafsson, J.Å.; Baldet, P.; Rochefort, H. Decreased expression of estrogen receptor β protein in proliferative preinvasive mammary tumors. Cancer Res. 2001, 61, 2537–2541. [Google Scholar] [PubMed]
- Speck-Planche, A.; Cordeiro, M.N.D.S. Multi-target qsar approaches for modeling protein inhibitors. Simultaneous prediction of activities against biomacromolecules present in gram-negative bacteria. Curr. Top. Med. Chem. 2015, 15, 1801–1813. [Google Scholar] [CrossRef] [PubMed]
- Ferreira, R.J.; dos Santos, D.J.V.A.; Ferreira, M.J.U.; Guedes, R.C. Toward a better pharmacophore description of p-glycoprotein modulators, based on macrocyclic diterpenes from euphorbia species. J. Chem. Inf. Model. 2011, 51, 1315–1324. [Google Scholar] [CrossRef] [PubMed]
- Leong, M.K.; Chen, Y.M.; Chen, T.H. Prediction of human cytochrome p450 2b6-substrate interactions using hierarchical support vector regression approach. J. Comput. Chem. 2009, 30, 1899–1909. [Google Scholar] [CrossRef] [PubMed]
- Caudill, M. Using neural networks: Hybrid expert networks. AI Expert 1990, 5, 49–54. [Google Scholar]
- Leong, M.K.; Lin, S.W.; Chen, H.B.; Tsai, F.Y. Predicting mutagenicity of aromatic amines by various machine learning approaches. Toxicol. Sci. 2010, 116, 498–513. [Google Scholar] [CrossRef] [PubMed]
- Ding, Y.L.; Lyu, Y.C.; Leong, M.K. In silico prediction of the mutagenicity of nitroaromatic compounds using a novel two-qsar approach. Toxicol. In Vitro 2017, 40, 102–114. [Google Scholar] [CrossRef] [PubMed]
- Gnanadesikan, R.; Kettenring, J.R. Robust estimates, residuals, and outlier detection with multiresponse data. Biometrics 1972, 28, 81–124. [Google Scholar] [CrossRef]
- Carrara, S.; Reali, V.; Misiano, P.; Dondio, G.; Bigogno, C. Evaluation of in vitro brain penetration: Optimized pampa and mdckii-mdr1 assay comparison. Int. J. Pharm. 2007, 345, 125–133. [Google Scholar] [CrossRef] [PubMed]
- Chen, C.; Hanson, E.; Watson, J.W.; Lee, J.S. P-glycoprotein limits the brain penetration of nonsedating but not sedating h1-antagonists. Drug Metab. Dispos. 2003, 31, 312–318. [Google Scholar] [CrossRef] [PubMed]
- Eriksson, U.G.; Dorani, H.; Karlsson, J.; Fritsch, H.; Hoffmann, K.-J.; Olsson, L.; Sarich, T.C.; Wall, U.; Schützer, K.-M. Influence of erythromycin on the pharmacokinetics of ximelagatran may involve inhibition of p-glycoprotein-mediated excretion. Drug Metab. Dispos. 2006, 34, 775–782. [Google Scholar] [CrossRef] [PubMed]
- Feng, B.; Mills, J.B.; Davidson, R.E.; Mireles, R.J.; Janiszewski, J.S.; Troutman, M.D.; de Morais, S.M. In vitro p-glycoprotein assays to predict the in vivo interactions of p-glycoprotein with drugs in the central nervous system. Drug Metab. Dispos. 2008, 36, 268–275. [Google Scholar] [CrossRef] [PubMed]
- Gertz, M.; Harrison, A.; Houston, J.B.; Galetin, A. Prediction of human intestinal first-pass metabolism of 25 cyp3a substrates from in vitro clearance and permeability data. Drug Metab. Dispos. 2010, 38, 1147–1158. [Google Scholar] [CrossRef] [PubMed]
- Huang, L.; Wang, Y.; Grimm, S. Atp-dependent transport of rosuvastatin in membrane vesicles expressing breast cancer resistance protein. Drug Metab. Dispos. 2006, 34, 738–742. [Google Scholar] [CrossRef] [PubMed]
- Luo, S.; Pal, D.; Shah, S.J.; Kwatra, D.; Paturi, K.D.; Mitra, A.K. Effect of hepes buffer on the uptake and transport of p-glycoprotein substrates and large neutral amino acids. Mol. Pharm. 2010, 7, 412–420. [Google Scholar] [CrossRef] [PubMed]
- Taub, M.E.; Podila, L.; Ely, D.; Almeida, I. Functional assessment of multiple p-glycoprotein (p-gp) probe substrates: Influence of cell line and modulator concentration on p-gp activity. Drug Metab. Dispos. 2005, 33, 1679–1687. [Google Scholar] [CrossRef] [PubMed]
- Troutman, M.D.; Thakker, D.R. Novel experimental parameters to quantify the modulation of absorptive and secretory transport of compounds by p-glycoprotein in cell culture models of intestinal epithelium. Pharm. Res. 2003, 20, 1210–1224. [Google Scholar] [CrossRef] [PubMed]
- Wager, T.T.; Chandrasekaran, R.Y.; Hou, X.; Troutman, M.D.; Verhoest, P.R.; Villalobos, A.; Will, Y. Defining desirable central nervous system drug space through the alignment of molecular properties, in vitro adme, and safety attributes. ACS Chem. Neurosci. 2010, 1, 420–434. [Google Scholar] [CrossRef] [PubMed]
- Callegari, E.; Malhotra, B.; Bungay, P.J.; Webster, R.; Fenner, K.S.; Kempshall, S.; LaPerle, J.L.; Michel, M.C.; Kay, G.G. A comprehensive non-clinical evaluation of the cns penetration potential of antimuscarinic agents for the treatment of overactive bladder. Br. J. Clin. Pharmacol. 2011, 72, 235–246. [Google Scholar] [CrossRef] [PubMed]
- Obradovic, T.; Dobson, G.; Shingaki, T.; Kungu, T.; Hidalgo, I. Assessment of the first and second generation antihistamines brain penetration and role of p-glycoprotein. Pharm. Res. 2007, 24, 318–327. [Google Scholar] [CrossRef] [PubMed]
- Liu, Q.; Wang, C.; Meng, Q.; Huo, X.; Sun, H.; Peng, J.; Ma, X.; Sun, P.; Liu, K. Mdr1 and oat1/oat3 mediate the drug-drug interaction between puerarin and methotrexate. Pharm. Res. 2014, 31, 1120–1132. [Google Scholar] [CrossRef] [PubMed]
- Kim, W.Y.; Benet, L.Z. P-glycoprotein (p-gp/mdr1)-mediated efflux of sex-steroid hormones and modulation of p-gp expression in vitro. Pharm. Res. 2004, 21, 1284–1293. [Google Scholar] [CrossRef] [PubMed]
- Cherkasov, A.; Muratov, E.N.; Fourches, D.; Varnek, A.; Baskin, I.I.; Cronin, M.; Dearden, J.; Gramatica, P.; Martin, Y.C.; Todeschini, R.; et al. Qsar modeling: Where have you been? Where are you going to? J. Med. Chem. 2014, 57, 4977–5010. [Google Scholar] [CrossRef] [PubMed]
- McIver, Z.A.; Kryman, M.W.; Choi, Y.; Coe, B.N.; Schamerhorn, G.A.; Linder, M.K.; Davies, K.S.; Hill, J.E.; Sawada, G.A.; Grayson, J.M.; et al. Selective photodepletion of malignant t cells in extracorporeal photopheresis with selenorhodamine photosensitizers. Bioorg. Med. Chem. 2016, 24, 3918–3931. [Google Scholar] [CrossRef] [PubMed]
- Lee, W.; Crawford, J.J.; Aliagas, I.; Murray, L.J.; Tay, S.; Wang, W.; Heise, C.E.; Hoeflich, K.P.; La, H.; Mathieu, S.; et al. Synthesis and evaluation of a series of 4-azaindole-containing p21-activated kinase-1 inhibitors. Bioorg. Med. Chem. Lett. 2016, 26, 3518–3524. [Google Scholar] [CrossRef] [PubMed]
- Hitchcock, S.A. Structural modifications that alter the p-glycoprotein efflux properties of compounds. J. Med. Chem. 2012, 55, 4877–4895. [Google Scholar] [CrossRef] [PubMed]
- Tropsha, A.; Gramatica, P.; Gombar, V.K. The importance of being earnest: Validation is the absolute essential for successful application and interpretation of qspr models. QSAR Comb. Sci. 2003, 22, 69–77. [Google Scholar] [CrossRef]
- Rücker, C.; Rücker, G.; Meringer, M. Y-randomization and its variants in qspr/qsar. J. Chem. Inf. Model. 2007, 47, 2345–2357. [Google Scholar] [CrossRef] [PubMed]
- Netzeva, T.I.; Worth, A.; Aldenberg, T.; Benigni, R.; Cronin, M.T.D.; Gramatica, P.; Jaworska, J.S.; Kahn, S.; Klopman, G.; Marchant, C.A.; et al. Current status of methods for defining the applicability domain of (quantitative) structure-activity relationships : The report and recommendations of ecvam workshop 52. Altern. Lab. Anim. 2005, 33, 1–19. [Google Scholar]
- Golbraikh, A.; Shen, M.; Xiao, Z.Y.; Xiao, Y.D.; Lee, K.H.; Tropsha, A. Rational selection of training and test sets for the development of validated qsar models. J. Comput.-Aided Mol. Des. 2003, 17, 241–253. [Google Scholar] [CrossRef] [PubMed]
- Ojha, P.K.; Mitra, I.; Das, R.N.; Roy, K. Further exploring rm2 metrics for validation of qspr models. Chemometr. Intell. Lab. Syst. 2011, 107, 194–205. [Google Scholar] [CrossRef]
- Roy, K.; Mitra, I.; Kar, S.; Ojha, P.K.; Das, R.N.; Kabir, H. Comparative studies on some metrics for external validation of qspr models. J. Chem. Inf. Model. 2012, 52, 396–408. [Google Scholar] [CrossRef] [PubMed]
- Chirico, N.; Gramatica, P. Real external predictivity of qsar models. Part 2. New intercomparable thresholds for different validation criteria and the need for scatter plot inspection. J. Chem. Inf. Model. 2012, 52, 2044–2058. [Google Scholar] [CrossRef] [PubMed]
- Topliss, J.G.; Edwards, R.P. Chance factors in studies of quantitative structure-activity relationships. J. Med. Chem. 1979, 22, 1238–1244. [Google Scholar] [CrossRef] [PubMed]
- Desai, P.V.; Raub, T.J.; Blanco, M.J. How hydrogen bonds impact p-glycoprotein transport and permeability. Bioorg. Med. Chem. Lett. 2012, 22, 6540–6548. [Google Scholar] [CrossRef] [PubMed]
- Teixeira, V.H.; Vila-Viçosa, D.; Baptista, A.M.; Machuqueiro, M. Protonation of dmpc in a bilayer environment using a linear response approximation. J. Chem. Theory Comput. 2014, 10, 2176–2184. [Google Scholar] [CrossRef] [PubMed]
- Clay, A.T.; Sharom, F.J. Lipid bilayer properties control membrane partitioning, binding, and transport of p-glycoprotein substrates. Biochemistry 2013, 52, 343–354. [Google Scholar] [CrossRef] [PubMed]
- Raub, T.J. P-glycoprotein recognition of substrates and circumvention through rational drug design. Mol. Pharmaceutics 2006, 3, 3–25. [Google Scholar] [CrossRef]
- Suzuki, T.; Fukazawa, N.; San-nohe, K.; Sato, W.; Yano, O.; Tsuruo, T. Structure-activity relationship of newly synthesized quinoline derivatives for reversal of multidrug resistance in cancer. J. Med. Chem. 1997, 40, 2047–2052. [Google Scholar] [CrossRef] [PubMed]
- Prasanna, S.; Doerksen, R.J. Topological polar surface area: A useful descriptor in 2d-qsar. Curr. Med. Chem. 2009, 16, 21–41. [Google Scholar] [CrossRef] [PubMed]
- Ferté, J. Analysis of the tangled relationships between p-glycoprotein-mediated multidrug resistance and the lipid phase of the cell membrane. Eur. J. Biochem. 2000, 267, 277–294. [Google Scholar] [CrossRef] [PubMed]
- Johnson, T.W.; Dress, K.R.; Edwards, M. Using the golden triangle to optimize clearance and oral absorption. Bioorg. Med. Chem. Lett. 2009, 19, 5560–5564. [Google Scholar] [CrossRef] [PubMed]
- Pettersson, M.; Hou, X.; Kuhn, M.; Wager, T.T.; Kauffman, G.W.; Verhoest, P.R. Quantitative assessment of the impact of fluorine substitution on p-glycoprotein (p-gp) mediated efflux, permeability, lipophilicity, and metabolic stability. J. Med. Chem. 2016, 59, 5284–5296. [Google Scholar] [CrossRef] [PubMed]
- Jabeen, I.; Wetwitayaklung, P.; Klepsch, F.; Parveen, Z.; Chiba, P.; Ecker, G.F. Probing the stereoselectivity of p-glycoprotein-synthesis, biological activity and ligand docking studies of a set of enantiopure benzopyrano[3,4-b][1,4]oxazines. Chem. Commun. 2011, 47, 2586–2588. [Google Scholar] [CrossRef] [PubMed]
- Rezai, T.; Bock, J.E.; Zhou, M.V.; Kalyanaraman, C.; Lokey, R.S.; Jacobson, M.P. Conformational flexibility, internal hydrogen bonding, and passive membrane permeability: Successful in silico prediction of the relative permeabilities of cyclic peptides. J. Am. Chem. Soc. 2006, 128, 14073–14080. [Google Scholar] [CrossRef] [PubMed]
- Rauch, C.; Paine, S.W.; Littlewood, P. Can long range mechanical interaction between drugs and membrane proteins define the notion of molecular promiscuity? Application to p-glycoprotein-mediated multidrug resistance (mdr). Biochim. Biophys. Acta-Gen. Subj. 2013, 1830, 5112–5118. [Google Scholar] [CrossRef] [PubMed]
- Declèves, X.; Jacob, A.; Yousif, S.; Shawahna, R.; Potin, S.; Scherrmann, J.-M. Interplay of drug metabolizing cyp450 enzymes and abc transporters in the blood-brain barrier. Curr. Drug MeTable 2011, 12, 732–741. [Google Scholar] [CrossRef]
- Passeleu-Le Bourdonnec, C.; Carrupt, P.-A.; Scherrmann, J.; Martel, S. Methodologies to assess drug permeation through the blood–brain barrier for pharmaceutical research. Pharm. Res. 2013, 30, 2729–2756. [Google Scholar] [CrossRef] [PubMed]
- Leong, M.K. In silico prediction of the blood-brain barrier permeation: Are we there yet? Med. Chem. 2015, 5, 130. [Google Scholar] [CrossRef]
- Cammi, R.; Tomasi, J. Remarks on the use of the apparent surface charges (asc) methods in solvation problems: Iterative versus matrix-inversion procedures and the renormalization of the apparent charges. J. Comput. Chem. 1995, 16, 1449–1458. [Google Scholar] [CrossRef]
- Miertuš, S.; Scrocco, E.; Tomasi, J. Electrostatic interaction of a solute with a continuum. A direct utilizaion of ab initio molecular potentials for the prevision of solvent effects. Chem. Phys. 1981, 55, 117–129. [Google Scholar] [CrossRef]
- Besler, B.H.; Merz, K.M.J.; Kollman, P.A. Atomic charges derived from semiempirical methods. J. Comput. Chem. 1990, 11, 431–439. [Google Scholar] [CrossRef]
- Kettaneh, N.; Berglund, A.; Wold, S. Pca and pls with very large data sets. Comput. Stat. Data Anal. 2005, 48, 69–85. [Google Scholar] [CrossRef]
- Tseng, Y.J.; Hopfinger, A.J.; Esposito, E.X. The great descriptor melting pot: Mixing descriptors for the common good of qsar models. J. Comput. Aided Mol. Des. 2012, 26, 39–43. [Google Scholar] [CrossRef] [PubMed]
- Burden, F.R.; Ford, M.G.; Whitley, D.C.; Winkler, D.A. Use of automatic relevance determination in qsar studies using bayesian neural networks. J. Chem. Inf. Comput. Sci. 2000, 40, 1423–1430. [Google Scholar] [CrossRef] [PubMed]
- Rogers, D.; Hopfinger, A.J. Application of genetic function approximation to quantitative structure-activity relationships and quantitative structure-property relationships. J. Chem. Inf. Comput. Sci. 1994, 34, 854–866. [Google Scholar] [CrossRef]
- Guyon, I.; Weston, J.; Barnhill, S.; Vapnik, V. Gene selection for cancer classification using support vector machines. Mach. Learn. 2002, 46, 389–422. [Google Scholar] [CrossRef]
- Kennard, R.W.; Stone, L.A. Computer aided design of experiments. Technometrics 1969, 11, 137–148. [Google Scholar] [CrossRef]
- Tropsha, A. Recent trends in statistical qsar modeling of environmental chemical toxicity. In Molecular, Clinical and Environmental Toxicology. Volume 3: Environmental Toxicology; Luch, A., Ed.; Springer Basel: New York, NY, USA, 2012; Volume 101, pp. 381–411. [Google Scholar]
- Cortes, C.; Vapnik, V. Support-vector networks. Mach. Learn. 1995, 20, 273–297. [Google Scholar] [CrossRef] [Green Version]
- Vapnik, V.; Golowich, S.; Smola, A. Support Vector Method for Function Approximation, Regression Estimation, and Signal Processing, Advances in Neural Information Processing Systems 9; Mozer, M., Jordan, M.I., Petsche, T., Eds.; MIT Press: Cambridge, MA, USA, 1997; pp. 281–287. [Google Scholar]
- Schölkopf, B.; Smola, A. Learning with Kernels: Support Vector Machines, Regularization, Optimization, and Beyond, 1st ed.; MIT Press: Cambridge, MA, USA, 2002. [Google Scholar]
- Kecman, V. Learning and Soft Computing :Support Vector Machines, Neural Networks, and Fuzzy Logic Models; MIT Press: Cambridge, MA, USA, 2001; p. 576. [Google Scholar]
- Leong, M.K.; Syu, R.G.; Ding, Y.L.; Weng, C.F. Prediction of n-methyl-d-aspartate receptor glun1-ligand binding affinity by a novel svm-pose/svm-score combinatorial ensemble docking scheme. Sci. Rep. 2017, 7, 40053. [Google Scholar] [CrossRef] [PubMed]
- Dearden, J.C.; Cronin, M.T.D.; Kaiser, K.L.E. How not to develop a quantitative structure–activity or structure–property relationship (qsar/qspr). SAR QSAR Environ. Res. 2009, 20, 241–266. [Google Scholar] [CrossRef] [PubMed]
- Breiman, L.; Spector, P. Submodel selection and evaluation in regression. The x-random case. Int. Stat. Rev. 1992, 60, 291–319. [Google Scholar] [CrossRef]
- Shi, L.M.; Fang, H.; Tong, W.; Wu, J.; Perkins, R.; Blair, R.M.; Branham, W.S.; Dial, S.L.; Moland, C.L.; Sheehan, D.M. Qsar models using a large diverse set of estrogens. J. Chem. Inf. Comput. Sci. 2001, 41, 186–195. [Google Scholar] [CrossRef] [PubMed]
- Schüürmann, G.; Ebert, R.U.; Chen, J.; Wang, B.; Kühne, R. External validation and prediction employing the predictive squared correlation coefficient-test set activity mean vs training set activity mean. J. Chem. Inf. Model. 2008, 48, 2140–2145. [Google Scholar] [CrossRef] [PubMed]
- Consonni, V.; Ballabio, D.; Todeschini, R. Comments on the definition of the q2 parameter for qsar validation. J. Chem. Inf. Model. 2009, 49, 1669–1678. [Google Scholar] [CrossRef] [PubMed]
- Chirico, N.; Gramatica, P. Real external predictivity of qsar models: How to evaluate it? Comparison of different validation criteria and proposal of using the concordance correlation coefficient. J. Chem. Inf. Model. 2011, 51, 2320–2335. [Google Scholar] [CrossRef] [PubMed]
- Gramatica, P.; Chirico, N.; Papa, E.; Cassani, S.; Kovarich, S. Qsarins: A new software for the development, analysis, and validation of qsar mlr models. J. Comput. Chem. 2013, 34, 2121–2132. [Google Scholar] [CrossRef]
- Gramatica, P.; Cassani, S.; Chirico, N. Qsarins-chem: Insubria datasets and new qsar/qspr models for environmental pollutants in qsarins. J. Comput. Chem. 2014, 35, 1036–1044. [Google Scholar] [CrossRef] [PubMed]
- Gramatica, P.; Sangion, A. A historical excursus on the statistical validation parameters for qsar models: A clarification concerning metrics and terminology. J. Chem. Inf. Model. 2016, 56, 1127–1131. [Google Scholar] [CrossRef] [PubMed]
Sample Availability: Not available. |


| Descriptor | SVR A | SVR B | SVR C | Description |
|---|---|---|---|---|
| SA | x† | Total surface area | ||
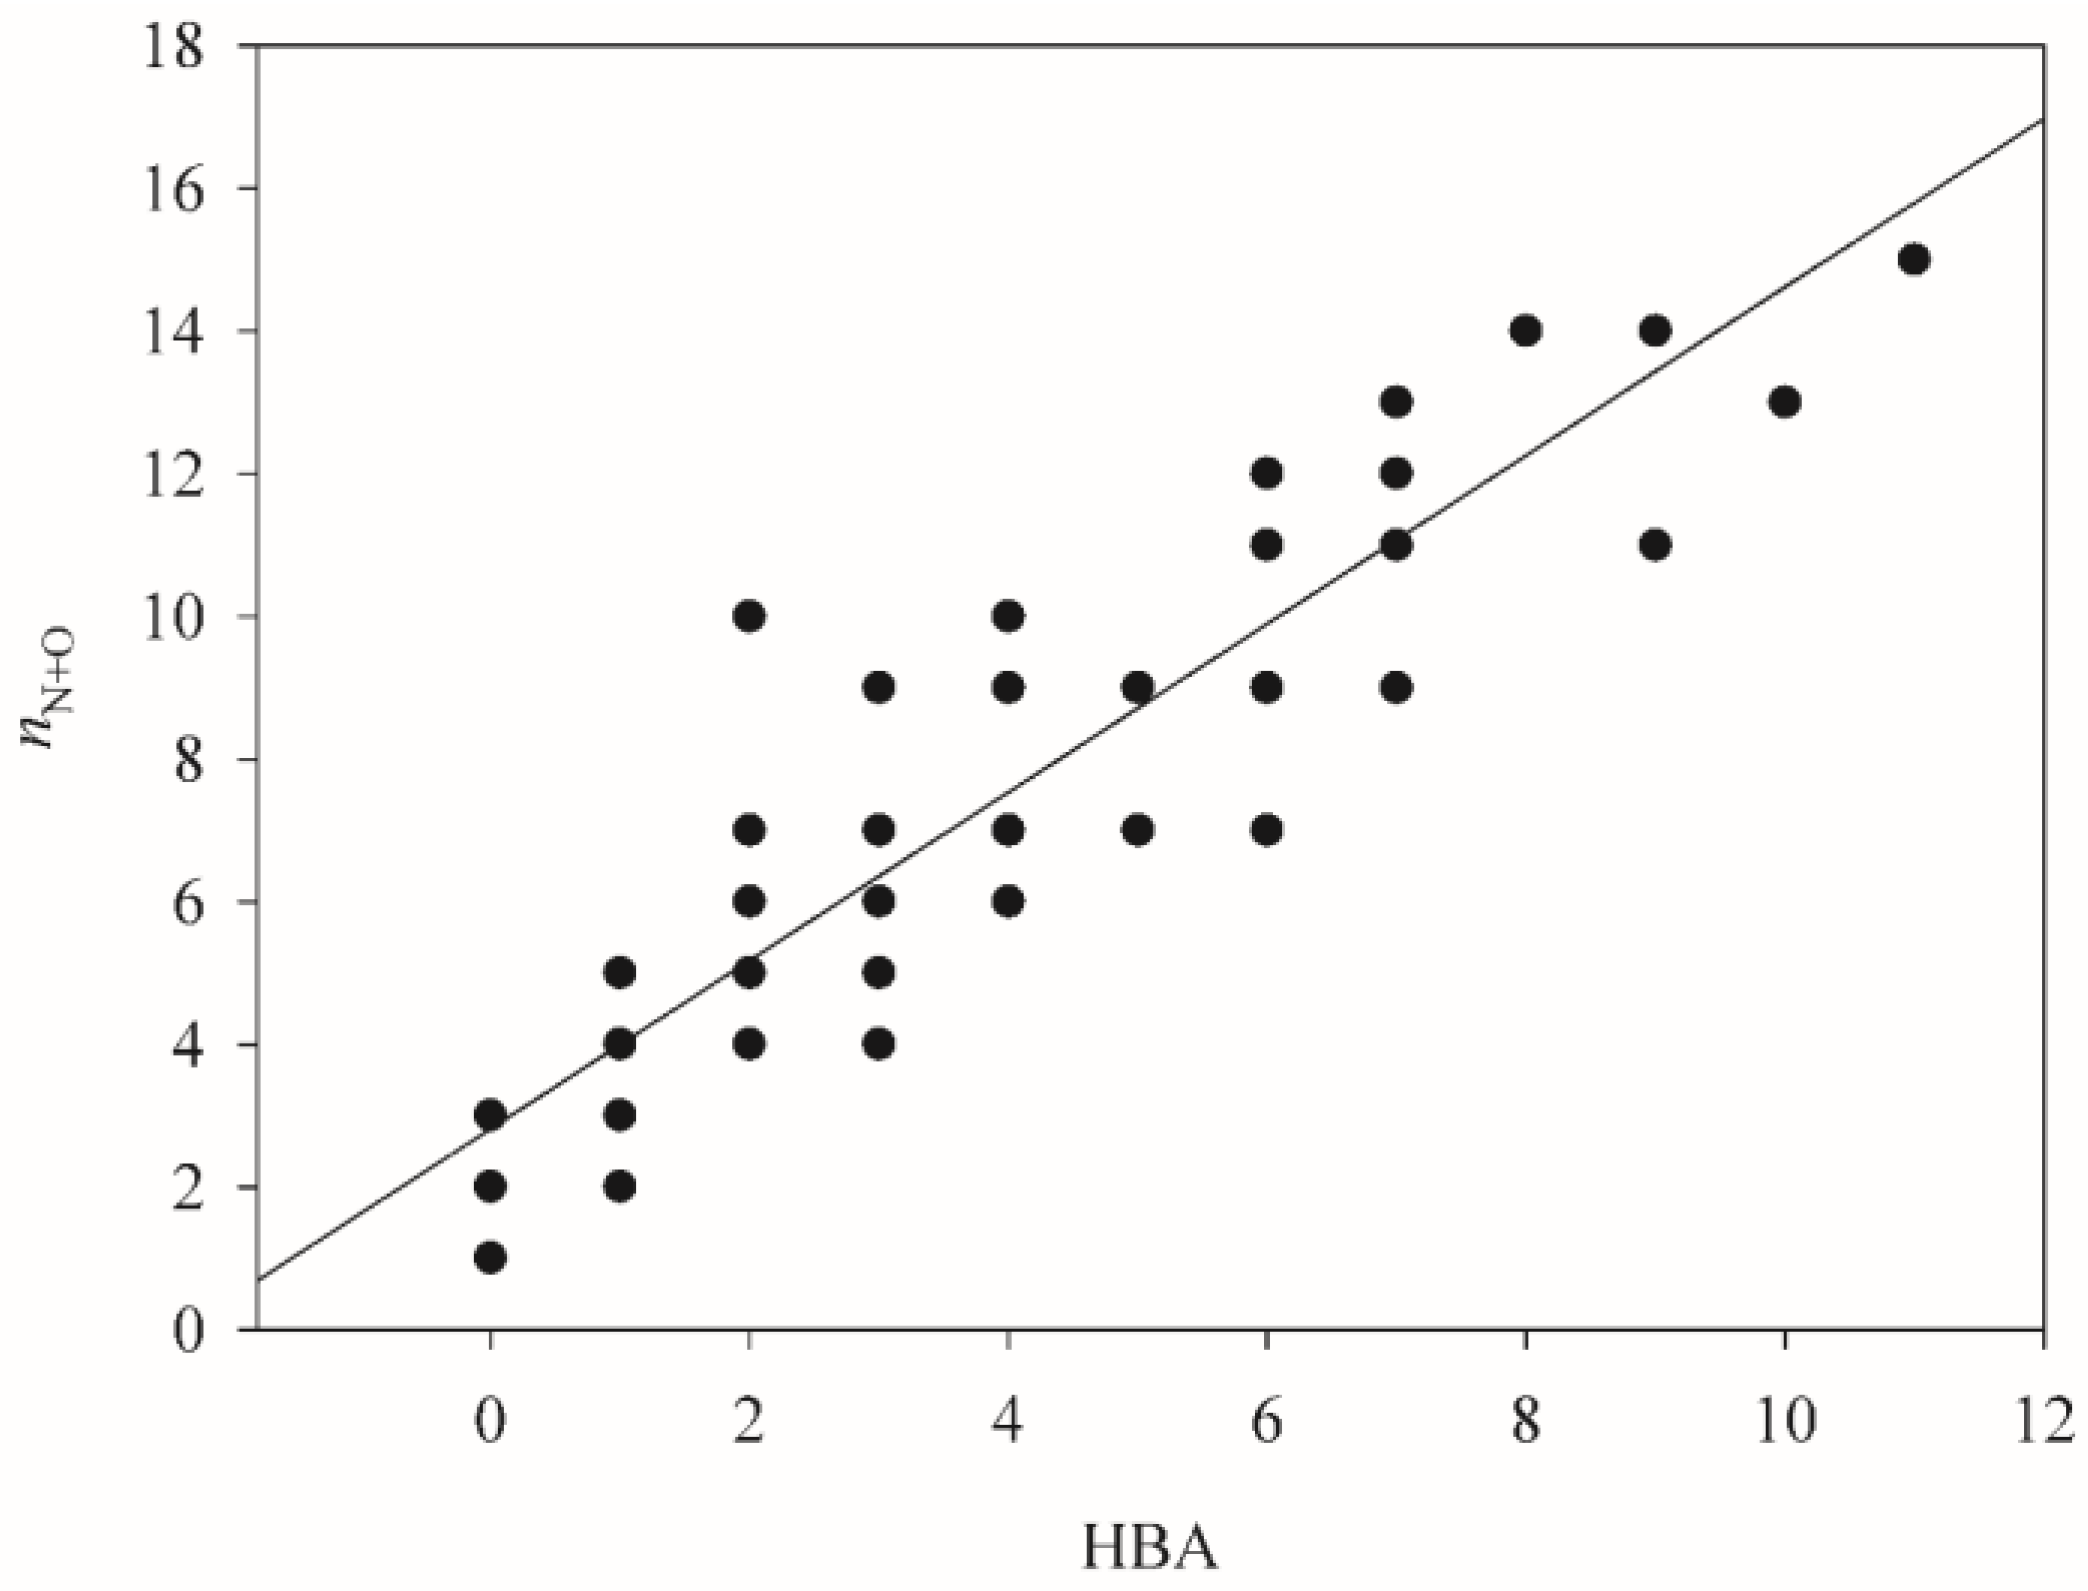
| nN+O | x | x | Number of nitrogen and oxygen atoms | |
| Vm | x | x | x | Molecule volume |
| PSA | x | x | Polar surface area | |
| HBD | x | x | Number of hydrogen bond donating groups | |
| nRot | x | x | Number of rotatable bonds | |
| nAr | x | Number of aromatic rings |
| SVR A | SVR B | SVR C | HSVR | |
|---|---|---|---|---|
| r2 | 0.95 | 0.95 | 0.98 | 0.96 |
| ΔMax | 0.32 | 0.51 | 0.40 | 0.45 |
| MAE | 0.11 | 0.07 | 0.02 | 0.06 |
| s | 0.12 | 0.10 | 0.06 | 0.10 |
| RMSE | 0.12 | 0.10 | 0.06 | 0.10 |
| 0.01 | 0.01 | 0.07 | 0.94 |
| SVR A | SVR B | SVR C | HSVR | |
|---|---|---|---|---|
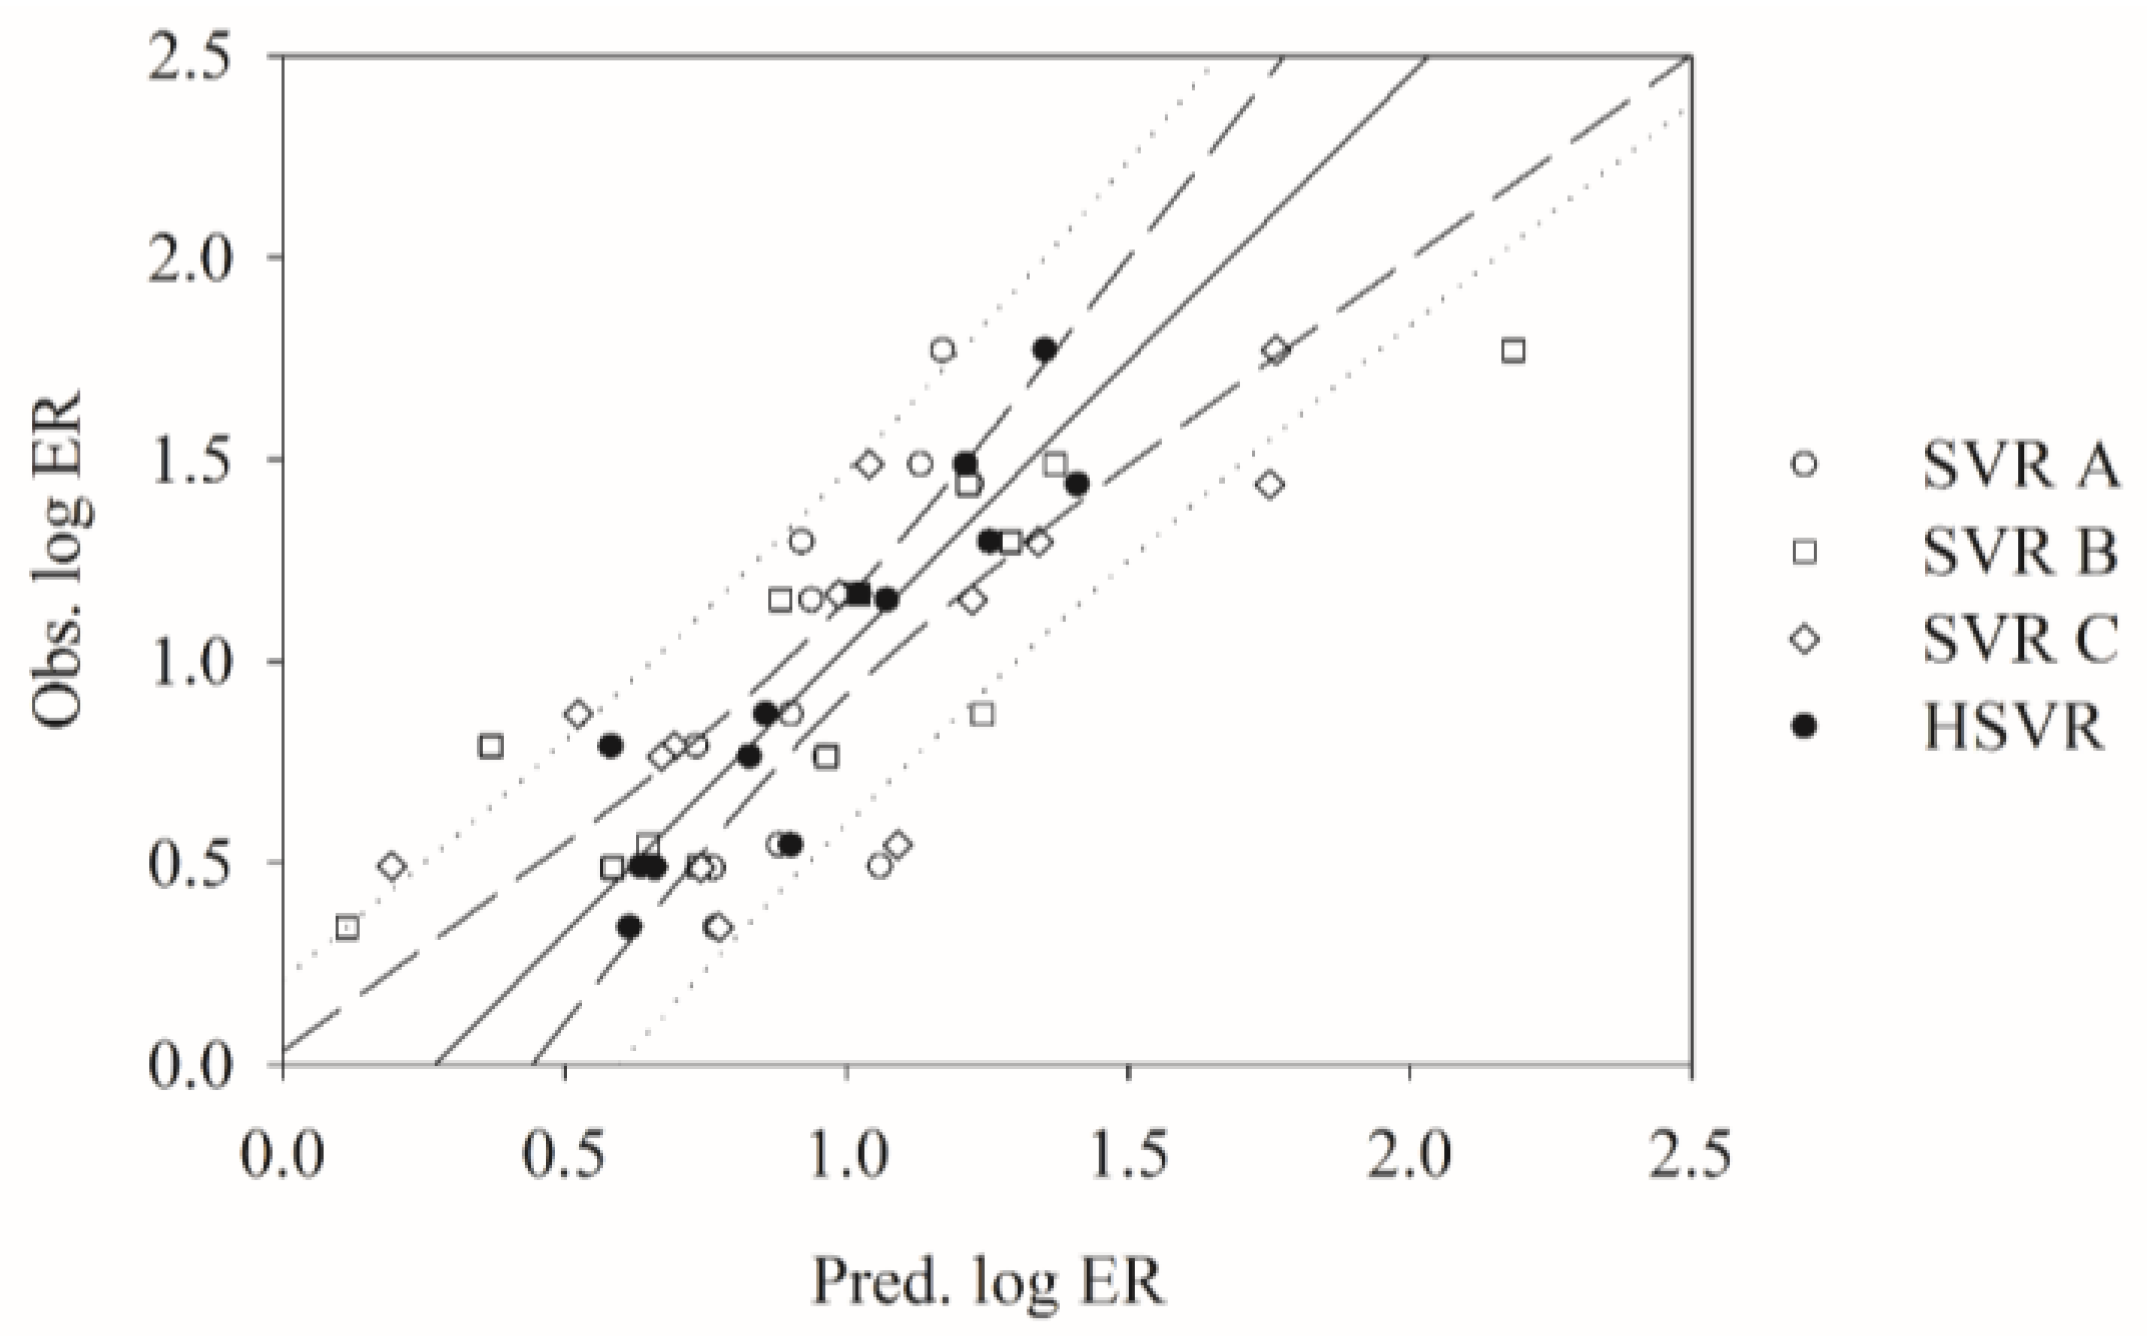
| q2 | 0.54 | 0.75 | 0.60 | 0.83 |
| 0.39 | 0.67 | 0.55 | 0.80 | |
| 0.39 | 0.67 | 0.54 | 0.80 | |
| 0.38 | 0.66 | 0.54 | 0.80 | |
| CCC | 0.45 | 0.86 | 0.78 | 0.87 |
| ΔMax | 0.60 | 0.42 | 0.55 | 0.42 |
| MAE | 0.29 | 0.22 | 0.24 | 0.17 |
| s | 0.35 | 0.26 | 0.30 | 0.22 |
| RMSE | 0.34 | 0.25 | 0.29 | 0.21 |
| Training Set | Test Set | |
|---|---|---|
| n | 50 | 13 |
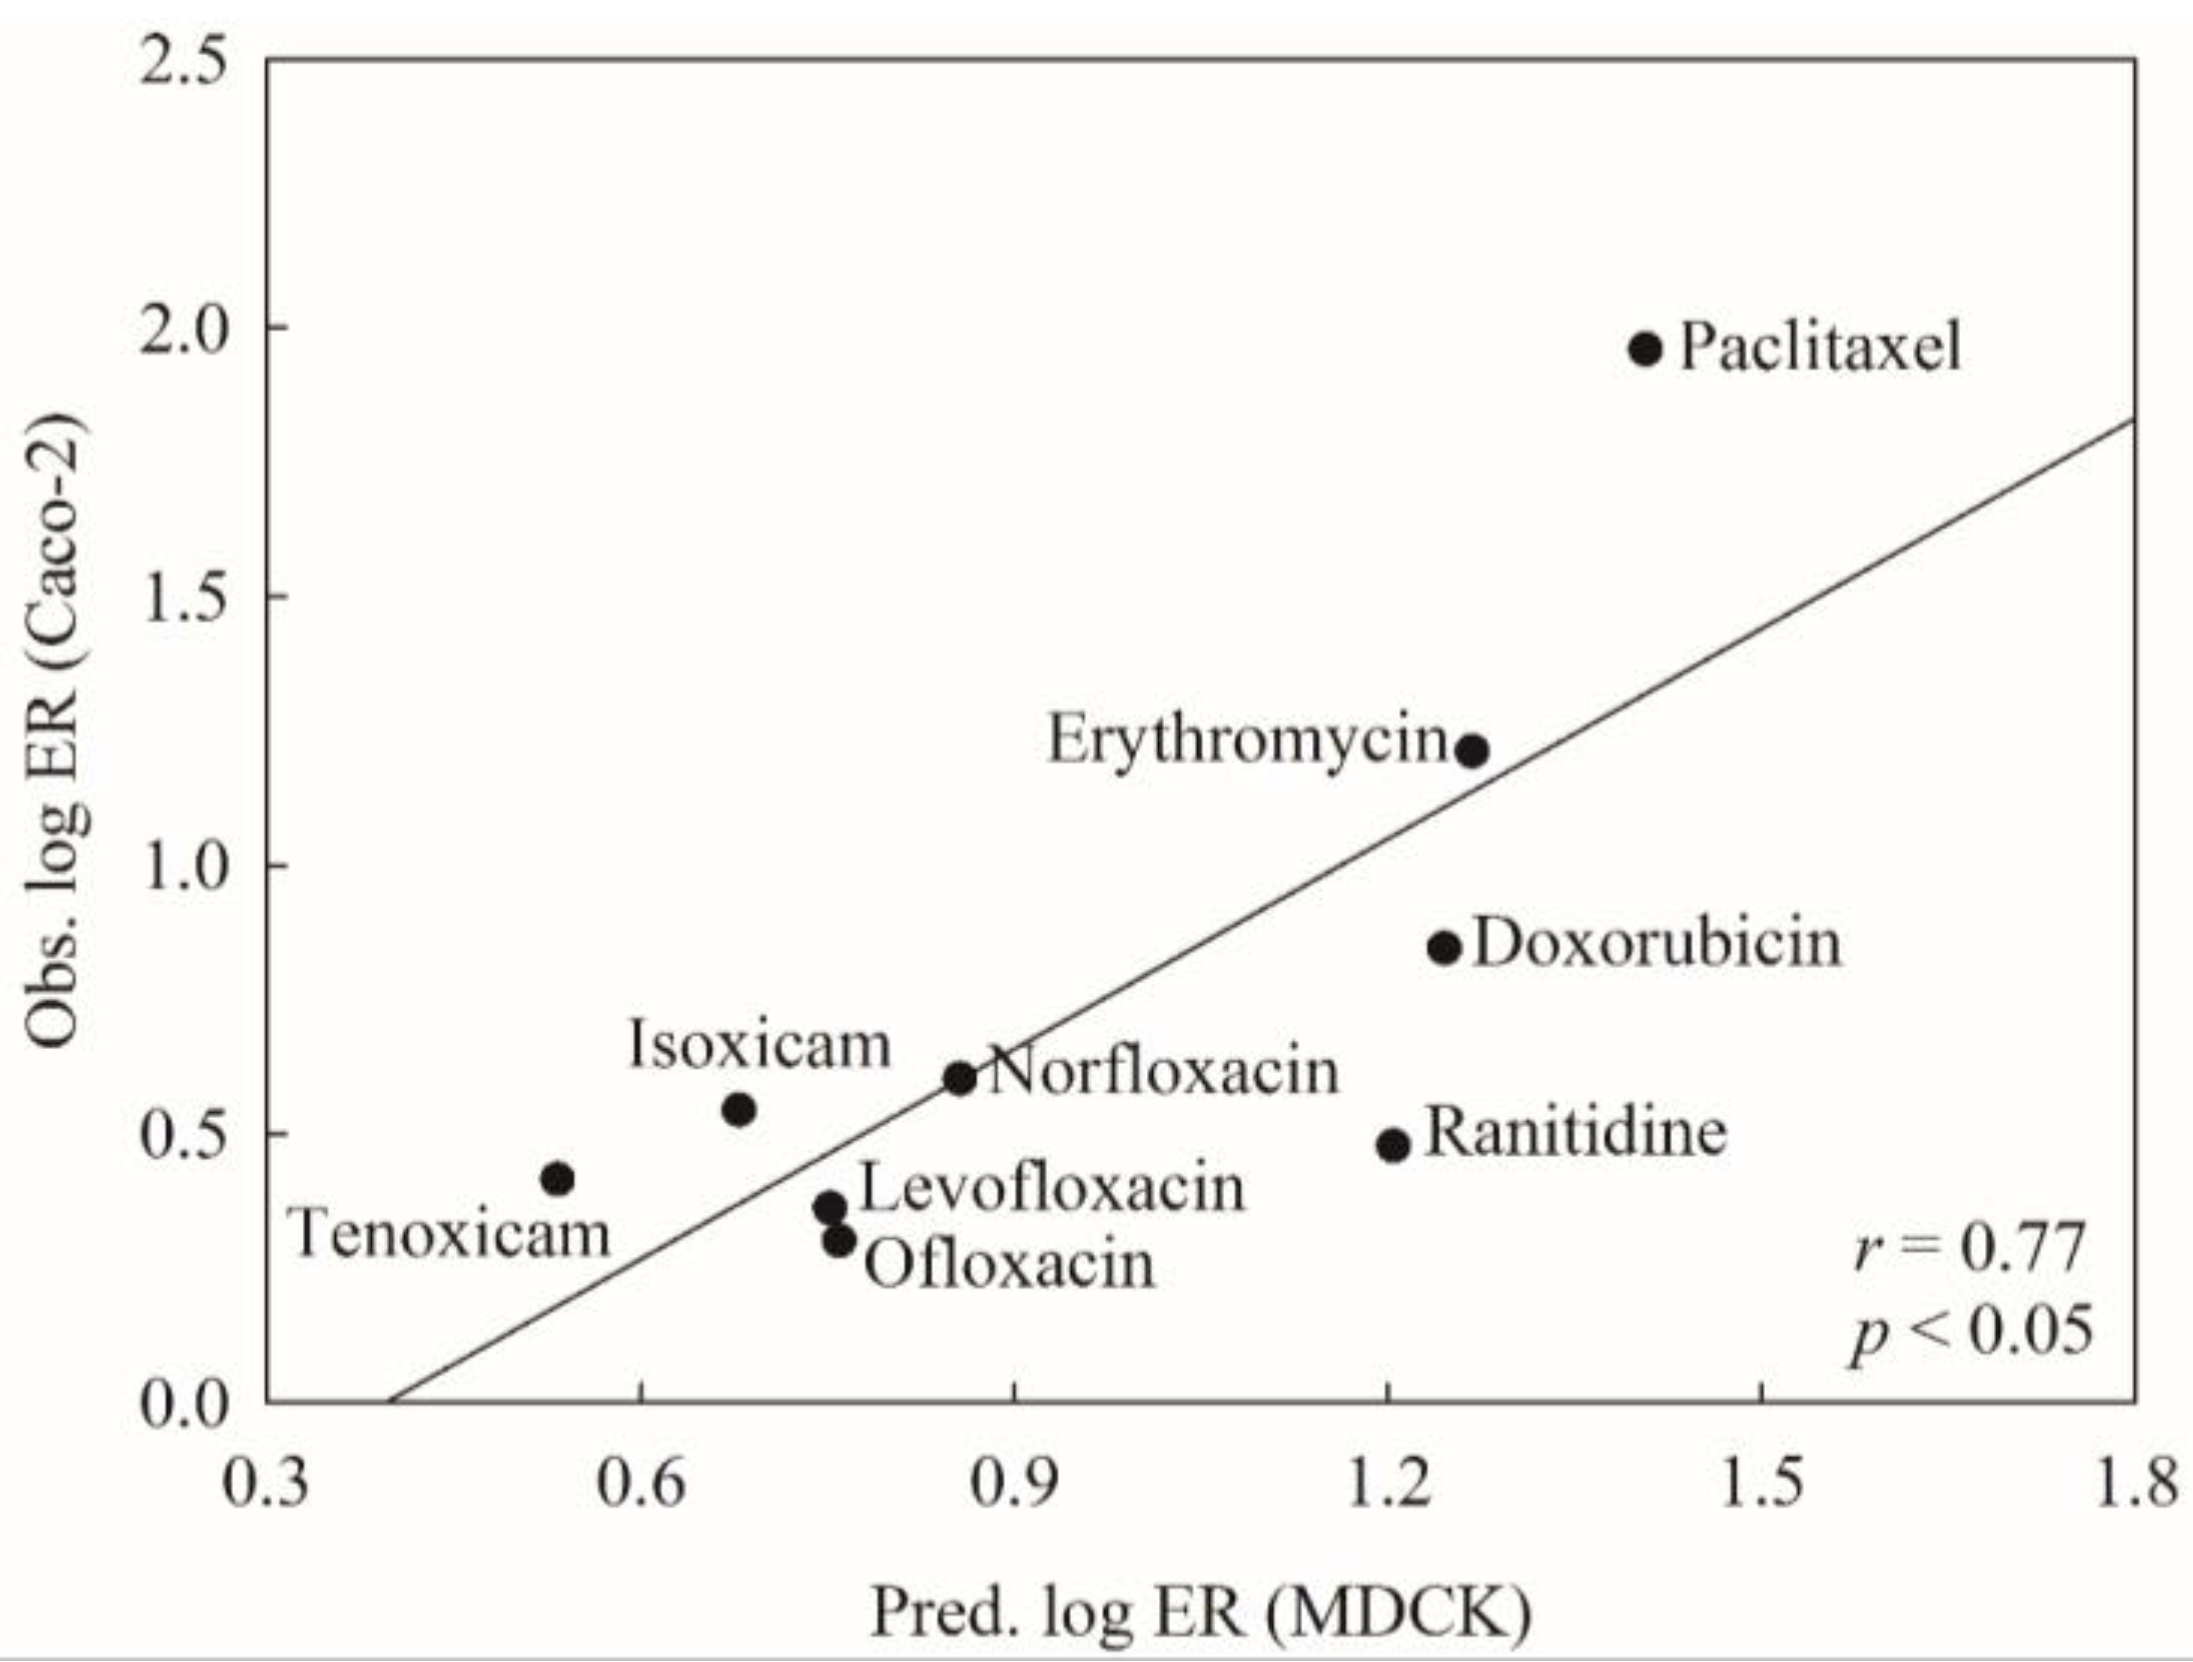
| 0.95 | 0.77 | |
| k | 1.03 | 1.05 |
| 0.94 | 0.52 | |
| 0.90 | 0.72 | |
| 0.85 | 0.60 | |
| 0.88 | 0.66 | |
| 0.05 | 0.12 | |
| x | x | |
| x | N/A | |
| x | x | |
| x | x | |
| x | x | |
| x | x | |
| CCC ≥ 0.85 | N/A † | x |
© 2018 by the authors. Licensee MDPI, Basel, Switzerland. This article is an open access article distributed under the terms and conditions of the Creative Commons Attribution (CC BY) license (http://creativecommons.org/licenses/by/4.0/).
Share and Cite
Chen, C.; Lee, M.-H.; Weng, C.-F.; Leong, M.K. Theoretical Prediction of the Complex P-Glycoprotein Substrate Efflux Based on the Novel Hierarchical Support Vector Regression Scheme. Molecules 2018, 23, 1820. https://doi.org/10.3390/molecules23071820
Chen C, Lee M-H, Weng C-F, Leong MK. Theoretical Prediction of the Complex P-Glycoprotein Substrate Efflux Based on the Novel Hierarchical Support Vector Regression Scheme. Molecules. 2018; 23(7):1820. https://doi.org/10.3390/molecules23071820
Chicago/Turabian StyleChen, Chun, Ming-Han Lee, Ching-Feng Weng, and Max K. Leong. 2018. "Theoretical Prediction of the Complex P-Glycoprotein Substrate Efflux Based on the Novel Hierarchical Support Vector Regression Scheme" Molecules 23, no. 7: 1820. https://doi.org/10.3390/molecules23071820