Evaluation of Lactic Acid Bacteria on the Inhibition of Vibrio parahaemolyticus Infection and Its Application to Food Systems

Department of Food Science and Technology, HungKuang University, No. 1018, Sec. 6, Taiwan Boulevard, Shalu District, Taichung City 43302, Taiwan
*
Author to whom correspondence should be addressed.
Molecules 2018, 23(5), 1238; https://doi.org/10.3390/molecules23051238
Submission received: 22 March 2018
/
Revised: 16 May 2018
/
Accepted: 22 May 2018
/
Published: 22 May 2018
(This article belongs to the Section Metabolites)
Abstract
:This study tested the effect of lactic acid bacteria (LAB) inhibition on Vibrio parahaemolyticus BCRC (Bioresource Collection and Research Center) 10806 and BCRC 12865 in a food model. MTT [3-(4,5-Dimethylthiazol-2-yl)-2,5-diphenyltetrazolium bromide] assays indicated that Caco-2 cells were not damaged after a two-hour treatment with lactic acid bacteria (LAB) and V. parahaemolyticus. The LAB cell culture and supernatant effectively inhibited the growth of V. parahaemolyticus in a food model. ELISA (Enzyme-linked immunosorbent assay) results indicated the significant inhibition of TNF-α; IL-1β; and IL-6; but Lactobacillus plantarum PM 222 and L. plantarum LP 735 did not significantly affect IL-8 levels. Real-time polymerase chain reaction (PCR) results indicated that LAB could inhibit the mRNA expression of proinflammatory cytokines IL-8; IL-6; and TNF-α; which were induced by V. parahaemolyticus. After rat-received LAB; the expression levels of TNF-α; IL-6; and IL-8 in the serum decreased significantly. In intestinal histology; the rat that received L. plantarum PM 222 and L. plantarum LP 010 was able to alleviate the intestinal villi damage caused by V. parahaemolyticus; which also helped reduce cell apoptosis. In conclusion; our results indicate that LAB can inhibit inflammatory responses caused by V. parahaemolyticus and can effectively inhibit the growth of V. parahaemolyticus in food products.
1. Introduction
Vibrio parahaemolyticus is a Gram-negative, halophilic, and facultative anaerobic bacterium that is widely distributed in brackish saltwater. V. parahaemolyticus causes foodborne gastroenteritis in all coastal countries and is the most common foodborne pathogen in Taiwan. Infection is mainly caused by the ingestion of seafood, and an infection with more than 105 colony forming units (CFU)/g of bacteria causes pathogenicity. The clinical signs of V. parahaemolyticus gastroenteritis include diarrhea, abdominal pain, nausea, vomiting, headache, fever, and shivering [1]. Patients with severe clinical symptoms of V. parahaemolyticus are treated with antibiotics such as chloramphenicol, cephalosporin, or tetracycline.
Shirazinejad et al. evaluated the effect of lactic acid application on fresh shrimp against V. parahaemolyticus. The results showed that V. parahaemolyticus was reduced by more than two log CFU/g after a 10 min immersion in 3% (v/v) lactic acid in shrimp, and no adverse changes in the sensory characteristics of the shrimp were observed [2]. Terzi et al. studied artificially contaminated mussels after 15 min immersion in 1% (v/v) lactic acid, with a reduction in the viability of V. parahaemolyticus greater than 3.38 log CFU/g [3]. Hwanhlem et al. stated that probiotic lactic acid bacteria (LAB) can completely inhibit the growth of V. parahaemolyticus within 24 h [4]. Xi added Lactobacillus plantarum ATCC (American Type Culture Collection) 8014 to artificial seawater to purify Pacific oysters and found that V. parahaemolyticus in oysters was significantly reduced (over 3.42 MPN/g) after five days of purging at 10 ± 1 °C, indicating lactobacilli can be applied to seafood purification at low temperatures to reduce V. parahaemolyticus [5].
Liu et al. demonstrated that Bacillus subtilis E20 (108 CFU/g feed) as a feed additive can effectively reduce the mortality of groupers infected with Iridovirus [6]. Cha et al. tested the survival of flounder (Paralichthys olivaceus) exposed to the pathogen Stretococus iniae and found that the diets with supplementation of B. subtilis resulted in lower mortality rates [7]. Probiotics typically affect the production of cytokines and chemokines, such as TNF-α, IL-6, IL-10, IL-12, and IFN-c, by innate and acquired immunity [8,9]. He et al. determined that B. subtilis C-3102 could enhance the adhesion of intestinal bacteria to the intestinal mucosa surface of Oreochromis niloticus ♀ × O. aureus ♂ and also enhance the secretion of intestinal cytokines such as IL-1β, TGF-β, and TNF-α [10].
In this study, we investigated whether LAB could inhibit the growth of V. parahaemolyticus in aquatic products using the sea bream fillet as a carrier of seafood products. ELISA and reverse transcription polymerase chain reaction (RT-PCR) were used to determine the concentration of inflammatory markers and mRNA expression in Caco-2, Raw 264.7, and HT-29 cells. Finally, BALB/c mice were used to explore the mechanism of LAB inhibition of intestinal inflammation caused by V. parahaemolyticus. Hematoxylin and eosin stain, and Terminal deoxynucleotidyl transferase dUTP nick end labeling (TUNEL) stain, were used to observe the intestinal cell damage and apoptosis caused by inflammation.
2. Results
2.1. Survival Rate of Caco-2 Cells Co-Cultured with V. parahaemolyticus and LAB
In this experiment, MTT [3-(4,5-Dimethylthiazol-2-yl)-2,5-diphenyltetrazolium bromide] assays were used to analyze the effect of LAB and V. parahaemolyticus on Caco-2 viability. The results showed that LAB and V. parahaemolyticus did not significantly damage cells after two hours of co-culture (Figure 1A). Four hours after co-cultivation, V. parahaemolyticus BCRC 10806 and BCRC 12865 harmed the cells, with BCRC 10806 causing the most significant damage. There was no difference in cell viability between the three strains of LAB (L. plantarum PM 222, LP 010, and LP 735) (Figure 1B).
2.2. LAB Suppresses V. parahaemolyticus in Food Mode
The growth of V. parahaemolyticus BCRC 10806 and BCRC 12865 were inhibited by co-culturing with LAB cells or supernatant of three LAB strains (L. plantarum PM 222, LP 010, and LP 735) at 4 °C for four hours (Table 1). Two strains of V. parahaemolyticus were also significantly inhibited after being co-cultured with the three strains (L. plantarum PM 222, LP 010, and LP 735) of LAB cells or their supernatant at room temperature for four hours (Table 1). Three LAB strains survived optimally after four hours of co-cultivation at 4 °C and room temperature (Table 2).
2.3. LAB Inhibit V. parahaemolyticus-Induced Secretion of Inflammatory Cytokines by HT-29 Intestinal Epithelial Cells or RAW 264.7 Macrophages
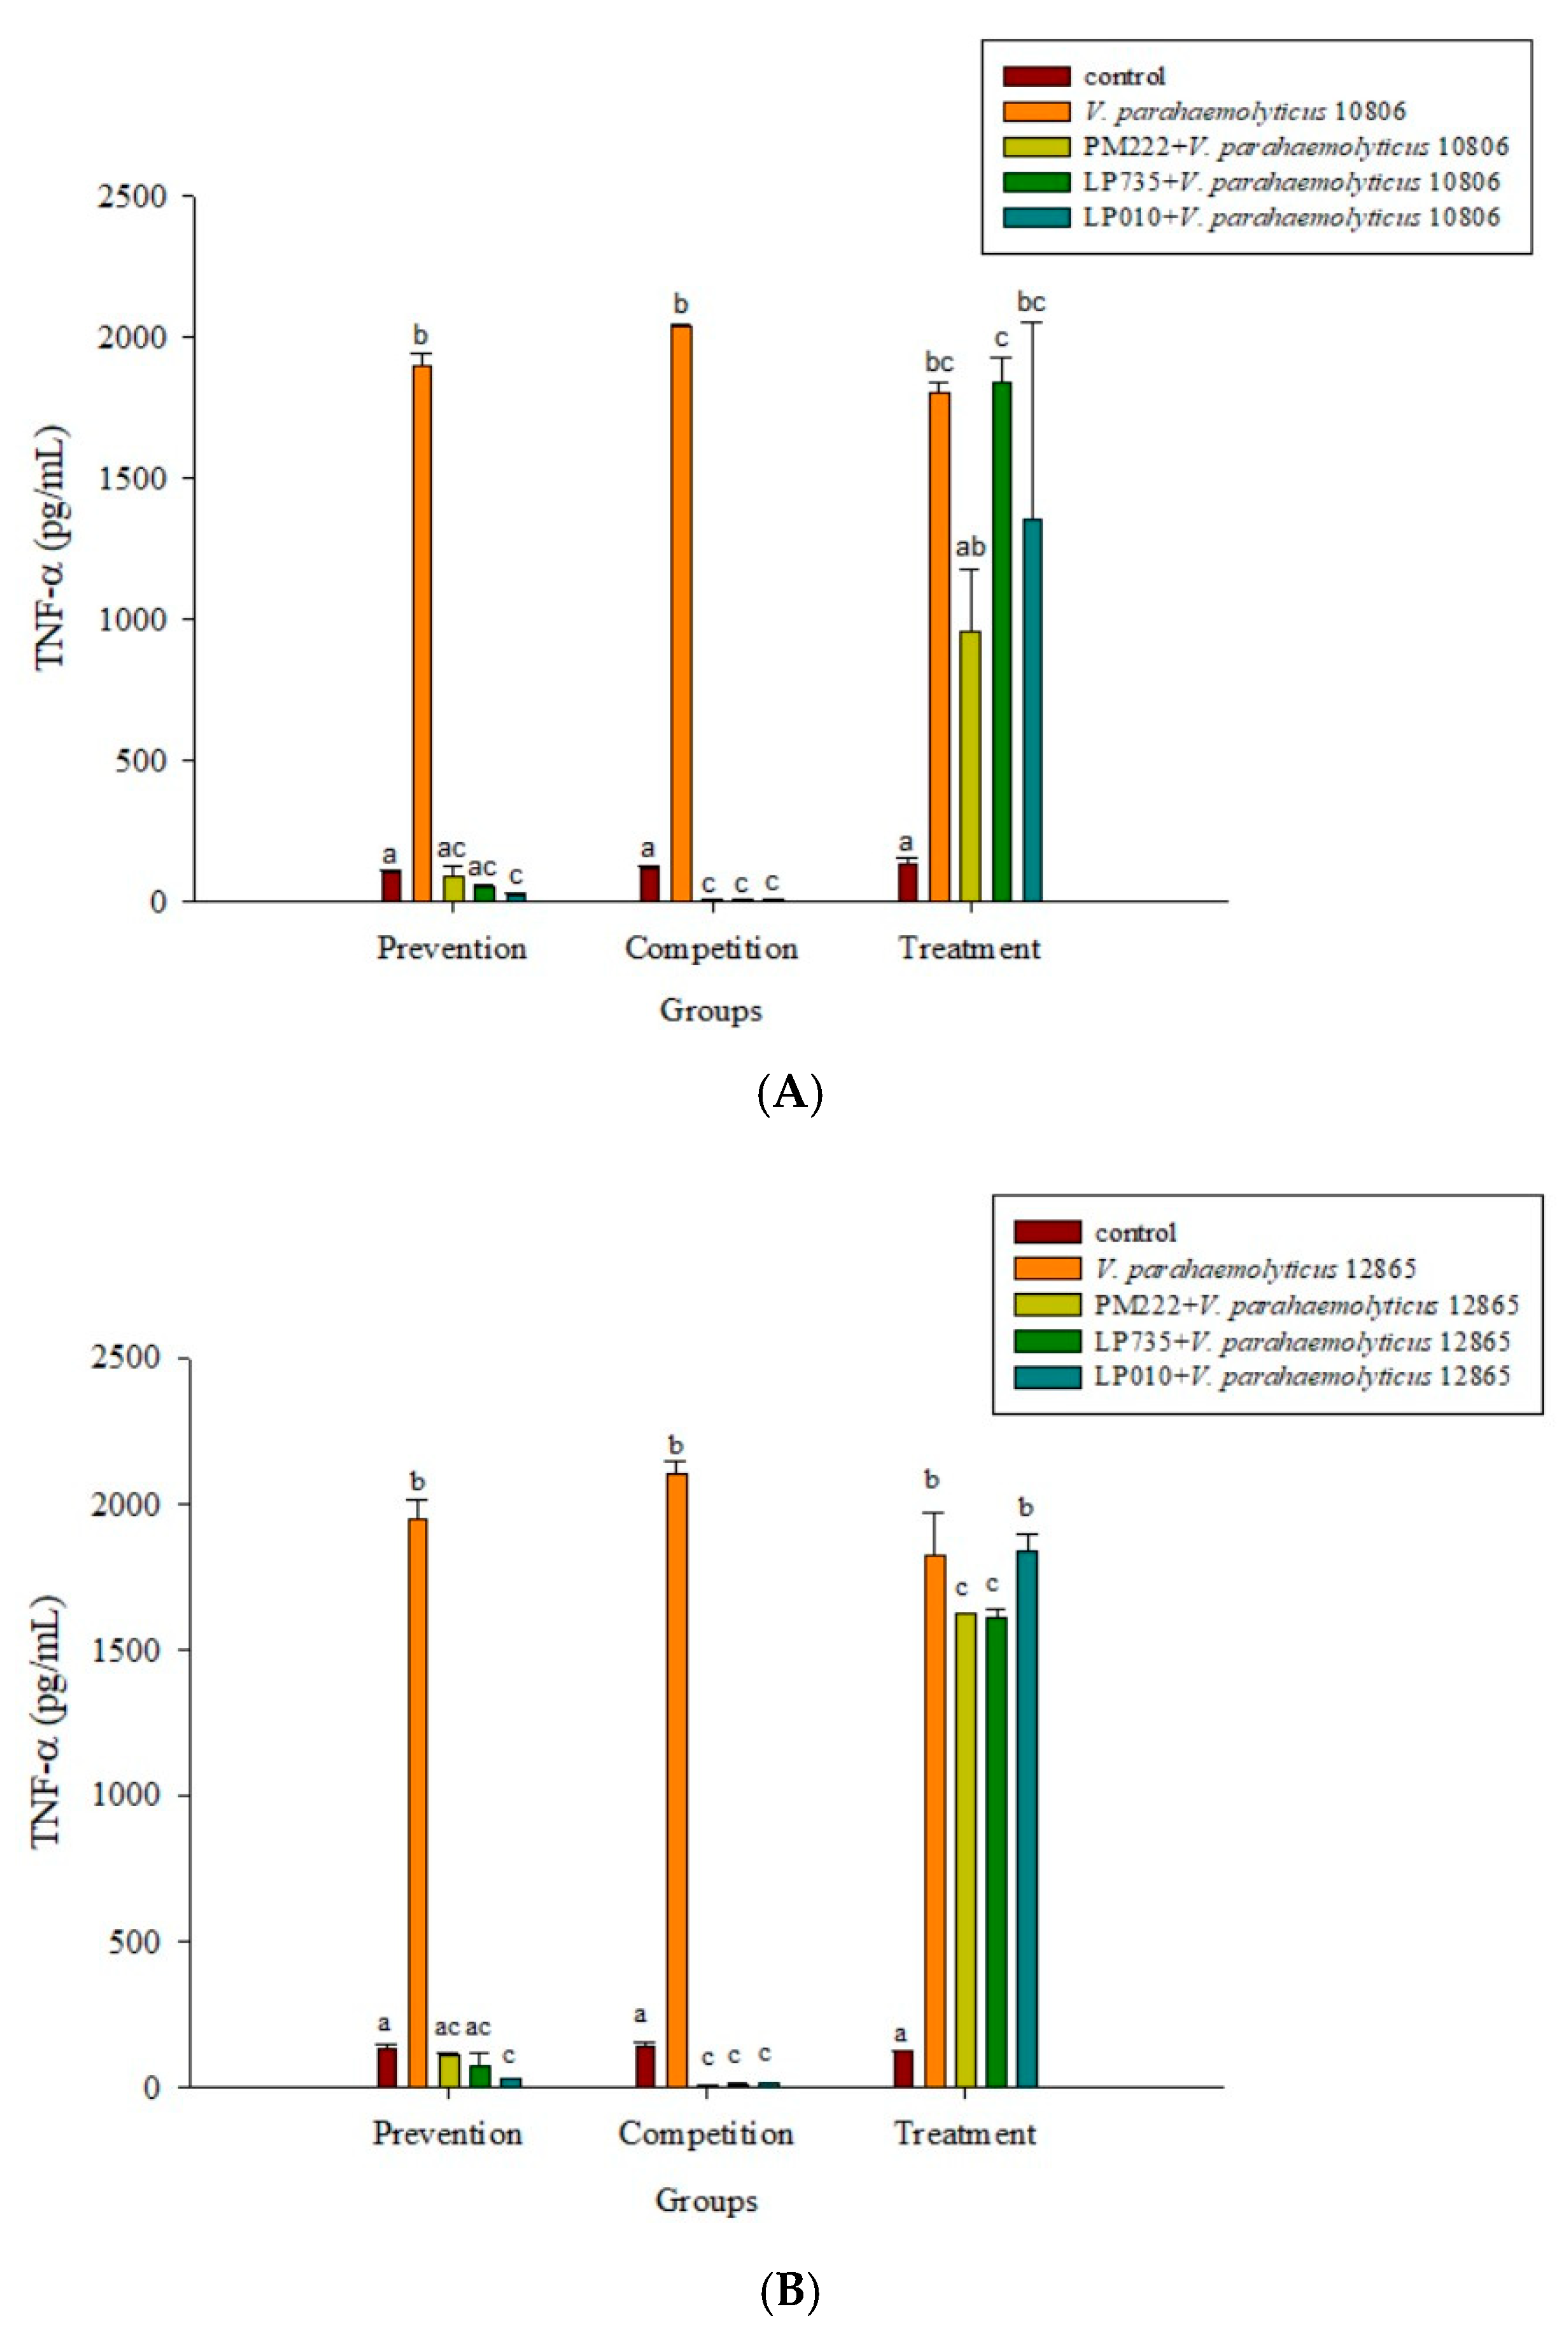
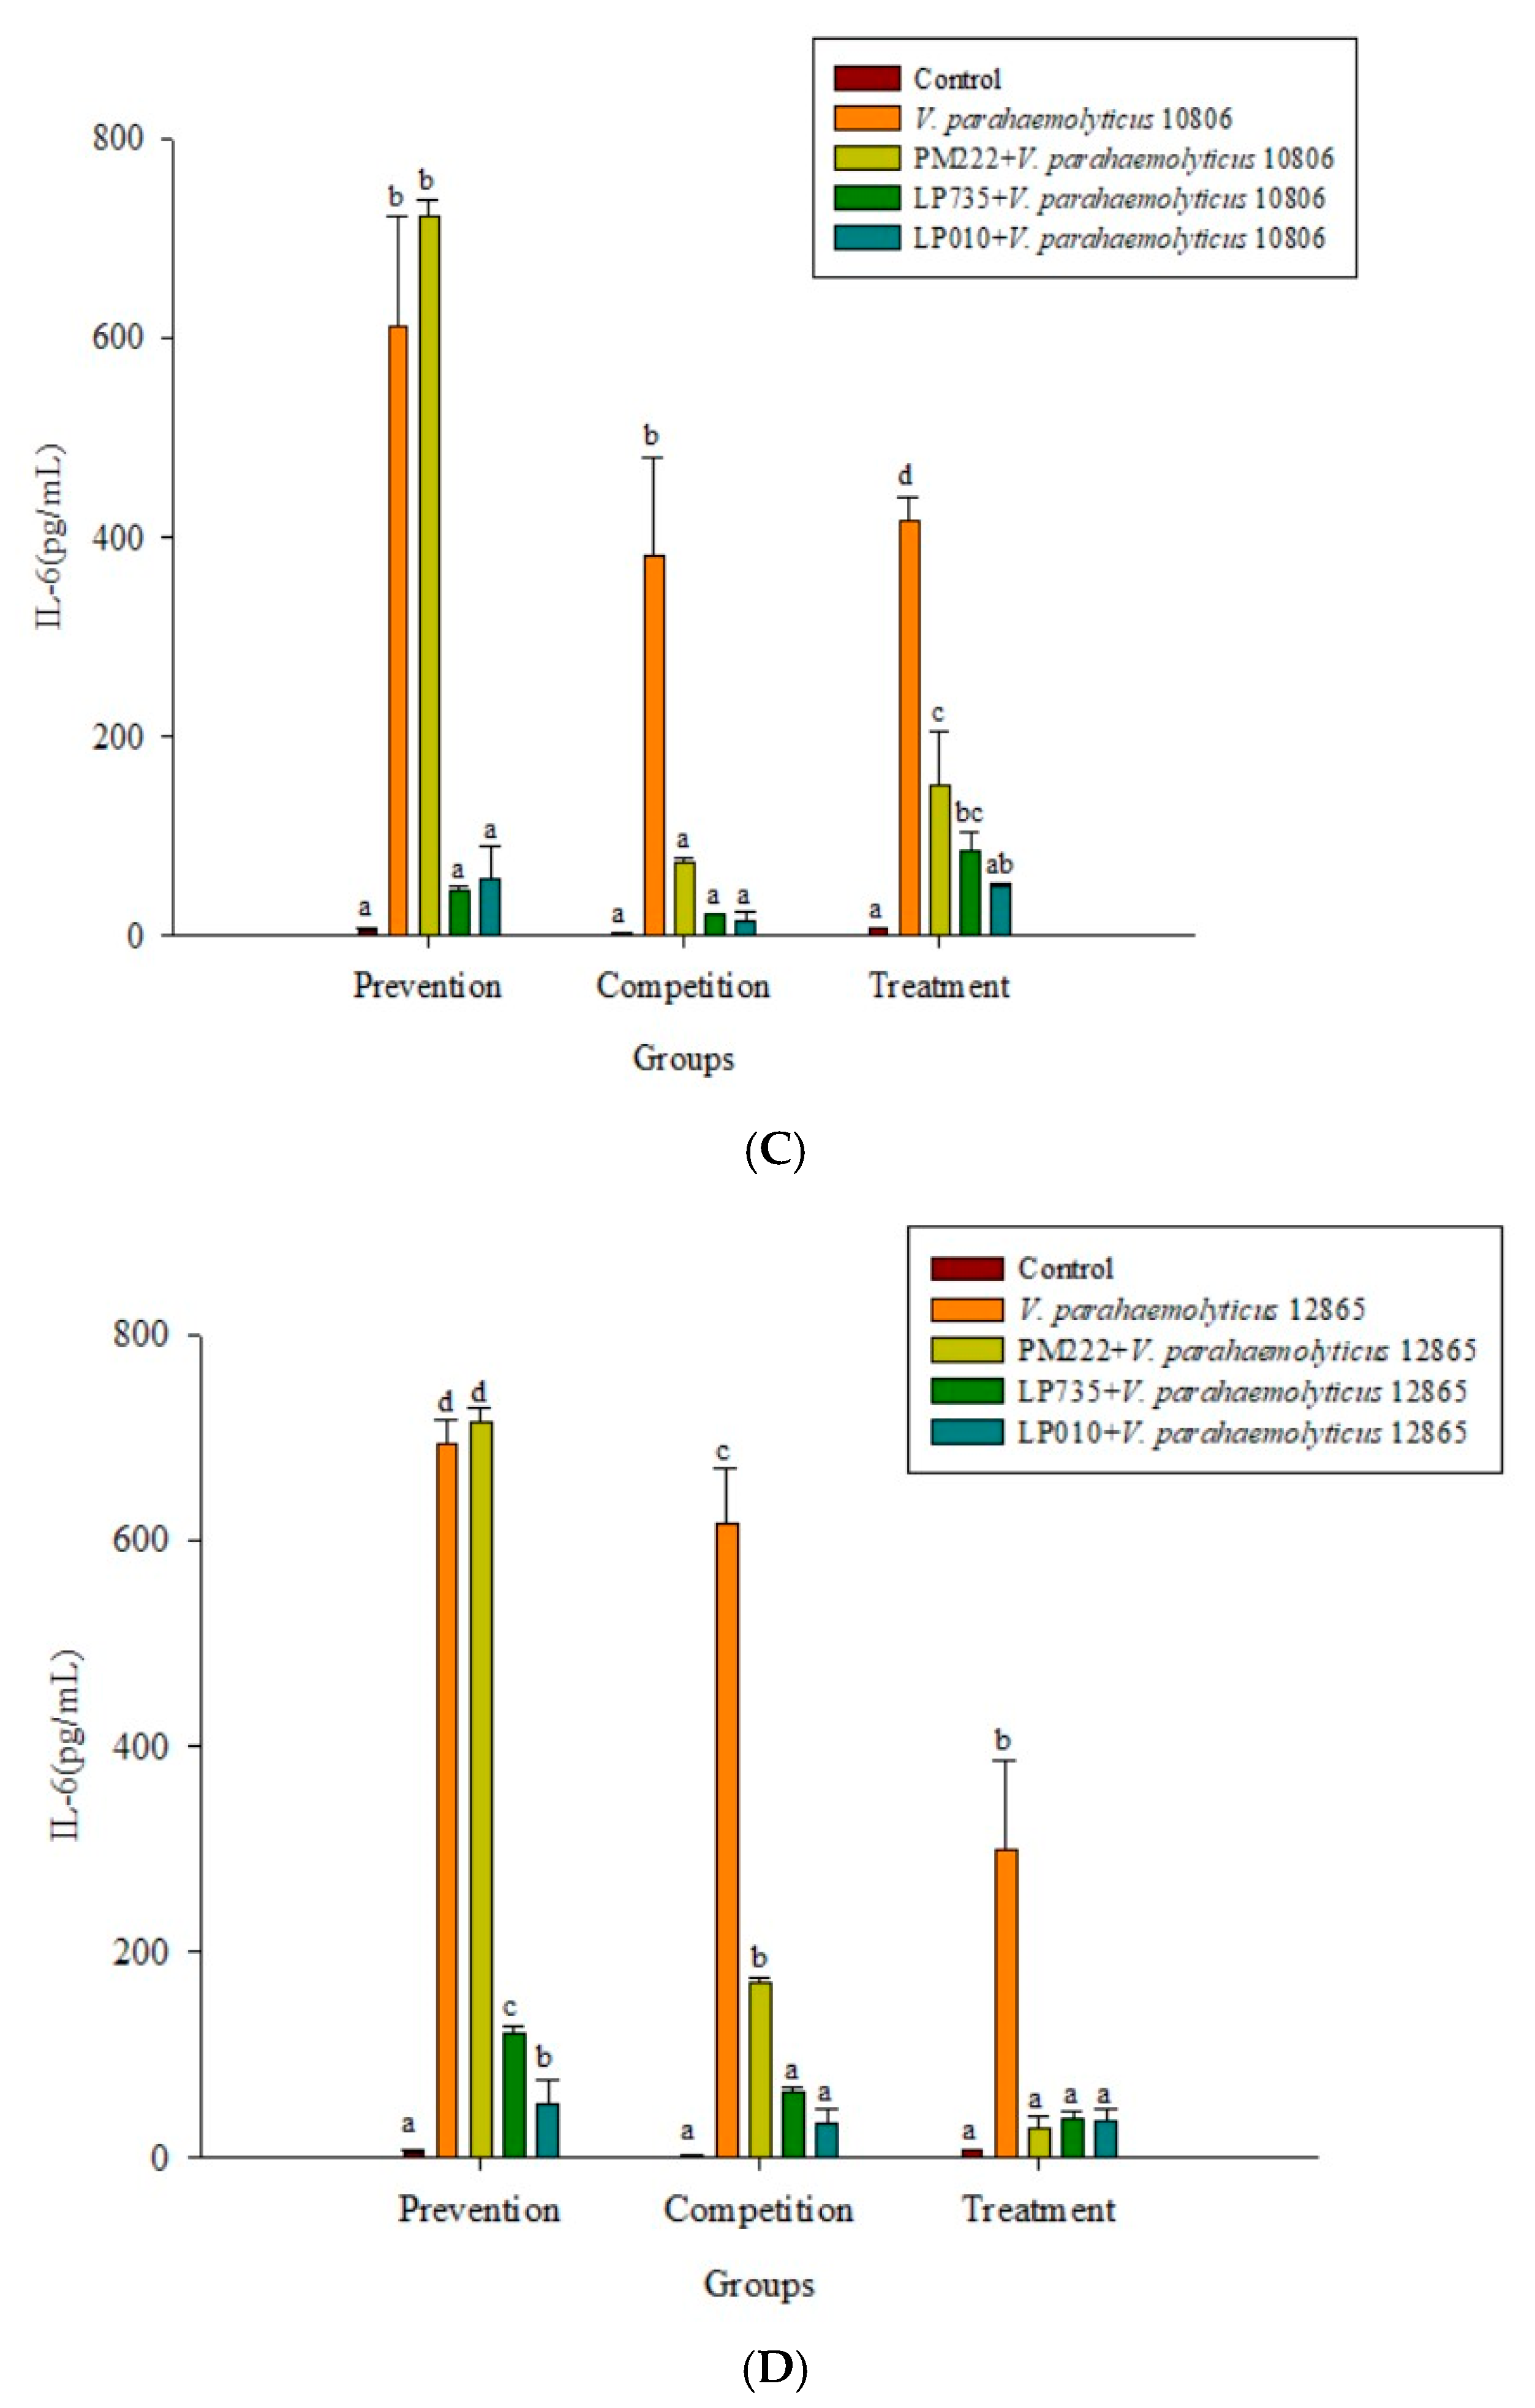
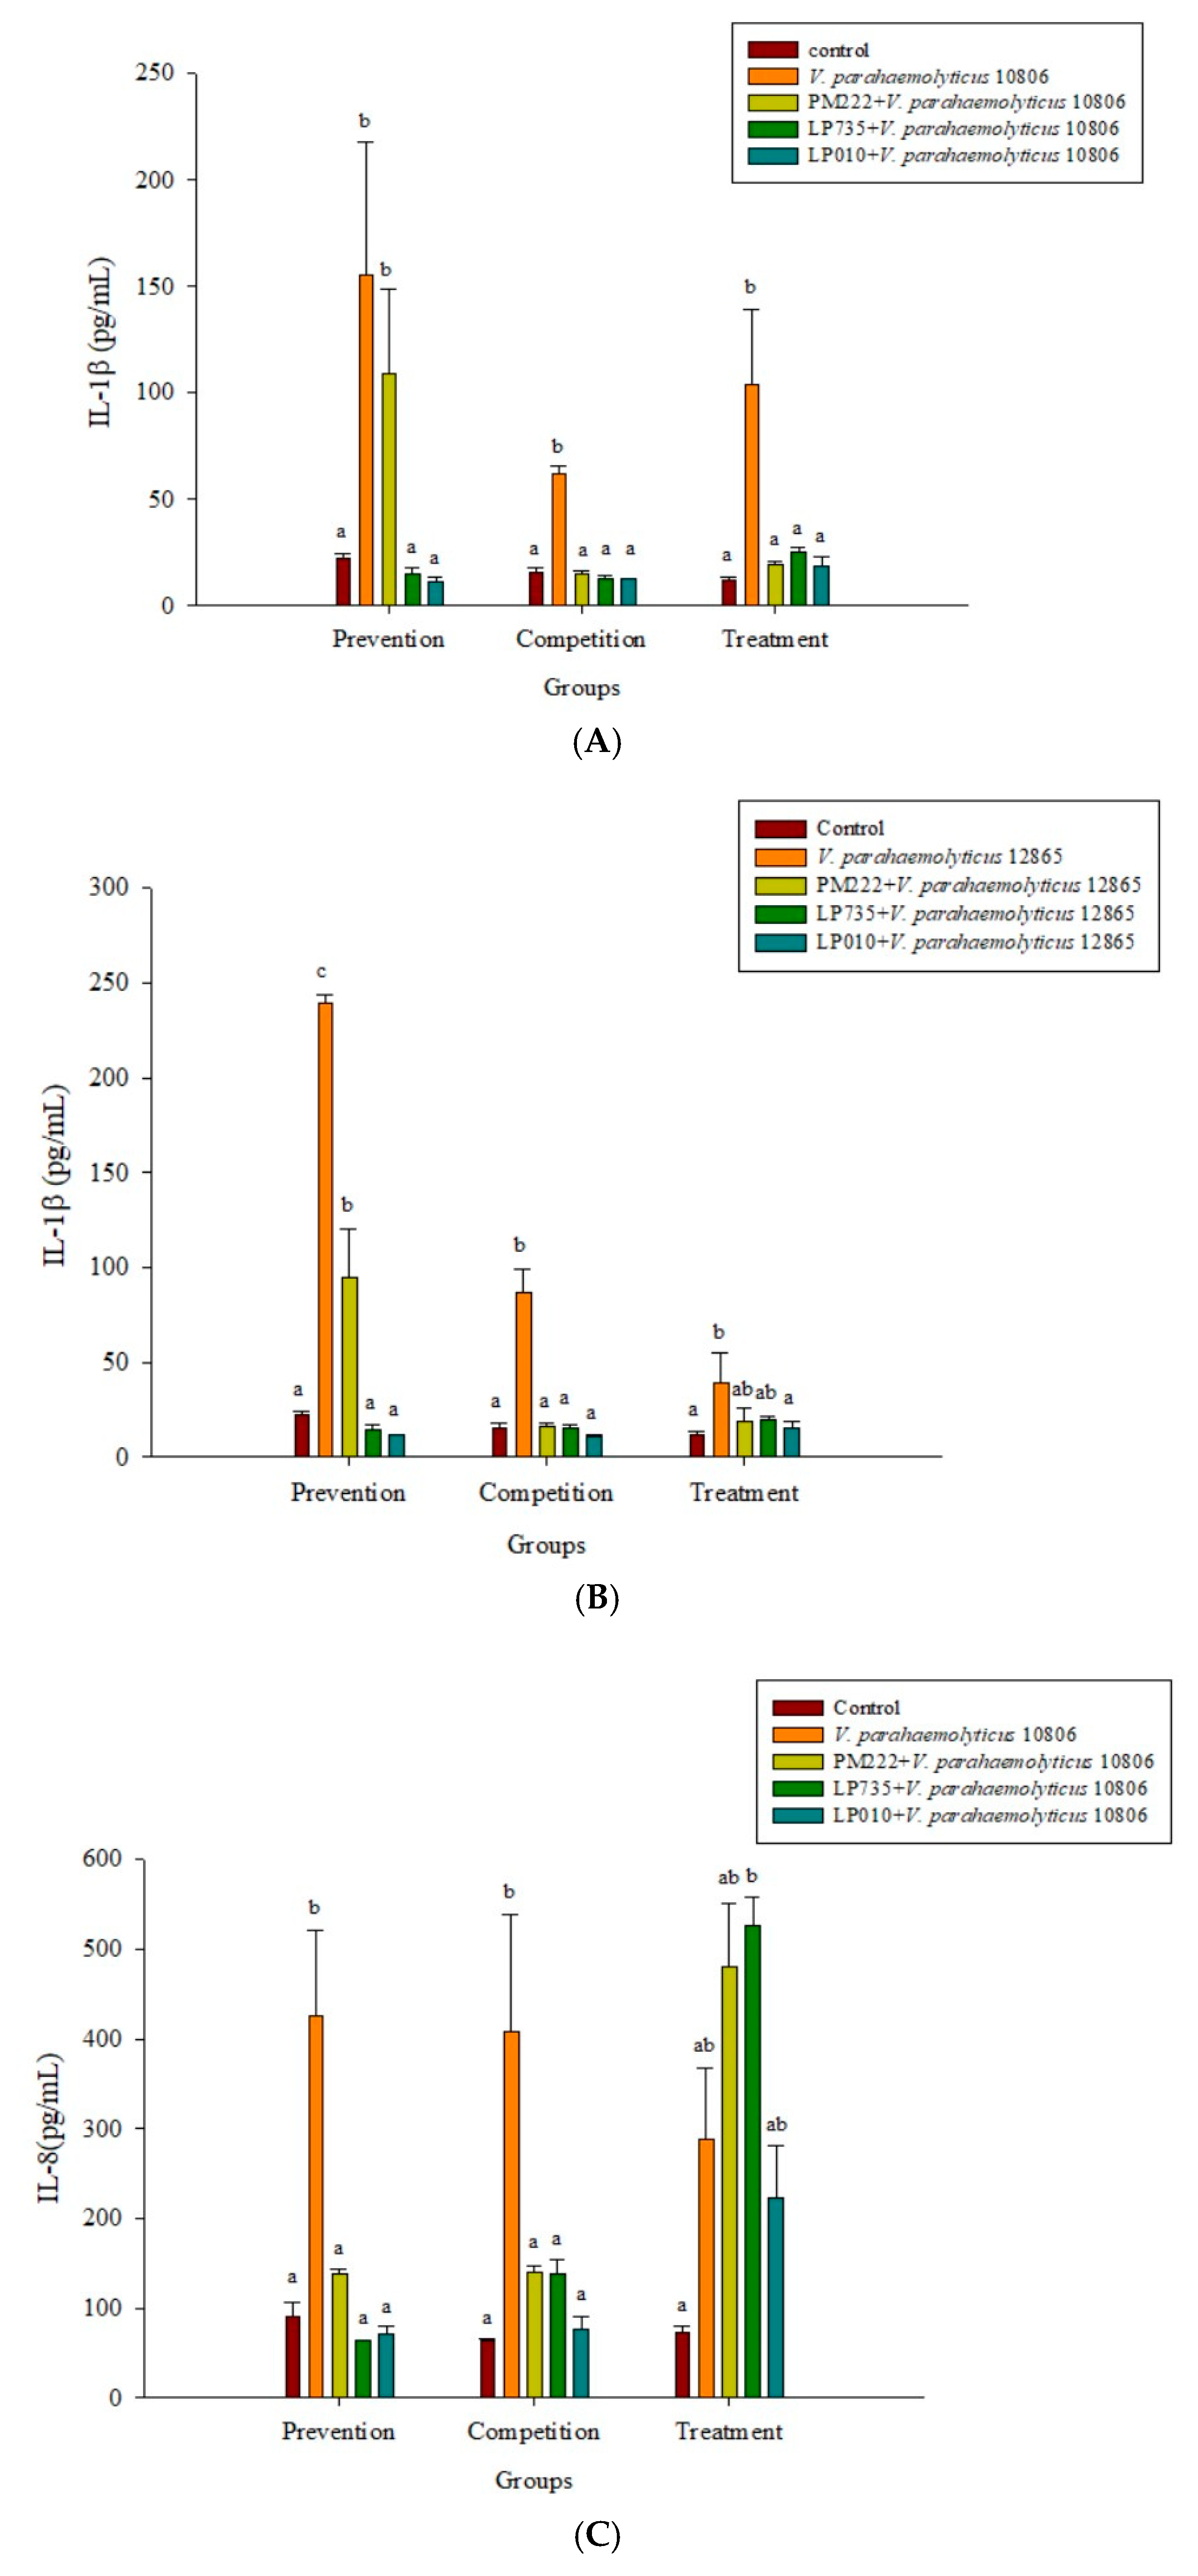
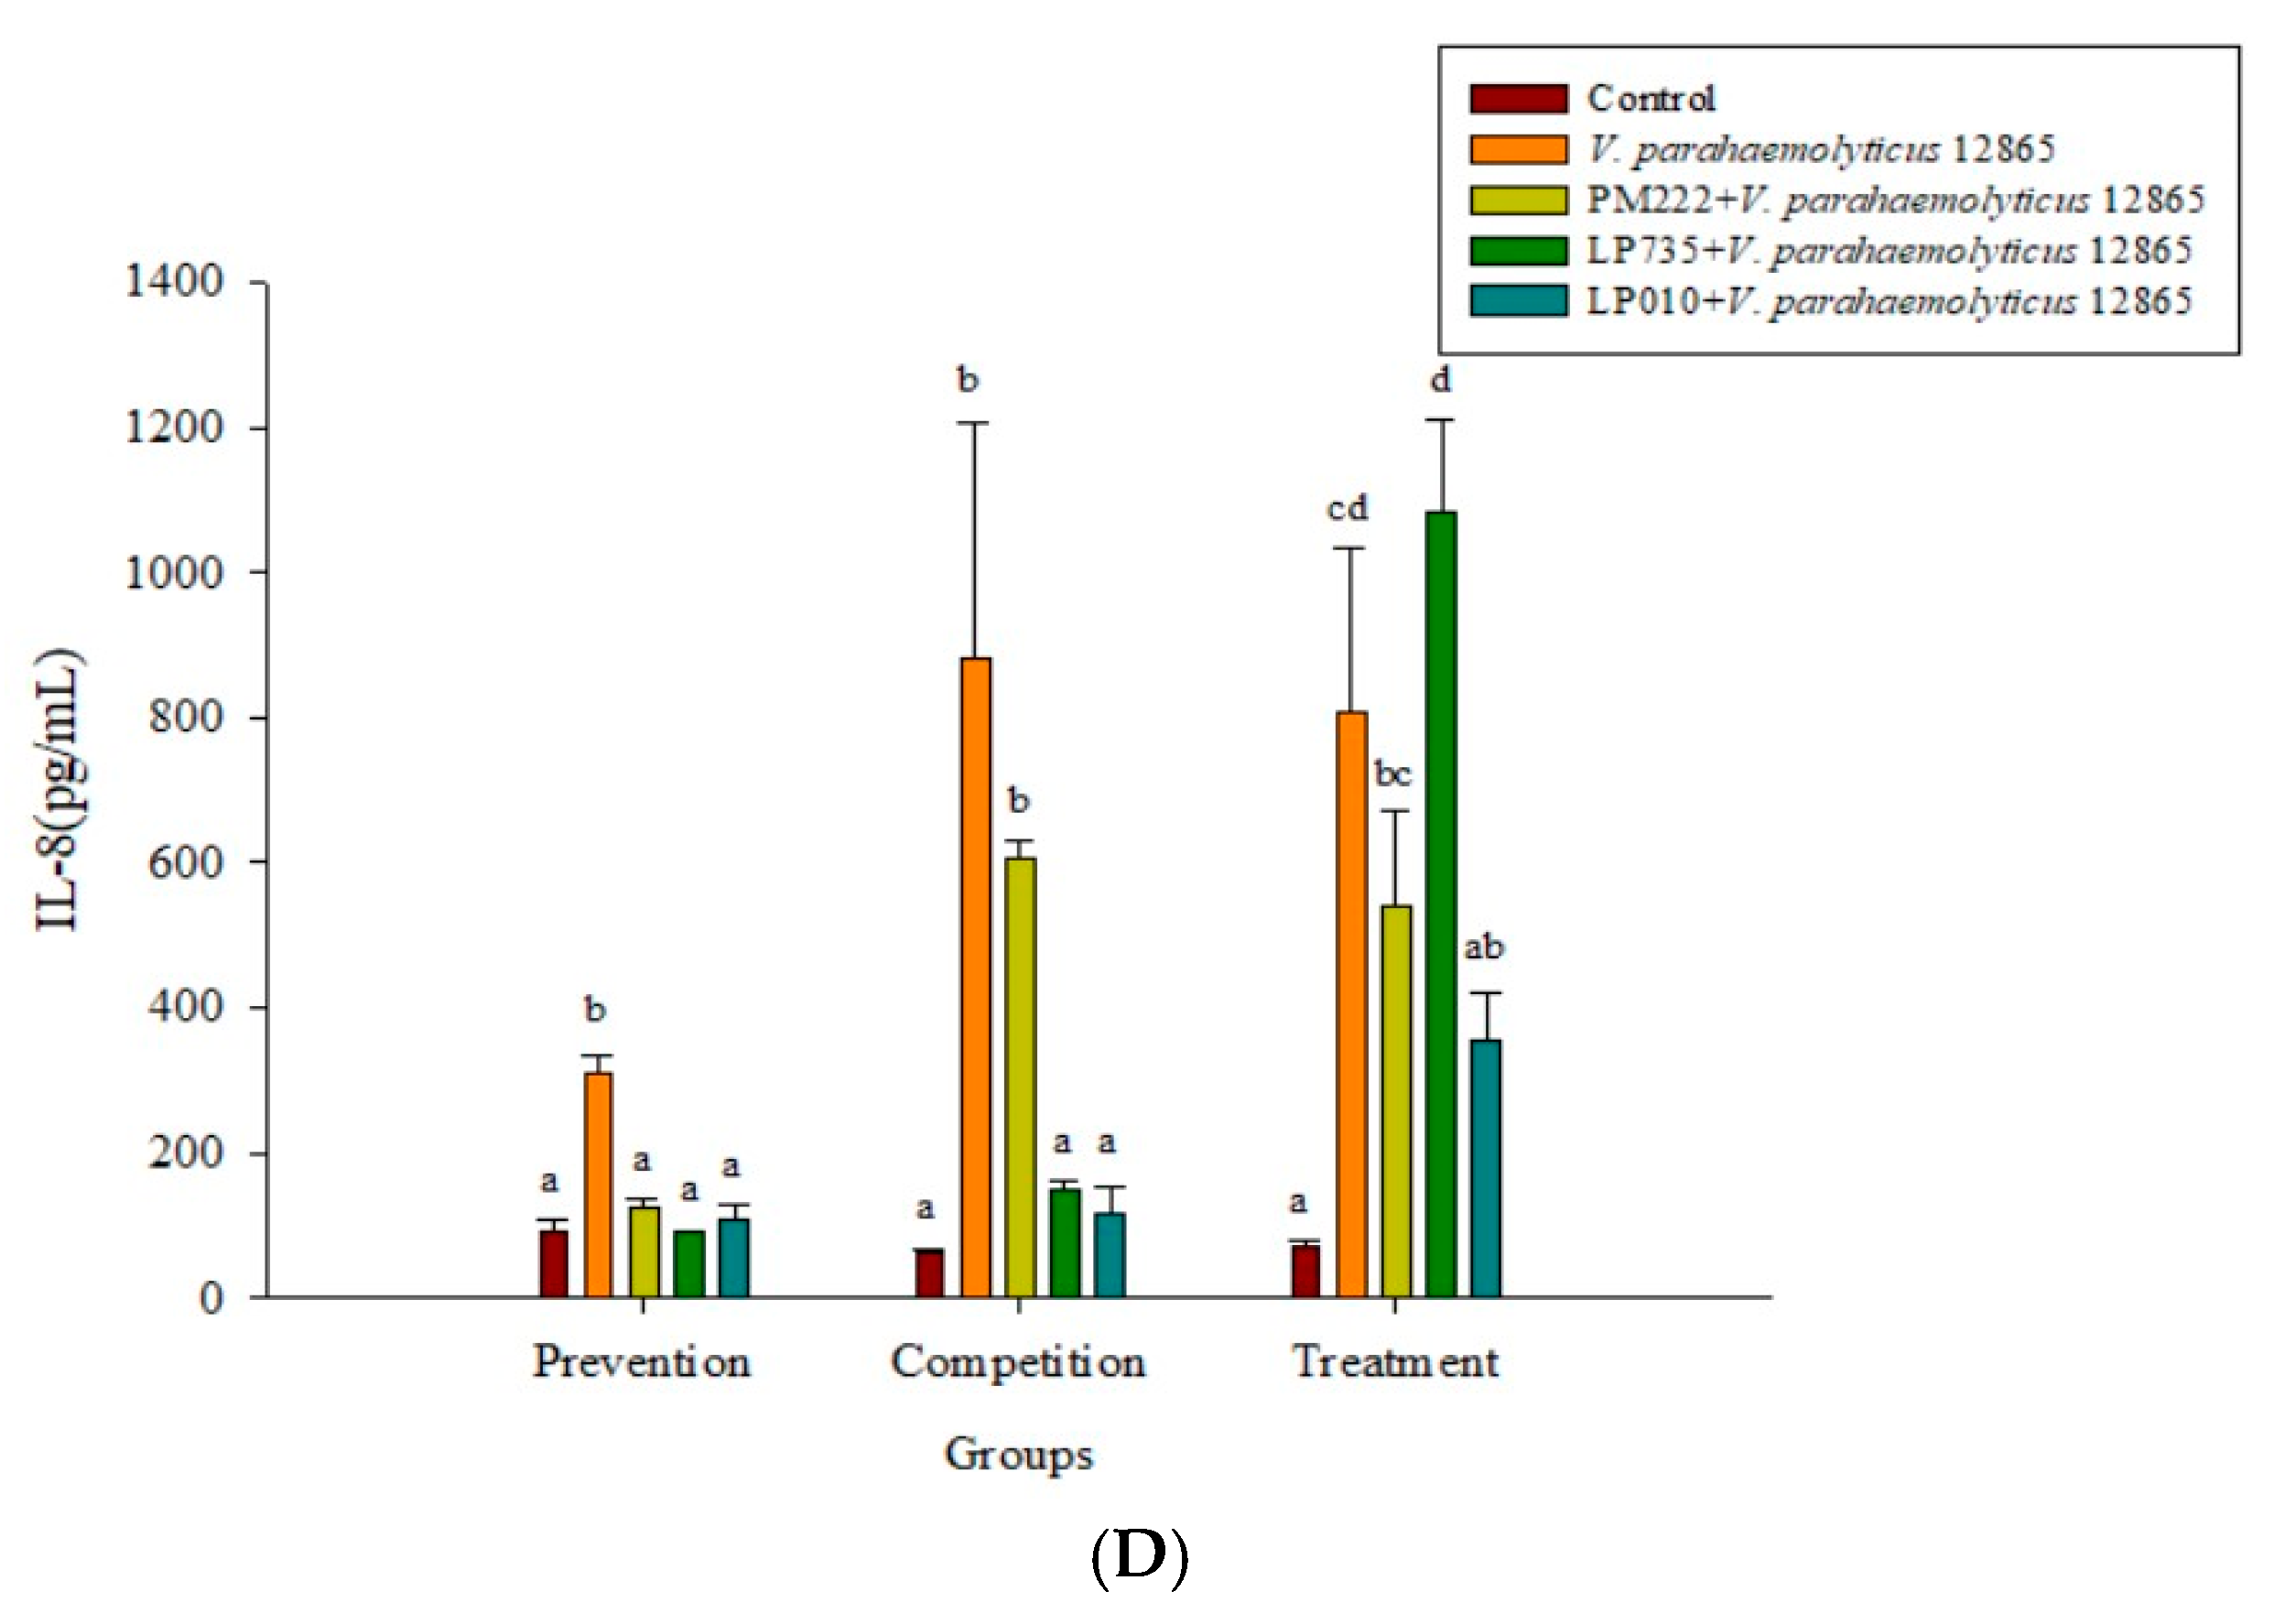
As shown in Figure 2A,B, three strains of lactobacilli in both the prophylaxis group and the concurrent group effectively reduced the secretion of TNF-α in RAW 264.7 macrophages in V. parahaemolyticus BCRC 10806 and BCRC 12865. No significant difference was found between the treatment group and the V. parahaemolyticus group, probably because LAB did not colonize the cells to protect the cells, resulting in cell damage V. parahaemolyticus. As shown in Figure 2C,D, three strains of LAB in the treatment group and the simultaneous treatment group significantly inhibited the secretion of IL-6 by RAW 264.7 cells induced by V. parahaemolyticus BCRC 10806 and 12865. As shown in Figure 3A,B, the three strains of LAB could significantly inhibit IL-1β secretion in V. parahaemolyticus BCRC 10806 and BCRC 12865-induced IL-1β cytokine secretion by RAW 264.7 macrophages in the prophylaxis group. The treatment group and the concurrent group LP 735 and LP 010 strains had a more potent inhibitory effect on IL-1β expression in the prophylaxis group than the PM 222 strain. As shown in Figure 3C,D, the three strains of LAB significantly inhibited the increase in IL-8 normally induced by V. parahaemolyticus BCRC 10806 and BCRC 12865 in the prophylaxis group and concurrent group of HT-29 intestinal epithelial cells. These results indicate that Lactobacillus colonization in the gut can protect the host from V. parahaemolyticus-induced injury by reducing the production of proinflammatory factors.
2.4. Effects of Adding LAB and V. parahaemolyticus on the Expression of Inflammatory-Related Genes in Different Cell Lines
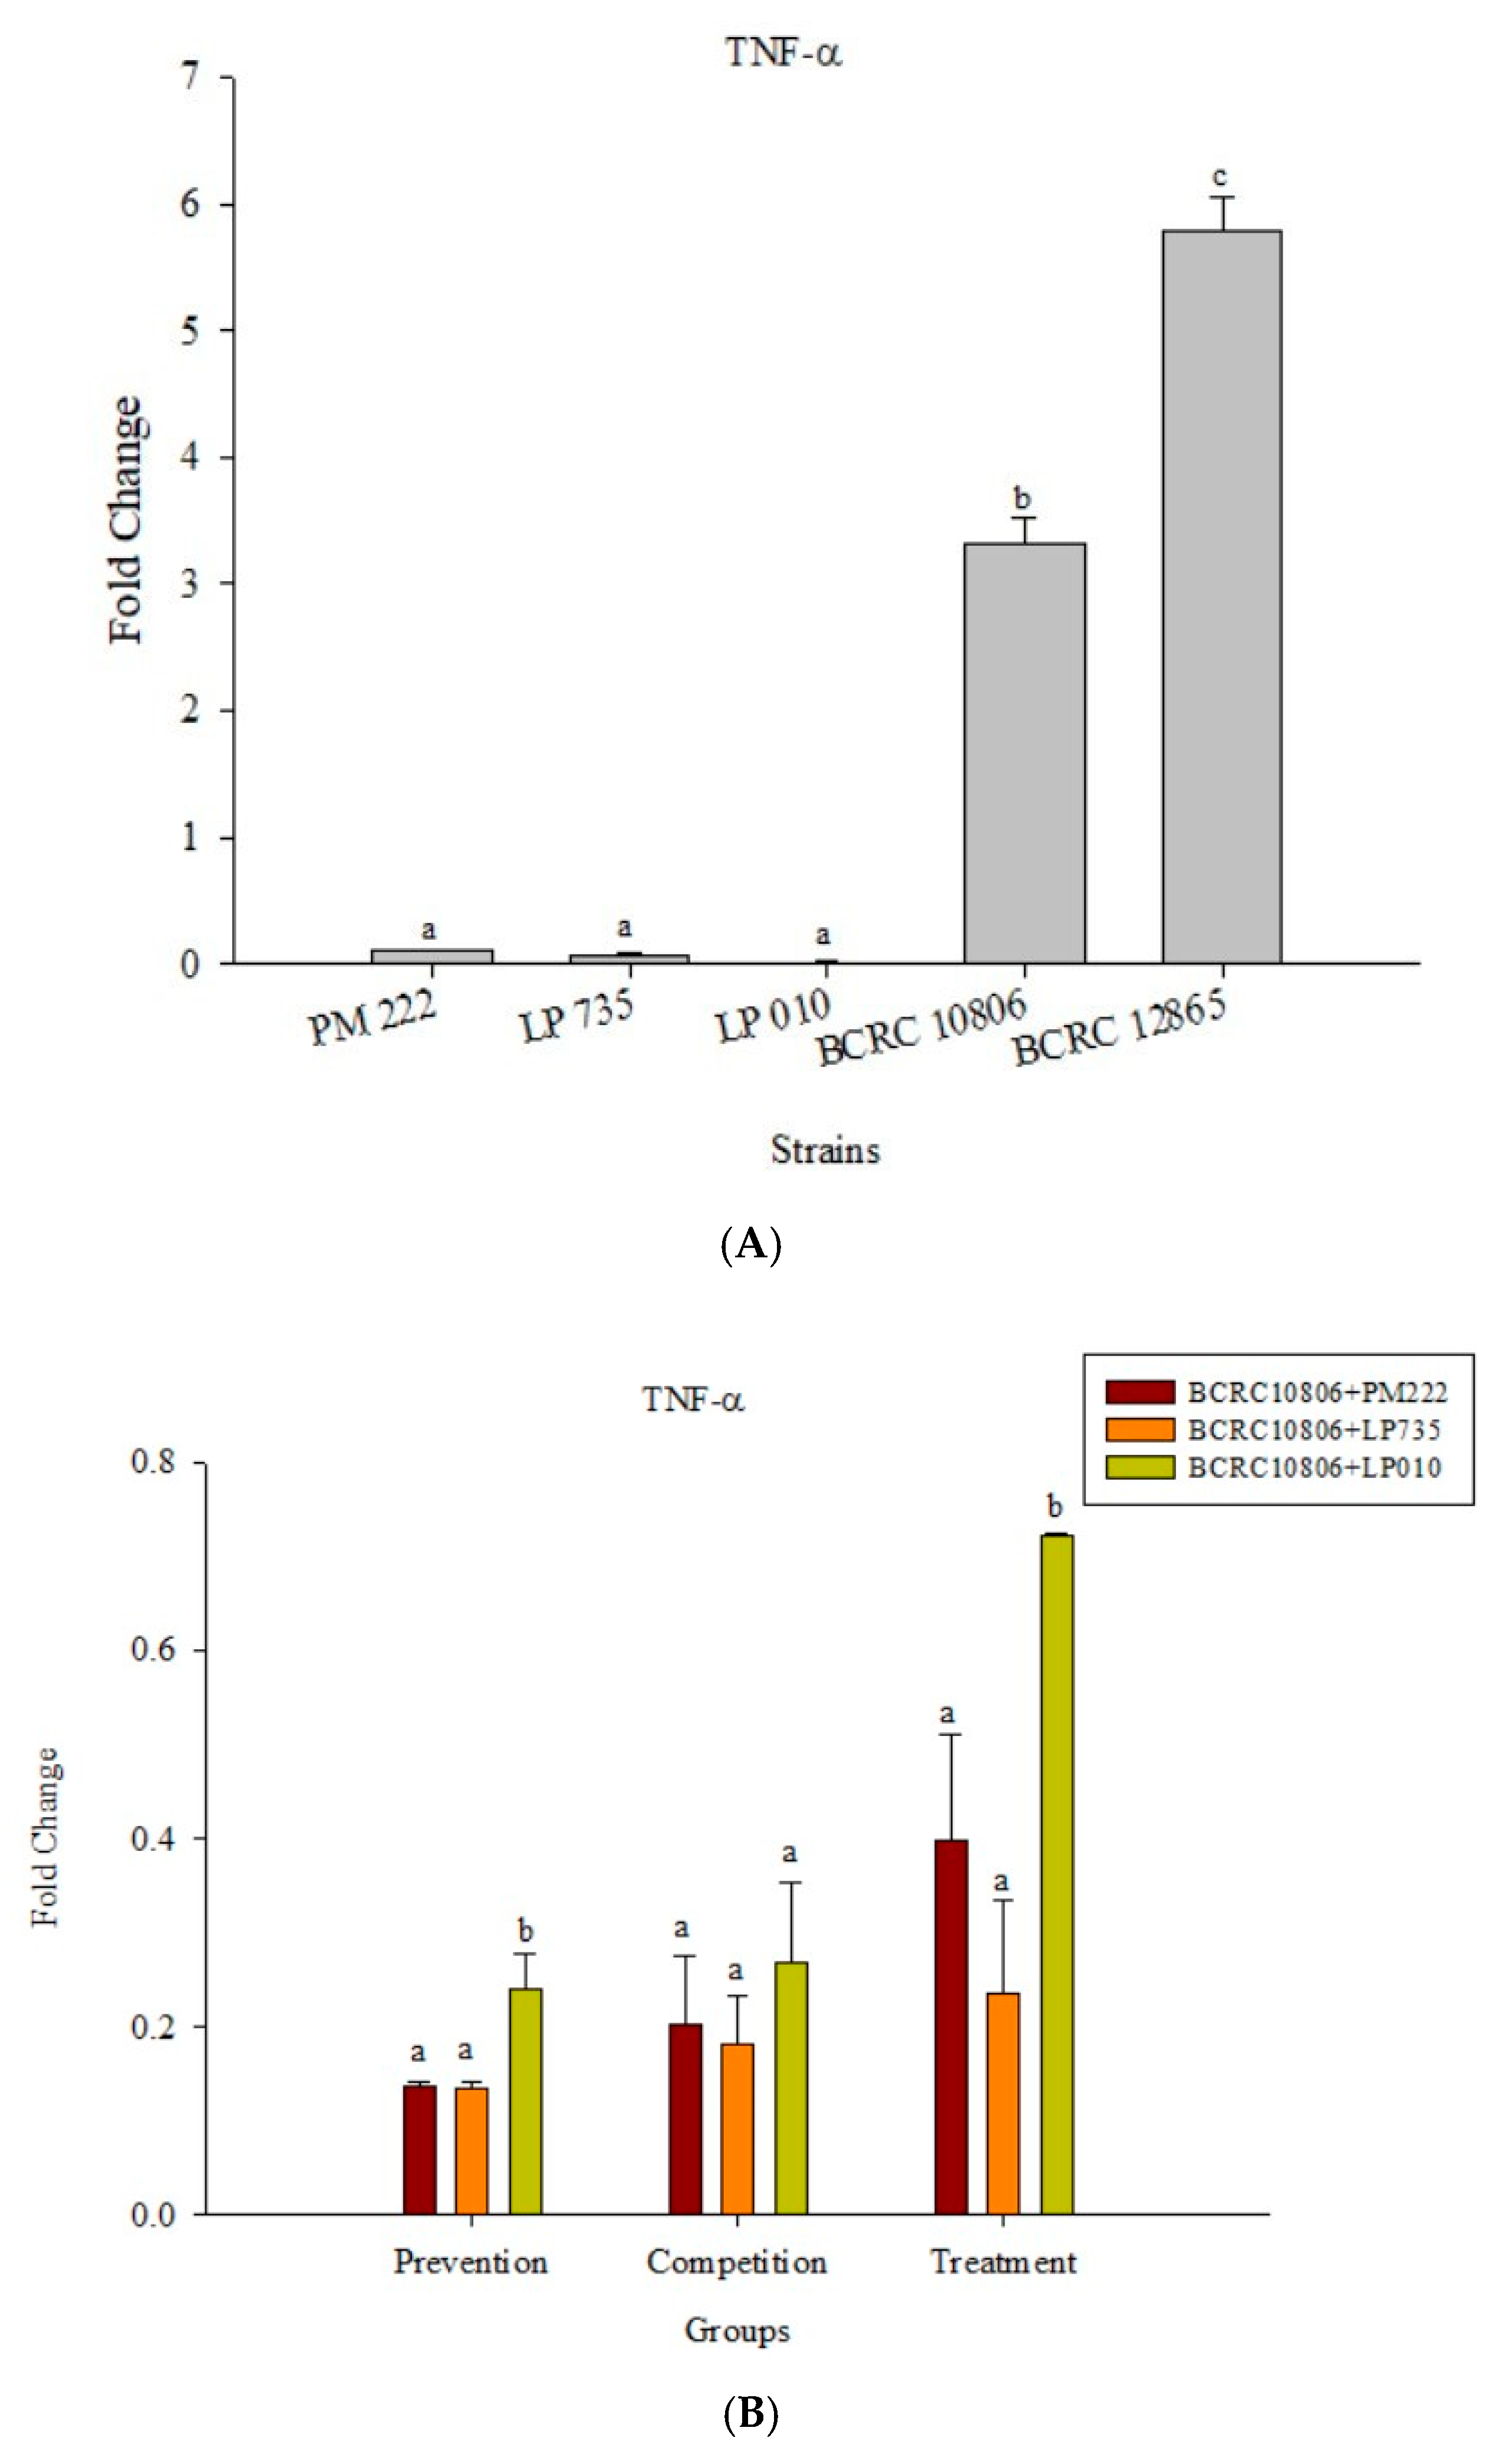
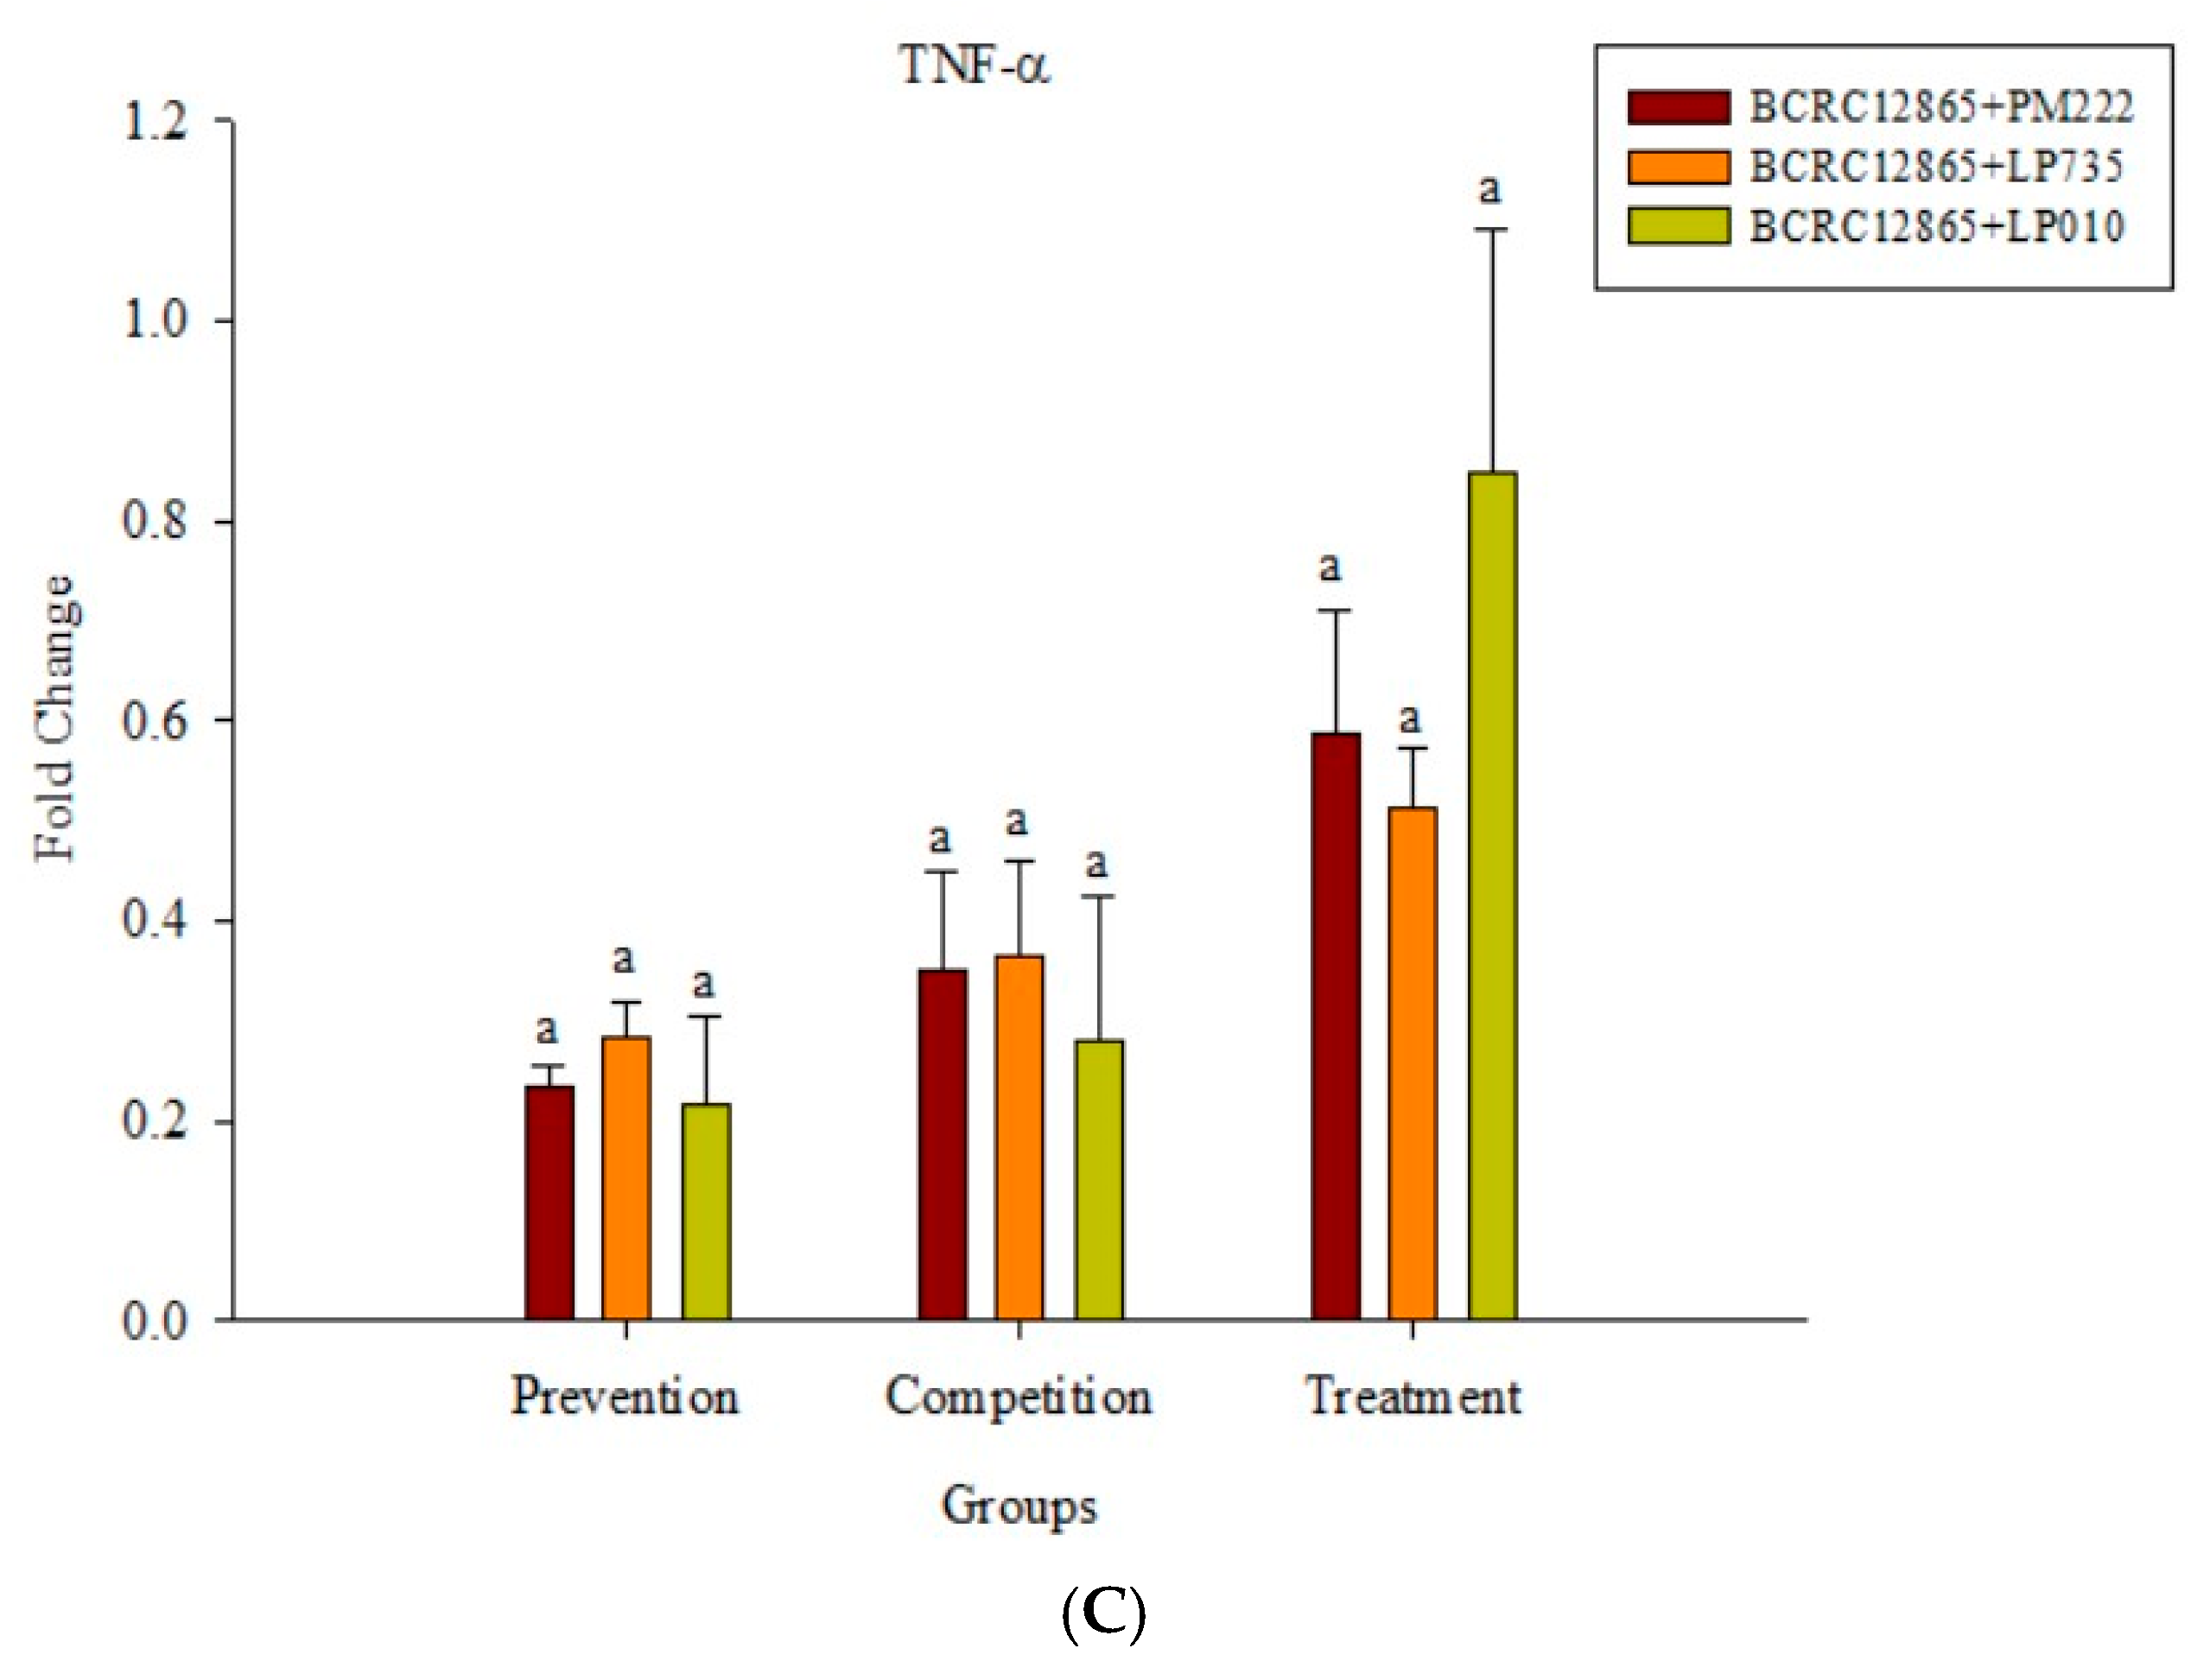
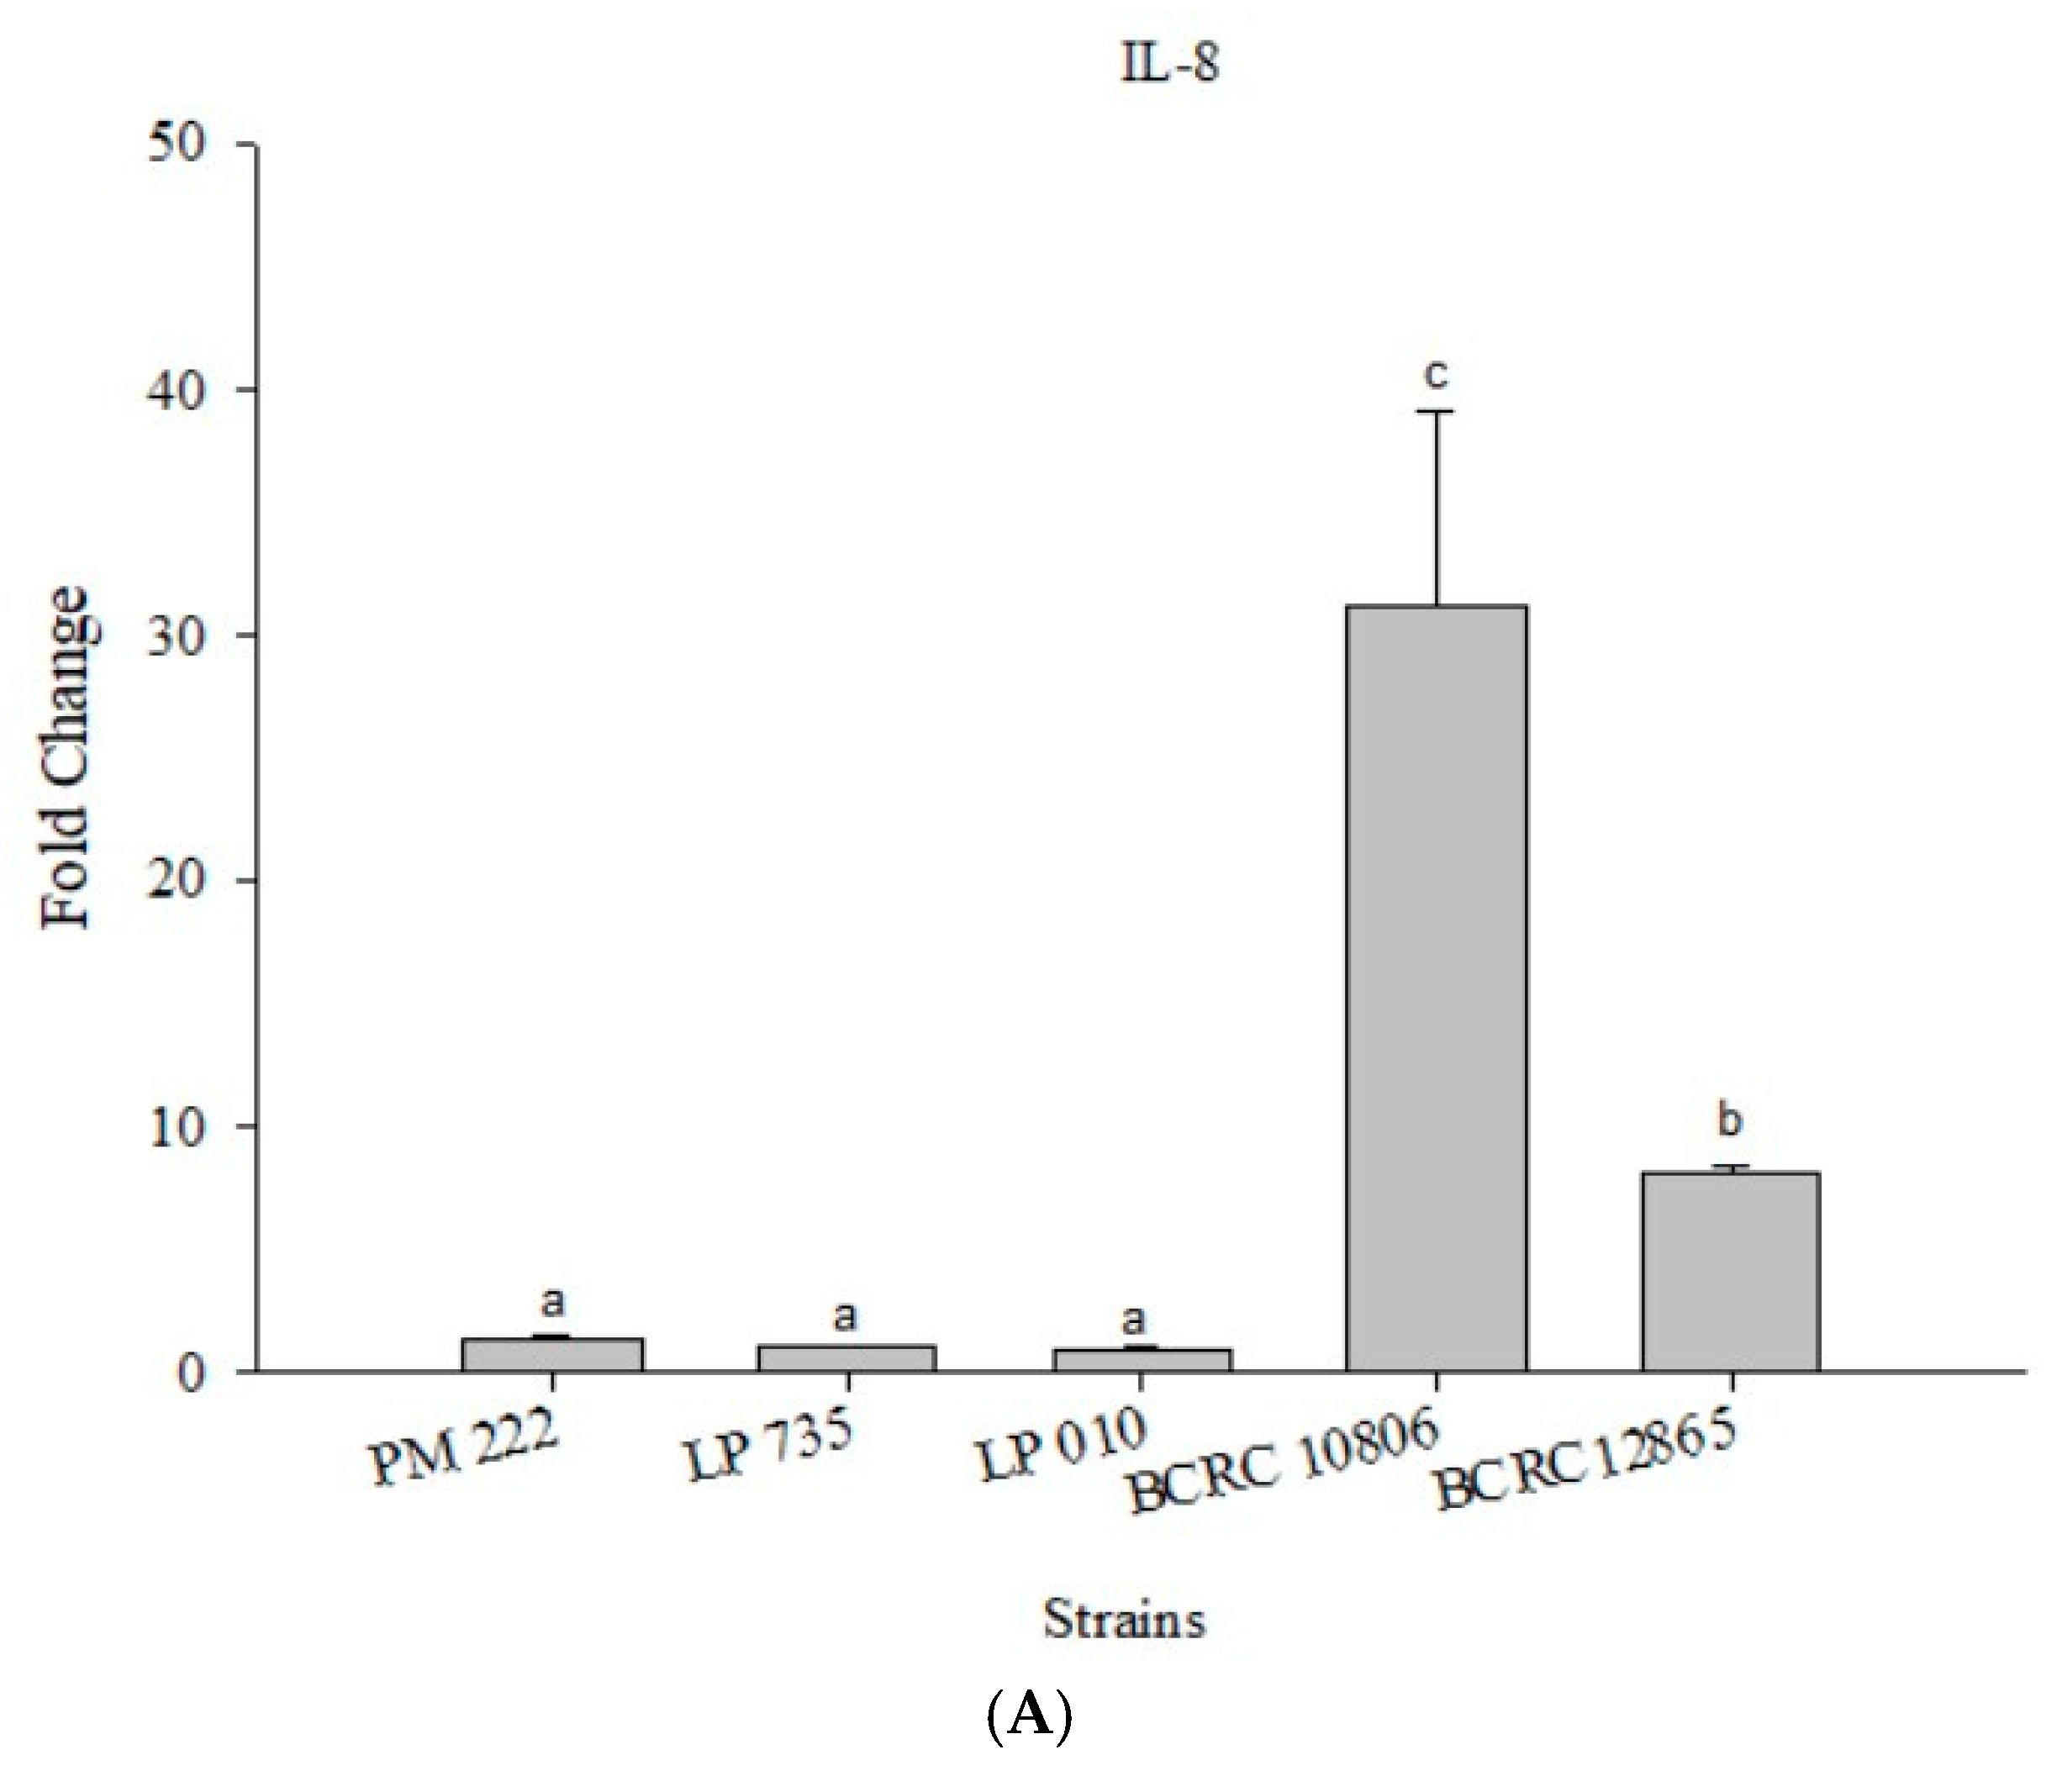
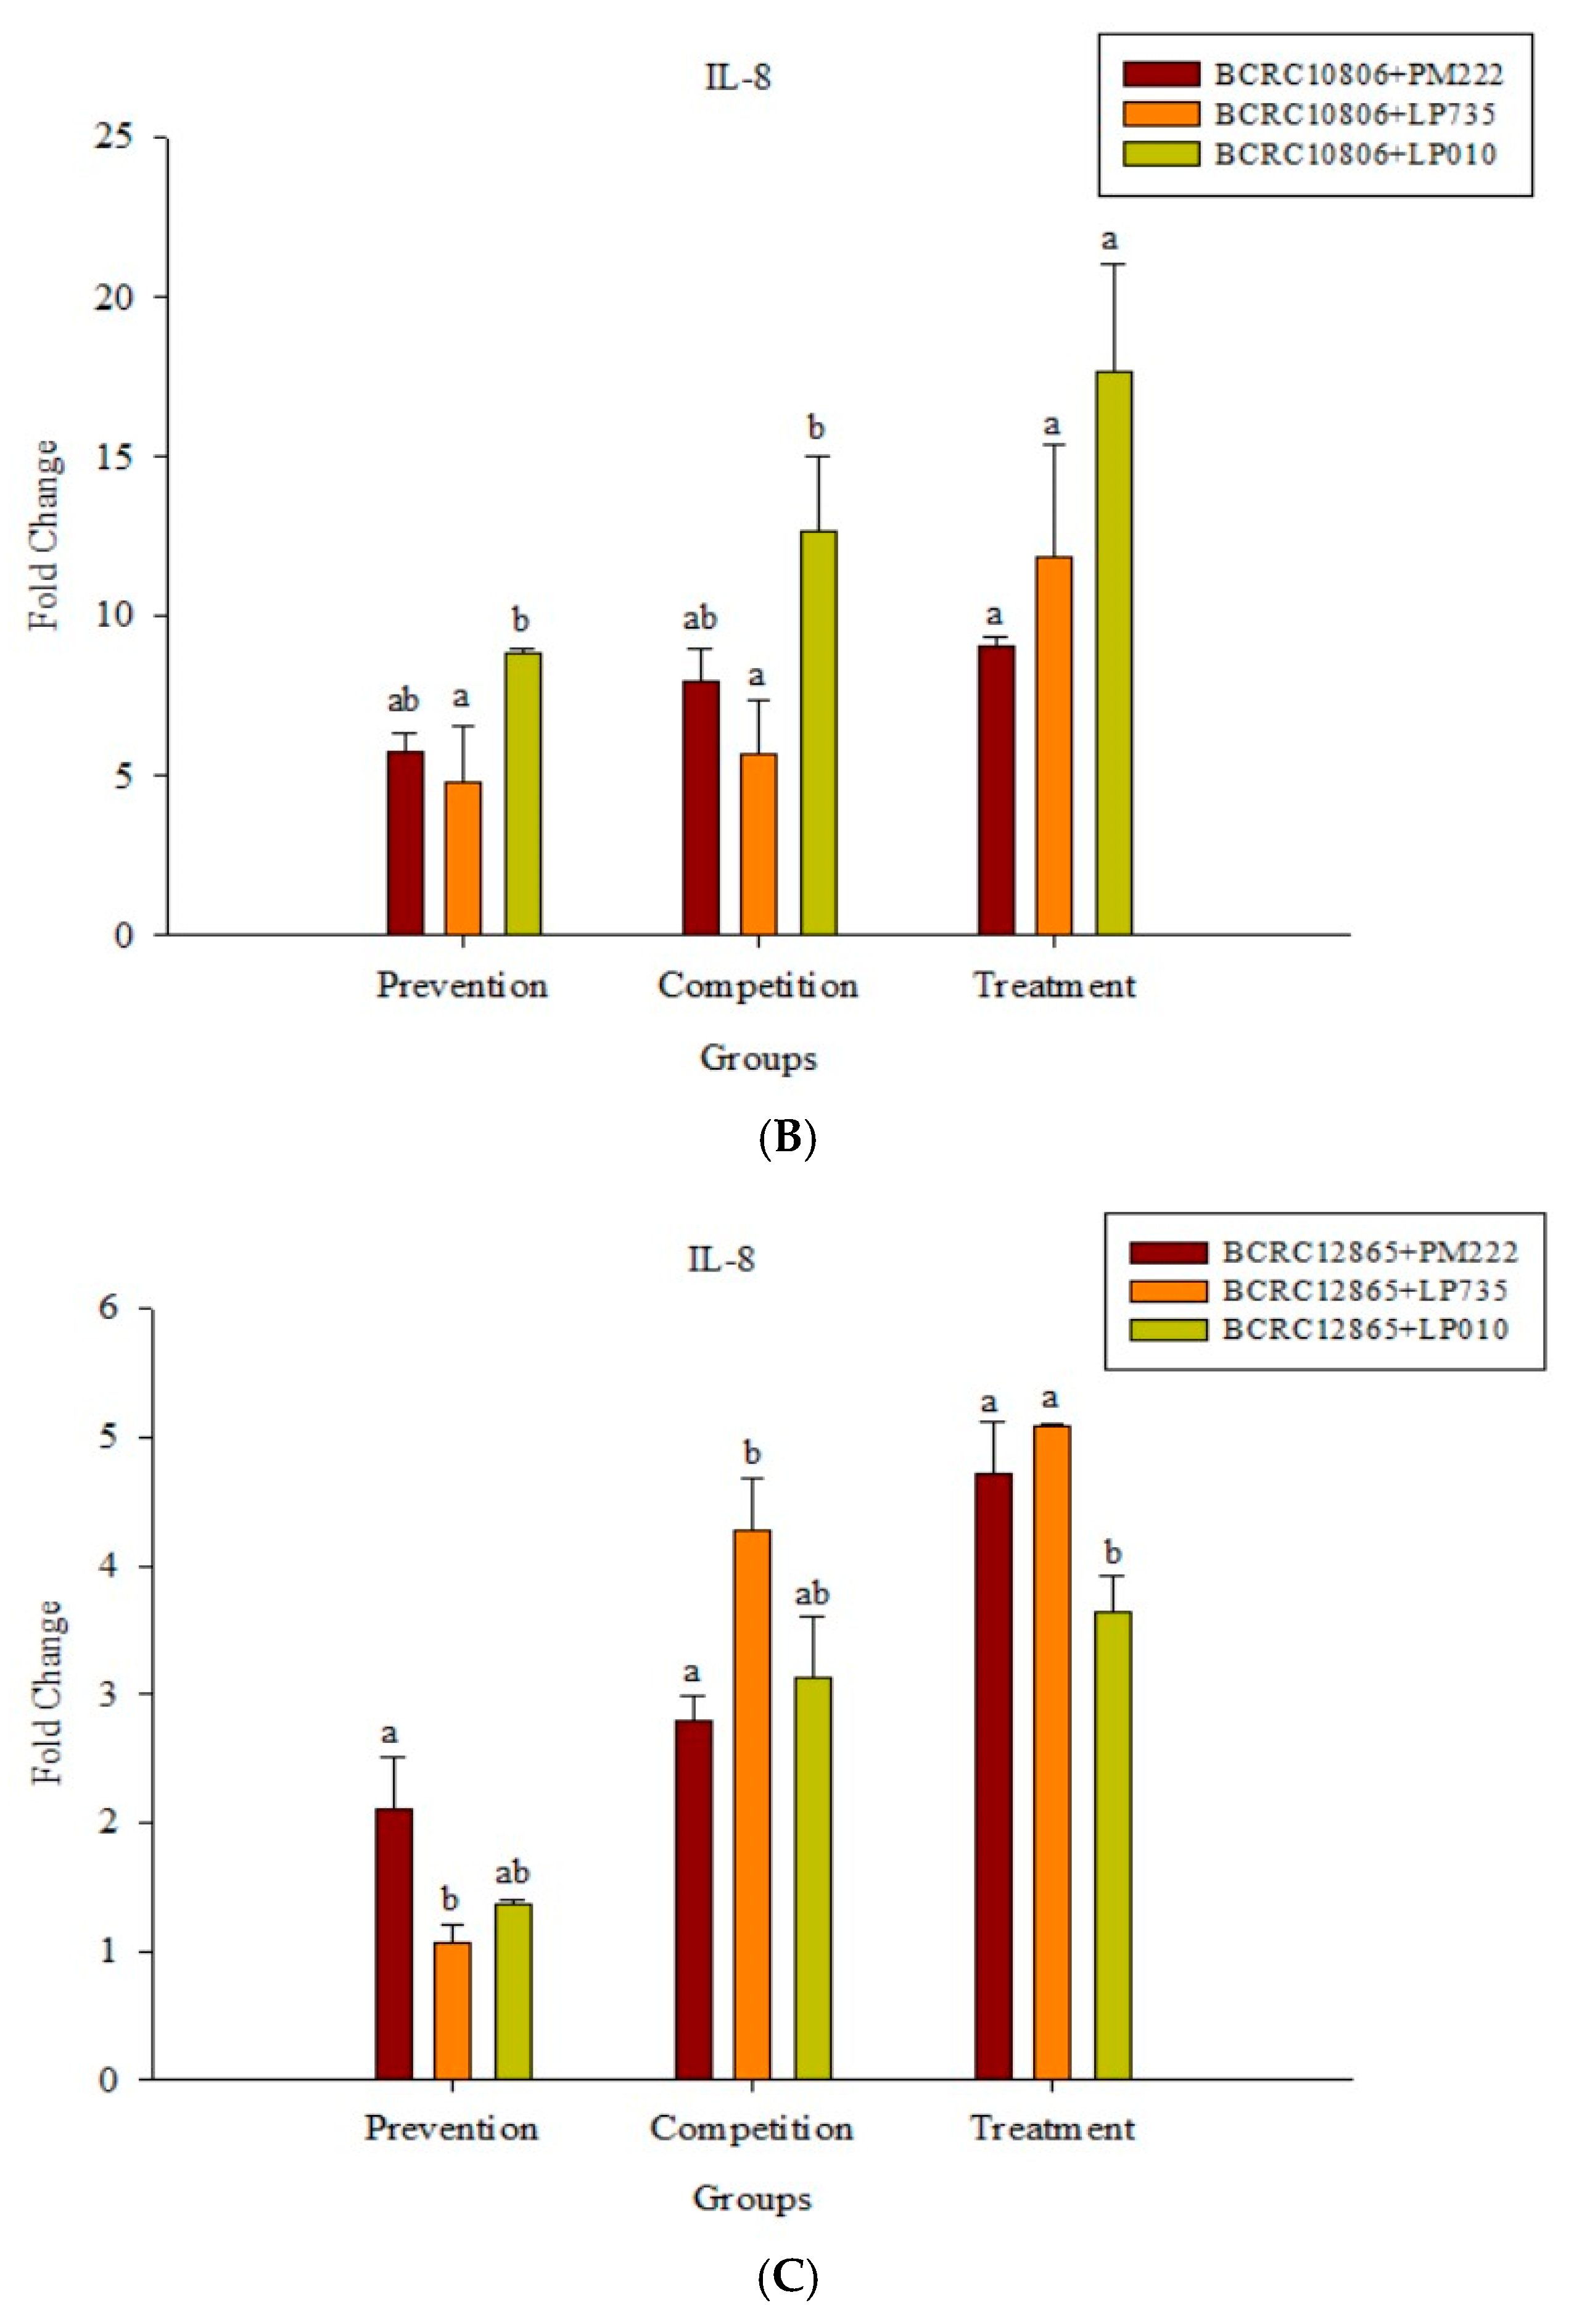
According to the results presented in Figure 4A, LAB did not induce IL-8 expression in Caco-2 cells, but the expression of IL-8 significantly increased upon treatment with V. parahaemolyticus, and treatment with strain BCRC 10806 induced the highest amount of IL-8. The results presented in Figure 4B,C show that the three LAB strains all have an inhibitory effect on the inflammatory response to IL-8 against V. parahaemolyticus BCRC 10806 and BCRC 12865 in three different modes compared with V. parahaemolyticus alone.
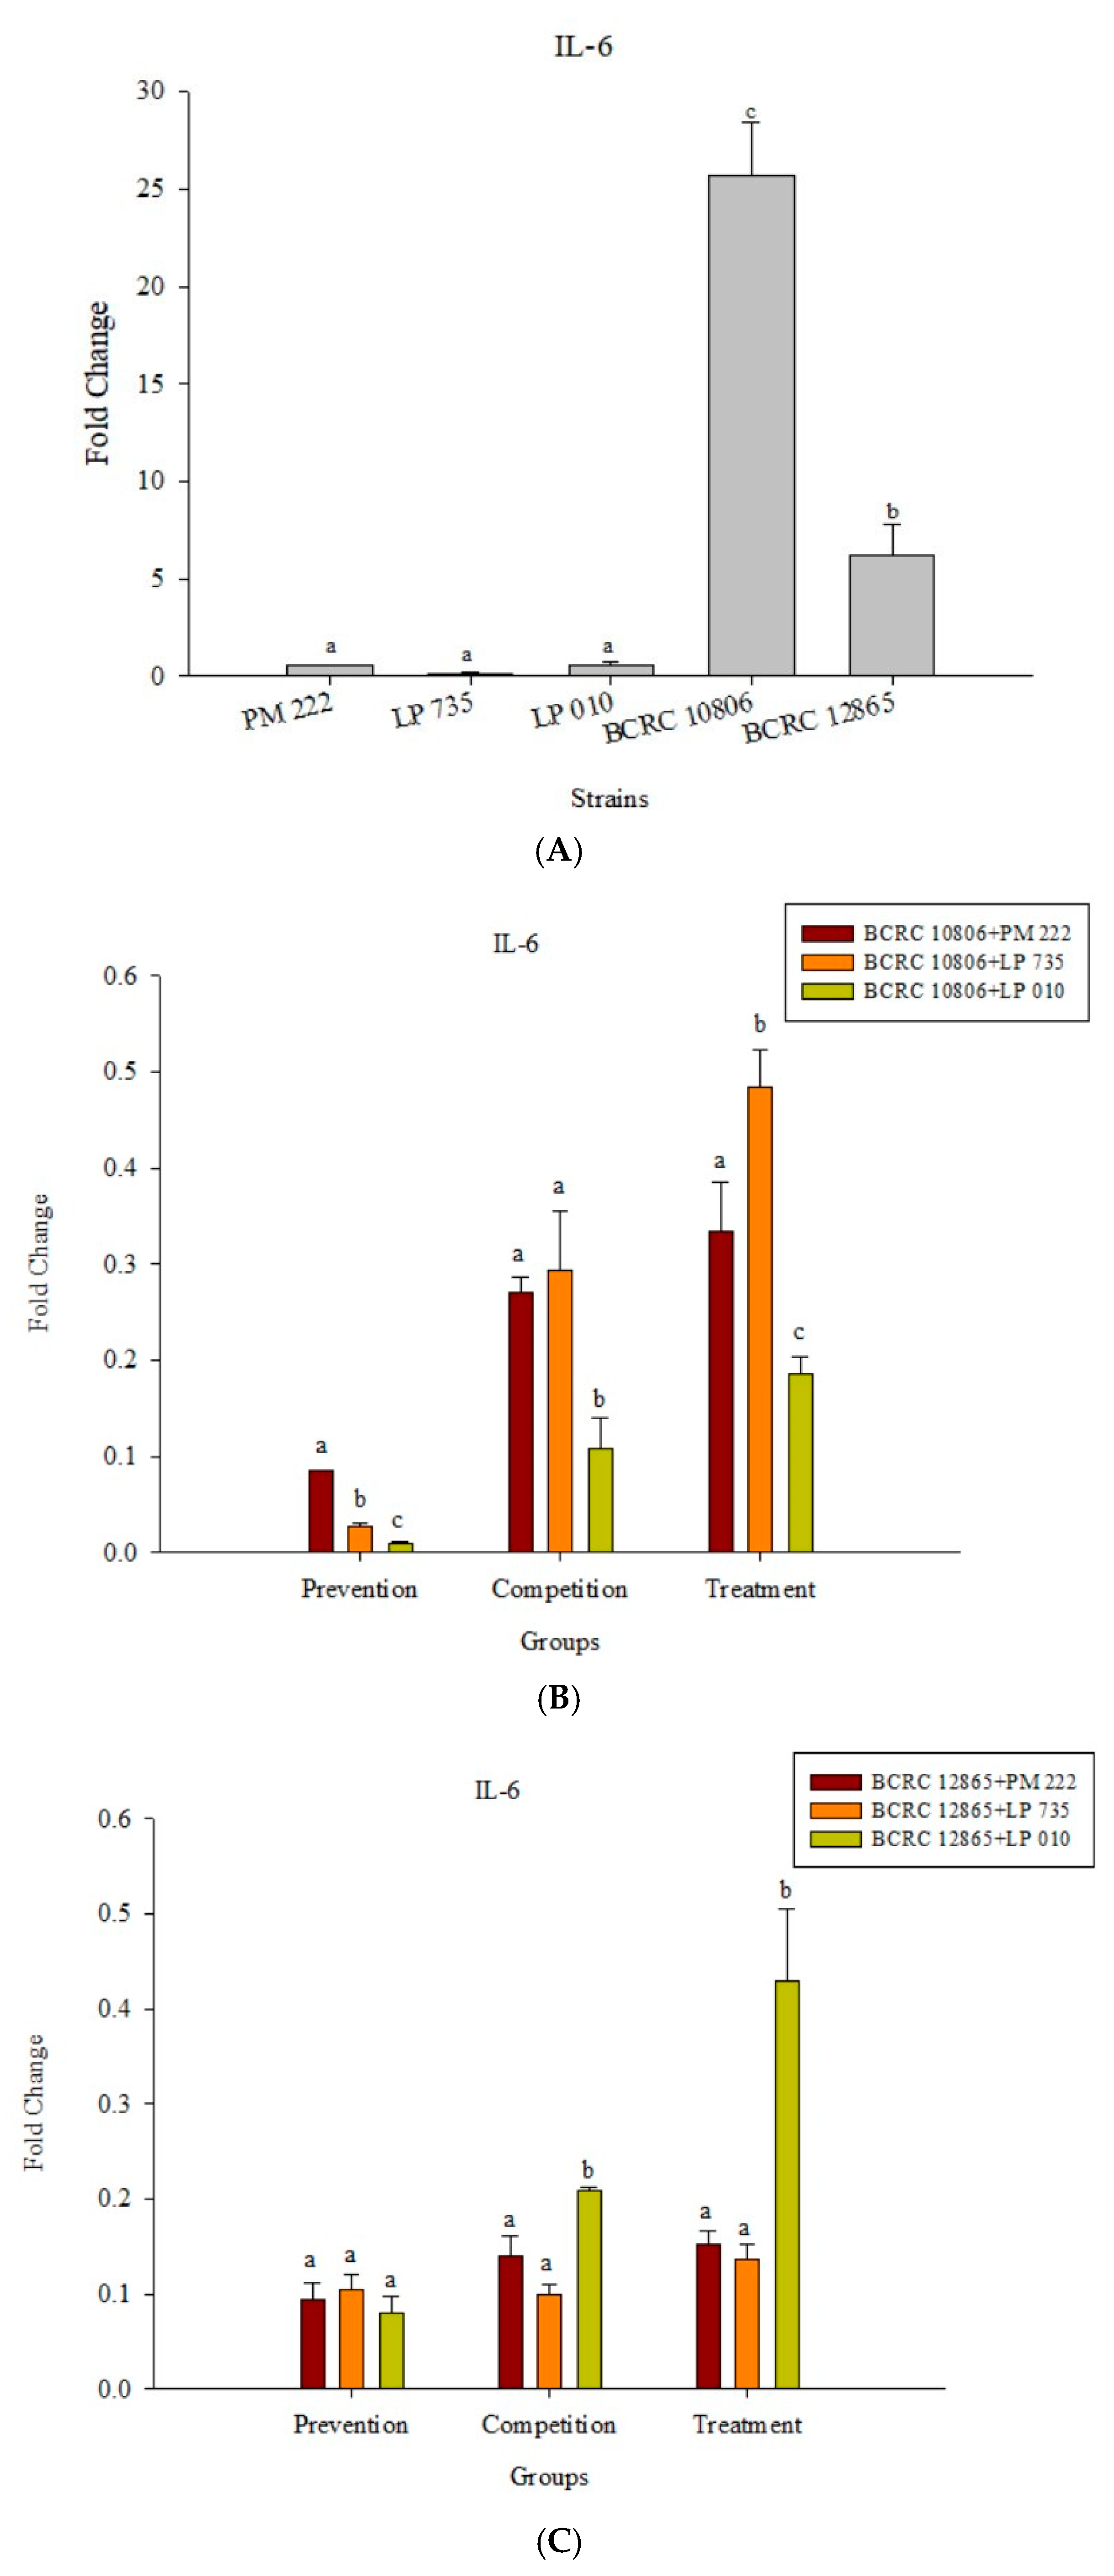
The results presented in Figure 5A show that LAB induced low levels of IL-6 expression in Raw 264.7 macrophages but induced significantly higher IL-6 performance relative to the V. parahaemolyticus BCRC 12865 group and LAB in the prevention group. The role of both groups and the treatment group effectively inhibited IL-6 performance (Figure 5B,C). The results presented in Figure 6A show that LAB do not induce Raw 264.7 to express TNF-α. However, upon treatment with V. parahaemolyticus BCRC 12865 and BCRC 10806, TNF-α activity significantly reduced compared with that of IL-6 (Figure 6B,C).
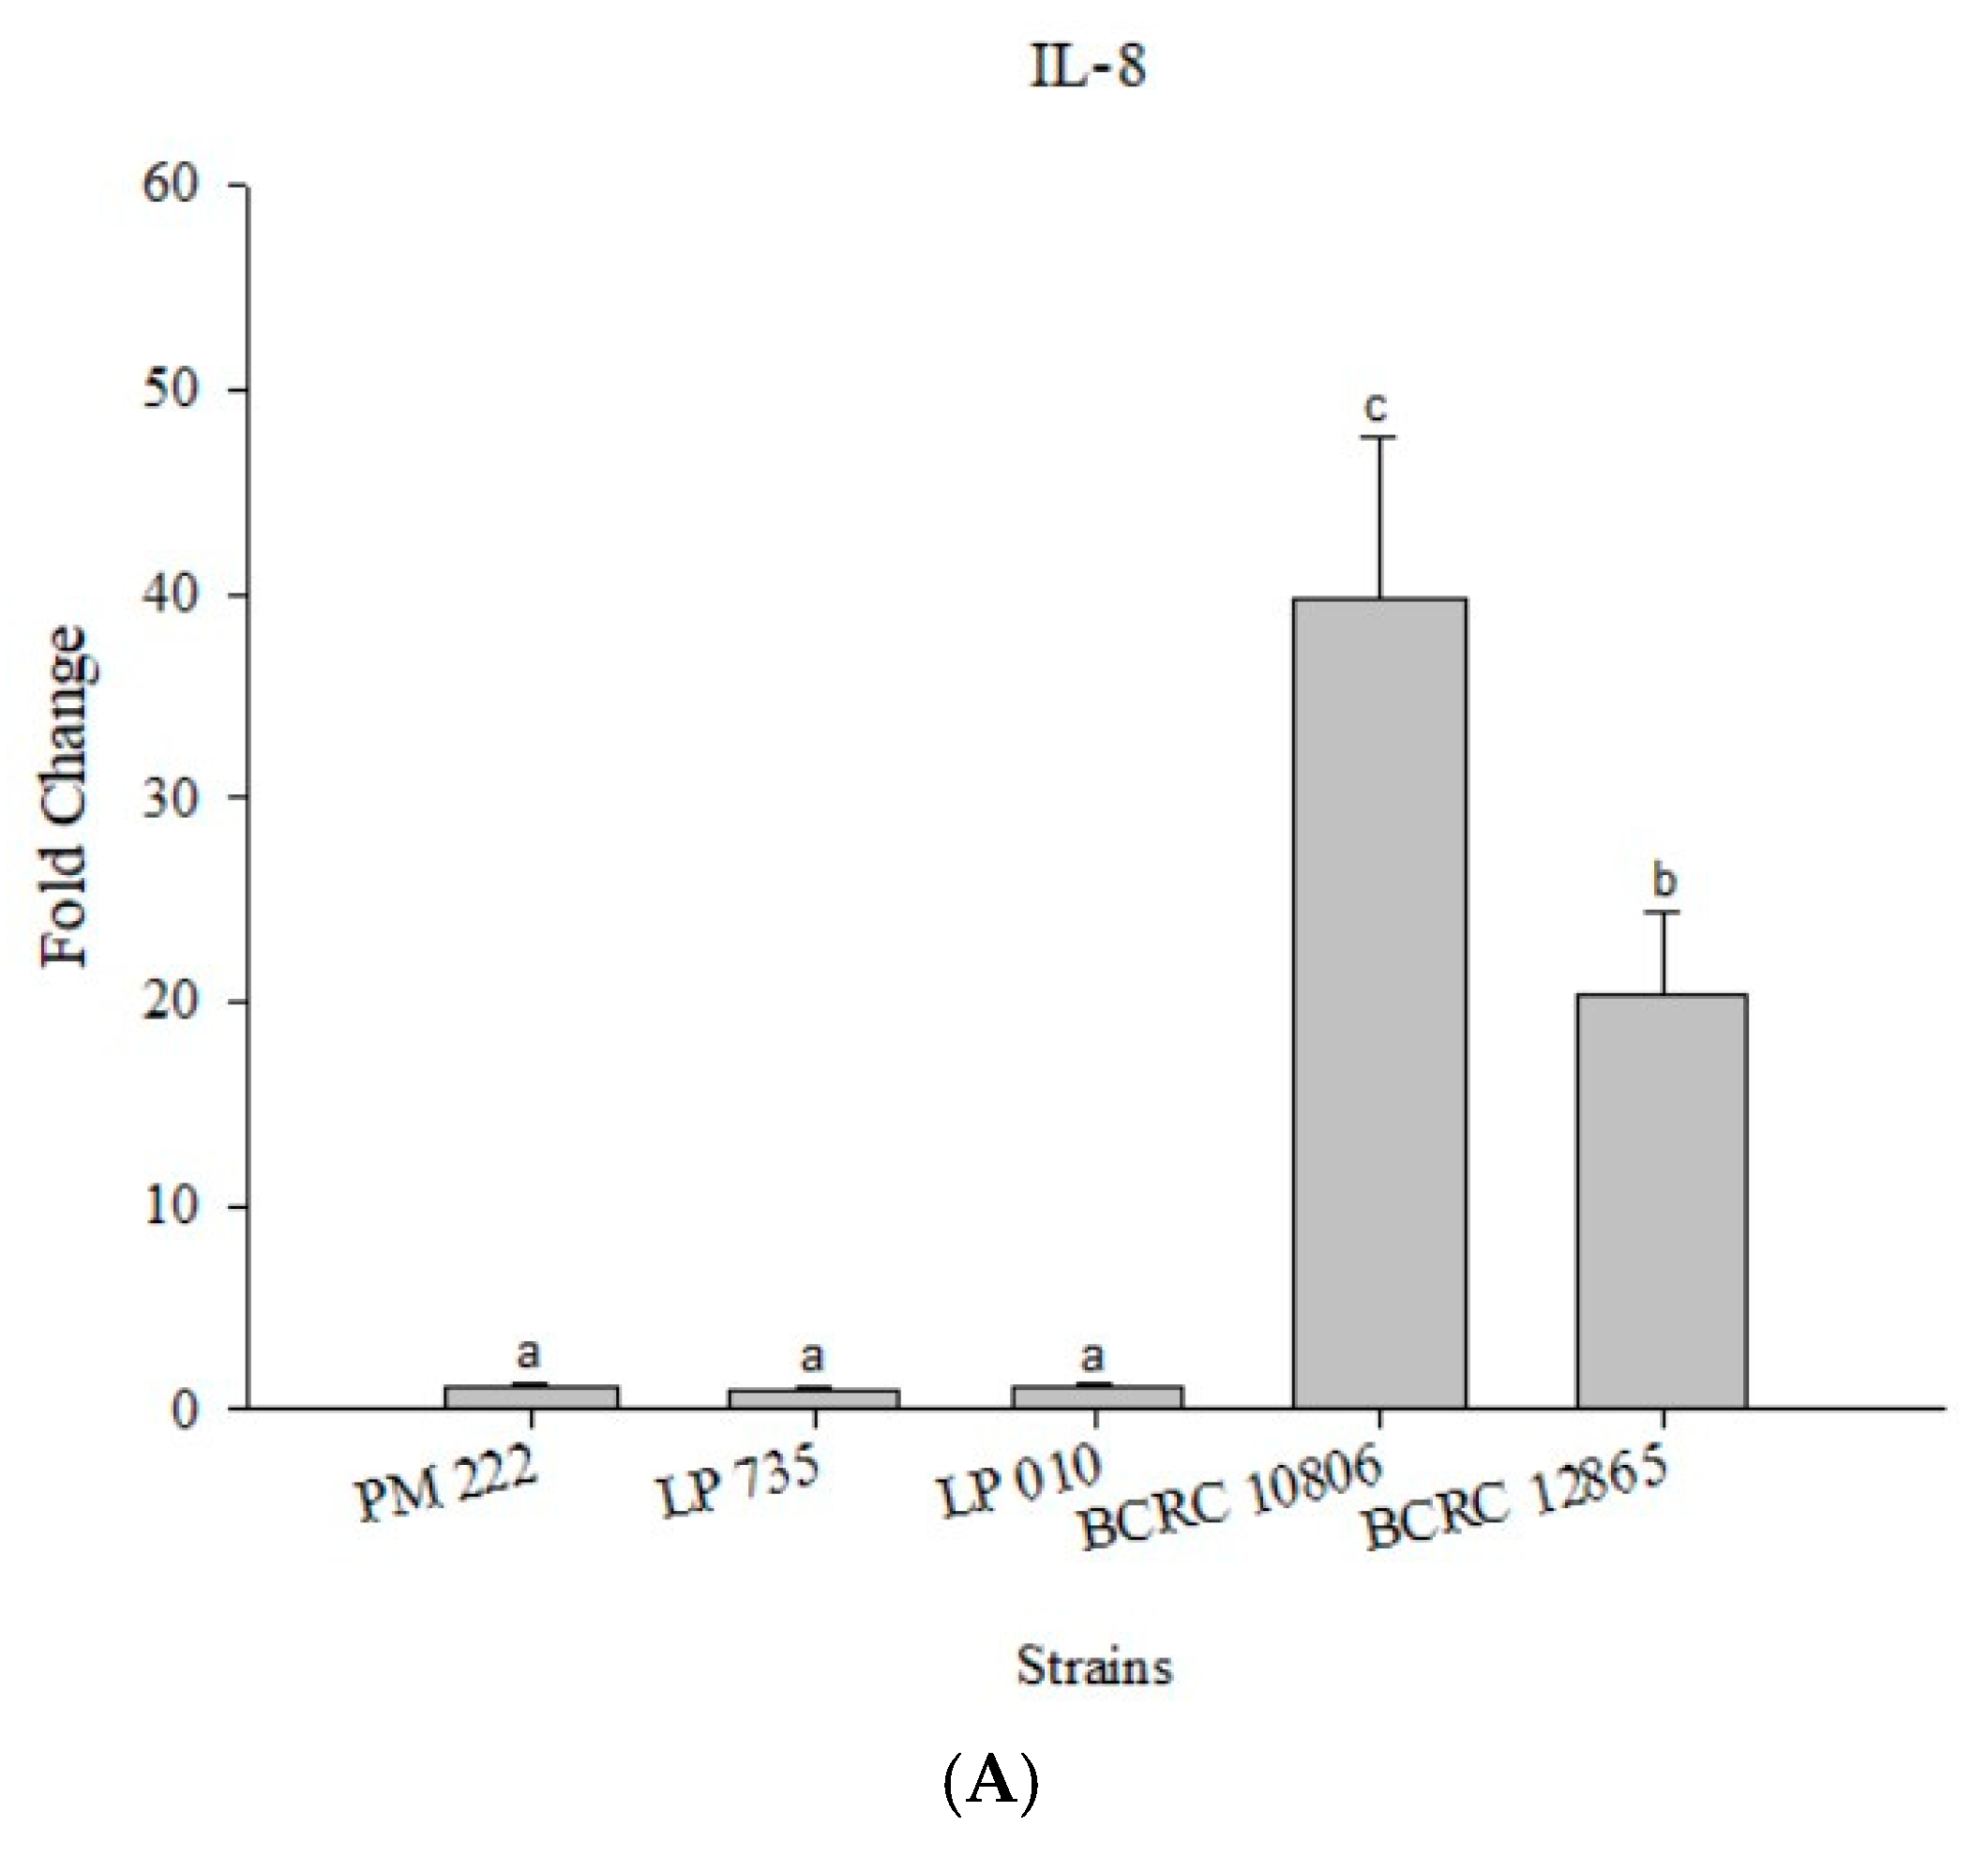
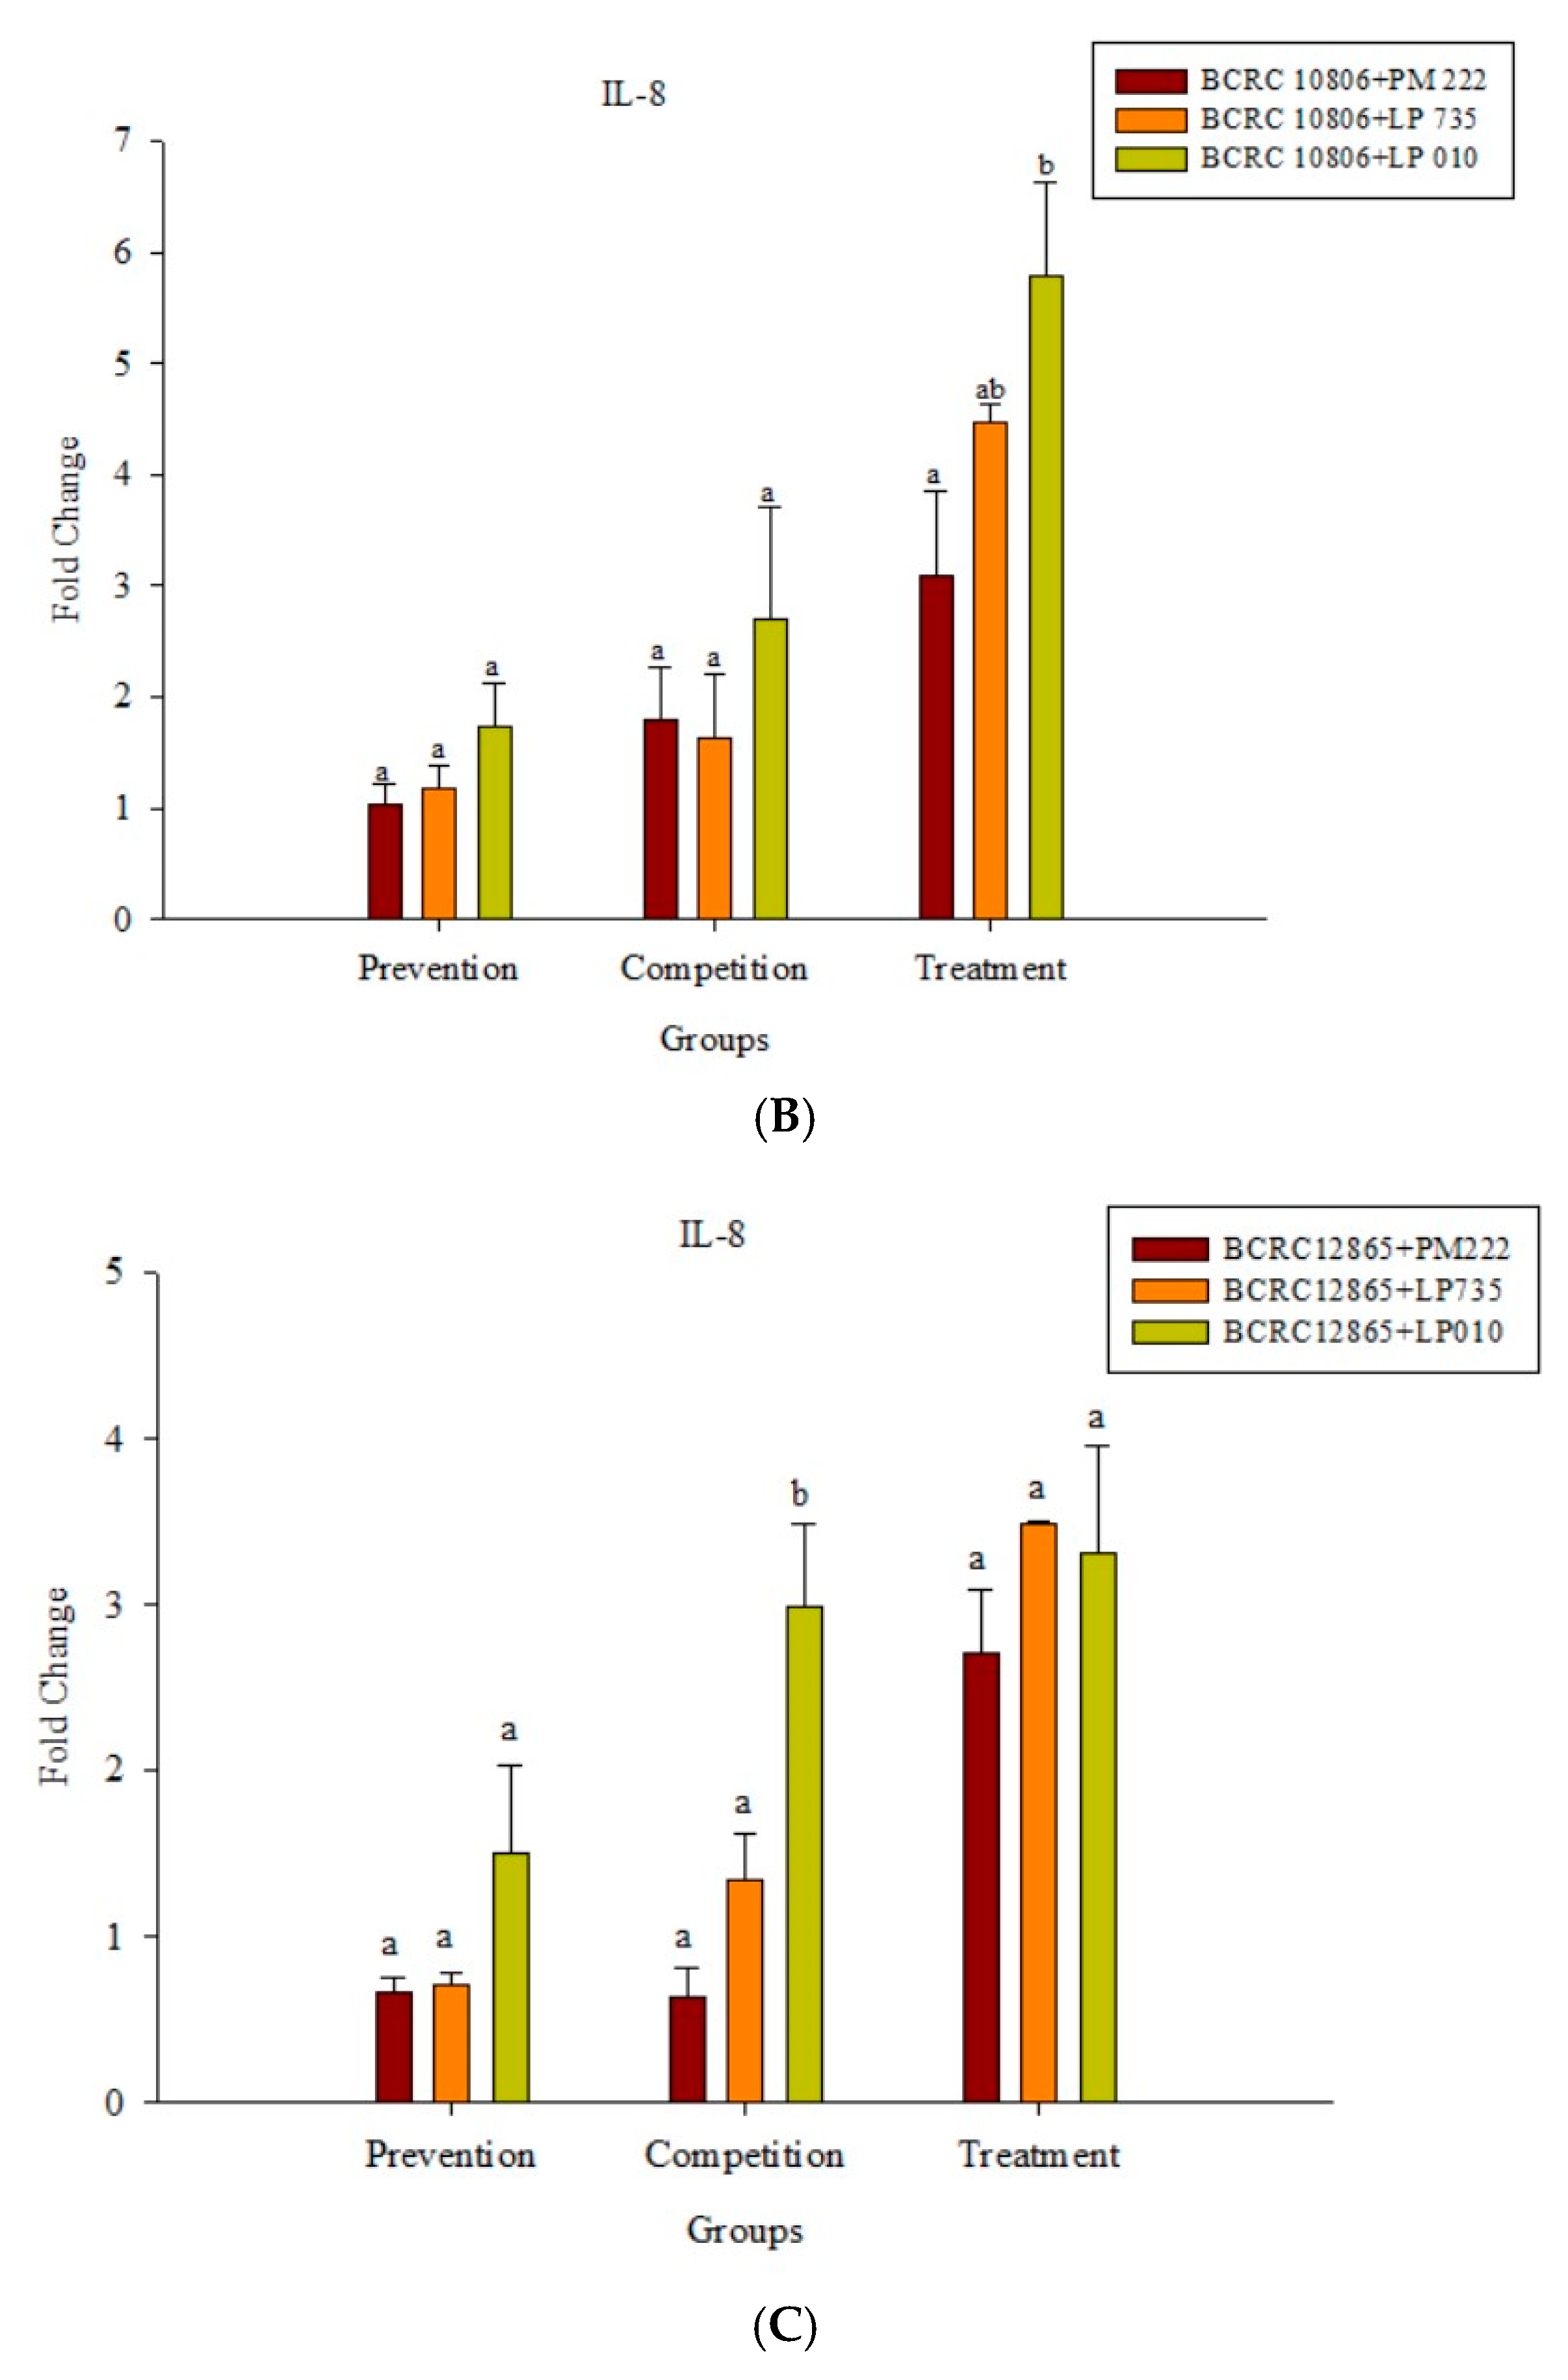
As shown in Figure 7A, IL-8 expression was very low in the HT-29 colorectal cancer cell line after treatment with LAB. In addition, two strains of V. parahaemolyticus were found to promote the expression of IL-8, but the expression of IL-8 was significantly higher in BCRC 10806-treated cells. All three strains of LAB were effective in the prophylaxis group, the treatment group, and the competition group compared with the group treated with V. parahaemolyticus alone (Figure 7B,C).
2.5. Adsorption Experiments on Mouse Epithelial Cells and Intestinal Mucus
Three strains of Lactobacillus had different degrees of adhesion to mouse intestinal epithelial cells and mucus. Our results showed that L. plantarum PM 222 and LP 010 had strongly adhered on intestinal epithelial cells (26.4 and 18.7 bacteria/cell, respectively) and adhered highly to mucus [Optical density (OD) 570 nm of 0.12 and 0.09, respectively] (Table 3). On the contrary, Lactobacillus plantarum LP 735 showed lower adhesion to both intestinal epithelium (14 bacteria/cell) and intestinal mucus (OD570 nm of 0.05).
2.6. Effect of LAB on Serum Immunity of V. parahaemolyticus in Mice
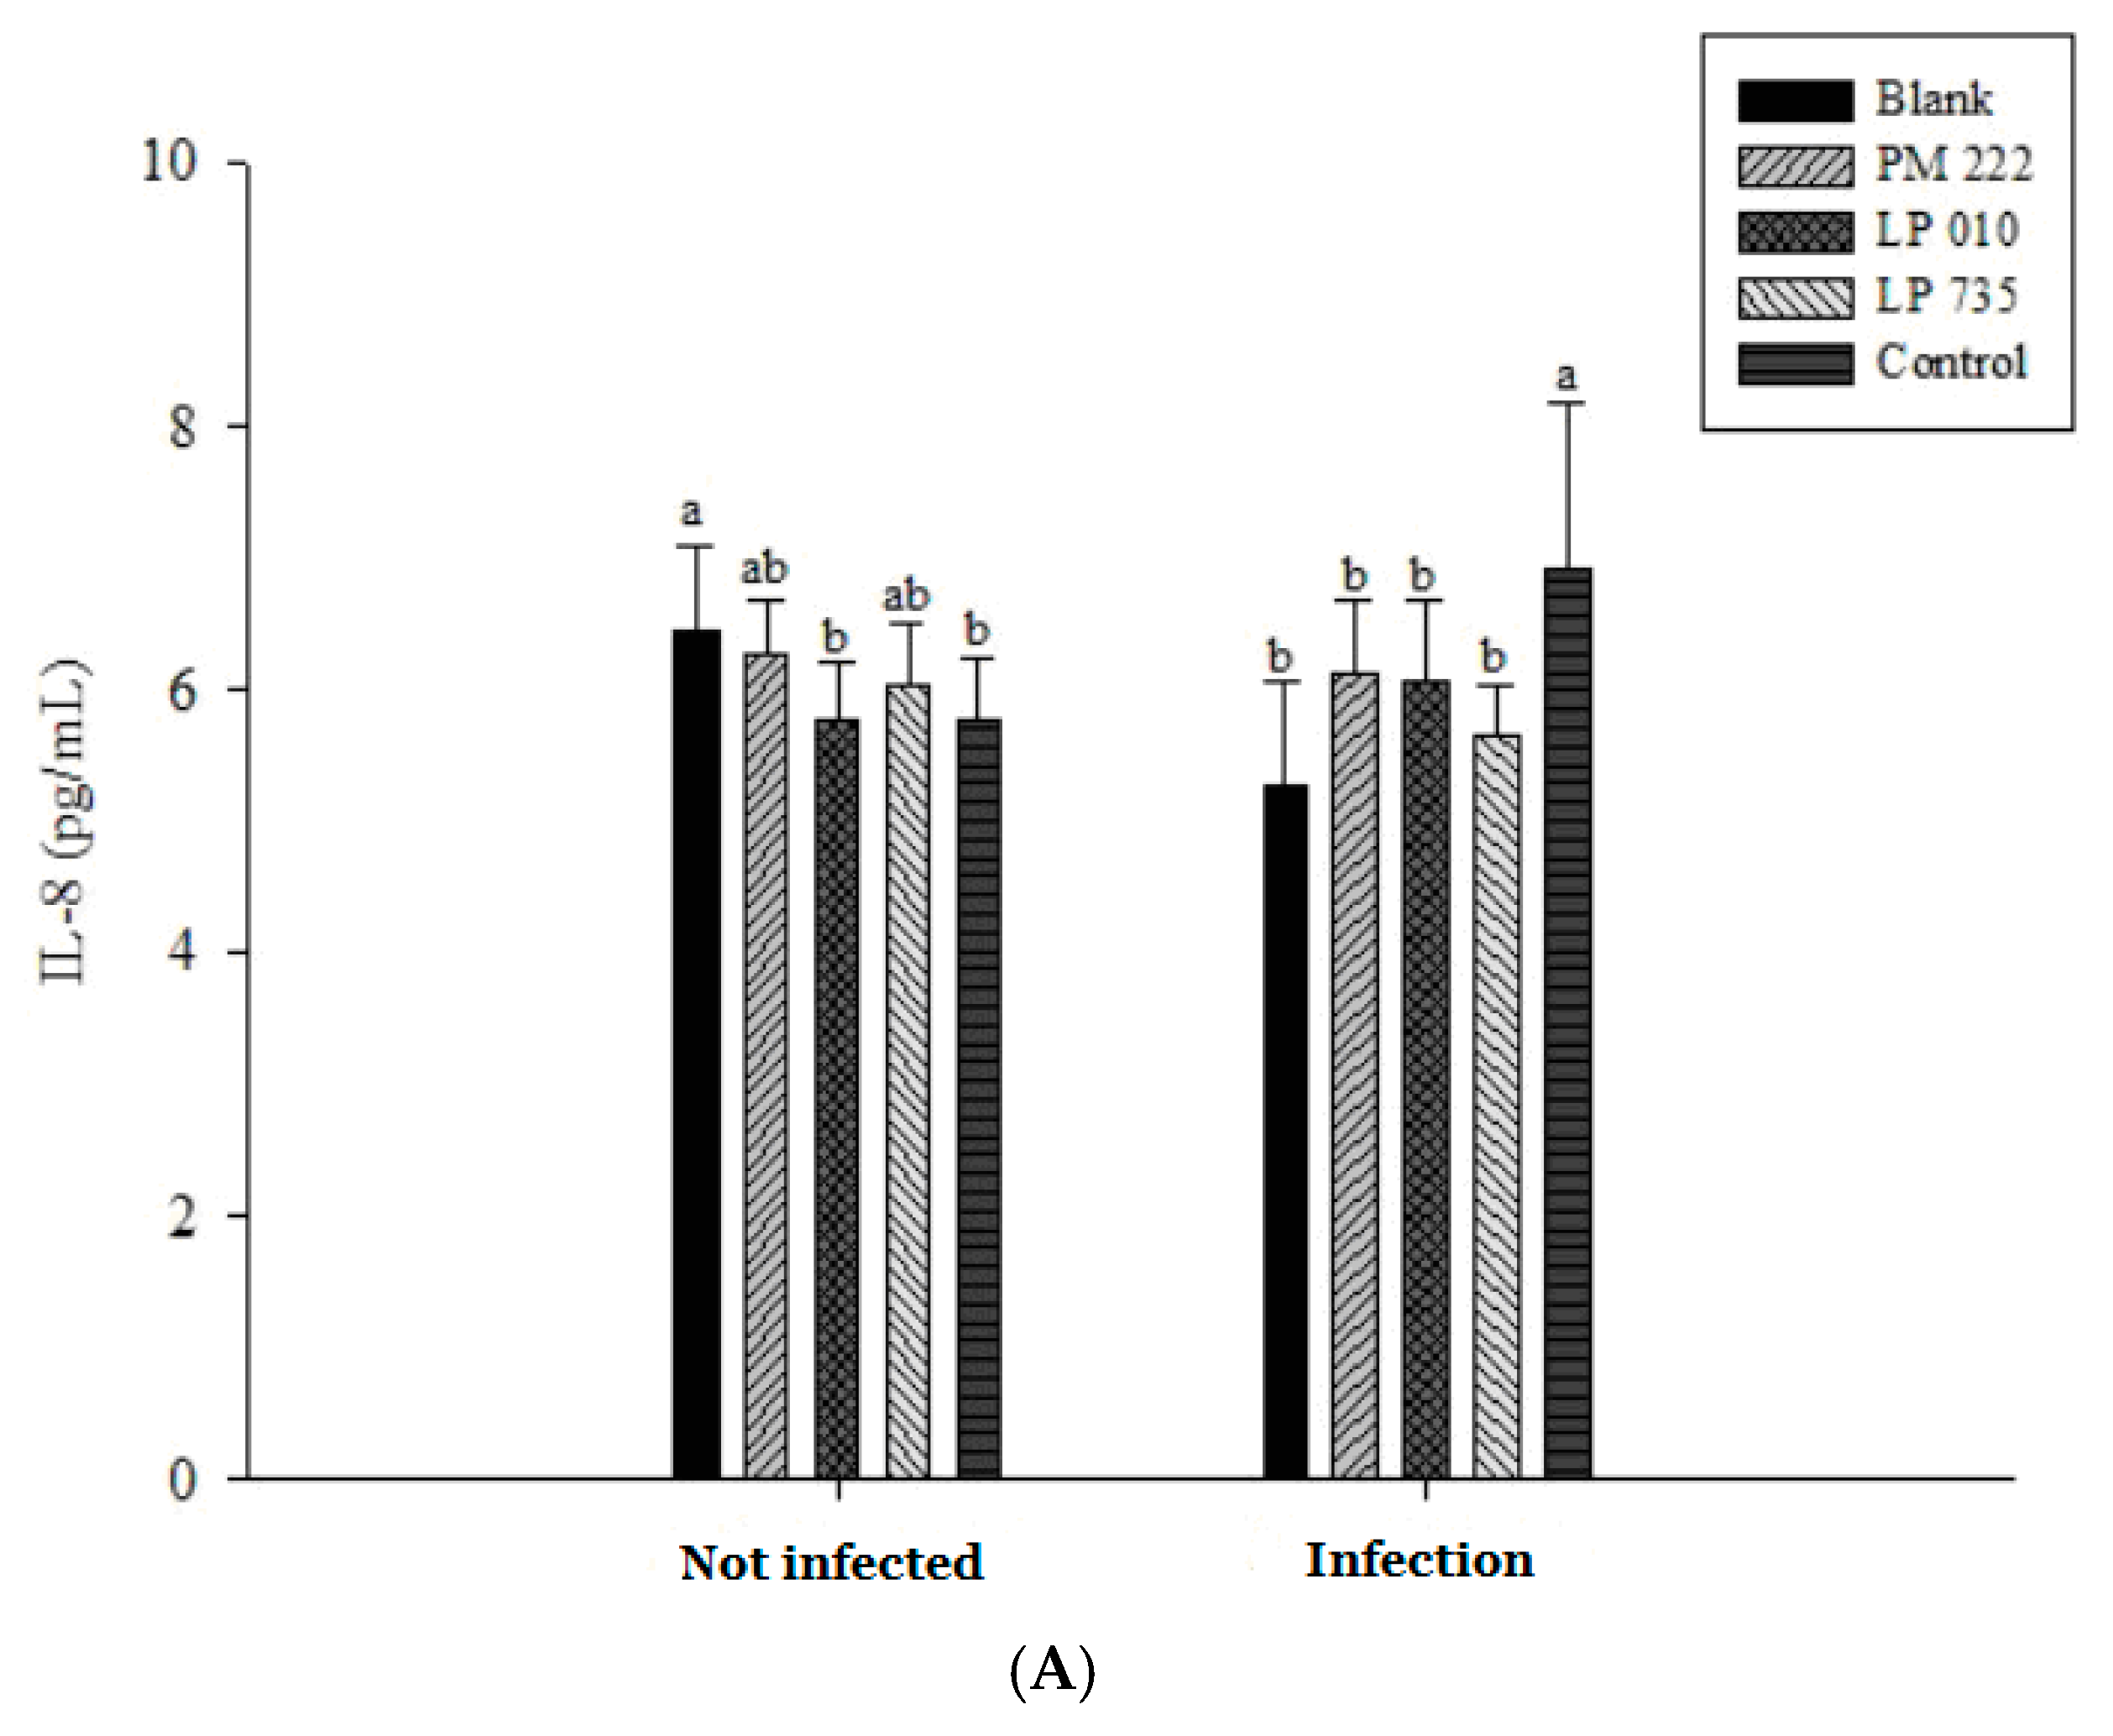
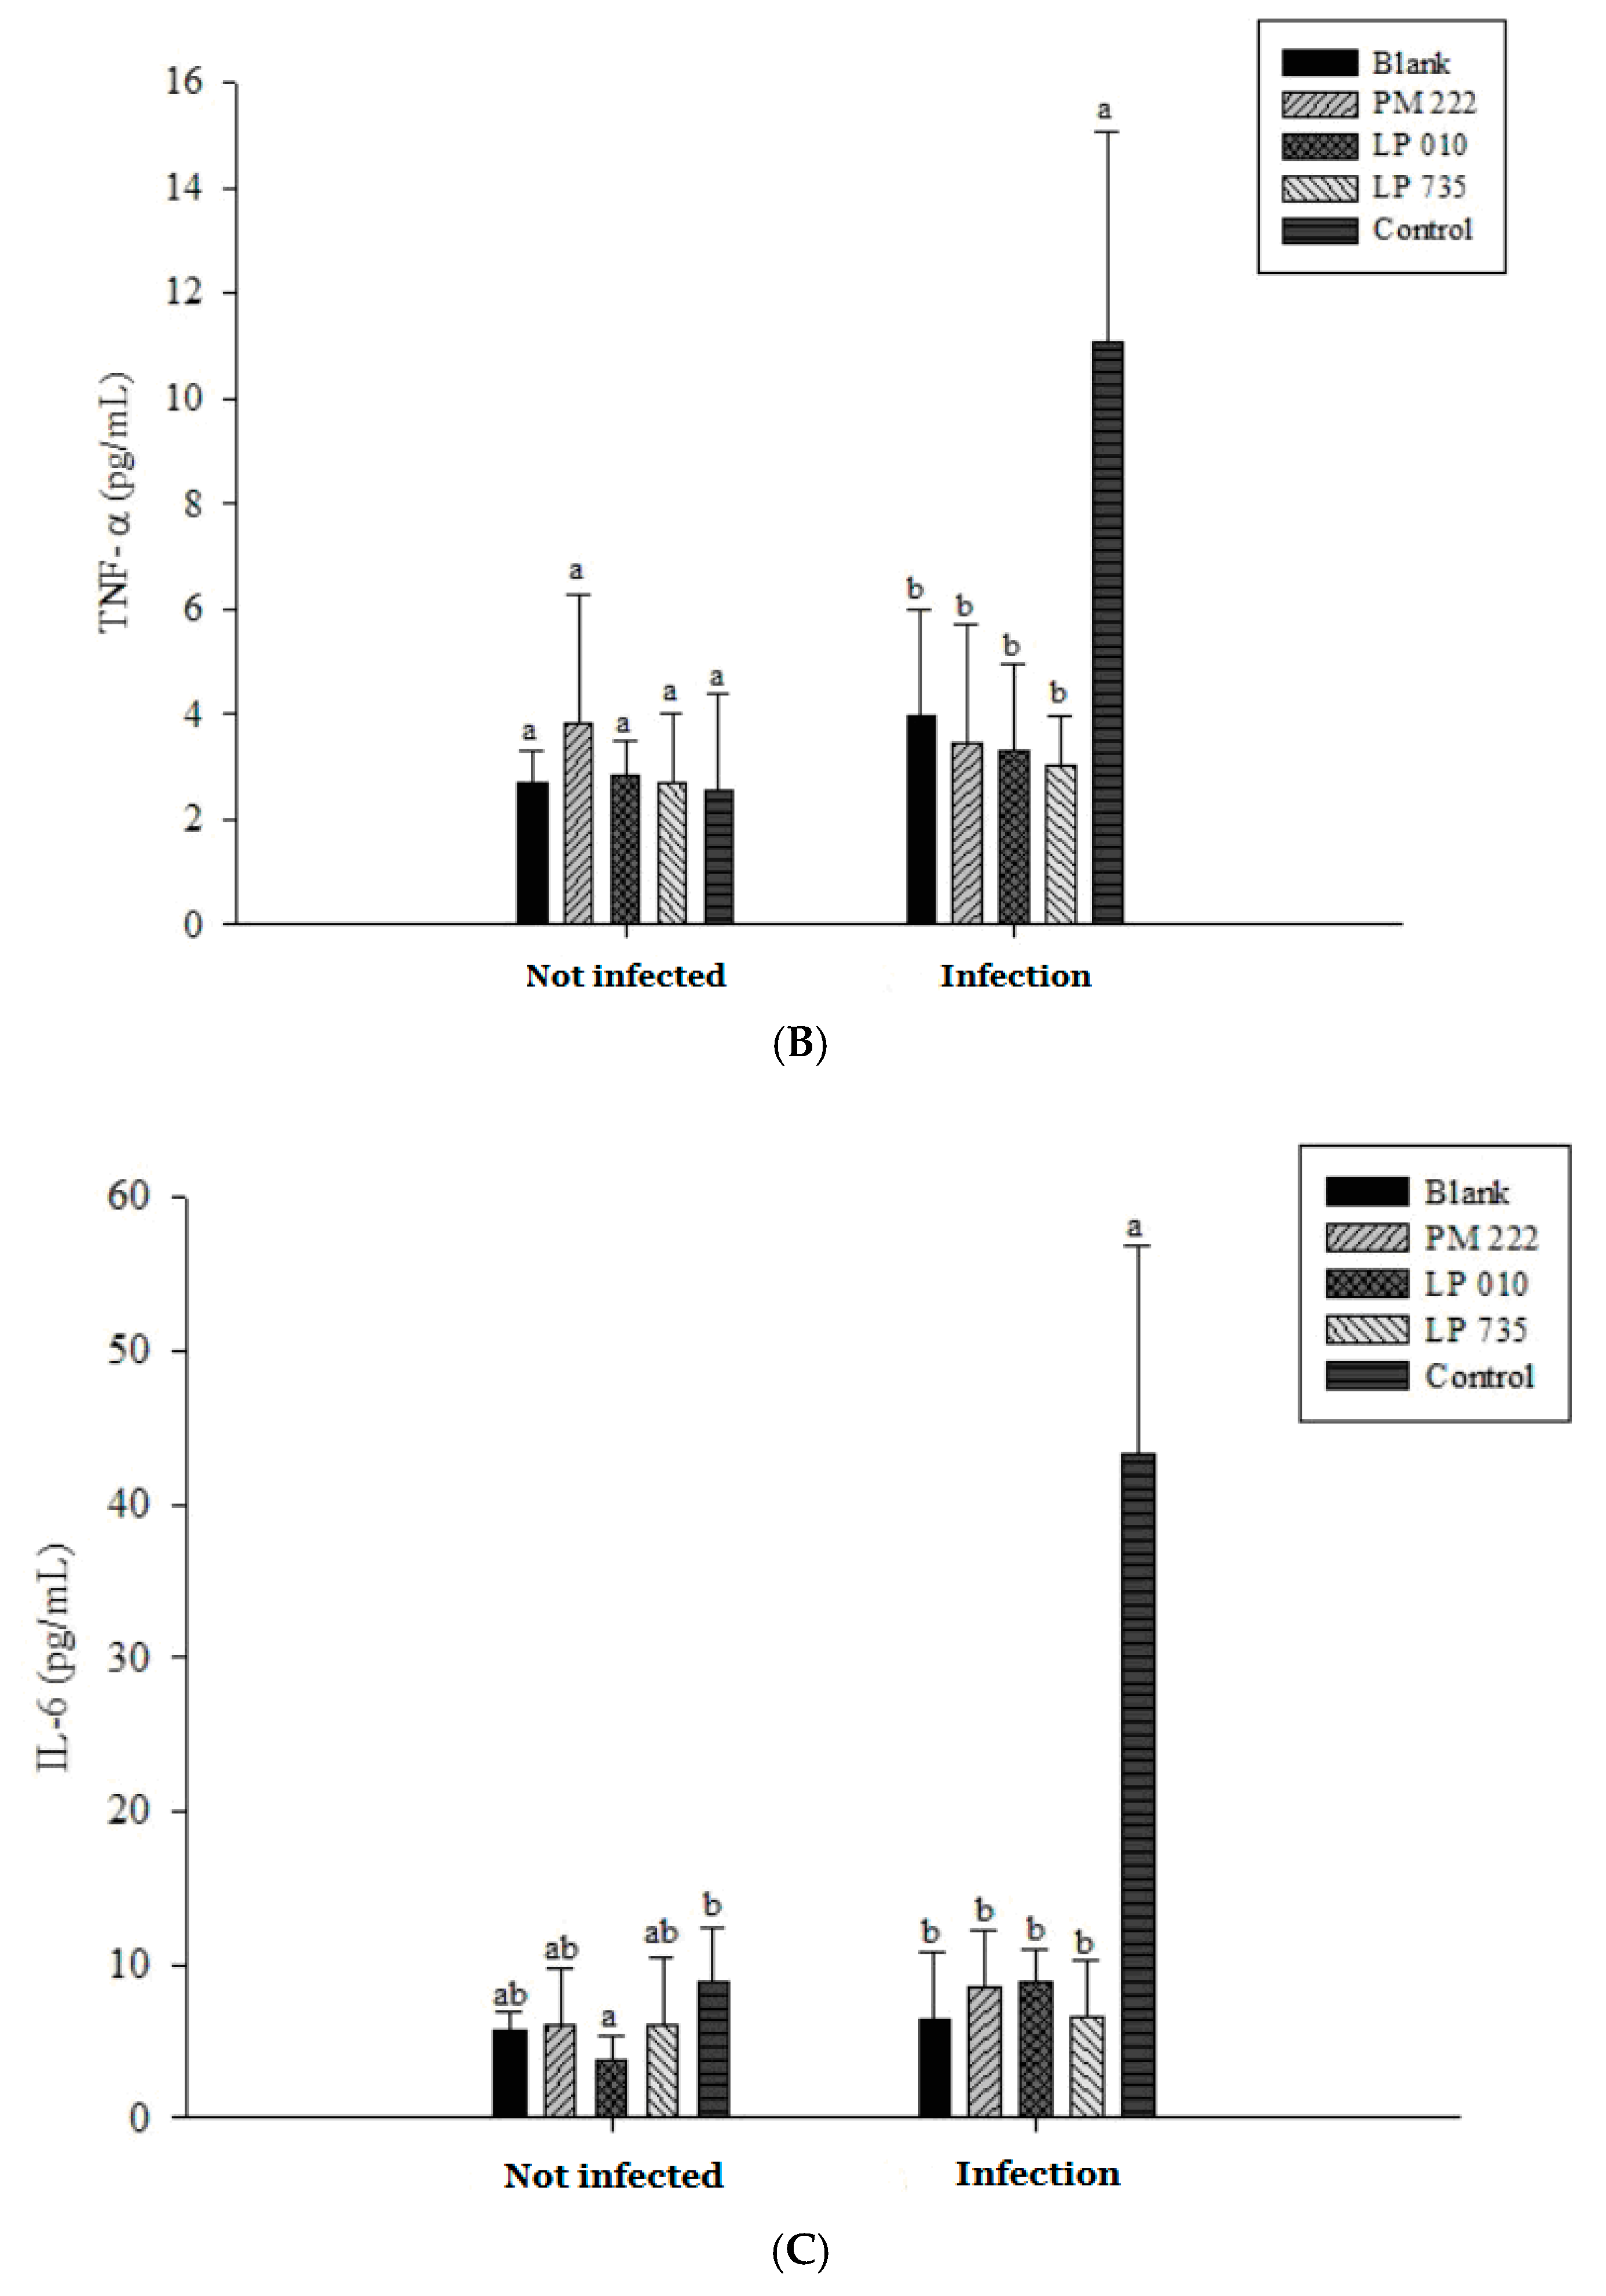
The results of IL-8 in serum showed that the group given V. parahaemolyticus alone was significantly different from the group treated with LAB (Figure 8A). However, IL-8 expression remained low in both instances, presumably because the V. parahaemolyticus infection was not sufficiently long to elicit a response. The amount of TNF-α expression can be seen in Figure 8B. TNF-α and IL-6 expression increased significantly in the V. parahaemolyticus-only treated group compared with that of the LAB group when continuously administered for seven days (Figure 8B,C). Therefore, we inferred that secretion of TNF-α and IL-6 by mice fed V. parahaemolyticus caused an inflammatory reaction.
2.7. Gut Histology Changes after Treatment with V. parahaemolyticus
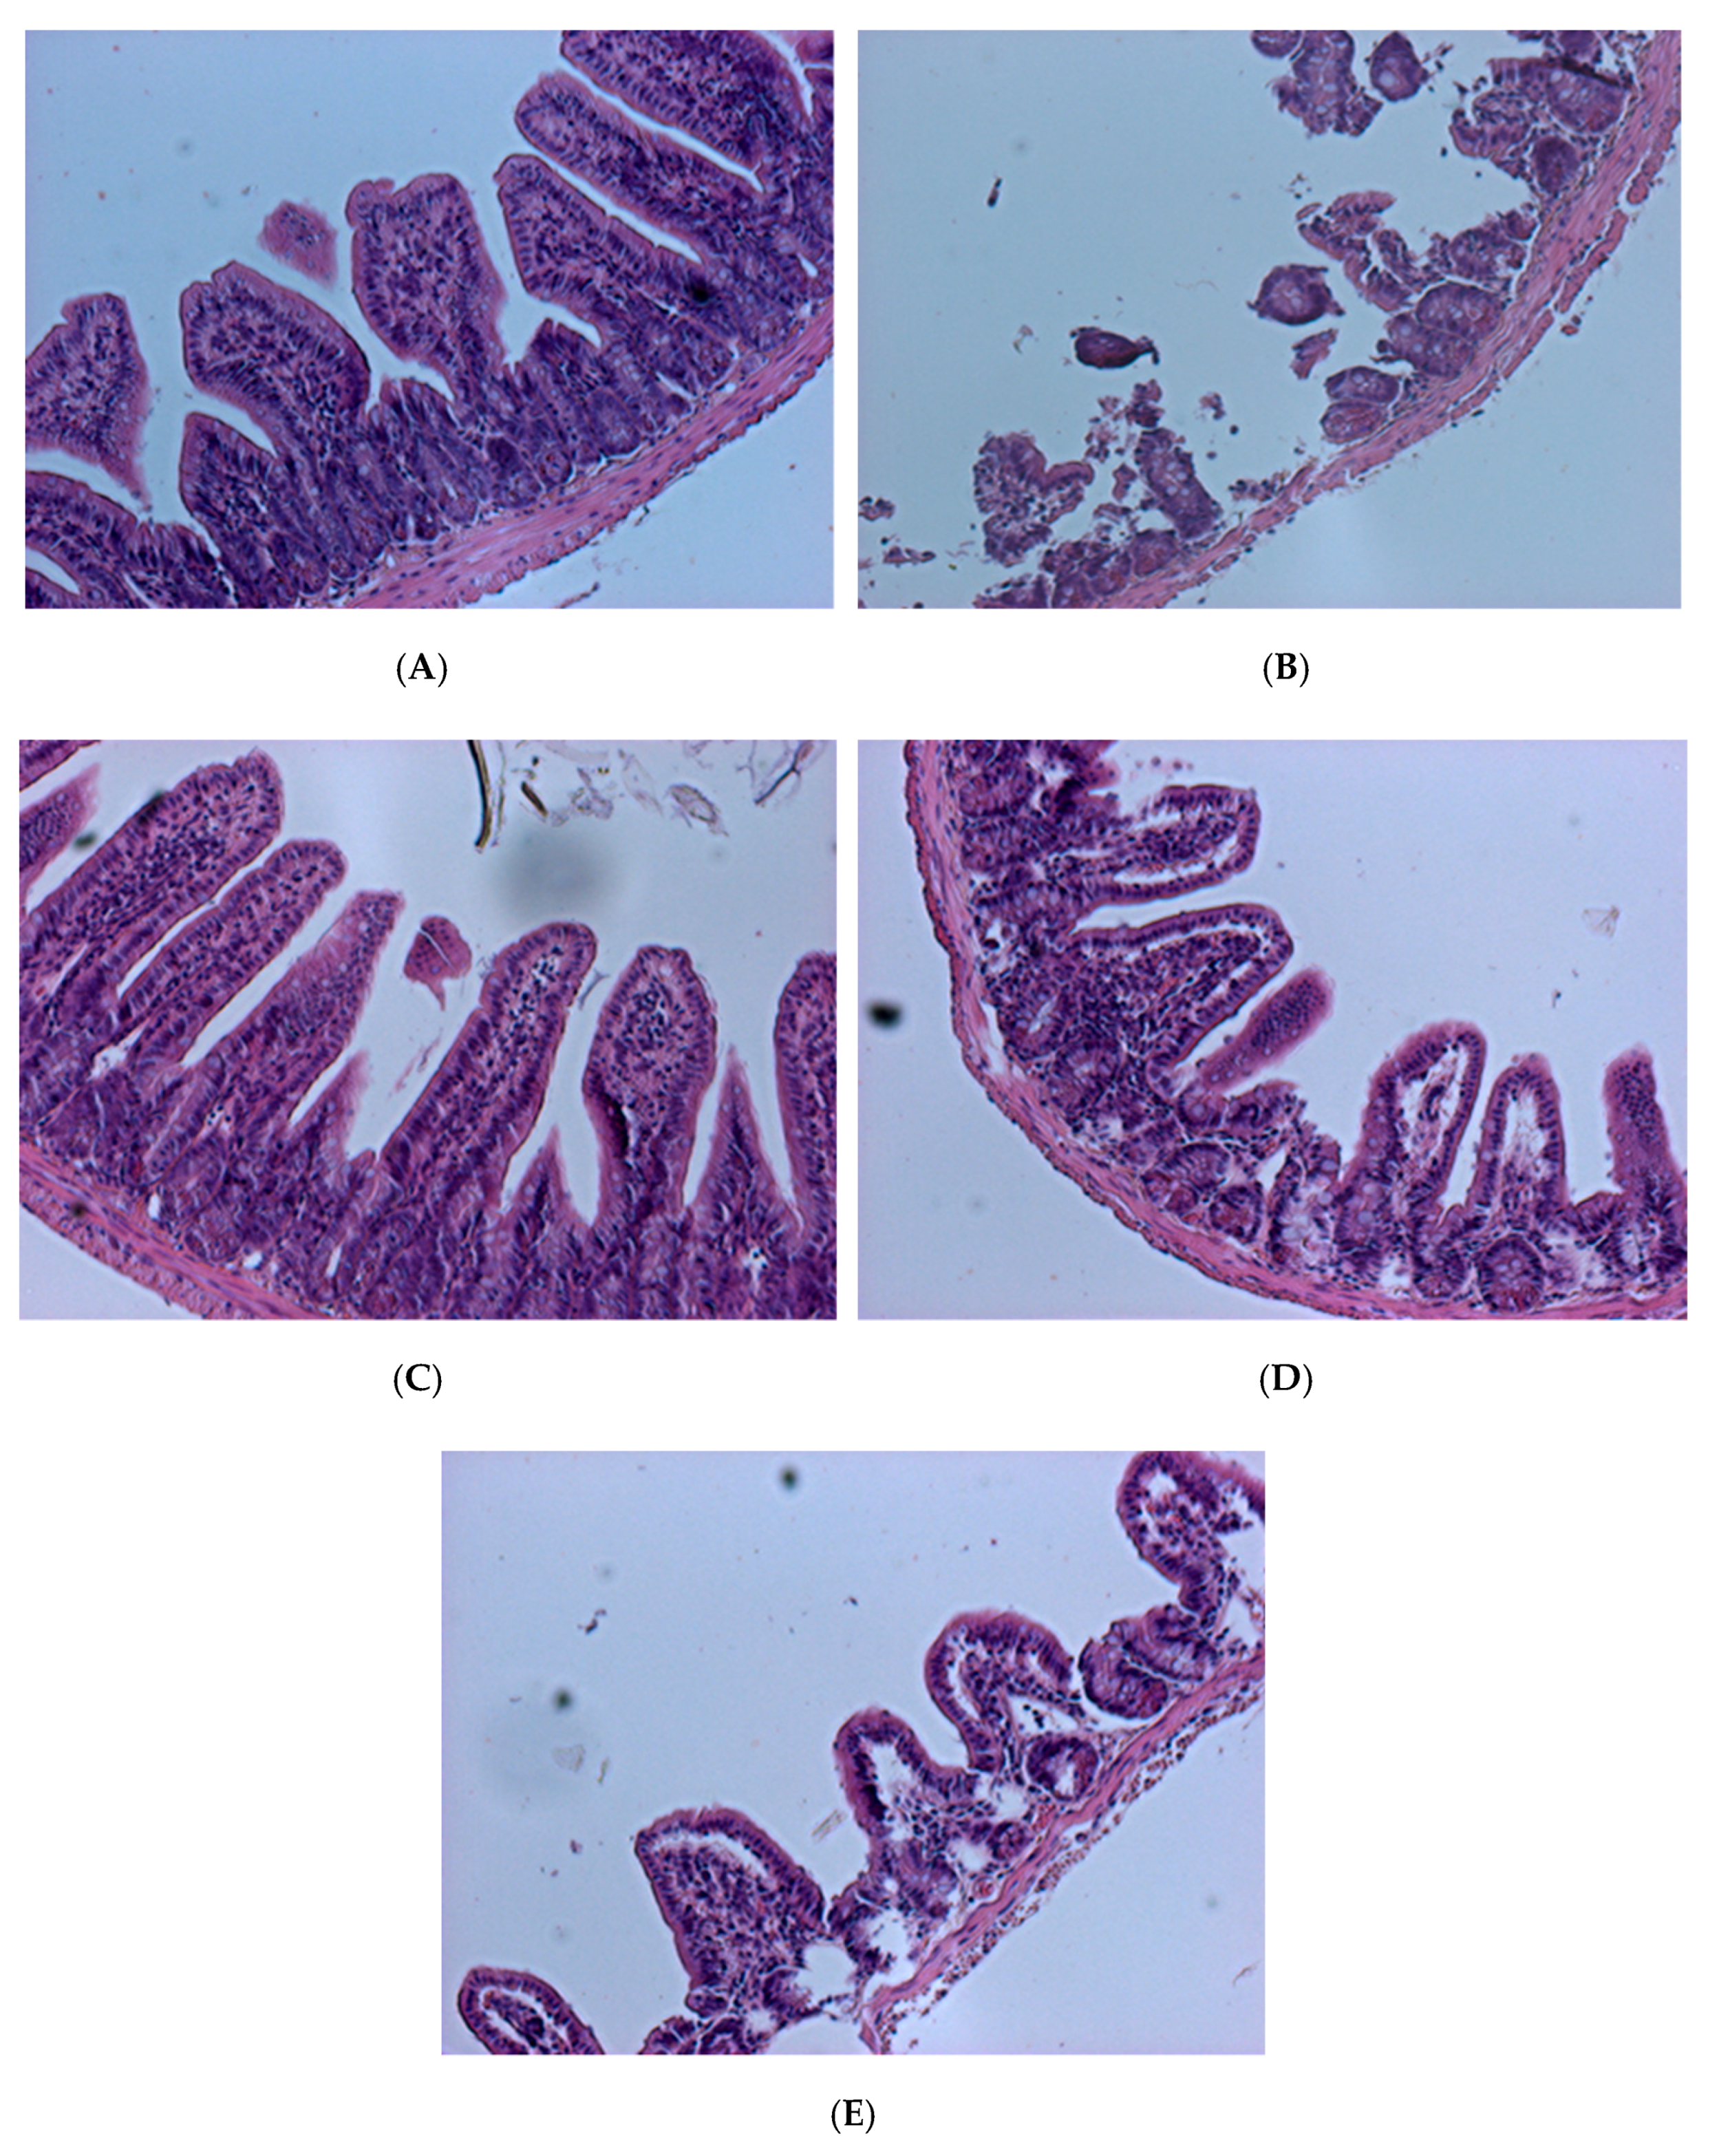
To confirm the degree of intestinal tissue damage caused by V. parahaemolyticus, tissue sections and Hematoxylin and eosin staining were performed (Figure 9 and Figure 10). Histological results showed that in the blank group of mice (fed PBS (phosphate buffer solution), not given V. parahaemolyticus), intestinal villi were long, slim, and regularly arranged with a normal appearance and pronounced structure (Figure 9A). Small intestine villi were severely damaged, and their integrity was lost in the control mice that were tube-fed with phosphate buffer solution (PBS) containing 109 CFU/mL V. parahaemolyticus BCRC 12865 24 h prior to sacrifice (Figure 9B). Mice fed the control L. plantarum PM 222 or LP 010 strains showed decreased villus injury in varying degrees after feeding with V. parahaemolyticus (Figure 9C,D). In mice treated with L. plantarum strain LP735, the villi were shortened, crowded, and irregularly arranged compared with the blank group (Figure 9E).
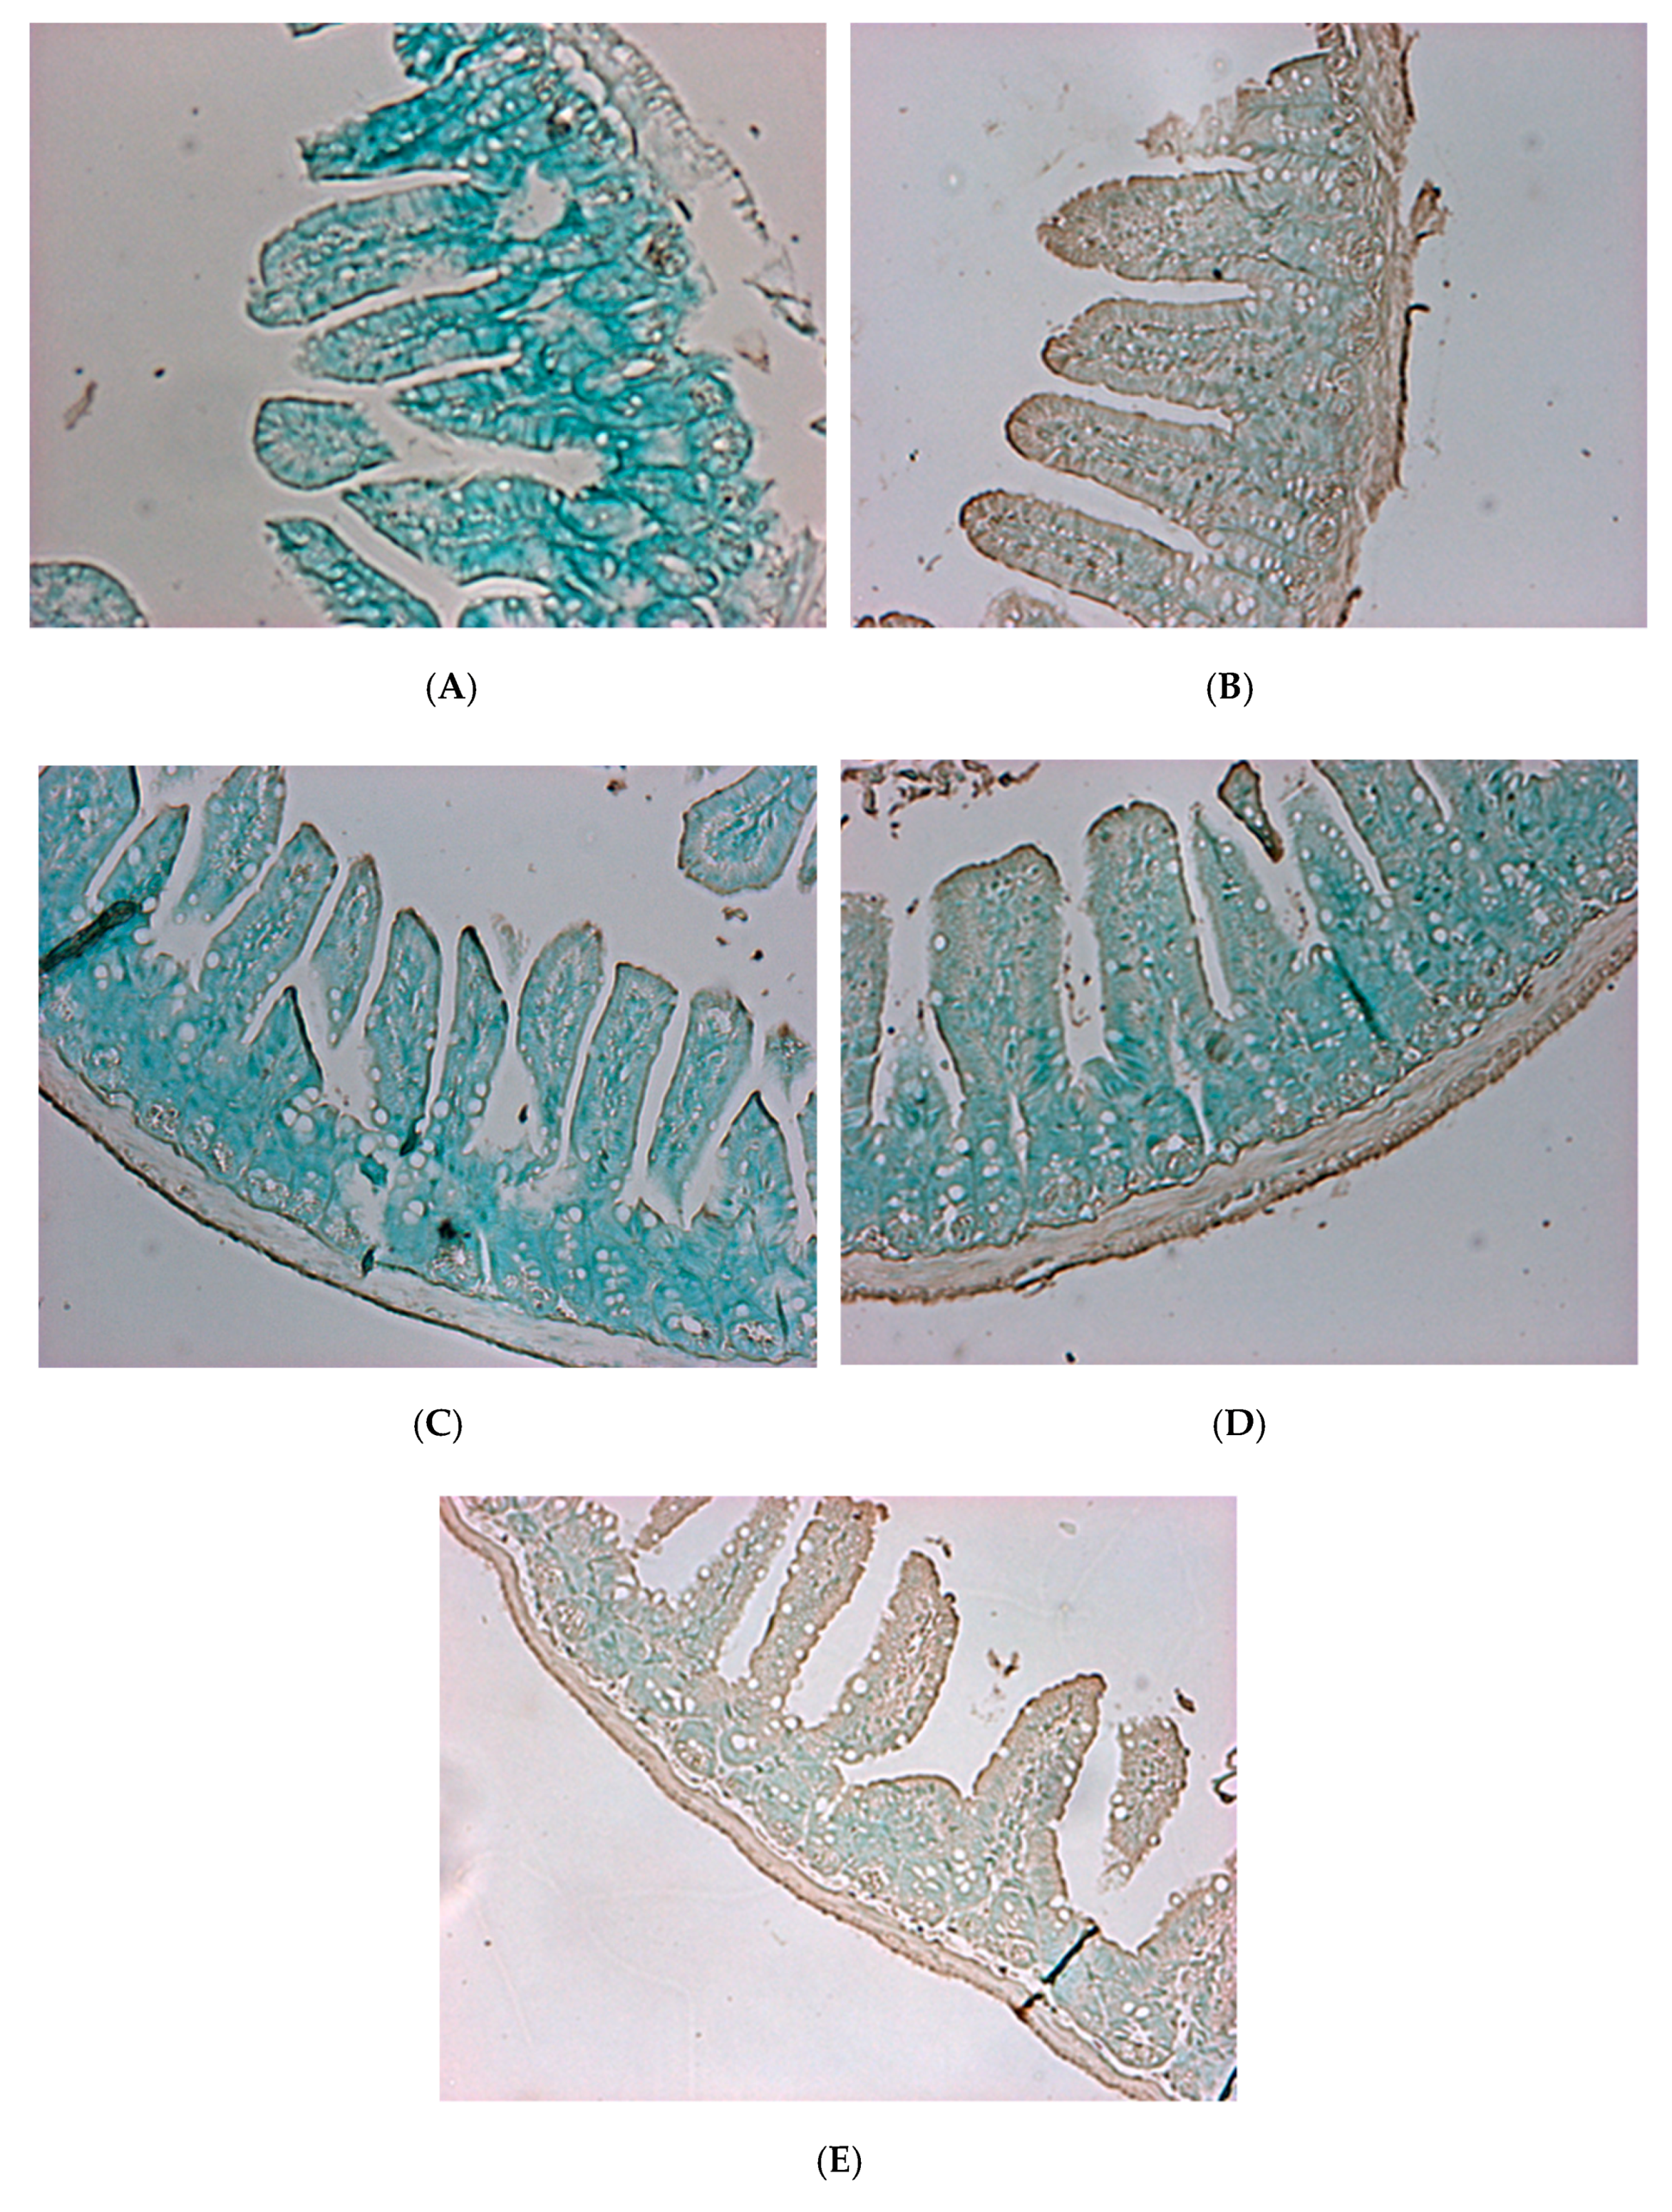
Apoptosis staining showed that almost no apoptosis occurred in the blank group mice (Figure 10A), whereas the control group (Figure 10B) showed extensive apoptosis. However, the L. plantarum PM 222- and LP 010-fed groups (Figure 10C,D) showed a small amount of apoptosis. The LP 735 group (Figure 10E) also had obvious apoptosis compared with the blank group, and the enteritis arc Hematoxylin and eosin-stained sections of the L. plantarum strains PM 222 and LP 010 in both strains of the BCRC 12865 group showed that the villi retained their integrity, showed less damage, and showed only a small amount of apoptosis. These results indicate that these two strains can protect mice against Vibrio spp. infection. According to experiments with the mouse intestinal mucosa and intestinal epithelial cells, LAB PM 222 were the most efficiently adsorbed. In the intestinal histology, PM 222 was also observed to have the best protective effect, proving that a strong adsorption capacity in LAB can reduce V. parahaemolyticus-induced damage.
3. Materials and Methods
3.1. LAB Strain and Cell Line Culture
L. plantarum PM 222, LP 010, and LP 735 strains isolated from fermented vegetables and identification with an API 50 CHL kit (La Balme Les Grottes, Montalien, Jeraen, France were cultured in Lactobacilli MRS (de Man, Rogosa and Sharpe) Broth with 0.05% l-cysteine. V. parahaemolyticus BCRC 10806 and BCRC 12865 were cultured in TSB (Tryptone Soy Broth). NaCl (2.5%) was added to the culture medium, and both LAB and V. parahaemolyticus strains were incubated at 37 °C for 18 h.
The Caco-2 cell line was grown in Dulbecco’s Modified Eagle Medium (DMEM). HT29 and Raw 264.7 cell lines were cultured in MEM (Minimum Essential Medium) supplemented with 10% FBS and sodium bicarbonate (NaHCO3). The cell cryostat was moved from the liquid nitrogen barrel to a 37 °C water bath for rapid thawing. Cell suspensions were thawed in a 75 T Cell Culture Flask or cell culture dish, and a sterile pipette was used to add the appropriate amount of cell culture medium. Cells were incubated at 37 °C at 5% carbon dioxide (CO2).
3.2. Cell Viability Analysis
Cell viability in response to V. parahaemolyticus and L. plantarum was determined following the methods described in Fernández et al. [11] with modifications. Caco-2 cells were seeded into a 24-well plate at 2 × 10⁵ cells/mL per well. After culturing for 24 h, the cell culture fluid was aspirated off, and cells were washed twice with PBS buffer solution. MTT assays, in response to V. parahaemolyticus (105 CFU/mL) and L. plantarum (107 CFU/mL), were performed at 2 and 4 h, respectively.
3.3. LAB Inhibits V. parahaemolyticus in Food Mode
V. parahaemolyticus was detected using the National Standards of Republic of China CNS 12358, N6210 (Food Microbiological Test—V. parahaemolyticus) methods and Montiel et al. [12]. Samples of snapdragon snapper were purchased at a shopping mall. Each sample weighed approximately 400 g. The surface of the film was irradiated with an ultraviolet (UV) lamp for 30 min. The bream fillets were cut into 20 g pieces. The thickness of each piece was kept as consistent as possible to ensure experimental accuracy. Inhibition experiments were conducted by adding a 1:100 ratio of V. parahaemolyticus (105 CFU/mL) and LAB (107 CFU/mL). LAB supernatant or LAB was added, and the samples were incubated at 4 °C or room temperature for 1 and 4 h; then, a 180-mL diluted solution PBS added by the stomach was patted for 2 min, serially diluted, and then poured into a petri dish with thiosulfate citrate bile salts (TCBS) sucrose agar. The colonies were incubated overnight at 37 °C, and colonies of V. parahaemolyticus grown in TCBS agar for identification medium was blue to green in color.
3.4. Levels of IL-1β, IL-6, IL-8, and TNF-α Cytokines Measured by ELISA
The methods of Gueimonde et al. [13] and Satish Kumar et al. [14] were used with some modifications. LAB (1 mL; 109 CFU/mL) and V. parahaemolyticus (108 CFU/mL) were each centrifuged at 10,000 rpm for 10 min. The supernatant was discarded, washed twice, and then dissolved in 1 mL of cell culture medium and diluted to the required number of experimental bacteria for later use.
To observe the integrity of the HT-29 and RAW 264.7 cell lines in the 75 T Cell Culture Flask, the cells were cultured in the shape of an angled petri dish. Cells were detached from the petri dish with trypsin-EDTA (Ethylenediaminetetraacetic acid) or a cell scraper. Cell count was determined with a hemocytometer, and the cell concentration was adjusted to 3 × 10⁵ and 2 × 10⁵ cells/mL. Cells were added to a 24-well plate, uniformly mixed, and incubated at 37 °C and 5% CO2 for 48 h. After confirmation of complete cell attachment, the old medium was aspirated and washed twice with PBS. The experiment was conducted in 3 experimental modes: (1) Prevention: LAB (107 CFU/mL) was added for 2 h followed by V. parahaemolyticus (105 CFU/mL) for 15 h; (2) Competition: LAB and V. parahaemolyticus were added simultaneously and incubated for 17 h; and (3) Treatment: V. parahaemolyticus was added for 2 h before adding LAB for 15 h. After the incubation time, the cell supernatant was collected and stored at −20 °C until use.
The cell cultures of the above experiments were collected and modified according to the methods of Lian et al. [15] and Shimohata et al. [1]. IL-8, IL-6, IL-1β, and TNF-α concentrations were determined by ELISA. The ELISA was performed using the Becton, Dickinson and Company (BD) Biosciences Kit according to the manufacturer’s instructions.
3.5. Total RNA Extraction
RNA extraction was performed according to the methods of Matlawska-Wasowska et al. [16] and Shimohata et al. [1]. Caco-2, Raw 264.7, and HT-29 cells were inoculated at 2.5 × 10⁵, 3.5 × 10⁵, and 4 × 10⁶ CFU/mL into 10-cm cell culture dishes and cultured for 24 to 48 h. Then, LAB (107 CFU/mL) and V. parahaemolyticus (105 CFU/mL) were added for 11.5–15 h, respectively. After incubation, cells were washed twice with PBS, and PBS was aspirated completely before 1 mL of TRIzol solution was added to lyse the cells. After the cells were fully lysed, lyzed cells were added to a 1.5-mL microcentrifuge tube using a cell scraper. A total of 400 μL of chloroform was added, and the sample was mixed for 10 min. The tubes were centrifuged at 12,000 rpm for 15 min at 4 °C. After centrifugation, 2–300 μL of supernatant was carefully drained into a new microcentrifuge tube. The DNA extracted into the middle layer was centrifuged once more. The supernatant was added to 500 mL of isopropyl alcohol (isopropanol), gently mixed, and allowed to stand for 10 min before being centrifuged at 12,000 rpm for 15 min at 4 °C. The supernatant was removed, washed with 1 mL of 70–75% alcohol, and centrifuged. Any remaining supernatant was removed, and the pelleted sampled was placed in an exhaust hood to dry. Finally, 50 μL of diethyl pyrocarbonate (DEPC)-treated water was heated to 65 °C for 5 min; the RNA was fully dissolved with DEPC water, Deoxyribonuclease I was added to remove DNA in the sample, and the final RNA sample was stored at −80 °C.
3.6. Real-Time Quantitative Polymerase Chain Reaction
Using a SuperScript® (Invitrogen, Carlsbad, CA, USA) III First-Strand Synthesis SuperMix for real-time quantitative PCR (qRT-PCR), 1 g of total RNA was weighed into a PCR tube, and 10 μL 2X RT Reaction Mix and 2 μL RT Enzyme Mix were added to make up to a total volume of 20 μL. Subsequently, the PCR tubes were heated at 25 °C for 10 min, 50 °C for 30 min, and then 85 °C for 5 min to terminate the reaction. Finally, 1 μL (2 U) of E. coli RNase H was added and reacted at 37 °C for 20 min to remove excess RNA. The synthetic cDNA was stored at −20 °C.
Gene expression analysis was based on a comparison with the housekeeping gene β-actin as a control, and the fold change was calculated by a previously described formula [17]. With the KAPATMSYBR® (Roche, Woburn, MA, USA) FAST qPCR Kit, the total PCR volume was 20 μL. DEPC water was added to the first 8 rows, and then 0.4 μL of Forward Primer (10 μM), 0.4 μL of Reverse Primer (10 μM), 10 μL of KAPATMSYBR® FAST qPCR Master mix (2X) Universal, 0.4 μL of ROX LOW, and 2 μL of cDNA were added and into the ABI7500 system real-time PCR machine. Taking β-actin as an example, the reaction conditions were as follows: 94 °C for 5 min, 40 cycles at 94 °C for 30 s, 57 °C for 1 min, and 72 °C for 40 s. To confirm that the PCR product was a specific product, the dissociation curve mode was used: 95 °C for 15 s, 60 °C for 1 min, and 95 °C for 15 s.
Real-time quantitative PCR data were analyzed using the 2−ΔΔCt method, which Livak and Schmittgen used in 2001 [18]. The formula is as follows:
Fold Change = 2Ct target (control) − Ct target (treatment)/2Ct β-actin (control) − Ct β-actin (treatment)
The fold change of the formula is the relative performance of the test gene mRNA in the experimental group calculated as the housekeeping control gene (β-actin).
3.7. LAB Treatment to Inhibit V. parahaemolyticus Infection in Animal Model
Forty male BALB/c five-week-old mice were purchased from Bio Lasco, Taiwan Co., Ltd., Taipei, Taiwan and were housed in individually ventilated cages (IVC). The litter was fed for one week with Lignocel FS14 (Rettenmaier & Söhne, Rosenberg, Germany). The feed was given to Altromin 1324 (Altromin GmbH, Lage, Germany) after weight distribution to each group, at the age of 6 weeks of age to start the experiment.
Viral BCRC 12865 was modified according to Yang et al. [19] to investigate whether it affects gut and immune responses in mice. Mice were divided into 5 groups with 8 mice in each group, which were fed with (1) L. plantarum PM 222 (108 CFU/day), (2) L. plantarum LP 010 (108 CFU/day), or (3) L. plantarum LP 735 (108 CFU/day) for 7 consecutive days. The blank control group (4) and control group (5) were fed with PBS. On the 8th day, 200 μL of V. parahaemolyticus BCRC 12865 (109 CFU/day) was fed to the mice in the control group and the experimental group. The blank control group was only fed 200 μL of PBS. After the administration of V. parahaemolyticus for 24 h, mice were sacrificed, and intestinal and blood samples were collected.
The experiment was performed according the method described by Yang et al. [19]. Mouse small intestine cells were detached using mesh and collected into 5 mL DMEM. The suspension was washed twice by centrifugation at 100 rcf for 10 min. After 1 mL of LAB (109 CFU/mL) and 1 mL of epithelial cells were mixed, they were incubated at 37 °C for 1.5 h. Bacteria-bound epithelial cells were centrifuged at 100× g for 10 min and washed twice with PBS. Cells were applied to a slide for Gram staining. LAB counts on epithelial cells were performed using an optical microscope at 400× magnification.
The inner surface of the mouse small intestine (duodenum, jejunum, and part of the ileum) was isolated using mesh, and the mucus was collected in 250 μL of ice-cold PBS. The resulting suspension was mixed and centrifuged at 12,000 rcf for 10 min to remove cell debris and bacteria. The supernatant was collected, the protein concentration was measured using a UV spectrophotometer, and the absorbance was measured at 280 nm. Mucus extract (150 μL; 0.5 mg protein/mL) was added to a 96-well plate and incubated overnight at 4 °C. After overnight incubation, the cells were washed with PBS, and 100 μL (109 CFU/mL) of LAB and PBS were added and incubated for 2 h at 20 °C. After culturing, cells were washed 3 times with PBS. The adherent bacteria were fixed at 60 °C for 20 min and stained with 100 μL of filtered 0.5% crystal violet solution for 45 min. After staining, cells were washed with PBS 5 times and treated with 100 μL of citrate buffer (20 Mm, pH 4.3) for 45 min at room temperature. Absorbance was measured with a microplate spectrometer at a 570 nm wavelength. The average absorbance value indicates the ability of the strain to adsorb mucus.
Tissue sections were stained with hematoxylin and eosin (H & E) and observed under a microscope. First, the sliced specimen was desensitized, soaked in hematoxylin solution for 3 min, and washed with ddH2O. Then, the sample was soaked in 85% alcohol for 1 min, eosin solution for 5 min, and then in 70%, 80%, and 90% alcohol, and finally 100% ethanol was added for 2 min. The xylene solution was soaked for 30 s (twice), then dried and sealed [20,21]. The occurrence of apoptosis was confirmed by TUNEL (Terminal deoxynucleotidyl transferase dUTP nick end labeling) staining. Apoptosis staining procedures were performed as described in the Apo-BrdU-IHCTM in situ DNA fragmentation assay kit (catalog no. K403-50; BioVision, Mountain View, CA, USA) for staining to further observe apoptosis of the tissue cells.
3.8. Statistical Analysis
Data were statistically analyzed using the Statistical Product and Service Solutions version 20.0. The values are expressed as means ± standard deviation. One-way analysis of variance (one-way ANOVA) was used to confirm differences within the experimental group. Duncan’s New Multiple Range Test was used to analyze the differences between the means of the experimental groups. p < 0.05 was considered significant.
4. Discussion
Fernández et al. reported that V. parahaemolyticus was cytotoxic to epithelial cells in a time-dependent manner, with no cell lysis occurring at two hours, but an increasing amount of cell lysis was observed three or four hours later [11]. When Caco-2 cells were co-cultured with V. parahaemolyticus for four hours, the cell number decreased because of cytotoxicity caused by V. parahaemolyticus [11]. Chiu et al. found that L. plantarum co-cultured with Caco-2 cells did not affect cell viability within 10 h, but cell viability decreased significantly between 12 and 14 h [22].
Mahmoud et al. found that V. parahaemolyticus at 5.9 log CFU/g inoculated with 150 mg/mL lactic acid inhibited the growth of enteroviruses compared with 300 mg/mL citric acid, which was completely inhibited, indicating the effectiveness of lactic acid against V. parahaemolyticus [23]. Mahmoud indicated that lactic acid and citric acid wash solutions could offer an inexpensive, natural, and effective approach to control V. parahaemolyticus in sterilized shucked oysters for the oyster industry [23].
The benefits, roles, and mechanisms of probiotics in the host have not yet been fully elucidated, but some of the known probiotic species, such as L. rhamnosus, L. acidophilus, and L. plantarum, were reported to benefit host health [24]. Boonma et al. found that L. rhamnosus L34 and L. casei L39 inhibited Clostridium difficile-induced IL-8 in colonic epithelial cells HT-29 [25]. Kim et al. compared the differences between live L. acidophilus (109 and 1010 CFU/mL) and thermo-killed LAB (109 and 1010 CFU/mL) treatment in Sprague-Dawley (SD) rats two weeks prior to challenge with Salmonella. The results showed that LAB can effectively inhibit the inflammatory index of TNF-α and IL-1β in rats [26].
Gastrointestinal epithelial cells provide a natural barrier against pathogen invasion when bacteria enter the intestine to avoid intestinal peristalsis excretion. The bacteria are then adsorbed to epithelial cells, which can maintain the balance of intestinal flora and reduce invasion. Adsorption of pathogenic bacteria can also promote the host immune function, so the adsorption capacity can be used as a screening of beneficial probiotic conditions of the host [27]. According to Pedersen and Tannock, each cell adsorbed more than 15 bacterial cells; this LAB strain was considered to have adsorption capacity [28]. Bacterial adhesion to cultured cells can be used to assess in vitro models of bacterial adherence to the intestinal mucosa; however, this does not account for the potential for adhesion to the mucus layer that covers the intestinal epithelial cells.
In this study, the ability of three strains of LAB to adhere to primary cultured epithelial cells and intestinal mucus was tested in mouse cells in an in vitro model. These experiments showed a strong correlation with in vitro models, indicating that LAB adhesion can co-present on the surface of epithelial cells and mucus in the small intestine. However, among the major criteria for selecting probiotics, adhesion to the intestinal epithelium is considered to be the most important. Adhesion to epithelial cells and/or mucus seems to mediate the colonization of the gastrointestinal tract by LAB and may be a prerequisite for competitive exclusion of gut pathogens and immune regulation of the host [29].
Kim et al. reported that L. plantarum lipotechoic acid (LTA) can prevent pathogen adhesion and internalization, and inhibit pathogen-induced expression of proinflammatory cytokines such as IL-8 and TNF-α [30]. LTA is a major component of the Gram-positive cell wall, and the structural and immunomodulatory effects of LTA vary widely among species. LTA from L. plantarum has been shown to be effective against pathogens [31]. Liu et al. showed a significant increase in IL-1β and IL-6 levels in the serum of mice two hours after the intraperitoneal injection of two strains of V. alginolyticus, ATCC 17749T and E0666 [32]. The results showed that IL-6 And IL-1β are important inflammatory cytokines that may play an important role in the inflammation caused by V. alginolyticus infection. When the body is invaded by pathogens, the first reaction is caused by inflammation due to pre-inflammatory cytokines, such as IL-6. Ritchie et al. showed that the lower half of the small intestine was the site of major colonization by V. parahaemolyticus (~109 CFU/g) measured from homogenates in the middle and distal intestine [20]. In addition, histological analysis showed that more extensive histological changes occurred in the lower third of the small intestine. Candela et al. also demonstrated that IL-8 secreted by HT-29, and stimulated by TNF-α, IL-1β, and LPS, was effectively inhibited by both 106 and 108 CFU/mL of B. longum Bar33 and L. acidophilus Bar13 [33].
5. Conclusions
In this study, the effects of LAB and V. parahaemolyticus on the viability of the Caco-2 cell line were tested using an MTT assay. The results showed that LAB did not cause any damage to Caco-2 cells after two or four hours of co-culture, yet a four-hour incubation with V. parahaemolyticus (particularly the BCRC 10806 strain) caused damage to Caco-2 cells. In bream fillets, the three strains of LAB or their supernatant inhibited the two strains of V. parahaemolyticus successfully at 4 °C or at room temperature after a four-hour incubation. ELISA was used to detect proinflammatory cytokines expressed by different cell lines treated with LAB and V. parahaemolyticus. The results showed that TNF-α, IL-1β, and IL-6 were significantly inhibited by treatment with LAB. The three LAB strains effectively inhibited the expression of IL-8 mRNA induced by V. parahaemolyticus in both Caco-2 and HT-29 cells. In terms of RAW 264.7, the expression of IL-6 was also effectively inhibited. Animal experiments showed that the most effective bacterial strain in the intestinal epithelial cells and mucus of mice was L. plantarum PM 222. Pathological sections of mice in the small intestine showed that L. plantarum PM 222 had the greatest degree of protection of the small intestine with the fewest number of apoptotic cells.
Author Contributions
C.-C.T. designed the study; Y.-H.H. and L.-C.C. performed the experiments. All authors have read and approved the final version of this manuscript.
Funding
This research was funded by Ministry of Science and Technology grant number MOST 102-2313-B-241-001-MY3.
Acknowledgments
This study was funded by the MOST 102-2313-B-241-001-MY3 project from Ministry of Science and Technology, Taiwan, R.O.C.
Conflicts of Interest
The authors declare no conflict of interest.
References
- Shimohata, T.; Takahashi, A. Diarrhea induced by infection of Vibrio parahaemolyticus. J. Med. Investig. 2010, 57, 179–182. [Google Scholar] [CrossRef]
- Shirazinejad, A.; Ismail, N.; Bhat, R. Lactic acid as a potential decontaminant of selected foodborne pathogenic bacteria in shrimp (Penaeus merguiensis de Man). Foodborne Pathog. Dis. 2010, 7, 1531–1536. [Google Scholar] [CrossRef] [PubMed]
- Terzi, G.; Gucukoglu, A. Effects of lactic acid and chitosan on the survival of V. parahaemolyticus in mussel samples. J. Anim. Vet. 2010, 9, 990–994. [Google Scholar] [CrossRef]
- Hwanhlem, N.; Watthanasakphuban, N.; Riebroy, S.; Benjakul, S.; Maneerat, S. Probiotic lactic acid bacteria from Kung-Som: Isolation, screening, inhibition of pathogenic bacteria. Int. J. Food Sci. 2010, 45, 594–601. [Google Scholar] [CrossRef]
- Xi, D. Application of Probiotics and Green Tea Extract in Post-Harvest Processes of Pacific Oysters (Crassostrea gigas) for Reducing Vibrio parahaemolyticus and Extending Shelf Life. Oregon State University, 2011. Available online: https://ir.library.oregonstate.edu/concern/graduate_thesis_or_dissertations/3j333476m (accessed on 2 August 2017).
- Liu, C.H.; Chiu, C.H.; Wang, S.W.; Cheng, W. Dietary administration of the probiotic, Bacillus subtilis E20, enhances the growth, innate immune responses, and disease resistance of the grouper, Epinephelus coioides. Fish Shellfish Immunol. 2012, 33, 699–706. [Google Scholar] [CrossRef] [PubMed]
- Cha, J.H.; Rahimnejad, S.; Yang, S.Y.; Kim, K.W.; Lee, K.J. Evaluations of Bacillus spp. as dietary additives on growth performance, innate immunity and disease resistance of olive flounder (Paralichthys olivaceus) against Streptococcus iniae and as water additives. Aquaculture 2013, 402, 50–57. [Google Scholar] [CrossRef]
- Hemaiswarya, S.; Raja, R.; Ravikumar, R.; Carvalho, I.S. Mechanism of action of probiotics. Braz. Arch. Biol. Technol. 2013, 56, 113–119. [Google Scholar] [CrossRef]
- Nayak, S. Probiotics and immunity: A fish perspective. Fish Shellfish Immunol. 2010, 29, 2–14. [Google Scholar] [CrossRef] [PubMed]
- He, S.; Zhang, Y.; Xu, L.; Yang, Y.; Marubashi, T.; Zhou, Z.; Yao, B. Effects of dietary Bacillus subtilis C-3102 on the production, intestinal cytokine expression and autochthonous bacteria of hybrid tilapia Oreochromis niloticus ♀ × Oreochromis aureus ♂. Aquaculture 2013, 412, 125–130. [Google Scholar] [CrossRef]
- Fernández, M.F.; Boris, S.; Barbes, C. Probiotic properties of human lactobacilli strains to be used in the gastrointestinal tract. J. Appl. Microbiol. 2003, 94, 449–455. [Google Scholar] [CrossRef] [PubMed]
- Montiel, R.; Martín-Cabrejas, I.; Langa, S.; El Aouad, N.; Arqués, J.; Reyes, F.; Medina, M. Antimicrobial activity of reuterin produced by Lactobacillus reuteri on Listeria monocytogenes in cold-smoked salmon. Food Microbiol. 2014, 44, 1–5. [Google Scholar] [CrossRef] [PubMed]
- Gueimonde, M.; Margolles, A.; de los Reyes-Gavilan, C.G.; Salminen, S. Competitive exclusion of enteropathogens from human intestinal mucus by Bifidobacterium strains with acquired resistance to bile—A preliminary study. Int. J. Food Microbiol. 2007, 113, 228–232. [Google Scholar] [CrossRef] [PubMed]
- Satish Kumar, R.; Kanmani, P.; Yuvaraj, N.; Paari, K.A.; Pattukumar, V.; Arul, V. Lactobacillus plantarum AS1 binds to cultured human intestinal cell line HT-29 and inhibits cell attachment by enterovirulent bacterium Vibrio parahaemolyticus. Lett. Appl. Microbiol. 2011, 53, 481–487. [Google Scholar] [CrossRef] [PubMed]
- Lian, H.; Jin, N.; Li, X.; Mi, Z.; Zhang, J.; Sun, L.; Li, X.; Zheng, H.; Li, P. Induction of an effective anti-tumor immune response and tumor regression by combined administration of IL-18 and Apoptin. Cancer Immunol. Immunother. 2007, 56, 181–192. [Google Scholar] [CrossRef] [PubMed]
- Matlawska-Wasowska, K.; Finn, R.; Mustel, A.; O’Byrne, C.P.; Baird, A.W.; Coffey, E.T.; Boyd, A. The Vibrio parahaemolyticus type III secretion systems manipulate host cell MAPK for critical steps in pathogenesis. BMC Microbiol. 2010, 10, 329. [Google Scholar] [CrossRef] [PubMed]
- Brisbin, J.T.; Zhou, H.; Gong, J.; Sabour, P.; Akbari, M.R.; Haghighi, H.R.; Yu, H.; Clarke, A.; Sarson, A.J.; Sharif, S. Gene expression profiling of chicken lymphoid cells after treatment with Lactobacillus acidophilus cellular components. Dev. Comp. Immunol. 2008, 32, 563–574. [Google Scholar] [CrossRef] [PubMed]
- Livak, K.J.; Schmittgen, T.D. Analysis of relative gene expression data using real-time quantitative PCR and the 2−ΔΔCt Method. Methods 2001, 25, 402–408. [Google Scholar] [CrossRef] [PubMed]
- Yang, Z.Q.; Jin, C.J.; Gao, L.; Fang, W.M.; Gu, R.X.; Qian, J.Y.; Jiao, X.A. Alleviating effects of Lactobacillus strains on pathogenic Vibrio parahaemolyticus-induced intestinal fluid accumulation in the mouse model. FEMS Microbiol. Lett. 2013, 339, 30–38. [Google Scholar] [CrossRef] [PubMed]
- Ritchie, J.M.; Rui, H.; Zhou, X.; Iida, T.; Kodoma, T.; Ito, S.; Davis, B.M.; Bronson, R.T.; Waldor, M.K. Inflammation and disintegration of intestinal villi in an experimental model for Vibrio parahaemolyticus-induced diarrhea. PLoS Pathog. 2012, 8, e1002593. [Google Scholar] [CrossRef] [PubMed] [Green Version]
- Lee, Y.K.; Lim, C.Y.; Teng, W.L.; Ouwehand, A.C.; Tuomola, E.M.; Salminen, S. Quantitative approach in the study of adhesion of lactic acid bacteria to intestinal cells and their competition with enterobacteria. Appl. Environ. Microbiol. 2000, 66, 3692–3697. [Google Scholar] [CrossRef] [PubMed]
- Chiu, Y.H.; Lu, Y.C.; Ou, C.C.; Lin, S.L.; Tsai, C.C.; Huang, C.T.; Lin, M.Y. Lactobacillus plantarum MYL26 induces endotoxin tolerance phenotype in Caco-2 cells. BMC Microbiol. 2013, 13, 190. [Google Scholar] [CrossRef] [PubMed] [Green Version]
- Mahmoud, B.S.M. The efficacy of grape seed extract, citric acid and lactic acid on the inactivation of Vibrio parahaemolyticus in shucked oysters. Food Control 2014, 41, 13–16. [Google Scholar] [CrossRef]
- Yun, B.; Oh, S.; Griffiths, M.W. Lactobacillus acidophilus modulates the virulence of Clostridium difficile. J. Dairy Sci. 2014, 97, 4745–4758. [Google Scholar] [CrossRef] [PubMed]
- Boonma, P.; Spinler, J.K.; Venable, S.F.; Versalovic, J.; Tumwasorn, S. Lactobacillus rhamnosus L34 and Lactobacillus casei L39 suppress Clostridium difficile-induced IL-8 production by colonic epithelial cells. BMC Microbiol. 2014, 14, 177. [Google Scholar] [CrossRef] [PubMed]
- Kim, M.S.; Yoon, Y.S.; Seo, J.G.; Lee, H.G.; Chung, M.J.; Yum, D.Y. A study on the prevention of salmonella infection by using the aggregation characteristics of lactic Acid bacteria. Toxicol. Res. 2013, 29, 129. [Google Scholar] [CrossRef] [PubMed]
- Li, X.; Yue, L.; Guan, X.; Qiao, S. The adhesion of putative probiotic lactobacilli to cultured epithelial cells and porcine intestinal mucus. J. Appl. Microbiol. 2008, 104, 1082–1091. [Google Scholar] [CrossRef] [PubMed]
- Pedersen, K.; Tannock, G. Colonization of the porcine gastrointestinal tract by lactobacilli. Appl. Environ. Microbiol. 1989, 55, 279–283. [Google Scholar] [PubMed]
- Blum, S.; Reniero, R.; Schiffrin, E.; Crittenden, R.; Mattila-Sandholm, T.; Ouwehand, A.; Salminen, S.; Von Wright, A.; Saarela, M.; Saxelin, M. Adhesion studies for probiotics: Need for validation and refinement. Trends Food Sci. Technol. 1999, 10, 405–410. [Google Scholar] [CrossRef]
- Kim, H.G.; Gim, M.G.; Kim, J.Y.; Jin Hwang, H.; Ham, M.S.; Lee, J.M.; Hartung, T.; Park, J.W.; Han, S.H.; Chung, D.K. Lipoteichoic acid from Lactobacillus plantarum elicits both the production of interleukin-23p19 and suppression of pathogen-mediated interleukin-10 in THP-1 cells. FEMS Immunol. Med. Microbiol. 2006, 49, 205–214. [Google Scholar] [CrossRef] [PubMed]
- Gao, Q.; Gao, Q.; Min, M.; Zhang, C.; Peng, S.; Shi, Z. Ability of Lactobacillus plantarum lipoteichoic acid to inhibit Vibrio anguillarum-induced inflammation and apoptosis in silvery pomfret (Pampus argenteus) intestinal epithelial cells. Fish Shellfish Immunol. 2016, 54, 573–579. [Google Scholar] [CrossRef] [PubMed]
- Liu, X.F.; Zhang, H.; Liu, X.; Gong, Y.; Chen, Y.; Cao, Y.; Hu, C. Pathogenic analysis of Vibrio alginolyticus infection in a mouse model. Folia Microbiol. 2014, 59, 167–171. [Google Scholar] [CrossRef] [PubMed]
- Candela, M.; Perna, F.; Carnevali, P.; Vitali, B.; Ciati, R.; Gionchetti, P.; Rizzello, F.; Campieri, M.; Brigidi, P. Interaction of probiotic Lactobacillus and Bifidobacterium strains with human intestinal epithelial cells: Adhesion properties, competition against enteropathogens and modulation of IL-8 production. Int. J. Food Microbiol. 2008, 125, 286–292. [Google Scholar] [CrossRef] [PubMed]
Sample Availability: Samples of the compounds are not available from the authors. |
Figure 1.
The survival rates of caco-2 cell line co-cultured with the V. parahaemolyticus and lactic acid bacteria strains for (A) two hours and (B) four hours. a,b,c values in the same column with different superscripts mean significant difference (p < 0.05) using the Duncan’s multiple range test.
Figure 1.
The survival rates of caco-2 cell line co-cultured with the V. parahaemolyticus and lactic acid bacteria strains for (A) two hours and (B) four hours. a,b,c values in the same column with different superscripts mean significant difference (p < 0.05) using the Duncan’s multiple range test.
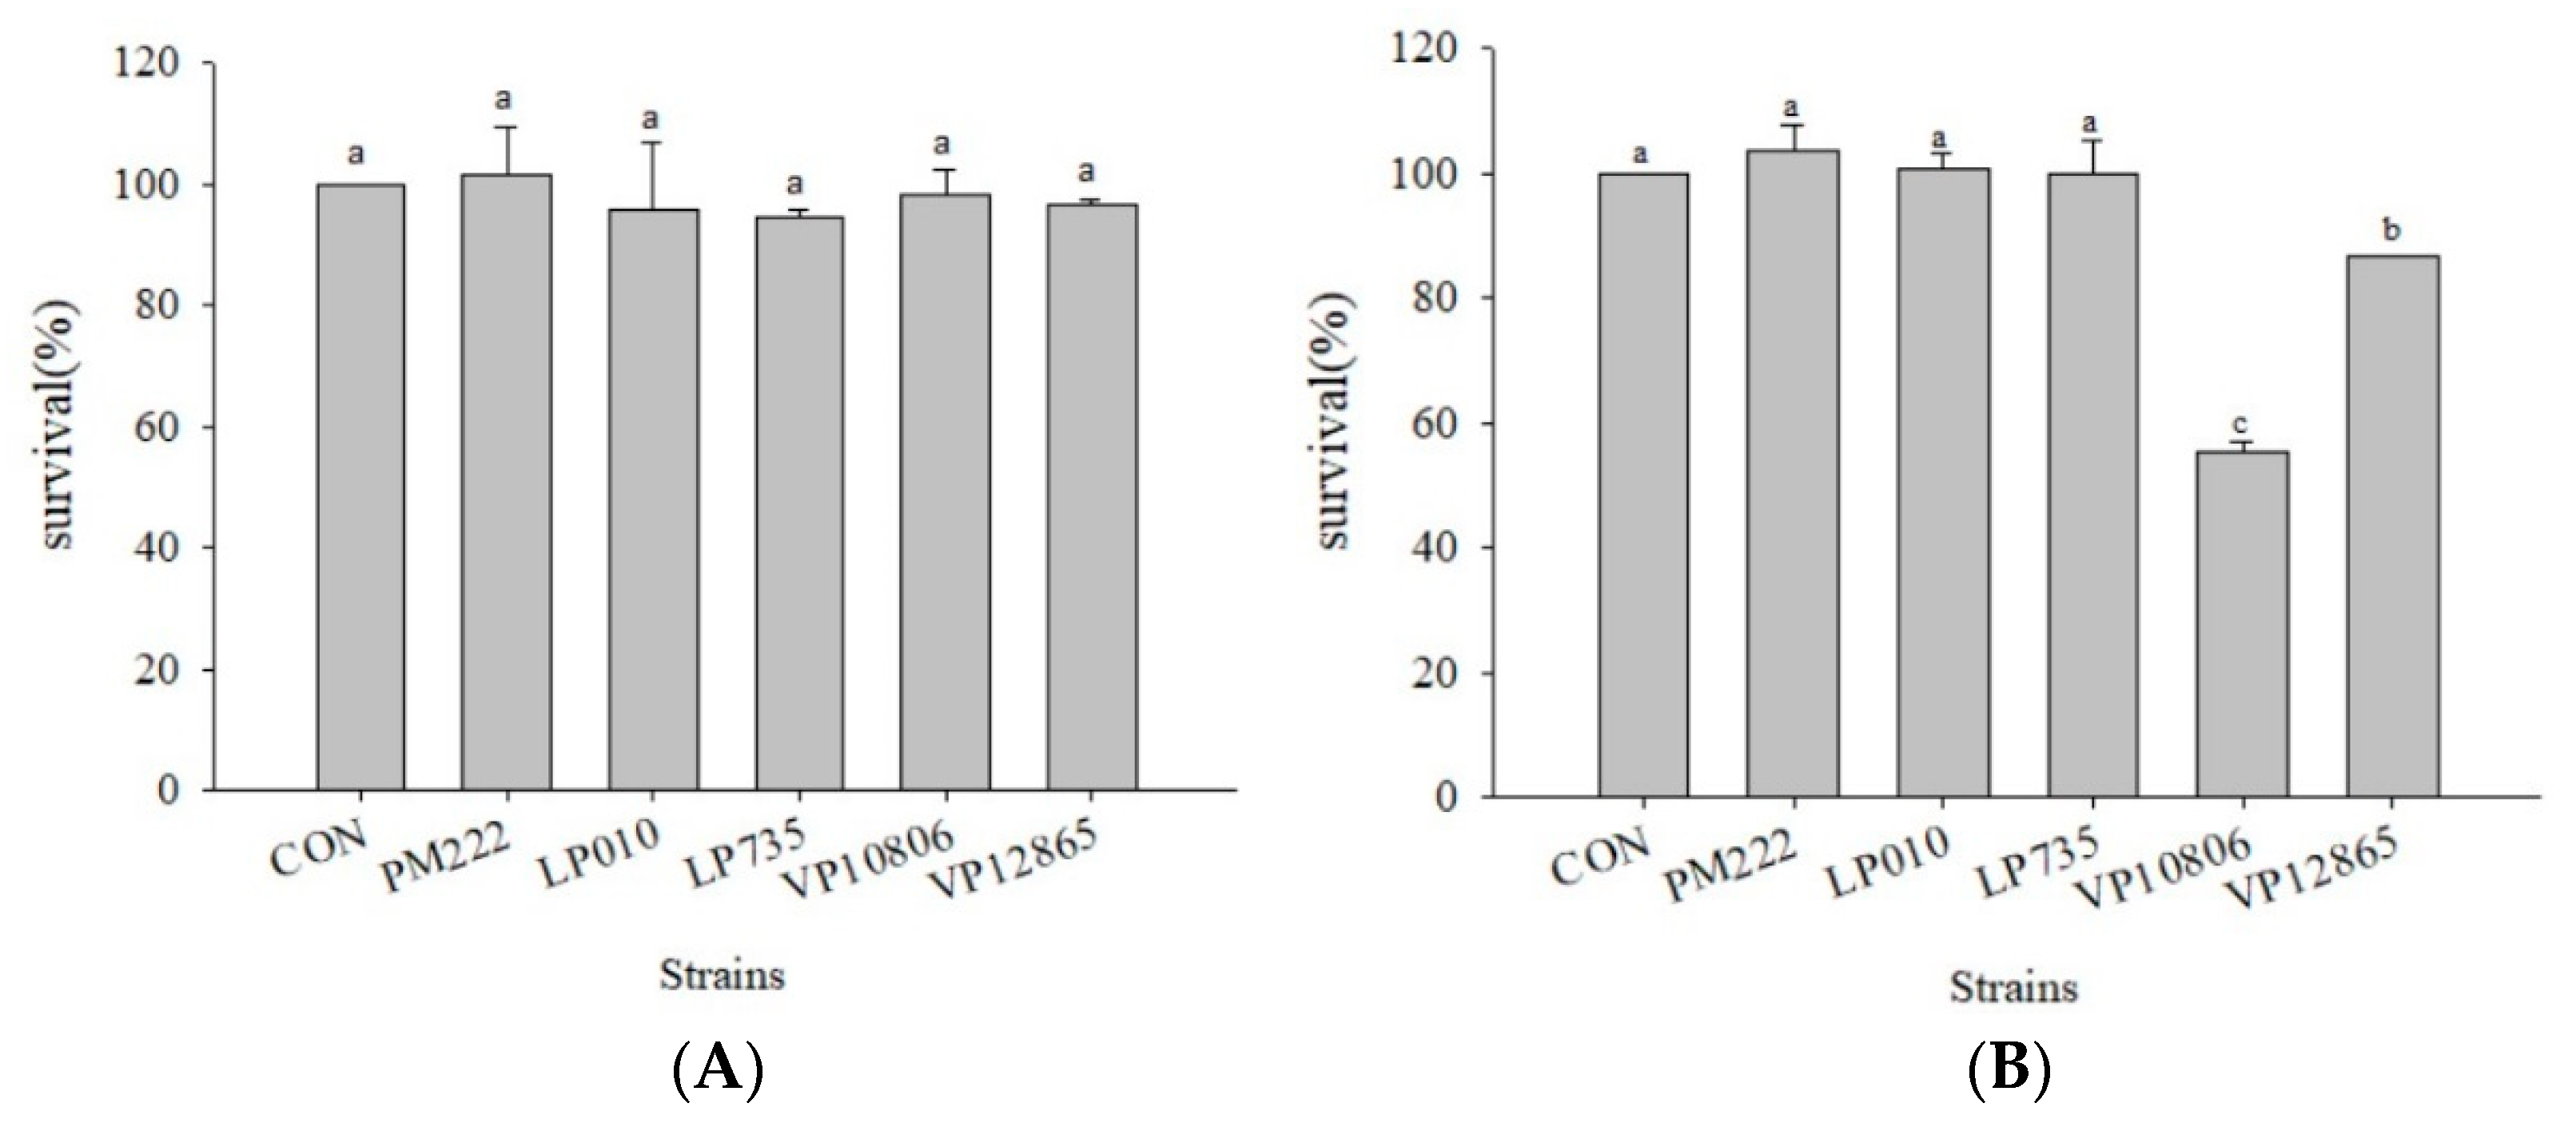
Figure 2.
Inhibition of Vibrio parahaemolyticus (A) BCRC 10806, (B) BCRC 12865–induced TNF-α synthesis, (C) BCRC 10806, and (D) BCRC 12865–induced IL-6 synthesis in RAW 264.7 cell line by different lactic acid bacteria. a,b,c,d Values in the same group with different superscripts mean a significant difference (p < 0.05) using the Duncan’s multiple range test. Prevention: LAB (107 CFU/mL) was added for two hours followed by V. parahaemolyticus (105 CFU/mL) for 15 h. Competition: LAB and V. parahaemolyticus were added simultaneously and incubated for 17 h. Treatment: V. parahaemolyticus was added for two hours before adding LAB for 15 h.


Figure 3.
Inhibition of Vibrio parahaemolyticus by (A) BCRC 10806 and (B) BCRC 12865–induced IL-1β synthesis in RAW 264.7 cell line; (C) BCRC 10806 and (D) BCRC 12865–induced IL-8 synthesis in the HT-29 cell line by different lactic acid bacteria. a,b,c Values in the same group with different superscripts mean significant difference (p < 0.05) using the Duncan’s multiple range test. Prevention: LAB (107 CFU/mL) was added for two hours followed by V. parahaemolyticus (105 CFU/mL) for 15 h. Competition: LAB and V. parahaemolyticus were added simultaneously and incubated for 17 h. Treatment: V. parahaemolyticus was added for two hours before adding LAB for 15 h.


Figure 4.
(A) Real-time polymerase chain reaction (PCR) analysis of Caco-2 intestinal epithelial cells stimulated with lactic acid bacteria and Vibrio parahaemolyticus to observe the change of gene expression in IL-8 mRNA, with three different models using lactic acid bacteria, (B) BCRC 10806, and (C) BCRC 12865 to stimulate Caco-2 intestinal epithelial cells to observe the change in gene expression of IL-8 mRNA. Expression of target genes (IL-8) was normalized to β-actin and is presented as mean ± standard error. a,b,c values in the same group with different superscripts mean significant difference (p < 0.05) using the Duncan’s multiple range test.


Figure 5.
(A) Real-time PCR analysis of Raw 264.7 macrophage cell line stimulated with lactic acid bacteria and Vibrio parahaemolyticus to observe the change in gene expression of IL-6 mRNA, with three different models using lactic acid bacteria, (B) BCRC 10806, and (C) BCRC 12865 to stimulate the Raw 264.7 macrophage cell line to observe the change in gene expression of IL-6 mRNA. The expression of target genes (IL-6) was normalized to β-actin and is presented as mean ± standard error. a,b,c Values in the same group with different superscripts mean significant difference (p < 0.05) using the Duncan’s multiple range test.

Figure 6.
(A) Real-time PCR analysis of the Raw 264.7 macrophage cell line stimulated with lactic acid bacteria and Vibrio parahaemolyticus to observe the change in gene expression of TNF-α mRNA, with three different models using lactic acid bacteria, (B) BCRC 10806, and (C) BCRC 12865 to stimulate the Raw 264.7 macrophage cell line to observe the change in gene expression of TNF-α mRNA. The expression of target genes (TNF-α) was normalized to β-actin and is presented as mean ± the standard error. a,b,c Values in the same group with different superscripts mean significant difference (p < 0.05) using the Duncan’s multiple range test.


Figure 7.
(A) Real-time PCR analysis of human colorectal adenocarcinoma cells HT-29 stimulated with lactic acid bacteria and Vibrio parahaemolyticus to observe the change in gene expression of IL-8 mRNA, with three different models using lactic acid bacteria, (B) BCRC 10806, and (C) BCRC 12865 to stimulate human colorectal adenocarcinoma cells HT-29 to observe the change in gene expression of IL-8 mRNA. The expression of target genes (IL-8) was normalized to β-actin and is presented as mean ± standard error. a,b,c Values in the same group with different superscripts mean significant difference (p < 0.05) using the Duncan’s multiple range test.


Figure 8.
Mice were fed Vibrio parahaemolyticus BCRC 12865, and the expression of (A) IL-8, (B) TNF- α, and (C) IL-6 in serum was observed after 24 h. Each value is expressed as mean ± standard deviation (n = 8). a,b Values in the same group with different superscripts mean significant difference (p < 0.05) using the Duncan’s multiple range test.


Figure 9.
Histopathological changes to the mouse intestine 24 h post-challenge with Vibrio parahaemolyticus BCRC 12865. The images of myocardial architecture were magnified 200 times. (A) Blank group, (B) Control, (C) PM 222 + BCRC 12865, (D) LP 010 + BCRC 12865 and (E) LP 735 + BCRC 12865.
Figure 9.
Histopathological changes to the mouse intestine 24 h post-challenge with Vibrio parahaemolyticus BCRC 12865. The images of myocardial architecture were magnified 200 times. (A) Blank group, (B) Control, (C) PM 222 + BCRC 12865, (D) LP 010 + BCRC 12865 and (E) LP 735 + BCRC 12865.

Figure 10.
Histopathological changes to the mouse intestine 24 h post-challenge with Vibrio parahaemolyticus BCRC 12865. The images of myocardial architecture were magnified 200 times. (A) Blank group, (B) Control, (C) PM 222 + BCRC 12865, (D) LP 010 + BCRC 12865 and (E) LP 735 + BCRC 12865.
Figure 10.
Histopathological changes to the mouse intestine 24 h post-challenge with Vibrio parahaemolyticus BCRC 12865. The images of myocardial architecture were magnified 200 times. (A) Blank group, (B) Control, (C) PM 222 + BCRC 12865, (D) LP 010 + BCRC 12865 and (E) LP 735 + BCRC 12865.


Table 1.
The survival rate after Vibrio parahaemolyticus BCRC 10806 and BCRC 12865 were added to lactic acid bacteria in Tilapia fillet that was cultured for one or four hours at 4 °C and room temperature.
Table 1.
The survival rate after Vibrio parahaemolyticus BCRC 10806 and BCRC 12865 were added to lactic acid bacteria in Tilapia fillet that was cultured for one or four hours at 4 °C and room temperature.
| Strains | LAB | Survival of Vibrio parahaemolyticus (Log CFU/mL) | |||||||
|---|---|---|---|---|---|---|---|---|---|
| 4 °C | Room Temperature | ||||||||
| 1 h | 4 h | 1 h | 4 h | ||||||
| Culture | Supernatant | Culture | Supernatant | Culture | Supernatant | Culture | Supernatant | ||
| 10806 | Control | 3.69 ± 0.08 a | 3.74 ± 0.05 a | <1 | <1 | 5.20 ± 0.01 a | 5.21 ± 0.01 a | 5.70 ± 0.03 a | 5.82 ± 0.04 a |
| Lactobacillus plantarum PM 222 | <1 b | <1 b | <1 | <1 | 3.81 ± 0.03 b | 4.52 ± 0.04 b | <1 b | <1 b | |
| Lactobacillus plantarum LP 735 | <1 b | <1 b | <1 | <1 | 2.62 ± 0.02 d | 3.54 ± 0.04 d | <1 b | <1 b | |
| Lactobacillus plantarum LP 010 | <1 b | <1 b | <1 | <1 | 2.79 ± 0.04 c | 3.66 ± 0.05 c | <1 b | <1 b | |
| 12865 | Control | 4.28 ± 0.09 a | 4.23 ± 0.01 a | 3.73 ± 0.10 a | 3.74 ± 0.04 a | 5.95 ± 0.02 a | 6.01 ± 0.03 a | 6.55 ± 0.05 a | 6.61 ± 0.06 a |
| Lactobacillus plantarum PM 222 | <1 b | <1 b | <1 b | <1 b | 4.84 ± 0.03 b | 5.00 ± 0.03 b | <1 b | <1 b | |
| Lactobacillus plantarum LP 735 | <1 b | <1 b | <1 b | <1 b | 3.83 ± 0.03 c | 3.90 ± 0.04 c | <1 b | <1 b | |
| Lactobacillus plantarum LP 010 | <1 b | <1 b | <1 b | <1 b | 2.74 ± 0.06 d | 3.22 ± 0.11 d | <1 b | <1 b | |
Bacteria counts were converted to log CFU/mL. Each value is expressed as mean ± standard deviation. a,b,c,d Values in the same column with different superscripts mean significant difference (p < 0.05).
Table 2.
The survival rate after three lactic acid bacteria were added to V. parahaemolyticus BCRC 10806 and BCRC 12865 in Tilapia fillet that was cultured for one or four hours at 4 °C and room temperature.
Table 2.
The survival rate after three lactic acid bacteria were added to V. parahaemolyticus BCRC 10806 and BCRC 12865 in Tilapia fillet that was cultured for one or four hours at 4 °C and room temperature.
| Strains | Survival of Lactic Acid Bacteria (Log CFU/mL) | |||||||
|---|---|---|---|---|---|---|---|---|
| BCRC 10806 | BCRC 12865 | |||||||
| 4 °C | Room Temperature | 4 °C | Room Temperature | |||||
| 1 h | 4 h | 1 h | 4 h | 1 h | 4 h | 1 h | 4 h | |
| Lactobacillus plantarum PM 222 | 6.16 ± 0.02 Ab | 6.11 ± 0.01 Ac | 6.10 ± 0.02 Ac | 6.02 ± 0.02 Ac | 6.14 ± 0.04 Ab | 6.00 ± 0.01 Bc | 6.06 ± 0.06 Ab | 6.07 ± 0.00 Ac |
| Lactobacillus plantarum LP 735 | 6.38 ± 0.01 Aa | 6.37 ± 0.01 Ab | 6.35 ± 0.02 Ab | 6.46 ± 0.09 Ab | 6.43 ± 0.00 Aa | 6.33 ± 0.01 Bb | 6.37 ± 0.02 Aa | 6.38 ± 0.02 Ab |
| Lactobacillus plantarum LP 010 | 6.43 ± 0.02 Aa | 6.46 ± 0.00 Aa | 6.52 ± 0.00 Aa | 6.71 ± 0.03 Ba | 6.45 ± 0.02 Aa | 6.41 ± 0.01 Aa | 6.46 ± 0.02 Aa | 6.72 ± 0.01 Ba |
Bacteria counts are converted to log CFU/mL. Each value is expressed as mean ± standard deviation. A,B Values in the same row with different superscripts mean significant difference (p < 0.05). a,b,c Values in the same column with different superscripts mean significant difference (p < 0.05).
Table 3.
Adhesive ability of Lactobacillus strains to mouse epithelial cells and mucus.
| Species | Strain | Adhesive Ability | Intestinal Mucus (OD570 nm) § |
|---|---|---|---|
| Epithelial Cell (Bacteria per Cell) ‡ | |||
| Lactobacillus plantarum | PM 222 | 26.4 ± 9.6 a | 0.12 ± 0.03 a |
| Lactobacillus plantarum | LP 010 | 18.7 ± 9.0 ab | 0.09 ± 0.01 b |
| Lactobacillus plantarum | LP 735 | 14 ± 9.0 c | 0.05 ± 0.00 c |
Values with no common superscript letters differ significantly (p < 0.05). ‡ Adhesiveness of each strain is expressed as the mean number of attached bacteria in 10 randomly selected fields. § Standard deviation of OD570 nm readings from four replicate wells. a,b,c Values in the same column with different superscripts mean significant difference (p < 0.05).
© 2018 by the authors. Licensee MDPI, Basel, Switzerland. This article is an open access article distributed under the terms and conditions of the Creative Commons Attribution (CC BY) license (http://creativecommons.org/licenses/by/4.0/).
Share and Cite
MDPI and ACS Style
Tsai, C.-C.; Hung, Y.-H.; Chou, L.-C. Evaluation of Lactic Acid Bacteria on the Inhibition of Vibrio parahaemolyticus Infection and Its Application to Food Systems. Molecules 2018, 23, 1238. https://doi.org/10.3390/molecules23051238
AMA Style
Tsai C-C, Hung Y-H, Chou L-C. Evaluation of Lactic Acid Bacteria on the Inhibition of Vibrio parahaemolyticus Infection and Its Application to Food Systems. Molecules. 2018; 23(5):1238. https://doi.org/10.3390/molecules23051238
Chicago/Turabian StyleTsai, Cheng-Chih, Yung-Hsien Hung, and Lan-Chun Chou. 2018. "Evaluation of Lactic Acid Bacteria on the Inhibition of Vibrio parahaemolyticus Infection and Its Application to Food Systems" Molecules 23, no. 5: 1238. https://doi.org/10.3390/molecules23051238