Article

The Late Embryogenesis Abundant Protein Family in Cassava (Manihot esculenta Crantz): Genome-Wide Characterization and Expression during Abiotic Stress

1
Key Laboratory of Biology and Genetic Resources of Tropical Crops, Institute of Tropical Bioscience and Biotechnology, Chinese Academy of Tropical Agricultural Sciences, Xueyuan Road 4, Haikou 571101, China
2
Genetic Engineering International Cooperation Base of Chinese Ministry of Science and Technology, Chinese National Center of Plant Gene Research (Wuhan) HUST Part, Key Laboratory of Molecular Biophysics of Chinese Ministry of Education, College of Life Science and Technology, Huazhong University of Science and Technology (HUST), Wuhan 430074, China
*
Authors to whom correspondence should be addressed.
These authors contributed equally to this work.
Molecules 2018, 23(5), 1196; https://doi.org/10.3390/molecules23051196
Submission received: 24 April 2018 / Revised: 11 May 2018 / Accepted: 15 May 2018 / Published: 17 May 2018

Abstract

:
Late embryogenesis abundant (LEA) proteins, as a highly diverse group of polypeptides, play an important role in plant adaptation to abiotic stress; however, LEAs from cassava have not been studied in cassava. In this study, 26 LEA members were genome-wide identified from cassava, which were clustered into seven subfamily according to evolutionary relationship, protein motif, and gene structure analyses. Chromosomal location and duplication event analyses suggested that 26 MeLEAs distributed in 10 chromosomes and 11 MeLEA paralogues were subjected to purifying selection. Transcriptomic analysis showed the expression profiles of MeLEAs in different tissues of stem, leaves, and storage roots of three accessions. Comparative transcriptomic analysis revealed that the function of MeLEAs in response to drought may be differentiated in different accessions. Compared with the wild subspecies W14, more MeLEA genes were activated in cultivated varieties Arg7 and SC124 after drought treatment. Several MeLEA genes showed induction under various stresses and related signaling treatments. Taken together, this study demonstrates the transcriptional control of MeLEAs in tissue development and the responses to abiotic stress in cassava and identifies candidate genes for improving crop resistance to abiotic stress.

1. Introduction

Late embryogenesis abundant (LEA) protein was first found to accumulate during the late embryogenesis in cotton seed [1]. Subsequently, they were identified from various plant species, including rice, Arabidopsis, maize, barley, wheat, sunflower bean, and Brassica napus [2,3,4,5,6,7,8]. Additionally, LEA proteins also exist in other species, such as nematodes and chironomids [9,10]. LEA proteins have small molecular weight and a high degree of hydrophilicity [11,12]. Based on the eight conserved Pfams (PF04927, PF00257, PF03760, PF03168, PF03242, PF02987, PF00477, PF10714), plant LEA proteins can be separated into eight families: seed maturation protein (SMP), dehydrin, LEA_1, LEA_2, LEA_3, LEA_4, LEA_5, and LEA_6 [13].
Most of the LEA protein families have a unique subcellular localization, which is involved in protecting the stability of cells under stress conditions [3,14]. Accumulated evidence has revealed the biochemical mechanisms underlying their function on protecting plants from dehydration. Firstly, LEA proteins function as a protectant of membranes and biomolecules [14]. Secondly, LEA proteins, as intrinsically-disordered proteins, protect enzymes from induced aggregation by space-filling of LEA proteins, thus decreasing the rate of collisions between aggregating proteins [15,16]. Thirdly, LEA proteins aid in sequestration of calcium and metal ions, a benefit for signaling transduction [17]. Lastly, LEA proteins play a role in the formation of the glassy state, contributing to sugar accumulation in the cytoplasm of plants [18].
Moreover, genetic evidences also support the function of LEA proteins on abiotic stress response, including dehydration, osmotic, drought, salt, and chilling. Overexpression of the OsLEA3-2 was able to enhance salt and drought tolerance in transgenic rice plants [19]. ZmLEA3 could increase the transgenic tobacco tolerance to low temperature, osmotic and oxidative stresses [20,21]. Overexpression of the CuCOR19 in tobacco increased cold tolerance by inhibiting lipid peroxidation [22]. Overexpression of the wheat WCOR410 improved freezing resistance in transgenic strawberry leaves [23]. SiLEA14 conferred salt and osmotic tolerance in transgenic Arabidopsis and foxtail millet [24]. Overexpression of the JcLEA in transgenic Arabidopsis plants improved resistance to dehydration and salinity [25]. Transgenic Arabidopsis plants overexpressing the Group LEA_4 protein of B. napus enhanced salt and drought tolerance [26]. Together, these results suggested that LEA proteins play a positive role in plant response to abiotic stress.
To date, LEA genes have been genome-wide identified in various plant species, such as 51 LEAs in Arabidopsis [3], 39 LEAs in rice [2], 108 LEAs in Brassica napus [8], 23 LEAs in Moso Bamboo [27], 36 LEAs in Brachypodium distachyon [28], and 53 LEAs in Populus trichocarpa [29]. However, less is known about this family in the important tropical crop cassava. Cassava, the third most important crop after rice and maize in Asia, Africa, and Latin America, provides dietary carbohydrates for over 600 million people across the tropical and sub-tropical world [30,31]. Cassava has a tolerance to drought and low-fertility soils due to the efficient use of heat, light, and water resources [32]. Transcriptomic analysis indicated that genes involved in abscisic acid (ABA) and ethylene biosynthesis, protein degradation, lipid metabolism, and second metabolism of flavonoids were significantly induced after osmotic treatment in cassava [33]. Some genes related to carbohydrate metabolism, ABA and salicylic acid metabolism, and calcium signaling were commonly regulated when cassava responded to cold and drought stresses [34]. lncRNAs associated with hormone signal transduction, secondary metabolites biosynthesis, and sucrose metabolism showed transcriptional changes after cold or drought treatment in cassava [35]. In addition, gene families involved in ABA and calcium signal transduction were identified from the cassava genome. Some members were widely responsive to drought, osmotic, cold, salt, and ABA at transcriptional levels [36,37,38,39]. Together, these evidences suggested that phytohormone metabolism, signaling transduction and secondary metabolites biosynthesis play a crucial role in cassava tolerance to abiotic stress. Due to the significance of LEA proteins in plant adaptation to abiotic stress, the LEA family was selected for systematic analysis in cassava.
In this study, an effort was made to identify MeLEAs from the cassava genome and investigate their phylogenetic relationship, conserved motif, gene structure, chromosomal location, duplication event, and expression profiles in distinct tissues and in response to drought, salinity, osmotic, cold, ABA, and H2O2 treatments. This systematic study should increase our understanding of LEA proteins related to abiotic stress response and lay a foundation for genetic improvement of crops.

2. Results

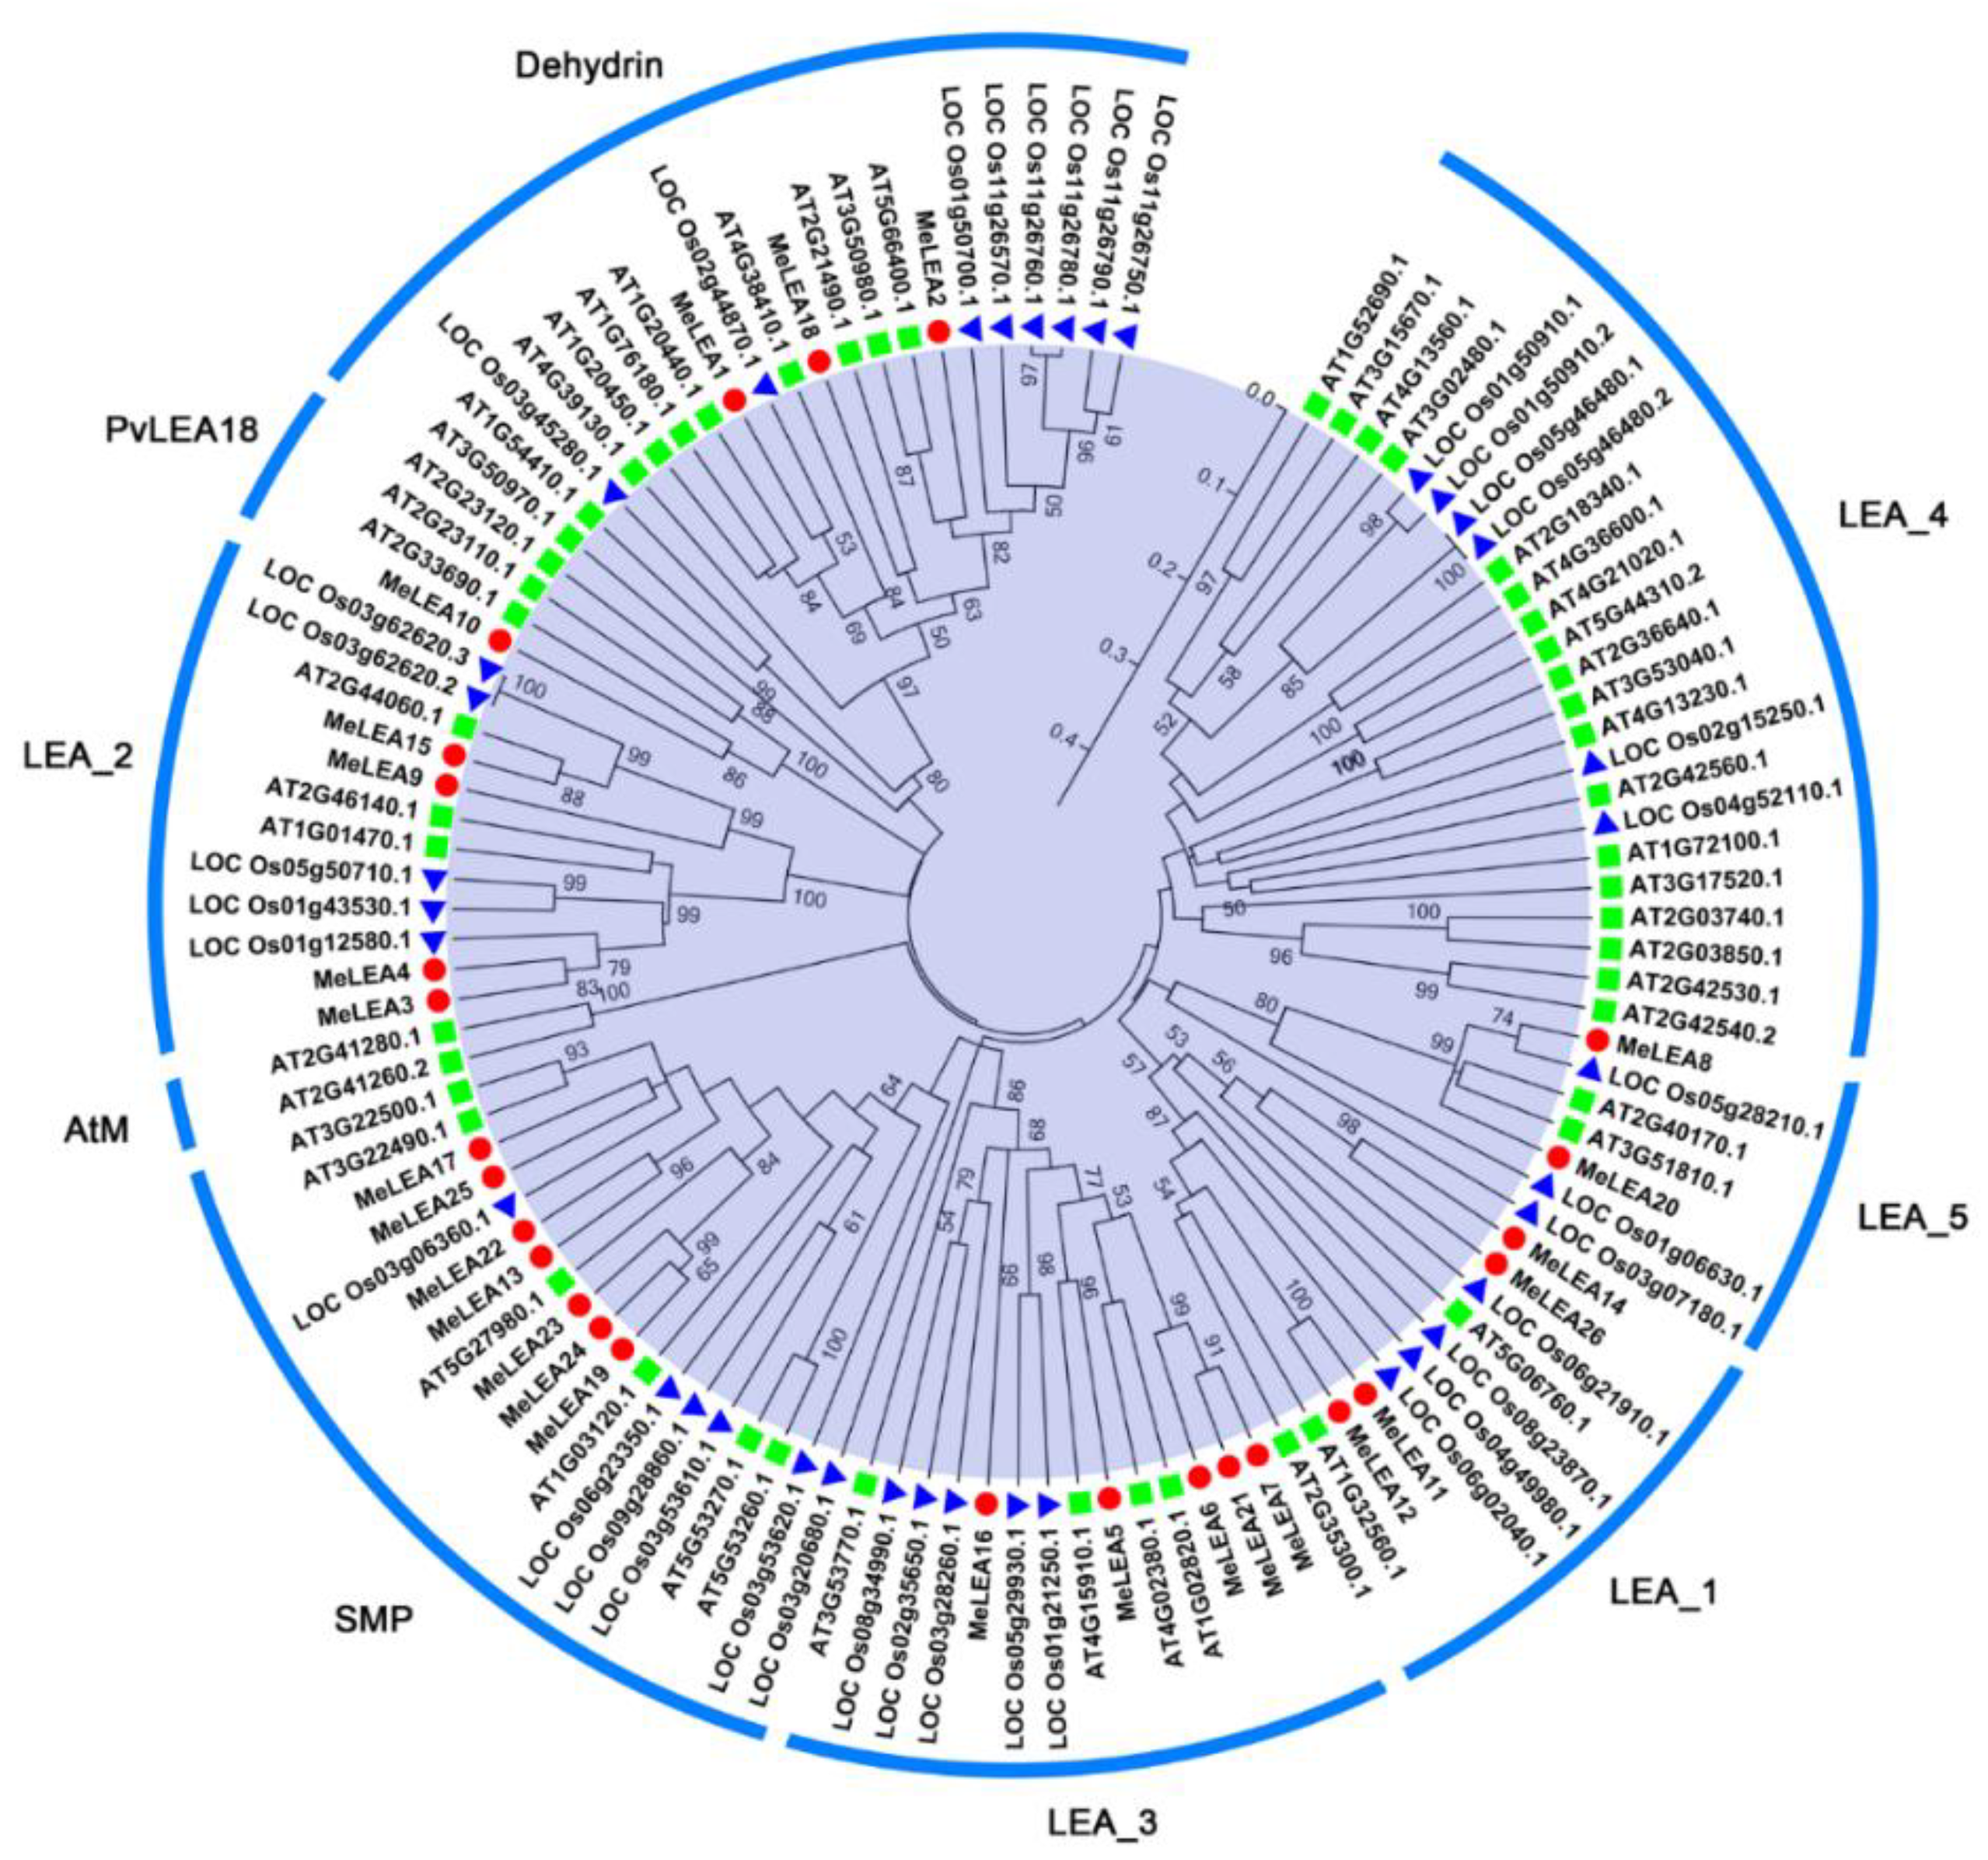
2.1. Identification and Phylogenetic Analysis of MeLEAs

A total of 26 LEA proteins were identified from cassava based on HMM searches and conserved domain validation. The accession number and predicted characteristic of all the MeLEA proteins are shown in Supplementary Table S1. To investigate the phylogenetic relationship of LEA proteins, an unrooted neighbour-joining (NJ) tree was constructed with the complete LEA protein sequences from Arabidopsis, rice, and cassava (Figure 1). The LEA family were clustered into nine subgroups, including LEA_1, LEA_2, LEA_3, LEA_4, LEA_5, Dehydrin, PvLEA18, AtM, and SMP. The 26 MeLEAs were divided into seven subfamilies, including LEA_1, LEA_2, LEA_3, LEA_5, PvLEA18, Dehydrin and SMP. The SMP and LEA_3 families were the largest, with seven and five LEA members in cassava, respectively. By contrast, the PvLEA18 group had only one MeLEA member, MeLEA10.

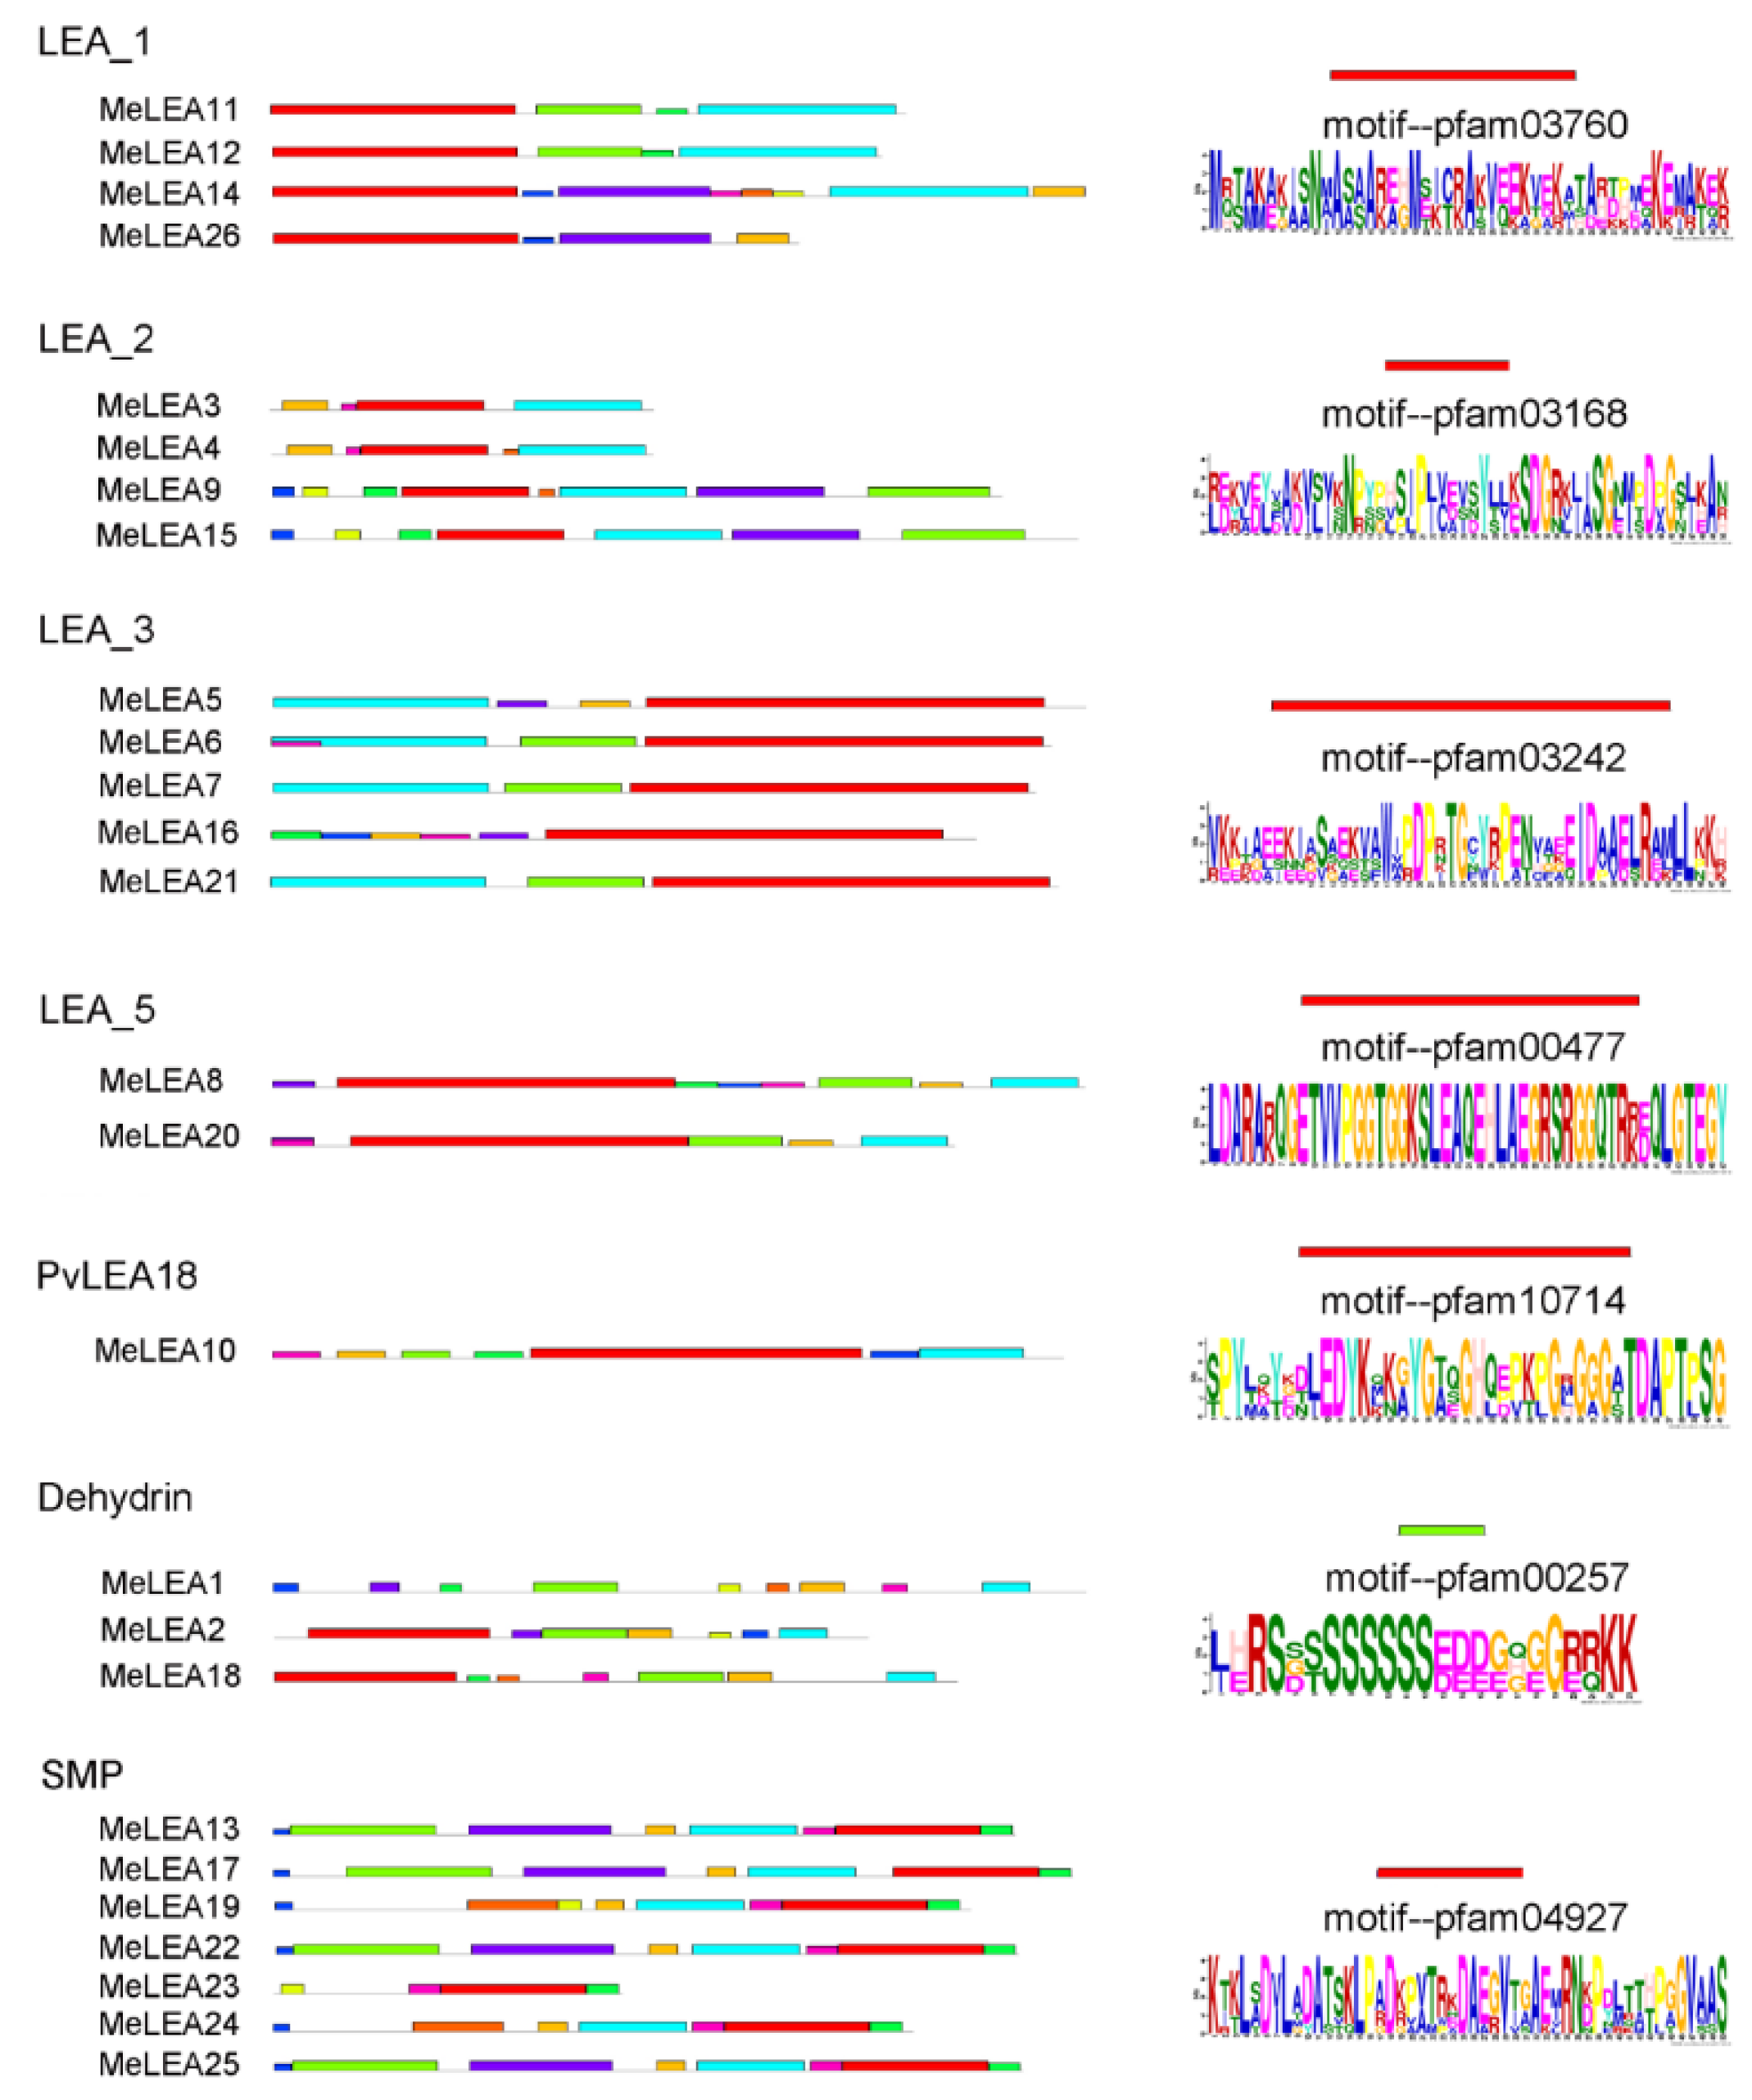
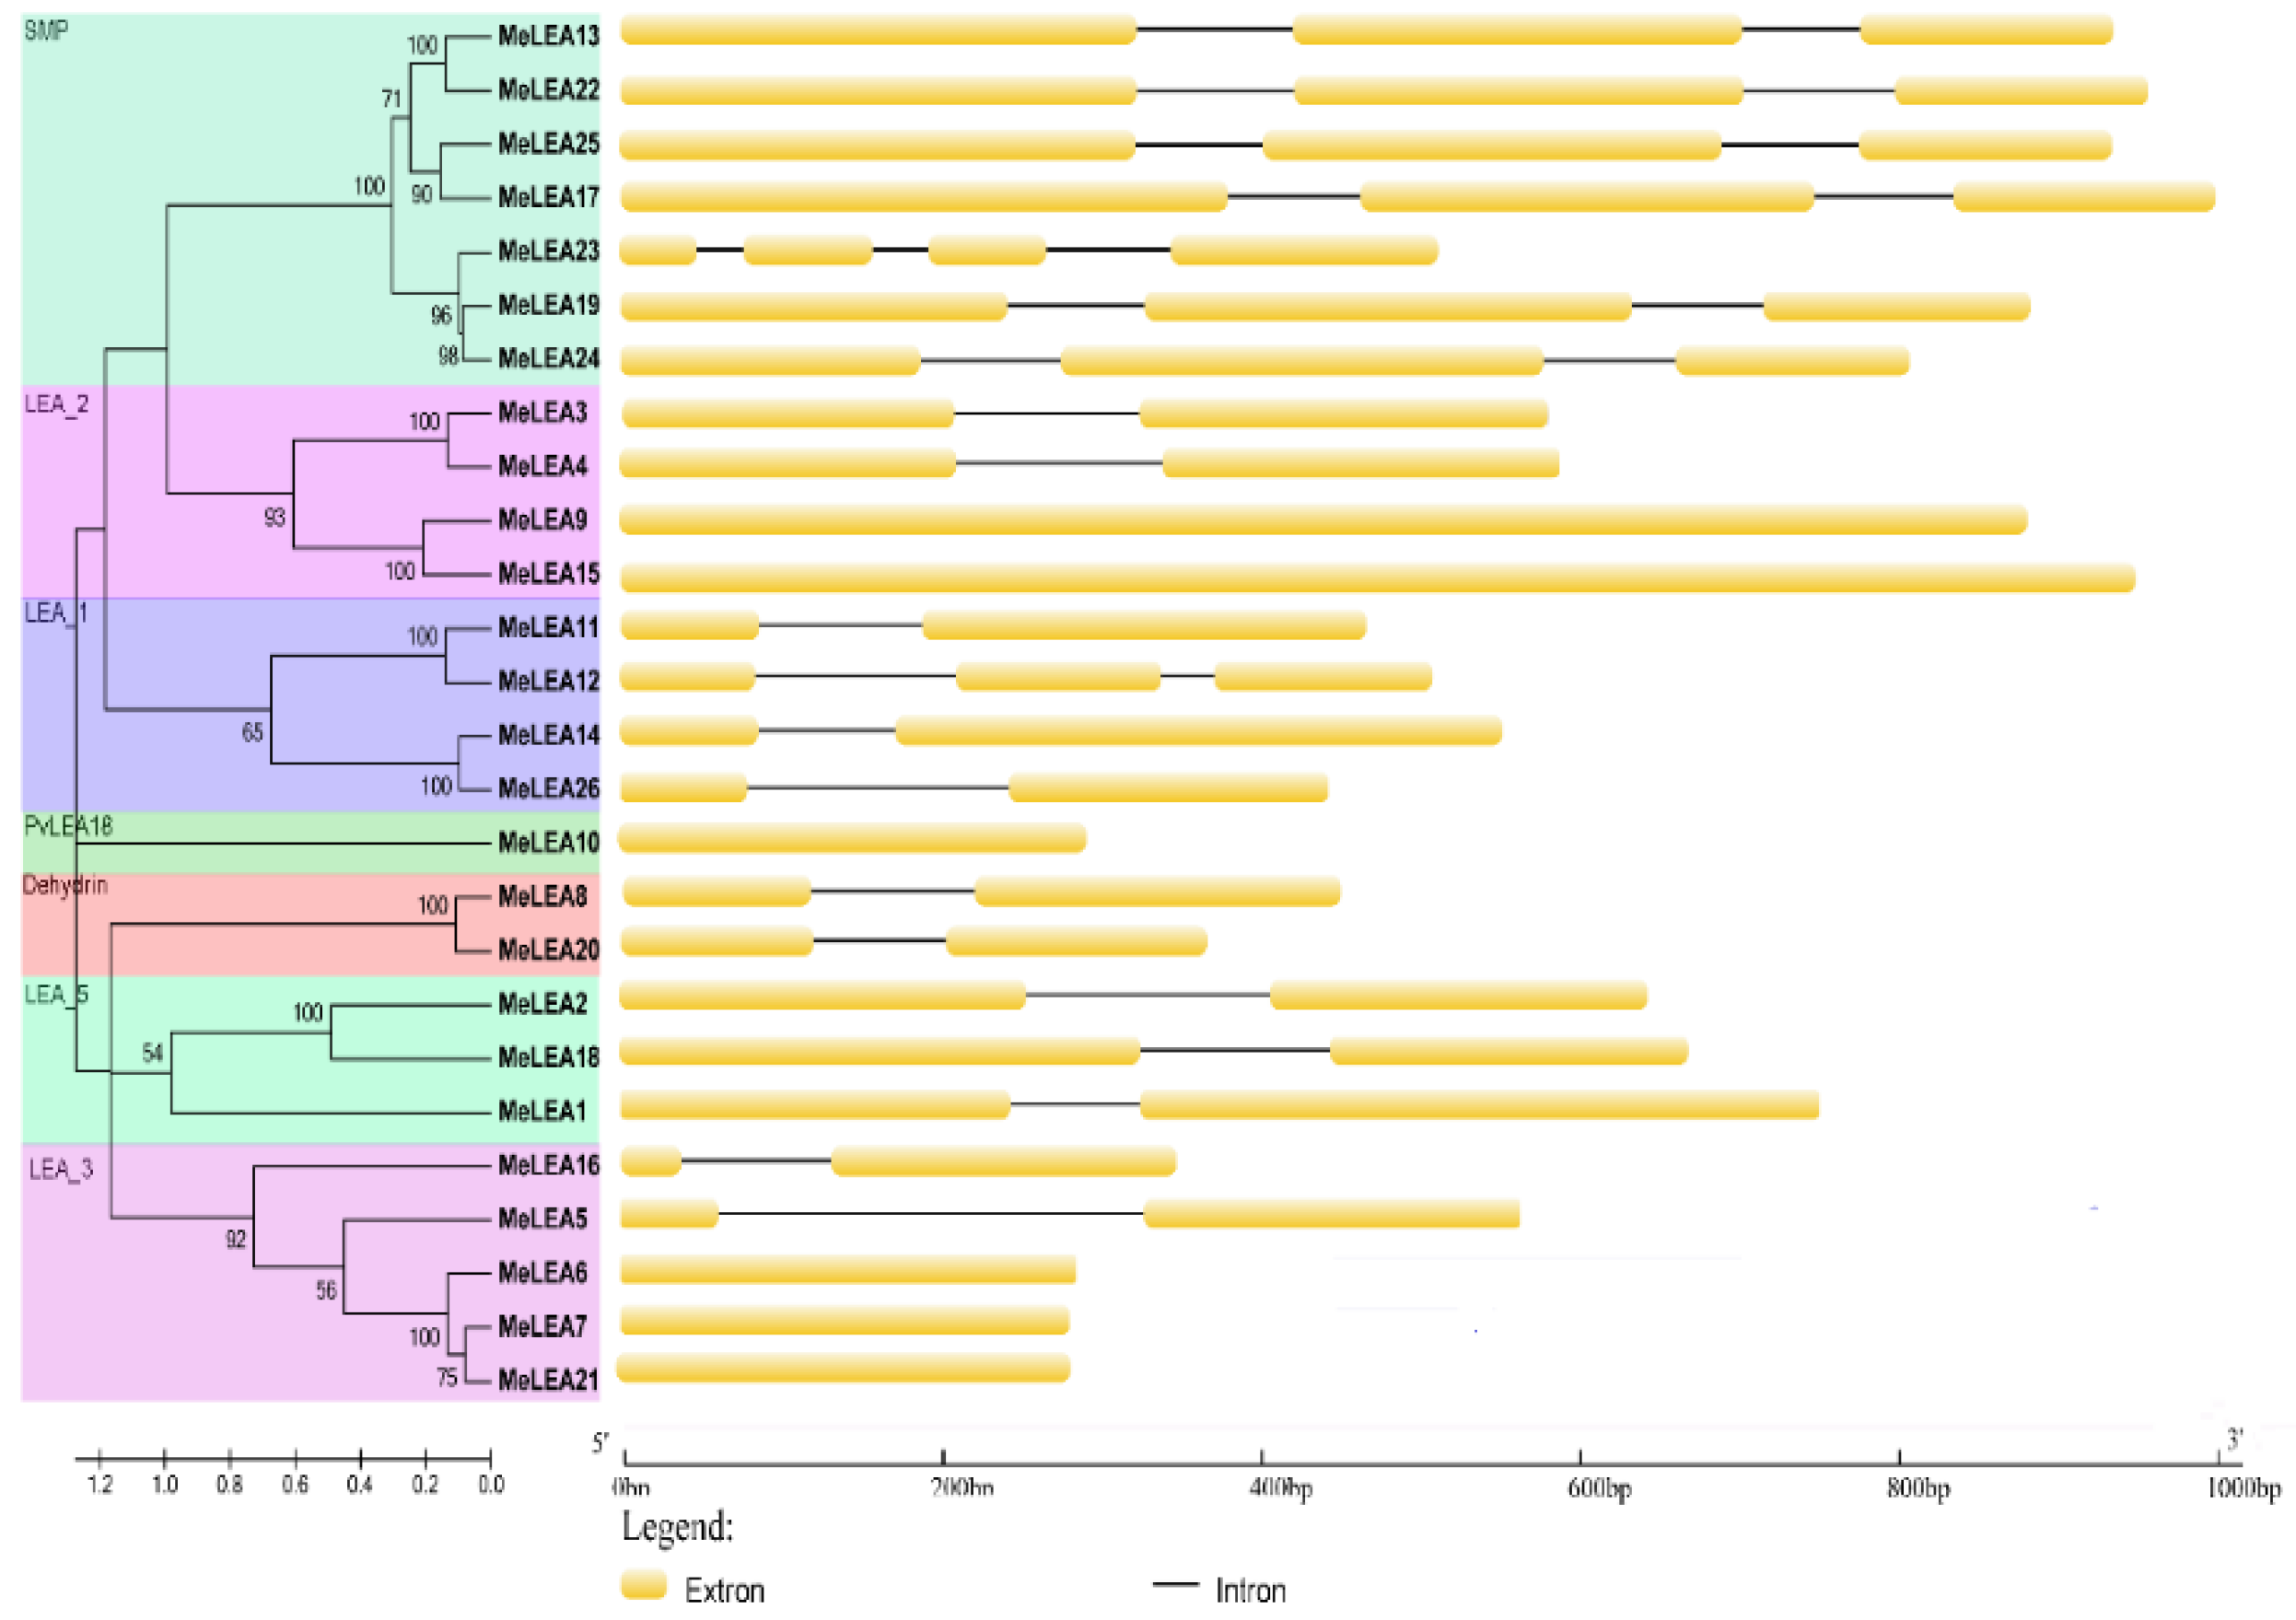
2.2. Conserved Motifs and Gene Structure of MeLEAs

To understand the structural features of the MeLEAs, conserved motifs were identified according to phylogenetic relationship. Since the 26 MeLEAs did not share high similarity, each subfamily was respectively submitted to MEME database and a total of 10 conserved motifs of MeLEAs were identified (Figure 2). Subsequently, the typical motif for each subfamily was annotated with the Pfam database. The red motif that encoded a conserved LEA domain by Pfam annotation existed in six subfamilies (LEA_1, LEA_2, LEA_3, LEA_5, SMP and PvLEA18). The conserved LEA domain in the Dehydrin subfamily was represented by green motif. These results suggested that the identified MeLEAs have the typical motifs of LEA family [8]. Generally, the LEA proteins belonging to the same subfamily shared similar motif organization, further supporting the phylogenetic classification [2,8,27].
Additionally, exon-intron organization of MeLEAs was analysed (Figure 3). The subgroup SMP was intron-rich with 2–3 introns, whereas other subgroups were intron-less with 0–1 intron, except for MeLEA12 with two introns. Generally, MeLEA genes in the same subfamily has similar exon-intron feature, which evidences their close phylogenetic relationship and the classification of subgroups.

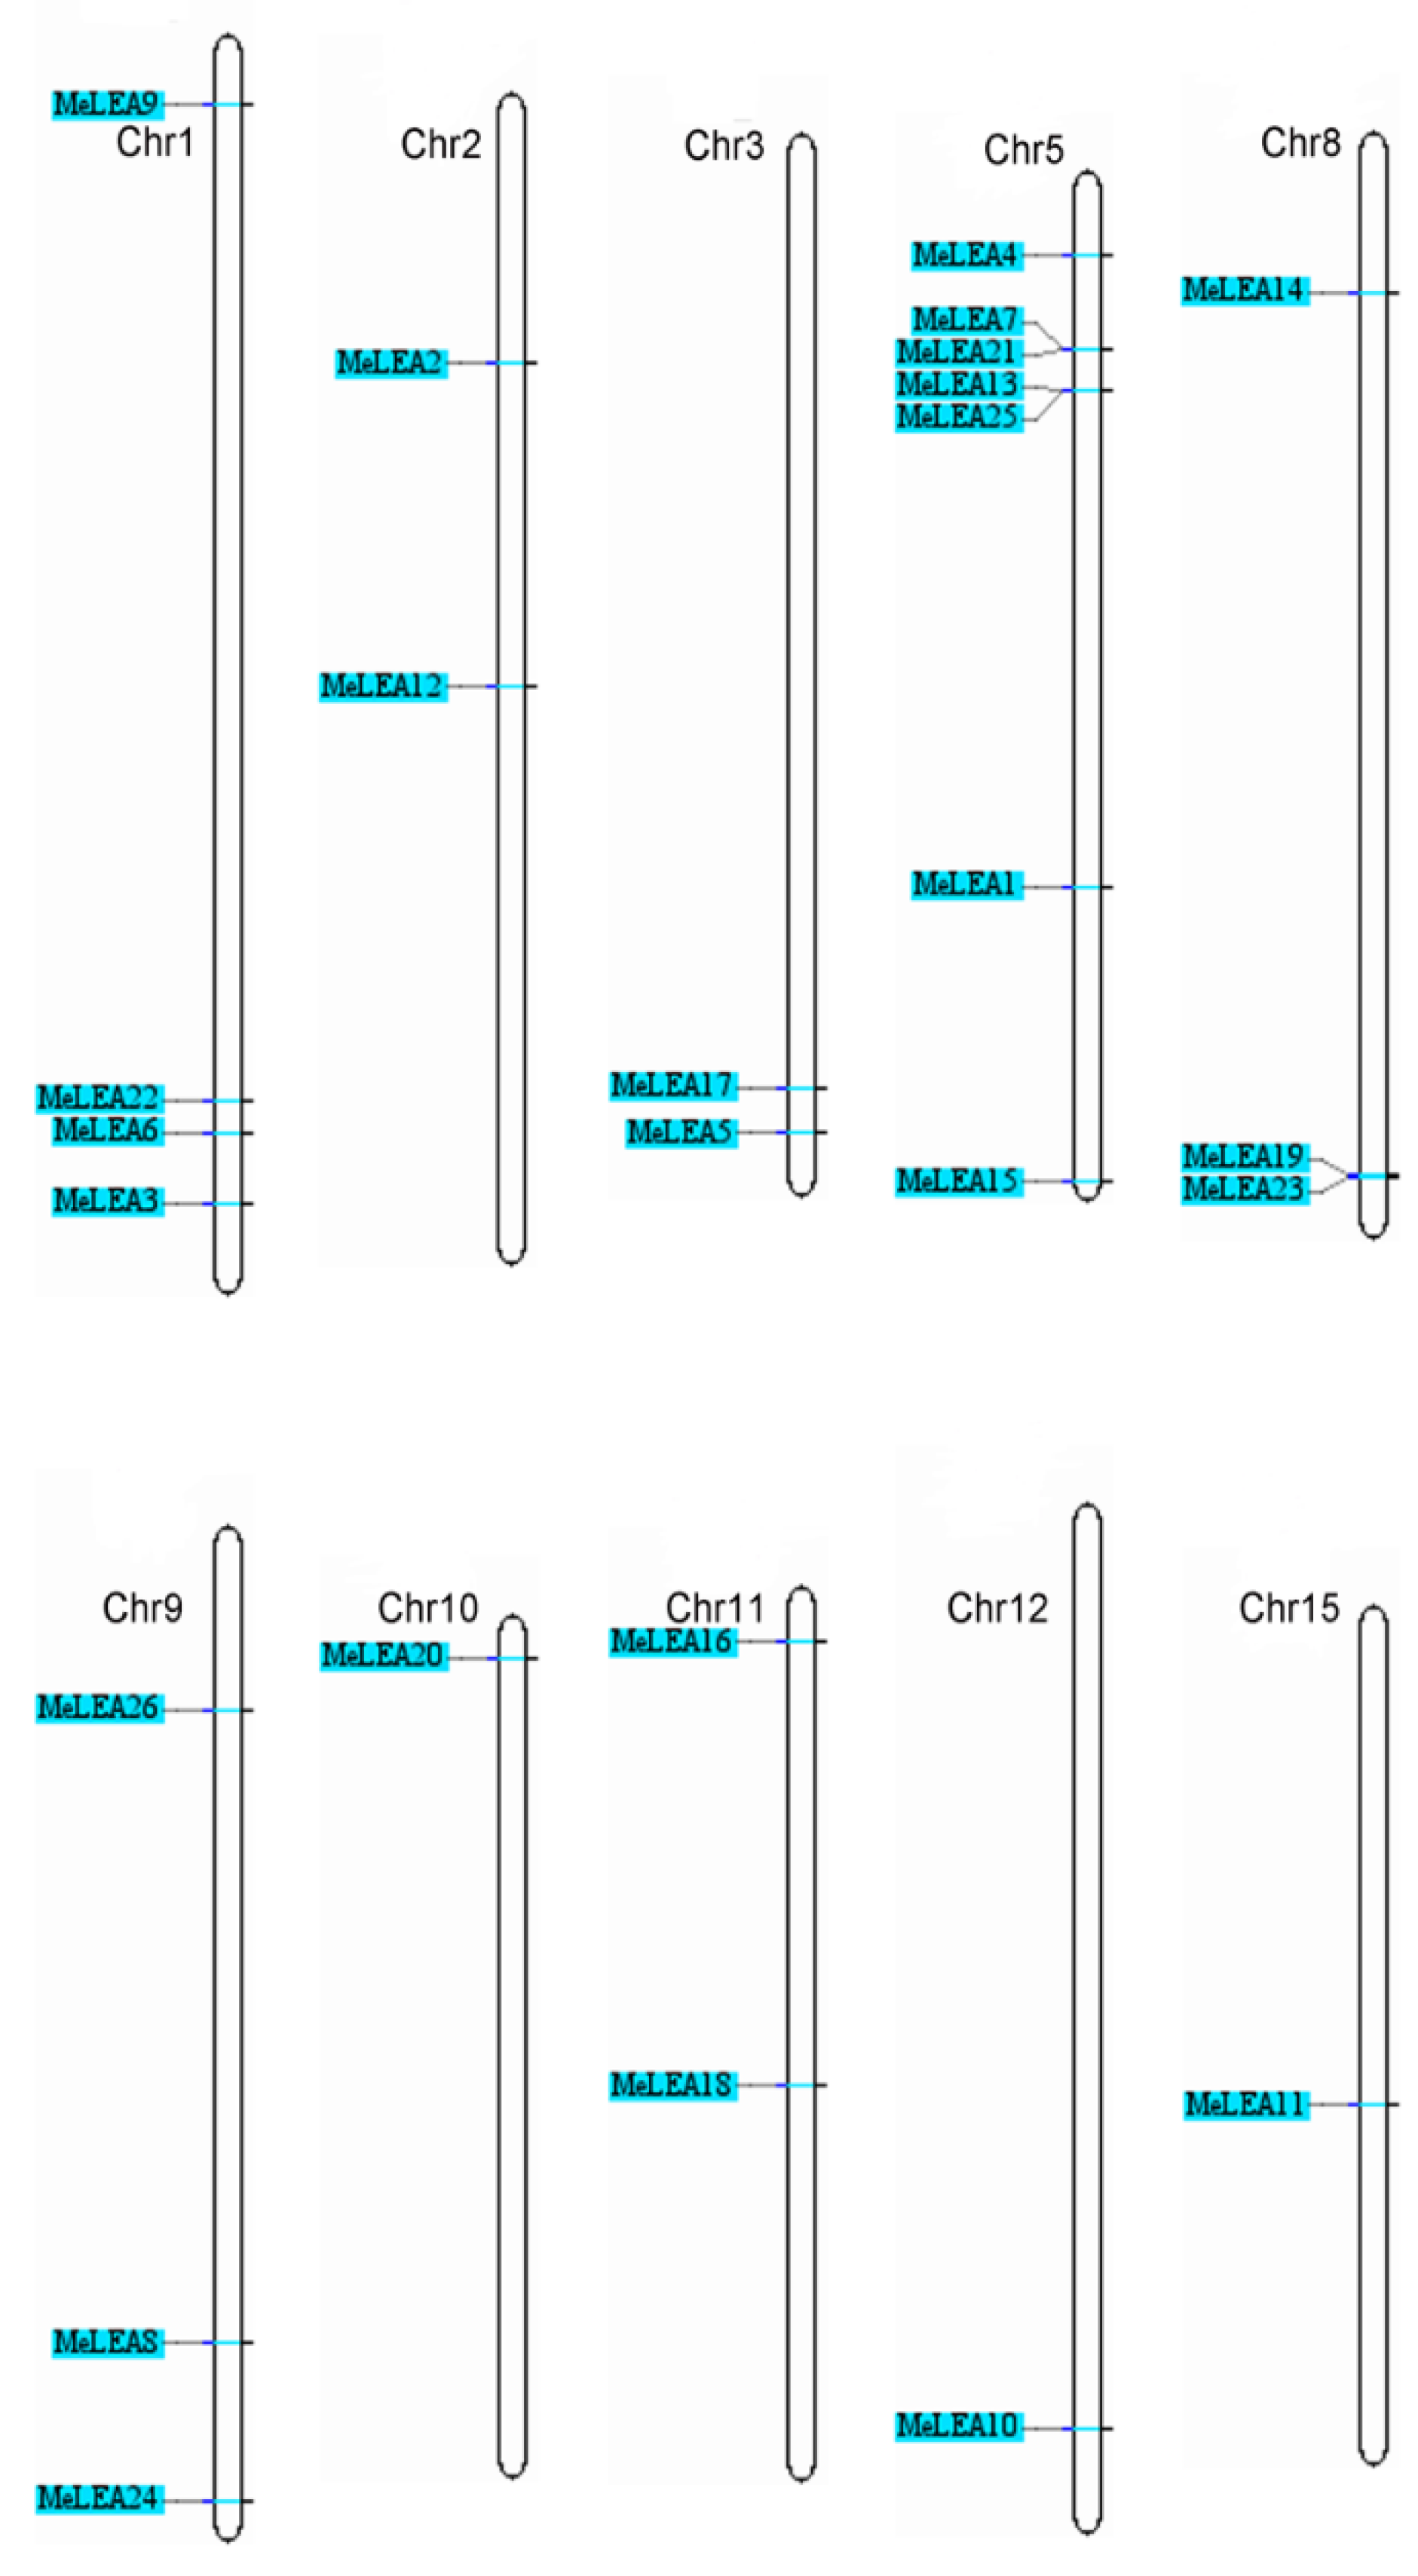
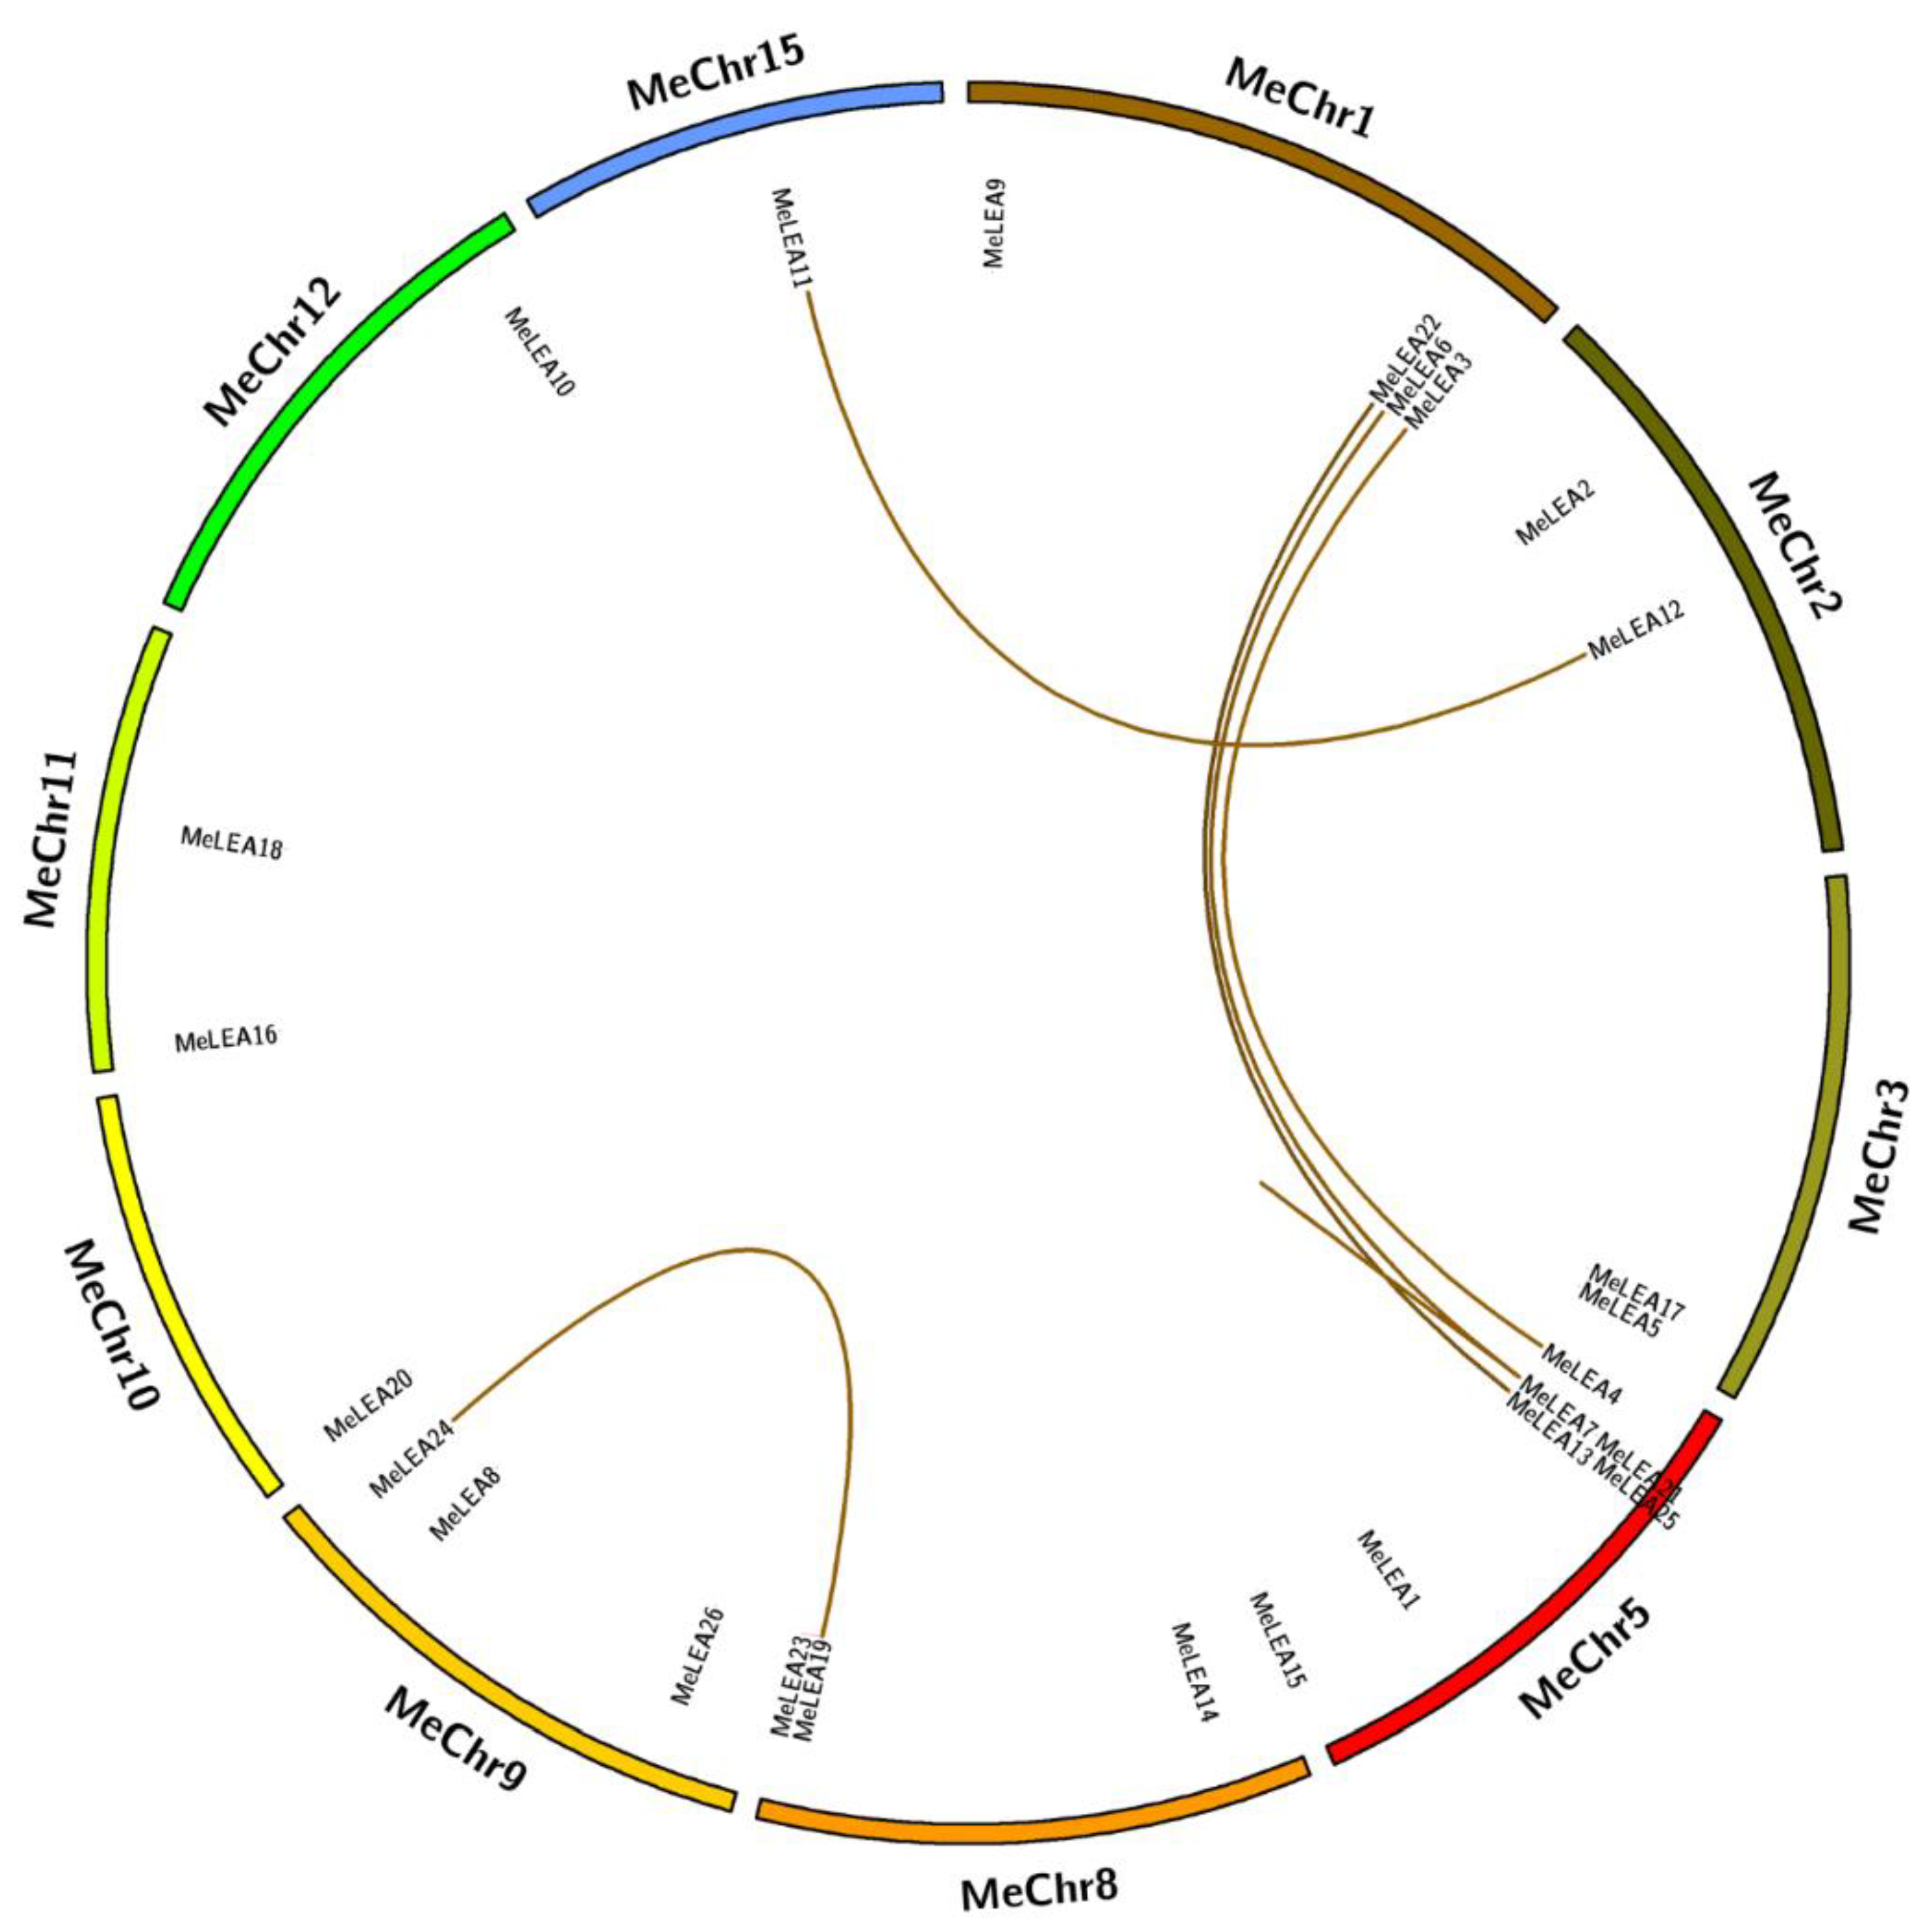
2.3. Chromosomal Distribution and Duplication Pattern of MeLEAs

To study the distribution of MeLEAs, the locations of the 26 MeLEA genes in chromosomes were identified (Figure 4). The MeLEAs were mapped to chr1, 2, 3, 5, 8, 9, 10, 11, 12, and 15. The PvLEA18 subfamily that contained only one gene MeLEA10 was located on chromosome 12. LEA_2 and LEA_3 subfamilies appeared in the chromosome 1 and 5, except for MeLEA5 and MeLEA16. The SMP subfamily which had seven members was distributed in chromosome 1, 3, 5, 8, and 9. LEA_1 subfamily contained four MeLEAs was placed in chromosome 2, 8, 9, and 15. The chromosomal location of LEA_5 subfamily were in chr9 and chr10. Dehydrin subfamily which contained MeLEA1, 2, 18 was distributed in chromosome 5, 2, 11, respectively.
To study the expansion of the MeLEA family in cassava, all nucleotide sequences of MeLEAs were aligned to identify their duplication patterns. Five duplication events involving 11 paralogues were identified (MeLEA3/MeLEA4, MeLEA11/MeLEA12, MeLEA13/MeLEA22, MeLEA19/MeLEA24 and MeLEA6/MeLEA7/MeLEA21), which evidenced that segmental duplications had an important role in MeLEAs expansion in the cassava genome (Figure 5).
Further, non-synonymous (Ka) and synonymous (Ks) values were calculated for the duplicated MeLEA genes based on nucleotide sequences. The pairwise comparison data revealed that the Ka/Ks ratios in all the paralogous genes were between 0.2 and 0.45, showing the purifying selection of these genes (Supplementary Table S2).

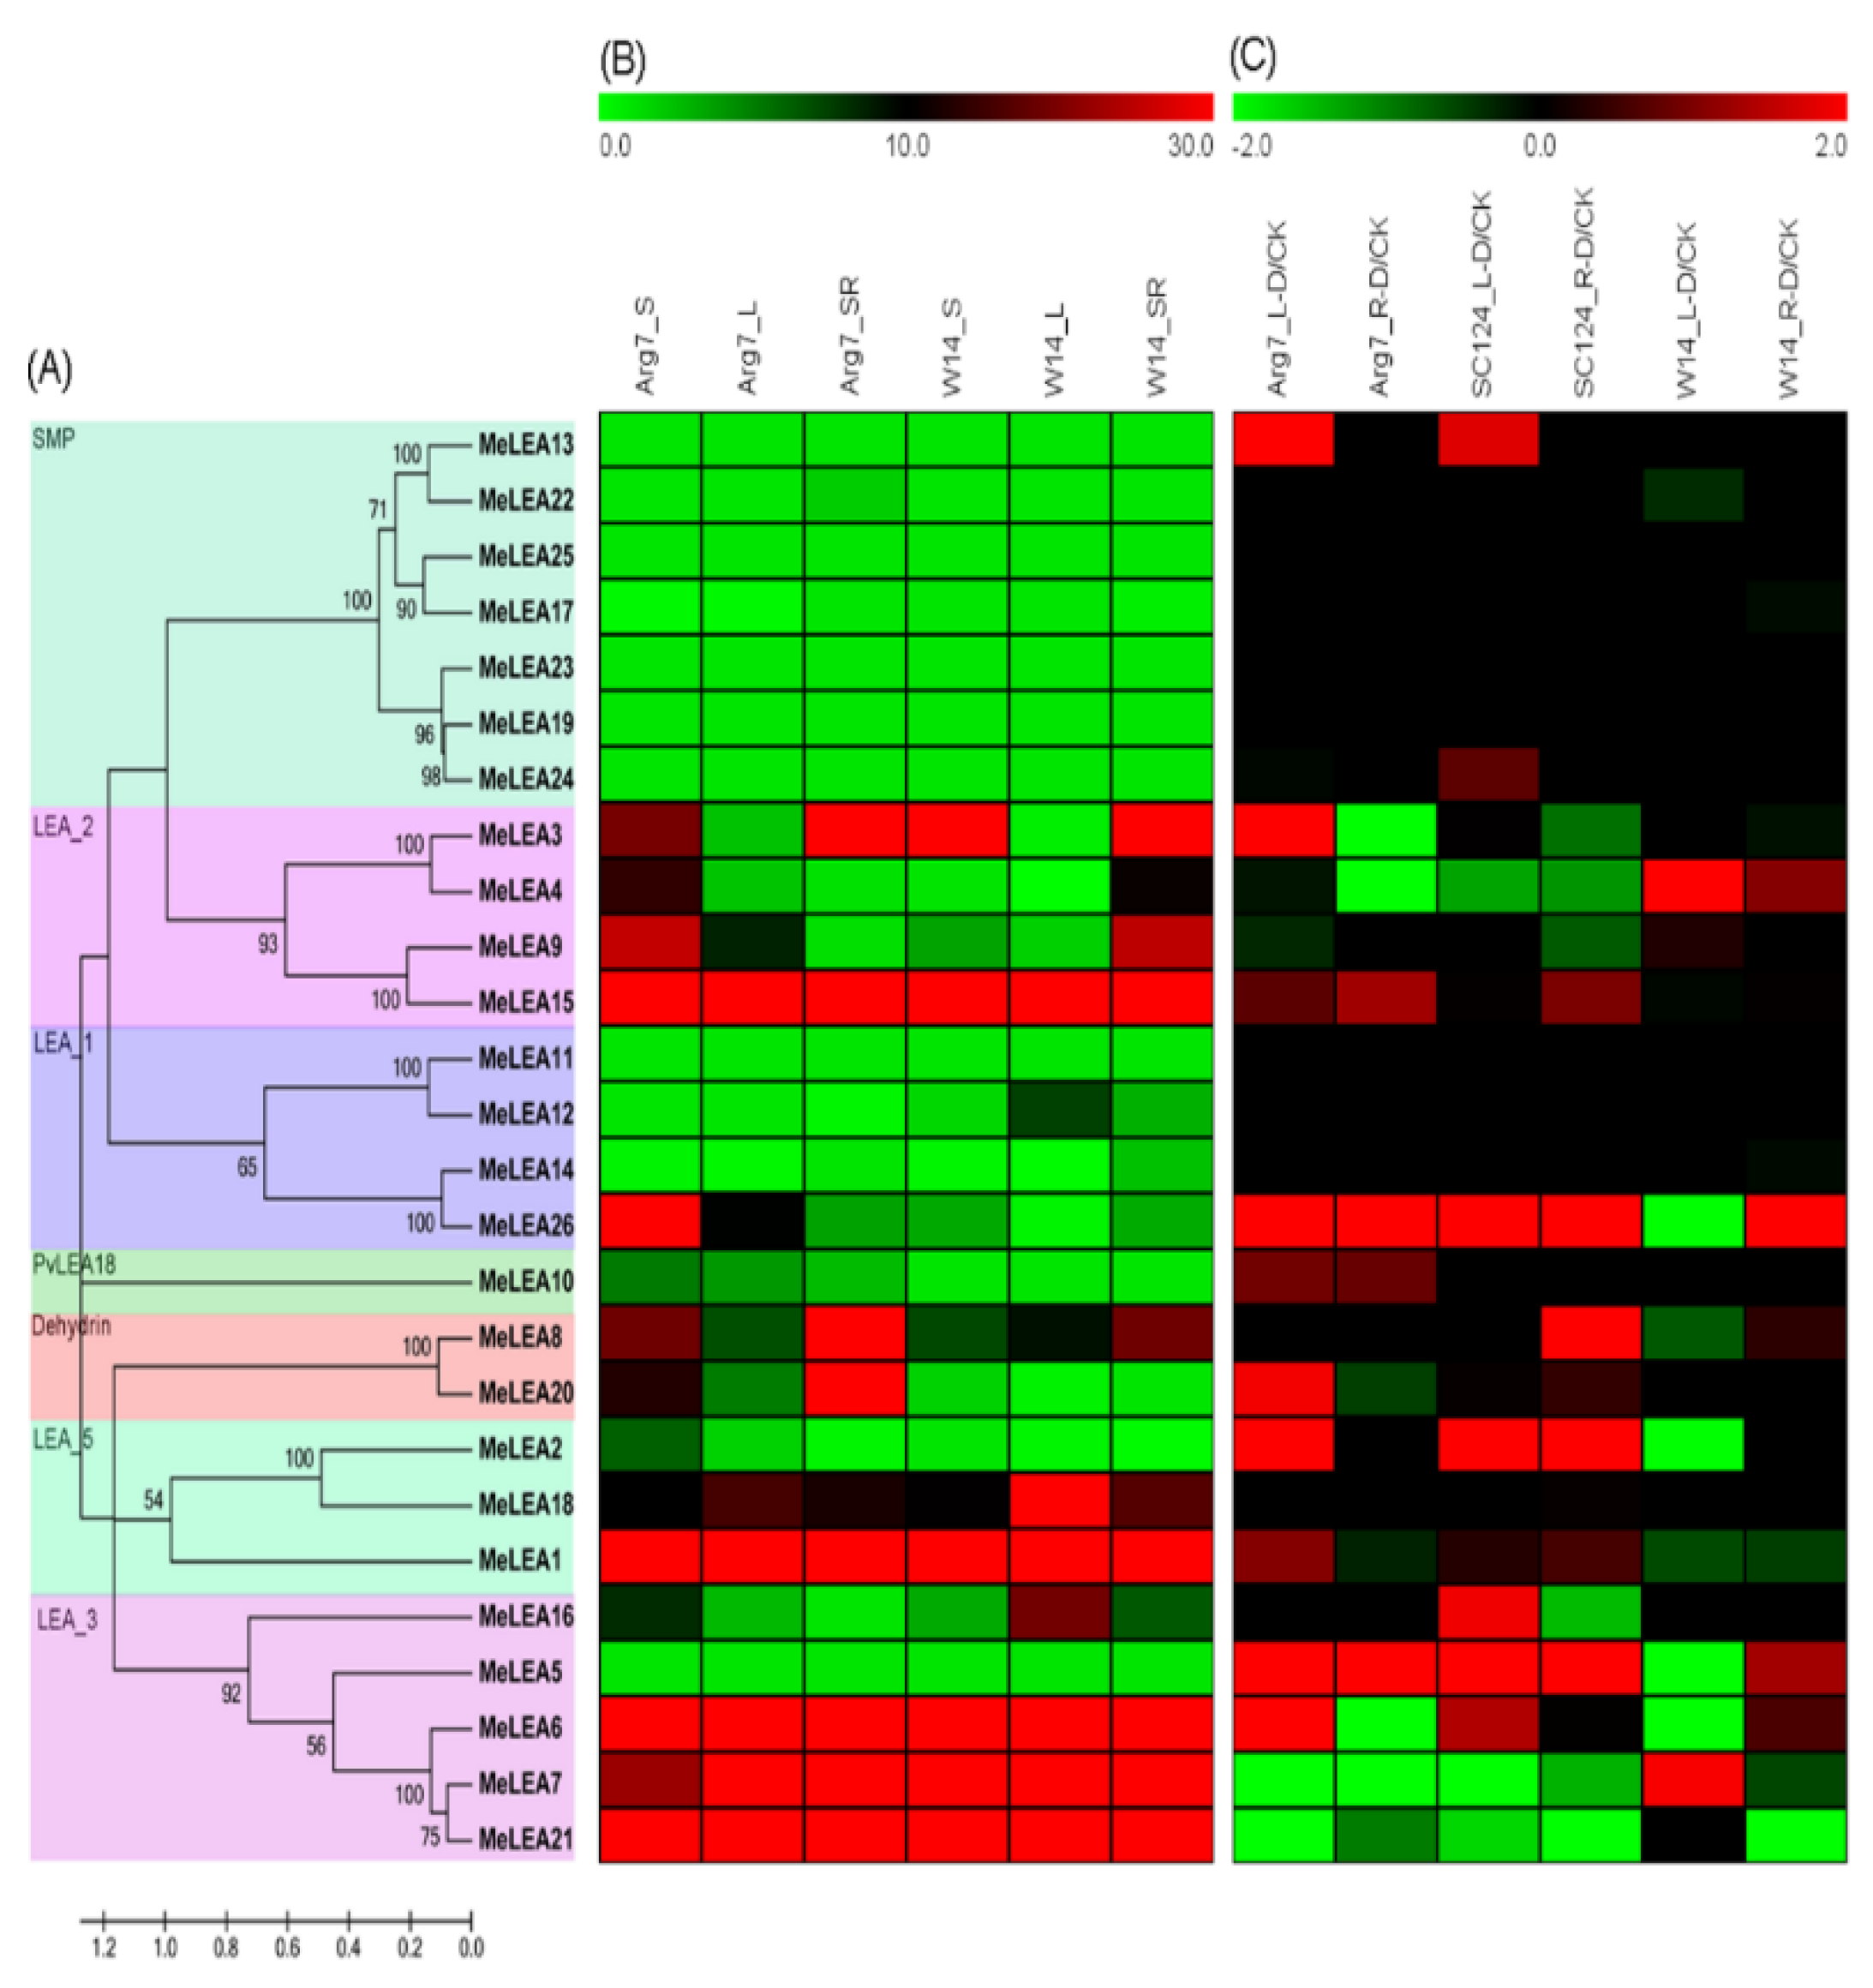
2.4. Expression Profiles of LEA Genes in Different Cassava Tissues

To examine the transcriptional levels of the LEA genes in diverse tissues of cassava, the storage roots, stems, and leaves of W14 and Arg7 were collected to perform RNA-seq analysis (Figure 6B; Supplementary Table S3). Nineteen out of the 26 MeLEAs had the corresponding transcripts data, while the remaining 7 MeLEA genes (MeLEA-5, -11, -13, -19, -23, -24, -25) were uncovered in the transcriptome dataset of different tissues of Arg7 and W14. These 7 MeLEA genes may have no, or low, expression levels in different tissues of cassava. In these 19 MeLEA genes, eight (42%), seven (37%), and five (26%) MeLEAs had high expression levels (FPKM value > 20) in storage roots, stems and leaves of Arg7, respectively. The MeLEAs with high expression levels (FPKM value > 20) in storage roots, stems and leaves of W14 were seven (37%), six (32%), and six (32%), respectively. Notably, MeLEA1 in the LEA_5 subgroup, MeLEA15 in the LEA_2 subgroup, and MeLEA-6, -7, -21 in the LEA_3 subgroup showed high expression abundance (FPKM value > 20) in all the tested tissues of Arg7 and W14. These LEA genes may be beneficial for cassava tissue development and function.

2.5. Expression Profiles of LEA Genes in Response to Drought Stress

To further investigate the possible role of MeLEAs under drought stress, water withholding was applied to a wild subspecies W14 and two cultivated varieties Arg7 and SC124. Then, total RNA was collected from roots and leaves for transcriptomic analyses (Figure 6C; Supplementary Table S4). According to the transcriptome data, 21 out of 26 MeLEAs had the corresponding expression data, while the rest of five MeLEAs (MeLEA-11, -12, -19, -23, -25) were not covered in the transcriptomic datasets. In W14, three (14%) and two (10%) MeLEA genes were transcriptionally up-regulated (log2-based fold change > 1) by drought stress in roots and leaves, respectively. In Arg7 variety, three (14%) and seven (33%) MeLEA genes were induced (log2-based fold change > 1) after drought stress in roots and leaves, respectively. In SC124 variety, four (19%) and six (29%) MeLEA genes showed up-regulation (log2-based fold change > 1) by drought stress in roots and leaves, respectively. Additionally, MeLEA5 and MeLEA26 were induced (log2 based fold change > 1) by drought in the two cultivated varieties. Together, these results revealed that the number of LEA genes induced by drought was more in Arg7 and SC124 than that in W14.

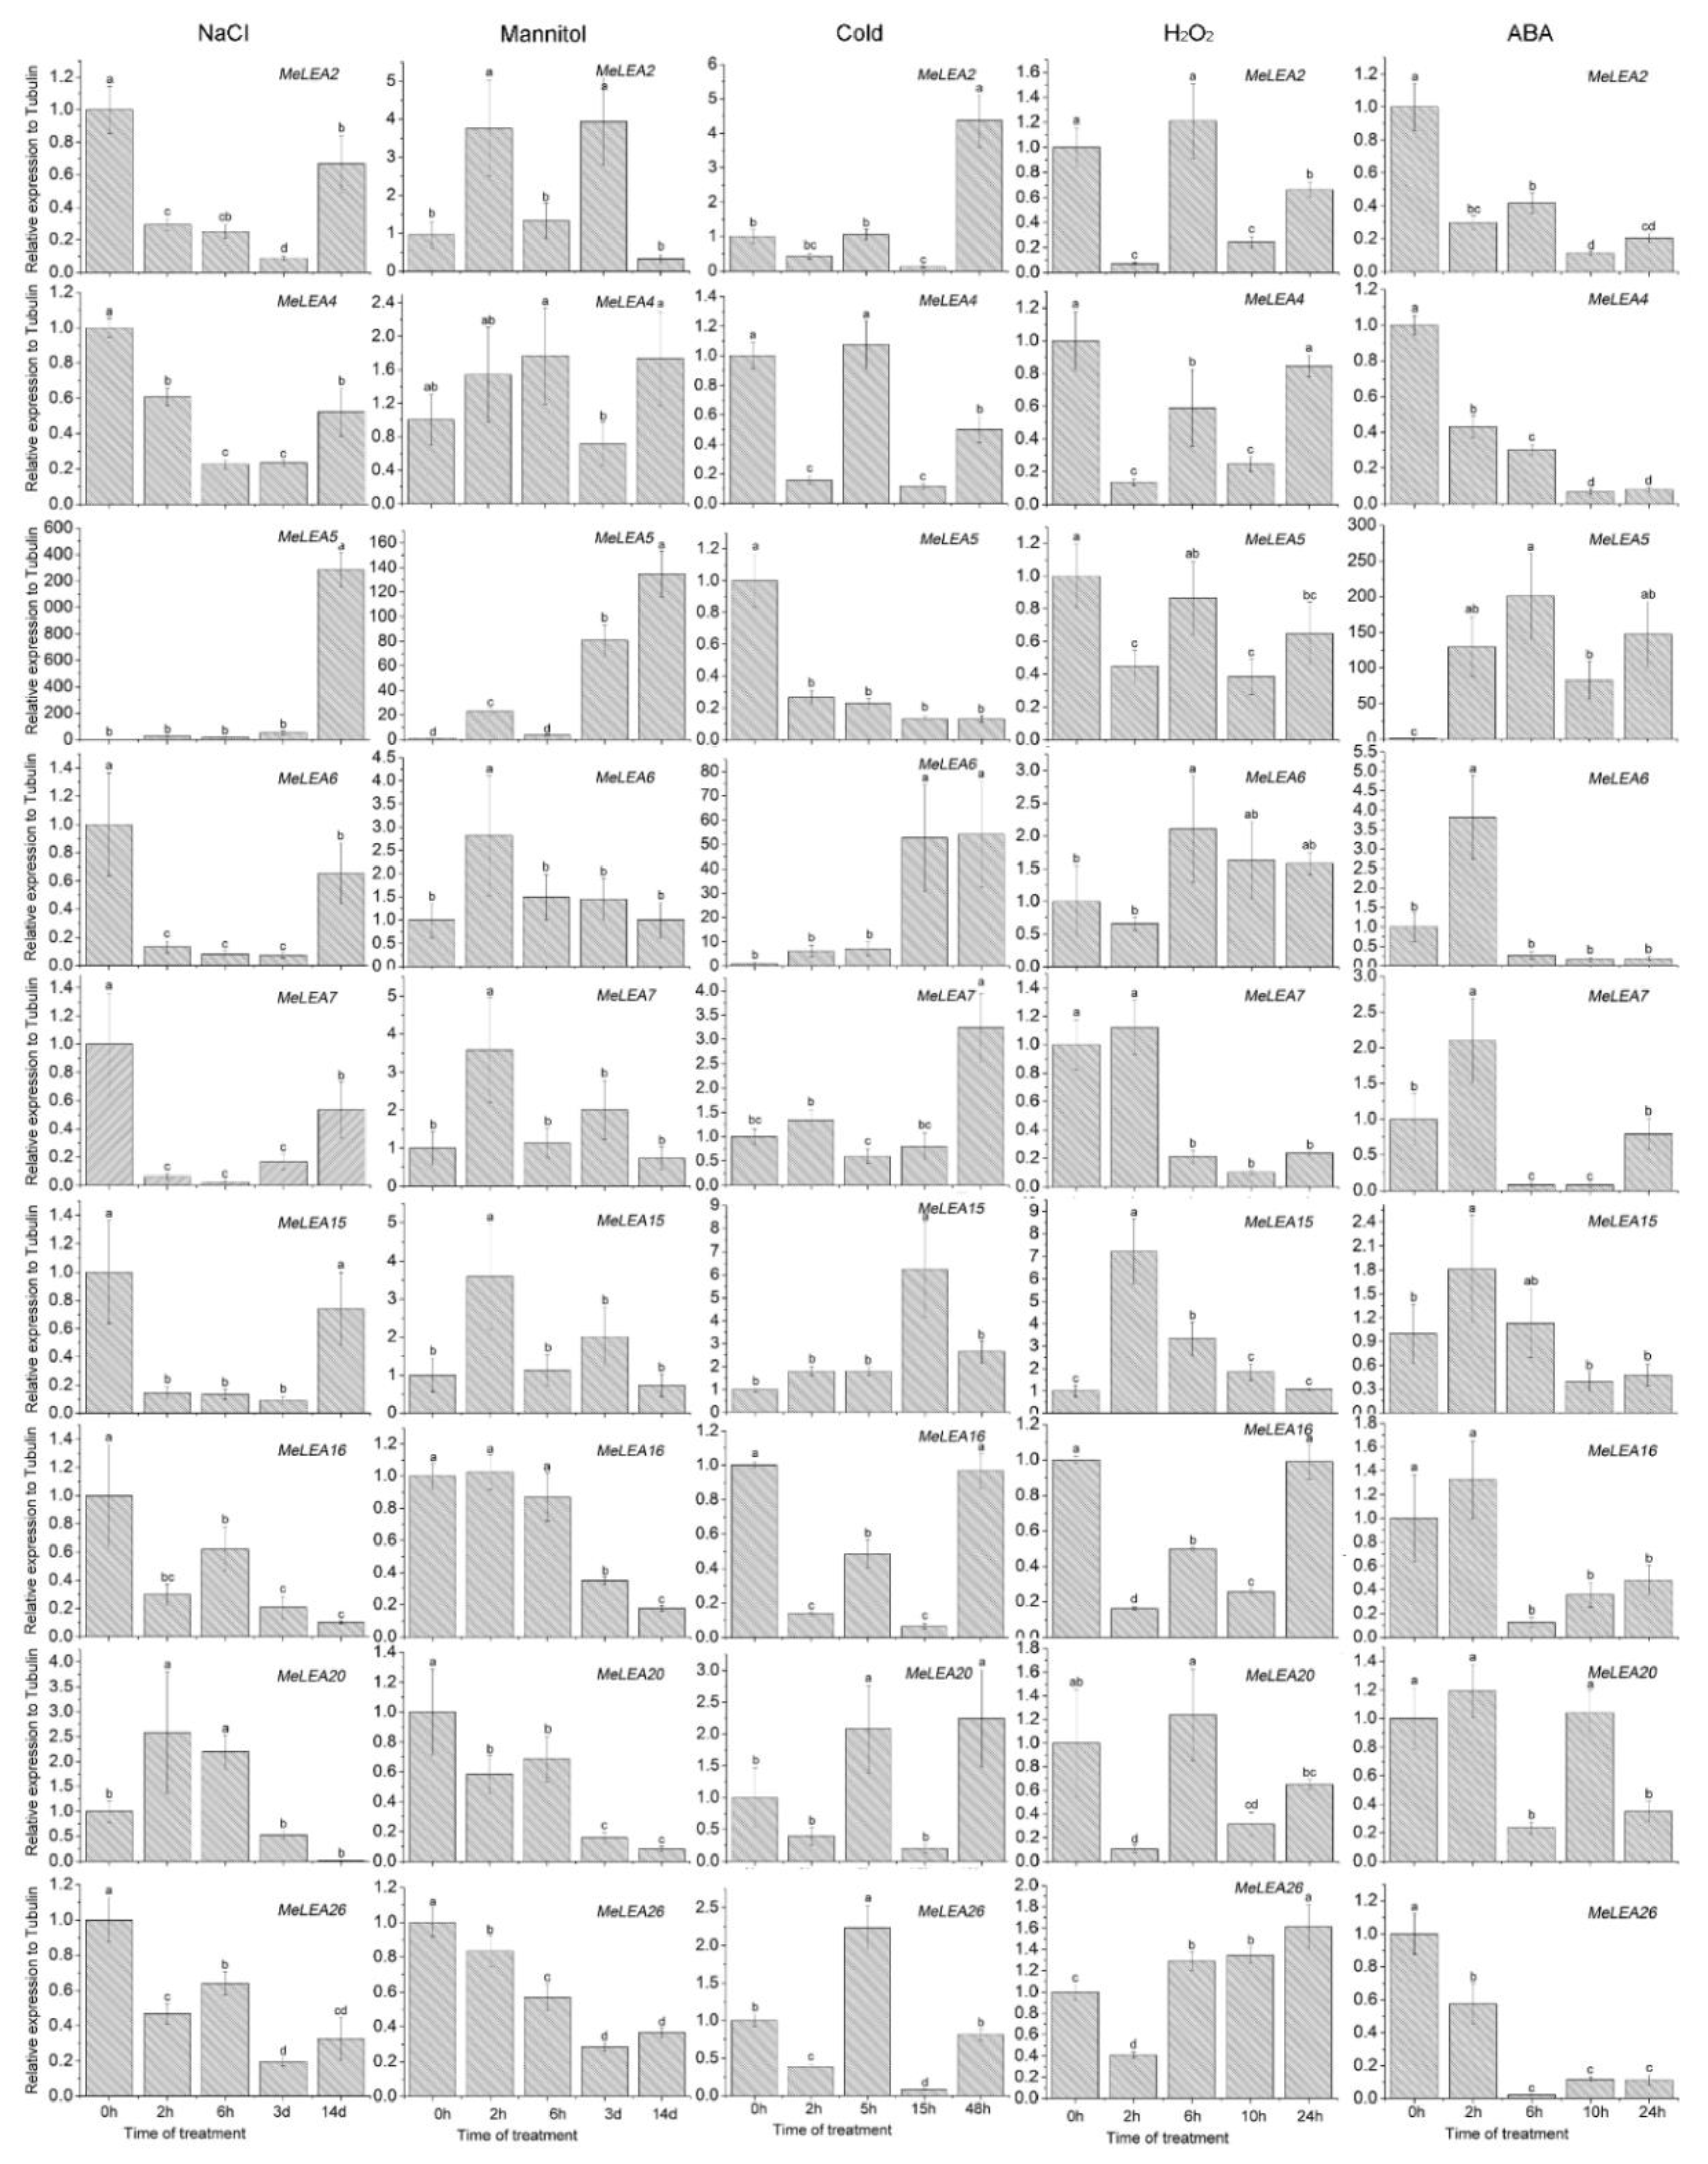
2.6. Expression Profiles of MeLEA Genes upon Exposure to Various Stresses and Related Signaling

Based on the RNA-seq data, 9 genes (MeLEA-2, -4, -5, -6, -7, -15, -16, -20, -26) were induced by drought stress in different cassava accessions, which were chosen for further examination of their transcriptional patterns after salt, osmotic, cold, and H2O2 and ABA treatments (Figure 7). Under salt treatment, MeLEA5 showed up-regulation at 14 d and MeLEA20 showed up-regulation at 2 h and 6 h. In contrast, MeLEA-2, -4, -5, -6, -7, -15, -16, -26 showed down-regulation at several treated time points. Under osmotic treatment, MeLEA2 transcripts increased at 2 h and 3 d, MeLEA5 at 2 h, 3 d, and 14 d, and MeLEA-6, -7, -15 at 2 h. Conversely, the transcripts of MeLEA-16, -20, -26 decreased at 3 d and 14 d. In response to cold stress, MeLEA6 at 15 h and 48 h, MeLEA7 at 48 h, MeLEA15 at 15 h, and MeLEA20 at 5 h and 48 h showed induction, whereas MeLEA-4, -5, -16 exhibited repression. Under H2O2 treatment, MeLEA6 at 15 h and MeLEA15 at 2 h was induced, while MeLEA-2, -4, -5, -7, -16, -20 were repressed at several treated time points. Treatment with ABA induced the expression of MeLEA5 during 2 h–24 h, MeLEA6 at 2 h, and MeLEA15 at 2 h, but repressed the expression of MeLEA-2, -4, -26 at all the treated time points, MeLEA16 during 6 h–24 h, and MeLEA20 at 6 h and 24 h. These results indicated that MeLEAs may be responsive to various stresses or signals, indicating their possible role in multiple signaling pathways in cassava.

3. Discussion

Due to the significant roles of LEA proteins in abiotic stress response and the typical feature of drought tolerance of cassava, it is requisite to systematically investigate the potential role of LEAs. In this study, we identified 26 MeLEAs from the cassava genome, which is shrunk in comparison to LEA members from Arabidopsis [3], rice [2], Brassica napus [8], Brachypodium distachyon [28], and Populus trichocarpa [29], but expanded compared with that from moso bamboo [27]. Previous phylogenetic analyses indicated that LEAs in most plant species contained eight subfamilies (LEA_1, LEA_2, LEA_3, LEA_4, LEA_5, PvLEA18, dehydrin, and SMP) [8]. MeLEAs were classified into seven subfamilies, among which the LEA_4 subfamily was not found in cassava (Figure 1). LEAs in Arabidopsis were classified into nine subfamilies (LEA_1, LEA_2, LEA_3, LEA_4, LEA_5, PvLEA18, dehydrin, SMP, and AtM), in which AtM was unique to the Brassicaceae [3]. Additionally, a total of 34 LEAs in rice were grouped into seven families (LEA_1, LEA_2, LEA_3, LEA_4, LEA_5, dehydrin, and SMP), whereas the PvLEA18 subfamily was lacking [2]. These evidences suggested that the subfamily variation of the LEA family existed in some plant species. Most of the LEA genes (25/26) harbored less introns (0–2) in cassava (Figure 3), which is in accord with the intron feature of LEAs in other plant species, such as 21/23 PeLEAs, 92/108 BnLEAs, and 39/39 OsLEAs with 0–2 introns [2,8,29]. All the MeLEAs in SMP subfamily showed intron-rich feature (containing 2–3 introns) and low/no expression in different tissues. In contrast, MeLEA15 in LEA_2 subfamily and MeLEA-6, -7, -21 in the LEA_3 subfamily did not contain intron, but had high expression levels in various tissues (Figure 3 and Figure 6). These results suggested that intron structure variation is associated with the expression patterns of MeLEAs. Additionally, MeLEAs belonging to the same subfamily had similar motifs and exon-intron compositions, further supporting the phylogenetic classification of MeLEAs (Figure 2 and Figure 3).
The expansion of a gene family occurs via three modes: segmental duplication, tandem duplication, and whole-genome duplication [40,41]. It was necessary to analyze the duplication events of LEA genes in cassava. Firstly, the chromosomal distribution of the LEAs in cassava was investigated, which was widely distributed in the genome, and the similar result was observed in Arabidopsis, rice and Brassica napus (Figure 4) [2,3,8]. Subsequently, five pairs of paralogous genes (MeLEA3/MeLEA4, MeLEA11/MeLEA12, MeLEA13/MeLEA22, MeLEA19/MeLEA24, and MeLEA6/MeLEA7/MeLEA21) were identified from cassava, suggesting that segmental duplication may be the main expansion mechanism for MeLEAs (Figure 5). Further Ka/Ks ratio calculation showed the paralogues of MeLEAs were subjected to purifying selection (Supplementary Table S2). This is consistent with the LEA family expansion in Brassica napus and B. distachyon [8,28]. Of these paralogous gene pairs, MeLEA3/MeLEA4 showed similar exon-intron organization (two exons), whereas distinct expression profiles in different tissues; MeLEA11/MeLEA12 showed different exon-intron organization, but commonly low/no expression in different tissues; MeLEA13/MeLEA22 and MeLEA19/MeLEA24 commonly had three exons and low/no expression in different tissues; and MeLEA6/MeLEA7/MeLEA21 commonly displayed 1 exons and high expression in different tissues. Additionally, these paralogous gene pairs exhibited different expression patterns after drought treatment in different cassava accessions (Figure 3 and Figure 6C). These results indicated that segmental duplication-driven expansion resulted in similar gene structure and expression diversity of most paralogous MeLEAs. This is in accord with the current opinion that gene duplication generates new genetic diversity as a basis for evolutionary innovation in eukaryotes [42].
Genome-wide expression analysis have demonstrated the significant response of LEA genes to drought or osmotic stress in various species, including Arabidopsis, rice, Moso bamboo, and sweet orange [2,3,27,43]. In this study, we found that some MeLEA genes, including MeLEA-2, -5, -6, -13, -26, were induced (Log2FPKM > 1) by drought in different cassava accessions. Additionally, we observed that the total number of MeLEAs up-regulated by drought was greater in Arg7 and SC124 than that in W14, indicating the comprehensive activation of LEAs in Arg7 and SC124 (Figure 6C). This indicated that LEAs-mediated drought responsive mechanism are differentiated between wild subspecies and cultivated varieties. Due to the differences for the genetic background between wild species (W14) and cultivated varieties (Arg7 and SC124) [44], the contribution of MeLEA genes to drought tolerance of cassava is elucidated.
Previous studies demonstrated that LEAs could widely participate in plants response to abiotic stress and hormones [2,3,8,19,20,21,22,23,24,25,26,27,28,29]. Here, we examined the expression of nine genes (MeLEA-2, -4, -5, -6, -7, -15, -16, -20, -26) under salt, osmotic, cold, and H2O2 and ABA treatments. The results showed that almost all the MeLEA genes could be induced at least by one of the treatment (Figure 7). Notably, MeLEA5 was commonly inducted by ABA, salt, and osmotic treatments; MeLEA6 was commonly up-regulated by ABA, cold, and osmotic treatments; MeLEA7 and MeLEA15 were commonly up-regulated by cold and osmotic treatments; and MeLEA20 was commonly induced by cold and salt treatments. In rice, OsLEA-5, -12, -29 showed up-regulation after osmotic, salt, and ABA treatments [2]. In Moso bamboo, 10 genes showed induction after both dehydration and cold stresses [19]. These evidences supports that a single MeLEAs is involved in various stresses or signals and MeLEA-5, -6, -7, -15, 20 can serve as candidates for genetic improvement of crop tolerance to multiple stresses.

4. Materials and Methods

4.1. Plant Materials and Treatments

The characteristics of W14, SC124, and Arg7 cassava accessions were described in previous studies [45,46]. W14 (M. esculenta ssp. flabellifolia) is a wild subspecies of cultivated cassava. Arg7 is a variety containing elite agronomic traits, including a certain level of growth under moderate drought stress. SC124 is a widely planted cassava cultivar in China and can survive in prolonged severe drought stress. All the cassava plants were cultured with soil and vermiculite (1:1) under the glass house in the CATAS (Chinese Academy of Tropical Agricultural Sciences, Haikou, China). To analyze transcripts of MeLEAs in distinct tissues at the early development stage, stems (90 days old), leaves (90 days old), and storage roots (150 days old) were gathered from Arg7 (cultivated variety) and W14 (wild subspecies) under normal conditions. To examine the transcriptional levels of MeLEAs under drought stress, cassava plants (90 days old) of W14, Arg7, and SC124 were subjected to water withholding for 12 days, and the leaves and roots were collected for RNA sequencing. To detect the expression levels of MeLEAs under abiotic stress, leaves were collected from Arg7 (60 days old) for quantitative real-time PCR (qRT-PCR) detection. For salt and osmotic treatments, cassava seedlings grew in soil irrigated with 300 mM NaCl or 200 mM mannitol for 14 days. For cold treatment, cassava seedlings were cultured in an incubator with low temperature (4 °C) for 48 h. For ABA and H2O2 treatments, cassava seedlings grew in soil irrigated with 100 μM ABA or 10% H2O2 for 24 h.

4.2. Identification and Phylogenetic Analyses

The whole LEA protein sequences in Arabidopsis and rice were obtained from the Arabidopsis information resource (TAIR) and rice genome annotation project (RGAP) databases, respectively [47,48]. The whole genome and protein sequences of cassava were downloaded from the Phytozome 12.0 cassava database (Lawrence Berkeley National Laboratory, Berkeley, CA, USA). MeLEAs were identified by hidden Markov model (HMM) profiles built from the known LEA protein sequences [49]. To confirm the LEAs of cassava, the candidate MeLEAs were further analyzed using the conserved domain search (CDD), simple modular architecture research tool (SMART), and the basic local alignment search tool (BLAST) databases [50,51,52]. The unrooted phylogenetic tree was created with LEA protein sequences from cassava, Arabidopsis, and rice by ClustalX 2.0 (Tokyo Metropolitan University, Tokyo, Japan) and MEGA 6.0 software packages (University College Dublin, Dublin, Ireland) bootstrap values for 1000 replicates) [53,54].

4.3. Protein Properties and Gene Structure Analysis

The ExPASy database (Swiss Institute of Bioinformatics, Lausanne, Switzerland) and DNASTAR software packages (DNASTAR, Madison, WI, USA) were used to predict the molecular weight and isoelectric points of MeLEA proteins [55,56]. The MEME database was employed to identify the conserved motifs of MeLEA proteins [57]. Then, all the structural motifs were annotated by SMART, PFAM, and InterProScan databases [13,49,58]. The exon/intron organization of MeLEAs were identified by the Gene Structure Display Server (GSDS) database [59].

4.4. Chromosomal Location and Duplication Pattern Analysis

The chromosomal location of MeLEA genes was identified according to the data information obtained from the Phytozome 12.0 cassava database. Paralogous LEA genes were selected according to calculation of sequence identity and the phylogenetic relationship. Gene duplication events of paralogous LEA genes in cassava were identified based on the following two rules: (1) the alignment covered >80% of the longer gene; (2) the aligned region had an identity >80% [60,61]. The Ks (synonymous substitution) and Ka (non-synonymous substitution) were calculated by DnaSP 5.0 software (Universitat de Barcelona, Barcelona, Spain) [62]. A Ka/Ks ratio < 1 indicates a purifying selection, a Ka/Ks ratio = 1 indicates a neutral selection, and a Ka/Ks ratio > 1 indicates a positive selection [63,64].

4.5. Transcriptomic Analysis

Samples were gathered to extract total RNA with plant RNA extraction kit (TIANGEN, Beijing, China). The total RNA of each sample was used to construct cDNA libraries. Then, Illumina GAII platform (Illumina, San Diego, CA, USA) was used to perform high throughput sequencing according to manufacturer’s RNA-seq protocol. Adapter sequences were cleaned by FASTX-toolkit in the raw reads [65]. To obtain high quality sequences, FastQC was used to remove low quality sequences [66]. Then, clean reads were mapped on the cassava genome by Tophat v.2.0.10 (Johns Hopkins University, Baltimore, MD, USA) [67]. Cufflinks was used to performed transcriptome assemblies [68]. Finally, FPKM (fragments per kilobase of transcript per million mapped fragments) values were calculated to create heat map with MeV 4.9 software (CCCB, Boston, MA, USA).

4.6. qRT-PCR Analysis

Expression of MeLEAs in response to various stimuli were determined by quantitative real-time PCR (qRT-PCR) on Stratagene Mx3000P instrument (Stratagene, Santiago, CA, USA). AlleleID6.0 was used to design gene-specific primer pairs that were further validated by melting curve and agarose gel electrophoresis (Supplementary Table S5). Each reaction system had a volume of 10 μL containing 0.5 μL of cDNA, 1 μL of gene-specific primers, 3.5 μL of RNA-Free water and 5 μL of SYBR® Premix Ex Taq™ (TaKaRa, Tokyo, Japan). The PCR conditions were implemented as follows: 5 min at 95 °C; 40 cycles of 10 s at 95 °C, 15 s at 55 °C and 20 s at 72 °C; 60 s at 95 °C, 30 s at 55 °C and 30 s at 95 °C. The Tubulin gene was used to normalize as a reference. The 2−ΔΔCt approach was carried out to calculate the relative expression of MeLEA genes. The relative expression levels of MeLEA genes in each time point was calculated according to the control and treated samples. Each sample has three replicates and three biological experiments were performed.

5. Conclusions

In conclusion, this study identified 26 LEAs from cassava and studied their classification by phylogenetic, protein motif, and gene structure analyses. Chromosomal location and duplication event analysis revealed that 26 MeLEAs were distributed in 10 chromosomes and 11 LEAs were paralogues which were subjected to purifying selection. Transcriptomic analyses revealed the tissue expression and drought response diversity of MeLEAs in wild species and cultivated varieties. Several MeLEA genes were observed to respond to multiple abiotic stresses, and H2O2 and ABA signaling. This systematic research will provide a solid foundation for understanding the function of LEA genes and LEAs-mediated abiotic stress response in cassava.

Supplementary Materials

The following are available online. Table S1. Characteristics of LEAs in cassava; Table S2. The Ka/Ks ratios of duplicated LEA genes in cassava; Table S3. The expression profiles of the cassava LEA genes in different tissues; Table S4. The expression profiles (log2-based fold changes) of the cassava LEA genes after drought treatment; Table S5. Primers used in qRT-PCR analysis.

Author Contributions

Conceptualization: W.H., J.G., and G.H.; Methodology: C.W.; Software: C.W.; Validation: C.W., and W.H.; Formal Analysis: C.W., Y.Y., W.T., and Z.D.; Investigation: C.W., Y.Y., W.T., and Z.D.; Resources: W.H.; Data Curation: C.W. and W.H.; Writing—Original Draft Preparation: C.W.; Writing—Review and Editing: W.H.; Visualization, J.G. and G.H; Supervision: G.H.; Project Administration: J.G. and G.H.; Funding Acquisition: W.H. and J.G.

Funding

This research was funded by the Key Research and Development Project of Hainan Province (ZDYF2018220), the National Natural Science Foundation of P. R. China (31771859), the Natural Science Foundation of Hainan Province (317255), the Central Public-Interest Scientific Institution Basal Research Fund for Chinese Academy of Tropical Agricultural Sciences (1630052016005, 1630052016006, 1630052017021), the Central Public-Interest Scientific Institution Basal Research Fund for Innovative Research Team Program of CATAS (17CXTD-28, 1630052017017), and the earmarked fund for Modern Agro-industry Technology Research System (CARS-11).

Acknowledgments

We thank Wenquan Wang for supplying plant materials.

Conflicts of Interest

The authors declare no conflict of interest.

References

  1. Dure, L.; Greenway, S.C.; Galau, G.A. Developmental biochemistry of cottonseed embryogenesis and germination: Changing messenger ribonucleic acid populations as shown by in vitro and in vivo protein synthesis. Biochemistry 1981, 20, 4162–4168. [Google Scholar] [CrossRef] [PubMed]
  2. Wang, X.; Zhu, H.; Jin, G.; Liu, H.; Wu, W.; Zhu, J. Genome-scale identification and analysis of LEA genes in rice (Oryza sativa L.). Plant Sci. 2007, 172, 414–420. [Google Scholar] [CrossRef]
  3. Hundertmark, M.; Hincha, D.K. LEA (Late Embryogenesis Abundant) proteins and their encoding genes in Arabidopsis thaliana. BMC Genom. 2008, 9, 118. [Google Scholar] [CrossRef] [PubMed]
  4. Amara, I.; Odena, A.; Oliveira, E.; Moreno, A.; Masmoudi, K.; Pagès, M.; Goday, A. Insights into Maize LEA Proteins: From Proteomics to Functional Approaches. Plant Cell Physiol. 2012, 53, 312–329. [Google Scholar] [CrossRef] [PubMed]
  5. Choi, D.W.; Zhu, B.; Close, T.J. The barley (Hordeum vulgare L.) dehydrin multigene family: Sequences, allele types, chromosome assignments, and expression characteristics of 11 Dhn genes of cv Dicktoo. Theor. Appl. Genet. 1999, 98, 1234–1247. [Google Scholar] [CrossRef]
  6. Sasaki, K.; Christov, N.K.; Tsuda, S.; Imai, R. Identification of a novel LEA protein involved in freezing tolerance in wheat. Plant Cell Physiol. 2014, 55, 136–147. [Google Scholar] [CrossRef] [PubMed]
  7. Prietodapena, P.; Almoguera, C.; Rojas, A.; Jordano, J. Seed-specific expression patterns and regulation by ABI3 of an unusual late embryogenesis-abundant gene in sunflower. Plant Mol. Biol. 1999, 39, 615–627. [Google Scholar] [CrossRef] [Green Version]
  8. Liang, Y.; Xiong, Z.; Zheng, J.; Xu, D.; Zhu, Z.; Xiang, J.; Gan, J.; Raboanatahiry, N.; Yin, Y.; Li, M. Genome-wide identification, structural analysis and new insights into late embryogenesis abundant (LEA) gene family formation pattern in Brassica napus. Sci. Rep. 2016, 6, 24265. [Google Scholar] [CrossRef] [PubMed]
  9. Gal, T.Z.; Glazer, I.; Koltai, H. An LEA group 3 family member is involved in survival of C. elegans during exposure to stress. FEBS Lett. 2004, 577, 21–26. [Google Scholar] [CrossRef] [PubMed]
  10. Kikawada, T.; Nakahara, Y.; Kanamori, Y.; Iwata, K.; Watanabe, M.; McGee, B.; Tunnacliffe, A.; Okuda, T. Dehydration-induced expression of LEA proteins in an anhydrobiotic chironomid. Biochem. Biophys. Res. Commun. 2006, 348, 56–61. [Google Scholar] [CrossRef] [PubMed]
  11. He, H.; Fu, J.; Stewart, M.; Ward, S.J.; Drew, J. The research progresses in Lea proteins of seeds. Plant Physiol. Commun. 1996, 32, 241–246. [Google Scholar]
  12. Garay-Arroyo, A.; Colmenero-Flores, J.M.; Garciarrubio, A.; Covarrubias, A.A. Highly Hydrophilic Proteins in Prokaryotes and Eukaryotes Are Common during Conditions of Water Deficit. J. Biol. Chem. 2000, 275, 5668–5674. [Google Scholar] [CrossRef] [PubMed]
  13. Finn, R.D.; Bateman, A.; Clements, J.; Coggill, P.; Eberhardt, R.Y.; Eddy, S.R.; Heger, A.; Hetherington, K.; Holm, L.; Mistry, J.; et al. Pfam: The protein families database. Nucleic Acids Res. 2014, 42, D222–D230. [Google Scholar] [CrossRef] [PubMed]
  14. Candat, A.; Paszkiewicz, G.; Neveu, M.; Gautier, R.; Logan, D.C.; Avelange-Macherel, M.H.; Macherel, D. The Ubiquitous Distribution of Late Embryogenesis Abundant Proteins across Cell Compartments in Arabidopsis Offers Tailored Protection against Abiotic Stress. Plant Cell 2014, 26, 3148–3166. [Google Scholar] [CrossRef] [PubMed] [Green Version]
  15. Goyal, K.; Walton, L.; Tunnacliffe, A. LEA proteins prevent protein aggregation due to water stress. Biochem. J. 2005, 388, 151–157. [Google Scholar] [CrossRef] [PubMed]
  16. Chakrabortee, S.; Tripathi, R.; Watson, M.; Schierle, G.S.; Kurniawan, D.P.; Kaminski, C.F.; Wise, M.J.; Tunnacliffe, A. Intrinsically disordered proteins as molecular shields. Mol. BioSyst. 2012, 8, 210–219. [Google Scholar] [CrossRef] [PubMed]
  17. Krüger, C.; Berkowitz, O.; Stephan, U.W.; Hell, R.A. Metal-binding Member of the Late Embryogenesis Abundant Protein Family Transports Iron in the Phloem of Ricinus communis L. J. Biol. Chem. 2002, 277, 25062–25069. [Google Scholar] [CrossRef] [PubMed]
  18. Shimizu, T.; Kanamori, Y.; Furuki, T.; Kikawada, T.; Okuda, T.; Takahashi, T.; Mihara, H.; Sakurai, M. Desiccation-induced structuralization and glass formation of group 3 late embryogenesis abundant protein model peptides. Biochemistry 2010, 49, 1093–1104. [Google Scholar] [CrossRef] [PubMed]
  19. Duan, J.; Cai, W. OsLEA3-2, an Abiotic Stress Induced Gene of Rice Plays a Key Role in Salt and Drought Tolerance. PLoS ONE 2012, 7, e45117. [Google Scholar] [CrossRef] [PubMed]
  20. Liu, Y.; Liang, J.; Sun, L.; Yang, X.; Li, D. Group 3 LEA Protein, ZmLEA3, Is Involved in Protection from Low Temperature Stress. Front. Plant Sci. 2016, 7, 1011. [Google Scholar] [CrossRef] [PubMed]
  21. Liu, Y.; Li, W.; Xin, X.; Sun, L.P.; Pan, J.W.; Kong, X.P.; Zhang, M.Y.; Li, D.E. ZmLEA3, a Multifunctional Group 3 LEA Protein from Maize (Zea mays L.), is Involved in Biotic and Abiotic Stresses. Plant Cell Physiol. 2013, 54, 944–959. [Google Scholar] [CrossRef] [PubMed]
  22. Hara, M.; Terashima, S.; Fukaya, T.; Kuboi, T. Enhancement of cold tolerance and inhibition of lipid peroxidation by citrus dehydrin in transgenic tobacco. Planta 2003, 217, 290–298. [Google Scholar] [CrossRef] [PubMed]
  23. Houde, M.; Dallaire, S.; Dong, D.N.; Sarhan, F. Overexpression of the acidic dehydrin WCOR410 improves freezing tolerance in transgenic strawberry. Plant Biotechnol. J. 2004, 2, 381–387. [Google Scholar] [CrossRef] [PubMed]
  24. Wang, M.; Li, P.; Li, C.; Pan, Y.; Jiang, X.; Zhu, D.; Zhao, Q.; Yu, J. SiLEA14, a novel a typical LEA protein, confers abiotic stress resistance in foxtail millet. BMC Plant Biol. 2014, 14, 290. [Google Scholar] [CrossRef] [PubMed]
  25. Liang, J.; Zhou, M.; Zhou, X.; Jin, Y.; Xu, M.; Lin, J. JcLEA, a Novel LEA-Like Protein from Jatropha curcas, Confers a High Level of Tolerance to Dehydration and Salinity in Arabidopsis thaliana. PLoS ONE 2013, 8, e83056. [Google Scholar] [CrossRef] [PubMed]
  26. Dalal, M.; Tayal, D.; Chinnusamy, V.; Bansal, K.C. Abiotic stress and ABA-inducible Group 4 LEA from Brassica napus plays a key role in salt and drought tolerance. J. Biotechnol. 2009, 139, 137–145. [Google Scholar] [CrossRef] [PubMed]
  27. Huang, Z.; Zhong, X.; He, J.; Jin, S.; Guo, H.; Yu, X.; Zhou, Y.; Li, X.; Ma, M.; Chen, Q.; et al. Genome-Wide Identification, Characterization, and Stress-Responsive Expression Profiling of Genes Encoding LEA (Late Embryogenesis Abundant) Proteins in Moso Bamboo (Phyllostachys edulis). PLoS ONE 2016, 11, e0165953. [Google Scholar] [CrossRef] [PubMed]
  28. Filiz, E.; Ozyigit, I.I.; Tombuloglu, H.; Koc, I. In silico comparative analysis of lea (late embryogenesis abundant) proteins in brachypodium. Plant Omics 2013, 6, 433–440. [Google Scholar]
  29. Lan, T.; Gao, J.; Zeng, Q. Genome-wide analysis of the lea (late embryogenesis abundant) protein gene family in Populous trichocarpa. Tree Genet. Genomes 2013, 9, 253–264. [Google Scholar] [CrossRef]
  30. Oliveira, E.J.; Santana, F.A.; Oliveira, L.A.; Santos, V.S. Genetic parameters and prediction of genotypic values for root quality traits in cassava using REML/BLUP. Genet. Mol. Res. 2014, 13, 6683–6700. [Google Scholar] [CrossRef] [PubMed]
  31. Lebot, V.; Champagne, A.; Malapa, R.; Shiley, D. NIR Determination of Major Constituents in Tropical Root and Tuber Crop Flours. J. Agric. Food Chem. 2009, 57, 10539–10547. [Google Scholar] [CrossRef] [PubMed]
  32. Maran, J.P.; Sivakumar, V.; Thirugnanasambandham, K.; Sridhar, R. Degradation behavior of biocomposites based on cassava starch buried under indoor soil conditions. Carbohydr. Polym. 2014, 101, 20–28. [Google Scholar] [CrossRef] [PubMed]
  33. Fu, L.; Ding, Z.; Han, B.; Hu, W.; Li, Y.; Zhang, J. Physiological Investigation and Transcriptome Analysis of Polyethylene Glycol (PEG)-Induced Dehydration Stress in Cassava. Int. J. Mol. Sci. 2016, 17, 283. [Google Scholar] [CrossRef] [PubMed]
  34. Zeng, C.; Ding, Z.; Zhou, F.; Zhou, Y.; Yang, R.; Yang, Z.; Wang, W.; Peng, M. The Discrepant and Similar Responses of Genome-Wide Transcriptional Profiles between Drought and Cold Stresses in Cassava. Int. J. Mol. Sci. 2017, 18, 2668. [Google Scholar] [CrossRef] [PubMed]
  35. Li, S.; Yu, X.; Lei, N.; Cheng, Z.; Zhao, P.; He, Y.; Wang, W.; Peng, M. Genome-wide identification and functional prediction of cold and/or drought-responsive lncRNAs in cassava. Sci. Rep. 2017, 7, 45981. [Google Scholar] [CrossRef] [PubMed]
  36. Hu, W.; Yan, Y.; Tie, W.; Ding, Z.; Wu, C.; Ding, X.; Wang, W.; Xia, Z.; Guo, J.; Peng, M. Genome-Wide Analyses of Calcium Sensors Reveal Their Involvement in Drought Stress Response and Storage Roots Deterioration after Harvest in Cassava. Genes 2018, 9, 221. [Google Scholar] [CrossRef] [PubMed]
  37. Ye, J.; Yang, H.; Shi, H.; Wei, Y.; Tie, W.; Ding, Z.; Yan, Y.; Luo, Y.; Xia, Z.; Wang, W.; et al. The MAPKKK gene family in cassava: Genome-wide identification and expression analysis against drought stress. Sci. Rep. 2017, 7, 14939. [Google Scholar] [CrossRef] [PubMed]
  38. Ding, Z.; Fu, L.; Yan, Y.; Tie, W.; Xia, Z.; Wang, W.; Peng, M.; Hu, W.; Zhang, J. Genome-wide characterization and expression profiling of HD-Zip gene family related to abiotic stress in cassava. PLoS ONE 2017, 12, e0173043. [Google Scholar] [CrossRef] [PubMed]
  39. Hu, W.; Yang, H.; Yan, Y.; Wei, Y.; Tie, W.; Ding, Z.; Zuo, J.; Peng, M.; Li, K. Genome-wide characterization and analysis of bZIP transcription factor gene family related to abiotic stress in cassava. Sci. Rep. 2016, 6, 22783. [Google Scholar] [CrossRef] [PubMed]
  40. Freeling, M. Bias in Plant Gene Content Following Different Sorts of Duplication: Tandem, Whole-Genome, Segmental, or by Transposition. Annu. Rev. Plant Biol. 2009, 60, 433–453. [Google Scholar] [CrossRef] [PubMed]
  41. Xu, G.; Guo, C.; Shan, H.; Kong, H. Divergence of duplicate genes in exon–intron structure. Proc. Natl. Acad. Sci. USA 2012, 109, 1187–1192. [Google Scholar] [CrossRef] [PubMed]
  42. Lynch, M.; Conery, J.S. The evolutionary fate and consequences of duplicate genes. Science 2000, 290, 1151–1155. [Google Scholar] [CrossRef] [PubMed]
  43. Pedrosa, A.M.; Martins, C.P.; Gonçalves, L.P.; Costa, M.G. Late Embryogenesis Abundant (LEA) Constitutes a Large and Diverse Family of Proteins Involved in Development and Abiotic Stress Responses in Sweet Orange (Citrus sinensis L. Osb.). PLoS ONE 2015, 10, e0145785. [Google Scholar] [CrossRef] [PubMed]
  44. Wang, W.; Feng, B.; Xiao, J.; Xia, Z.; Zhou, X.; Li, P.; Zhang, W.; Wang, Y.; Møller, B.L.; Zhang, P.; et al. Cassava genome from a wild ancestor to cultivated varieties. Nat. Commun. 2014, 5, 5110. [Google Scholar] [CrossRef] [PubMed]
  45. Hu, W.; Wei, Y.; Xia, Z.; Yan, Y.; Hou, X.; Zou, M.; Lu, C.; Wang, W.; Peng, M. Genome-Wide Identification and Expression Analysis of the NAC Transcription Factor Family in Cassava. PLoS ONE 2015, 10, e0136993. [Google Scholar] [CrossRef] [PubMed]
  46. Hu, W.; Xia, Z.; Yan, Y.; Ding, Z.; Tie, W.; Wang, L.; Zou, M.; Wei, Y.; Lu, C.; Hou, X.; et al. Genome-wide gene phylogeny of CIPK family in cassava and expression analysis of partial drought-induced genes. Front. Plant Sci. 2015, 6, 914. [Google Scholar] [CrossRef] [PubMed]
  47. Lamesch, P.; Berardini, T.Z.; Li, D.; Swarbreck, D.; Wilks, C.; Sasidharan, R.; Muller, R.; Dreher, K.; Alexander, D.L.; Garcia-Hernandez, M.; et al. The Arabidopsis Information Resource (TAIR): Improved gene annotation and new tools. Nucleic Acids Res. 2012, 40, D1202–D1210. [Google Scholar] [CrossRef] [PubMed]
  48. Kawahara, Y.; de la Bastide, M.; Hamilton, J.P.; Kanamori, H.; McCombie, W.R.; Ouyang, S.; Schwartz, D.C.; Tanaka, T.; Wu, J.; Zhou, S.; et al. Improvement of the Oryza sativa Nipponbare reference genome using next generation sequence and optical map data. Rice 2013, 6, 4. [Google Scholar] [CrossRef] [PubMed]
  49. Finn, R.D.; Clements, J.; Eddy, S.R. HMMER web server: Interactive sequence similarity searching. Nucleic Acids Res. 2011, 39, W29–W37. [Google Scholar] [CrossRef] [PubMed]
  50. Marchler-Bauer, A.; Derbyshire, M.K.; Gonzales, N.R.; Lu, S.; Chitsaz, F.; Geer, L.Y.; Geer, R.C.; He, J.; Gwadz, M.; Hurwitz, D.I.; et al. CDD: NCBI’s conserved domain database. Nucleic Acids Res. 2015, 43, D222–D226. [Google Scholar] [CrossRef] [PubMed]
  51. Letunic, I.; Copley, R.R.; Schmidt, S.; Ciccarelli, F.D.; Doerks, T.; Schultz, J.; Ponting, C.P.C.; Bork, P. SMART 4.0: Towards genomic data integration. Nucleic Acids Res. 2004, 32, D142–D144. [Google Scholar] [CrossRef] [PubMed]
  52. Basic Local Alignment Search Tool. Available online: https://blast.ncbi.nlm.nih.gov/Blast.cgi (accessed on 25 November 2017).
  53. Larkin, M.A.; Blackshields, G.; Brown, N.P.; Chenna, R.; McGettigan, P.A.; McWilliam, H.; Valentin, F.; Wallace, I.M.; Wilm, A.; Lopez, R.; et al. Clustal W and Clustal X version 2.0. Bioinformatics 2007, 23, 2947–2948. [Google Scholar] [CrossRef] [PubMed]
  54. Tamura, K.; Peterson, D.; Peterson, N.; Stecher, G.; Nei, M.; Kumar, S. MEGA5: Molecular Evolutionary Genetics Analysis Using Maximum Likelihood, Evolutionary Distance, and Maximum Parsimony Methods. Mol. Biol. Evol. 2011, 28, 2731–2739. [Google Scholar] [CrossRef] [PubMed]
  55. Gasteiger, E.; Gattiker, A.; Hoogland, C.; Ivanyi, I.; Appel, R.D.; Bairoch, A. ExPASy: The proteomics server for in-depth protein knowledge and analysis. Nucleic Acids Res. 2003, 31, 3784–3788. [Google Scholar] [CrossRef] [PubMed]
  56. Burland, T.G. DNASTAR’s Lasergene sequence analysis software. Methods Mol. Biol. 2000, 132, 71–91. [Google Scholar] [PubMed]
  57. Brown, P.; Baxter, L.; Hickman, R.; Beynon, J.; Moore, J.D.; Ott, S. MEME-LaB: Motif analysis in clusters. Bioinformatics 2013, 29, 1696–1697. [Google Scholar] [CrossRef] [PubMed]
  58. Mulder, N.; Apweiler, R. InterPro and InterProScan: Tools for protein sequence classification and comparison. Methods Mol. Biol. 2007, 396, 59–70. [Google Scholar] [CrossRef] [PubMed]
  59. Hu, B.; Jin, J.P.; Guo, A.Y.; Zhang, H.; Luo, J.C.; Gao, G. GSDS 2.0: An upgraded gene feature visualization server. Bioinformatics 2015, 31, 1296–1297. [Google Scholar] [CrossRef] [PubMed]
  60. Wang, M.; Yue, H.; Feng, K.; Deng, P.; Song, W.; Nie, X. Genome-wide identification, phylogeny and expressional profiles of mitogen activated protein kinase kinase kinase (MAPKKK) gene family in bread wheat (Triticum aestivum L.). BMC Genom. 2016, 17, 668. [Google Scholar] [CrossRef] [PubMed]
  61. Gu, Z.; Cavalcanti, A.; Chen, F.; Bouman, P.; Li, W. Extent of gene duplication in the genomes of Drosophila, nematode, and yeast. Mol. Biol. Evol. 2002, 19, 256–262. [Google Scholar] [CrossRef] [PubMed]
  62. Librado, P.; Rozas, J. DnaSP v5: A software for comprehensive analysis of DNA polymorphism data. Bioinformatics 2009, 25, 1451–1452. [Google Scholar] [CrossRef] [PubMed]
  63. Nekrutenko, A.; Makova, K.D.; Li, W. The KA/KS ratio test for assessing the protein-coding potential of genomic regions: An empirical and simulation study. Genome Res. 2002, 12, 198–202. [Google Scholar] [CrossRef] [PubMed]
  64. Wang, Y.; Wang, X.; Tang, H.; Tan, X.; Ficklin, S.P.; Feltus, F.A.; Paterson, A.H. Modes of Gene Duplication Contribute Differently to Genetic Novelty and Redundancy, but Show Parallels across Divergent Angiosperms. PLoS ONE 2011, 6, e28150. [Google Scholar] [CrossRef] [PubMed]
  65. FASTX-Toolkit. FASTQ/A Short-Reads Pre-Processing Tools. Available online: http://hannonlab.cshl.edu/fastx_toolkit/index.html (accessed on 20 December 2017).
  66. FastQC: A Quality Control Tool for High Throughput Sequence Data. Available online: http://www.bioinformatics.babraham.ac.uk/projects/fastqc (accessed on 29 December 2017).
  67. Pollier, J.; Rombauts, S.; Goossens, A. Analysis of RNA-Seq data with TopHat and Cufflinks for genome-wide expression analysis of jasmonate-treated plants and plant cultures. Methods Mol. Biol. 2013, 1011, 305–315. [Google Scholar] [CrossRef] [PubMed]
  68. Trapnell, C.; Roberts, A.; Goff, L.; Pertea, G.; Kim, D.; Kelley, D.R.; Pimentel, H.; Salzberg, S.L.; Rinn, J.L.; Pachter, L. Differential gene and transcript expression analysis of RNA-seq experiments with TopHat and Cufflinks. Nat. Protoc. 2012, 7, 562–578. [Google Scholar] [CrossRef] [PubMed]
Sample Availability: Samples of the compounds are available from the authors.
Figure 1. Evolutionary analysis of the LEAs from cassava, rice, and Arabidopsis. A total of 26 LEAs from cassava, 37 LEAs from rice and 51 LEAs from Arabidopsis were used to create the neighbour-joining (NJ) tree with 1000 bootstraps. Red circle, LEAs in cassava; Green square, LEAs in Arabidopsis; Blue triangle, LEAs in rice.
Molecules 23 01196 g001
Figure 2. The conserved motifs of the MeLEAs according to the evolutionary classification. The conserved motifs were identified by the MEME database. The coloured boxes represent conserved motifs and grey lines represent the non-conserved sequences. The representative motif of each subfamily was annotated by PFAM databases with Pfam codes.
Molecules 23 01196 g002
Figure 3. The exon-intron structure of the MeLEAs based on the evolutionary relationship. Exon-intron analysis of MeLEAs were performed with GSDS database. The back lines and the yellow boxes represent introns and exons, respectively.
Molecules 23 01196 g003
Figure 4. Distribution of the MeLEAs on chromosomes. The 26 MeLEAs were mapped to 10 chromosomes based on their chromosomal information of cassava.
Molecules 23 01196 g004
Figure 5. Segmental duplication of LEA genes in cassava. Chromosomes are illustrated in different colour in circular form using the program Circos. Segmental duplicated MeLEAs are connected by yellow lines.
Molecules 23 01196 g005
Figure 6. Expression patterns of MeLEAs in different tissues and in response to drought stress. (A) Evolutionary analysis of the LEAs from cassava; (B) Expression profiles of the MeLEAs in various tissues of Arg7 and W14. FPKM value is used to create the heat map with Mev 4.9.0 software. The color scale indicates the expression levels of MeLEAs. S, stem; L, leaf; SR, storage root. The FPKM value of the genes that was not covered in the transcriptomic datasets was set as “0”; and (C) expression profiles of the MeLEAs in leaves and roots of Arg7, SC124, and W14 after drought treatment. Log2-based fold changes was used to create the heat map with Mev 4.9.0 software. The FPKM value of the genes that were not covered in the transcriptomic datasets was set as “0”. Changes in gene expression are shown in color as the scale. L, leaf; R, root; D, drought treatment; CK, control check, showing leaf and root of cassava varieties under normal condition.
Molecules 23 01196 g006
Figure 7. Expression profiles of the MeLEAs in leaves under salt, osmotic, cold, H2O2, and ABA treatments. NTC (no treatment control) was normalized as “1”. Data are means ± SD of n = 3 biological replicates. Means denoted by the same letter do not significantly differ at p < 0.05 as determined by Duncan’s multiple range test.
Molecules 23 01196 g007

