Betulin-3,28-diphosphate. Physico-Chemical Properties and In Vitro Biological Activity Experiments

 , ,
, ,
Abstract
:
1. Introduction
2. Results and Discussion
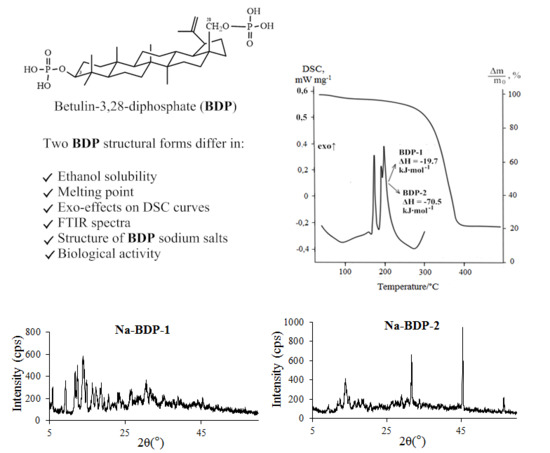
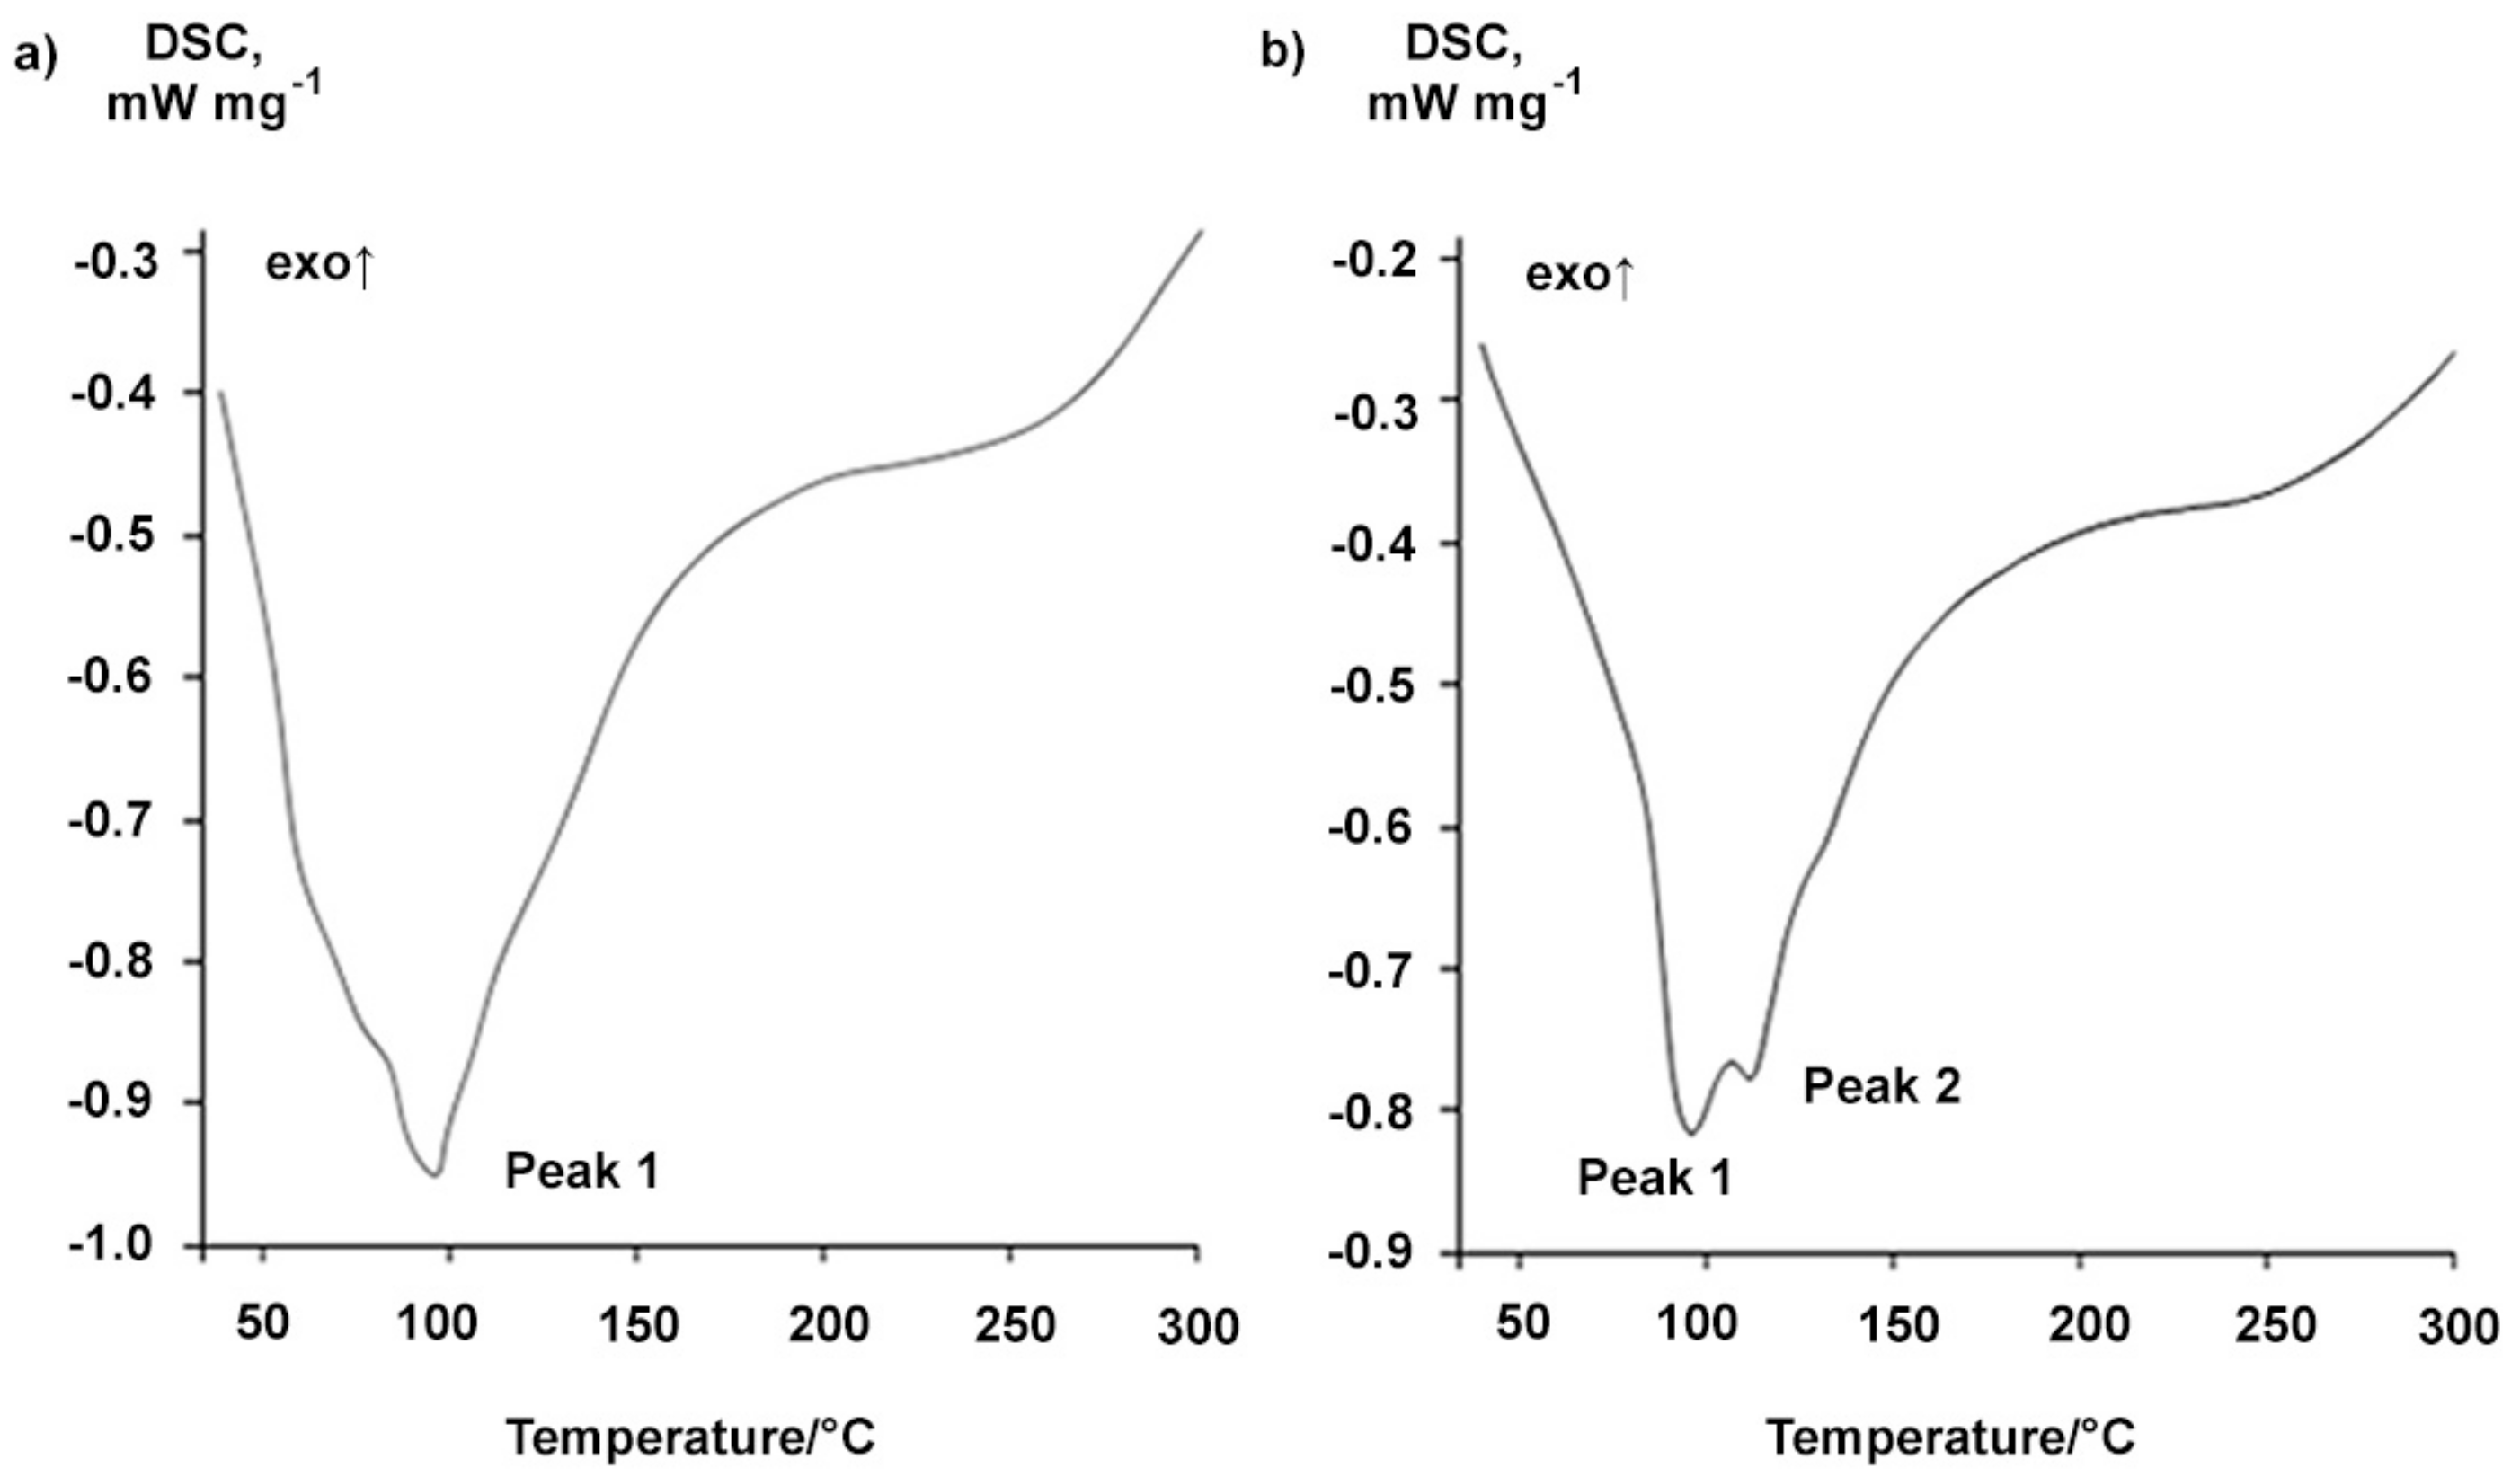
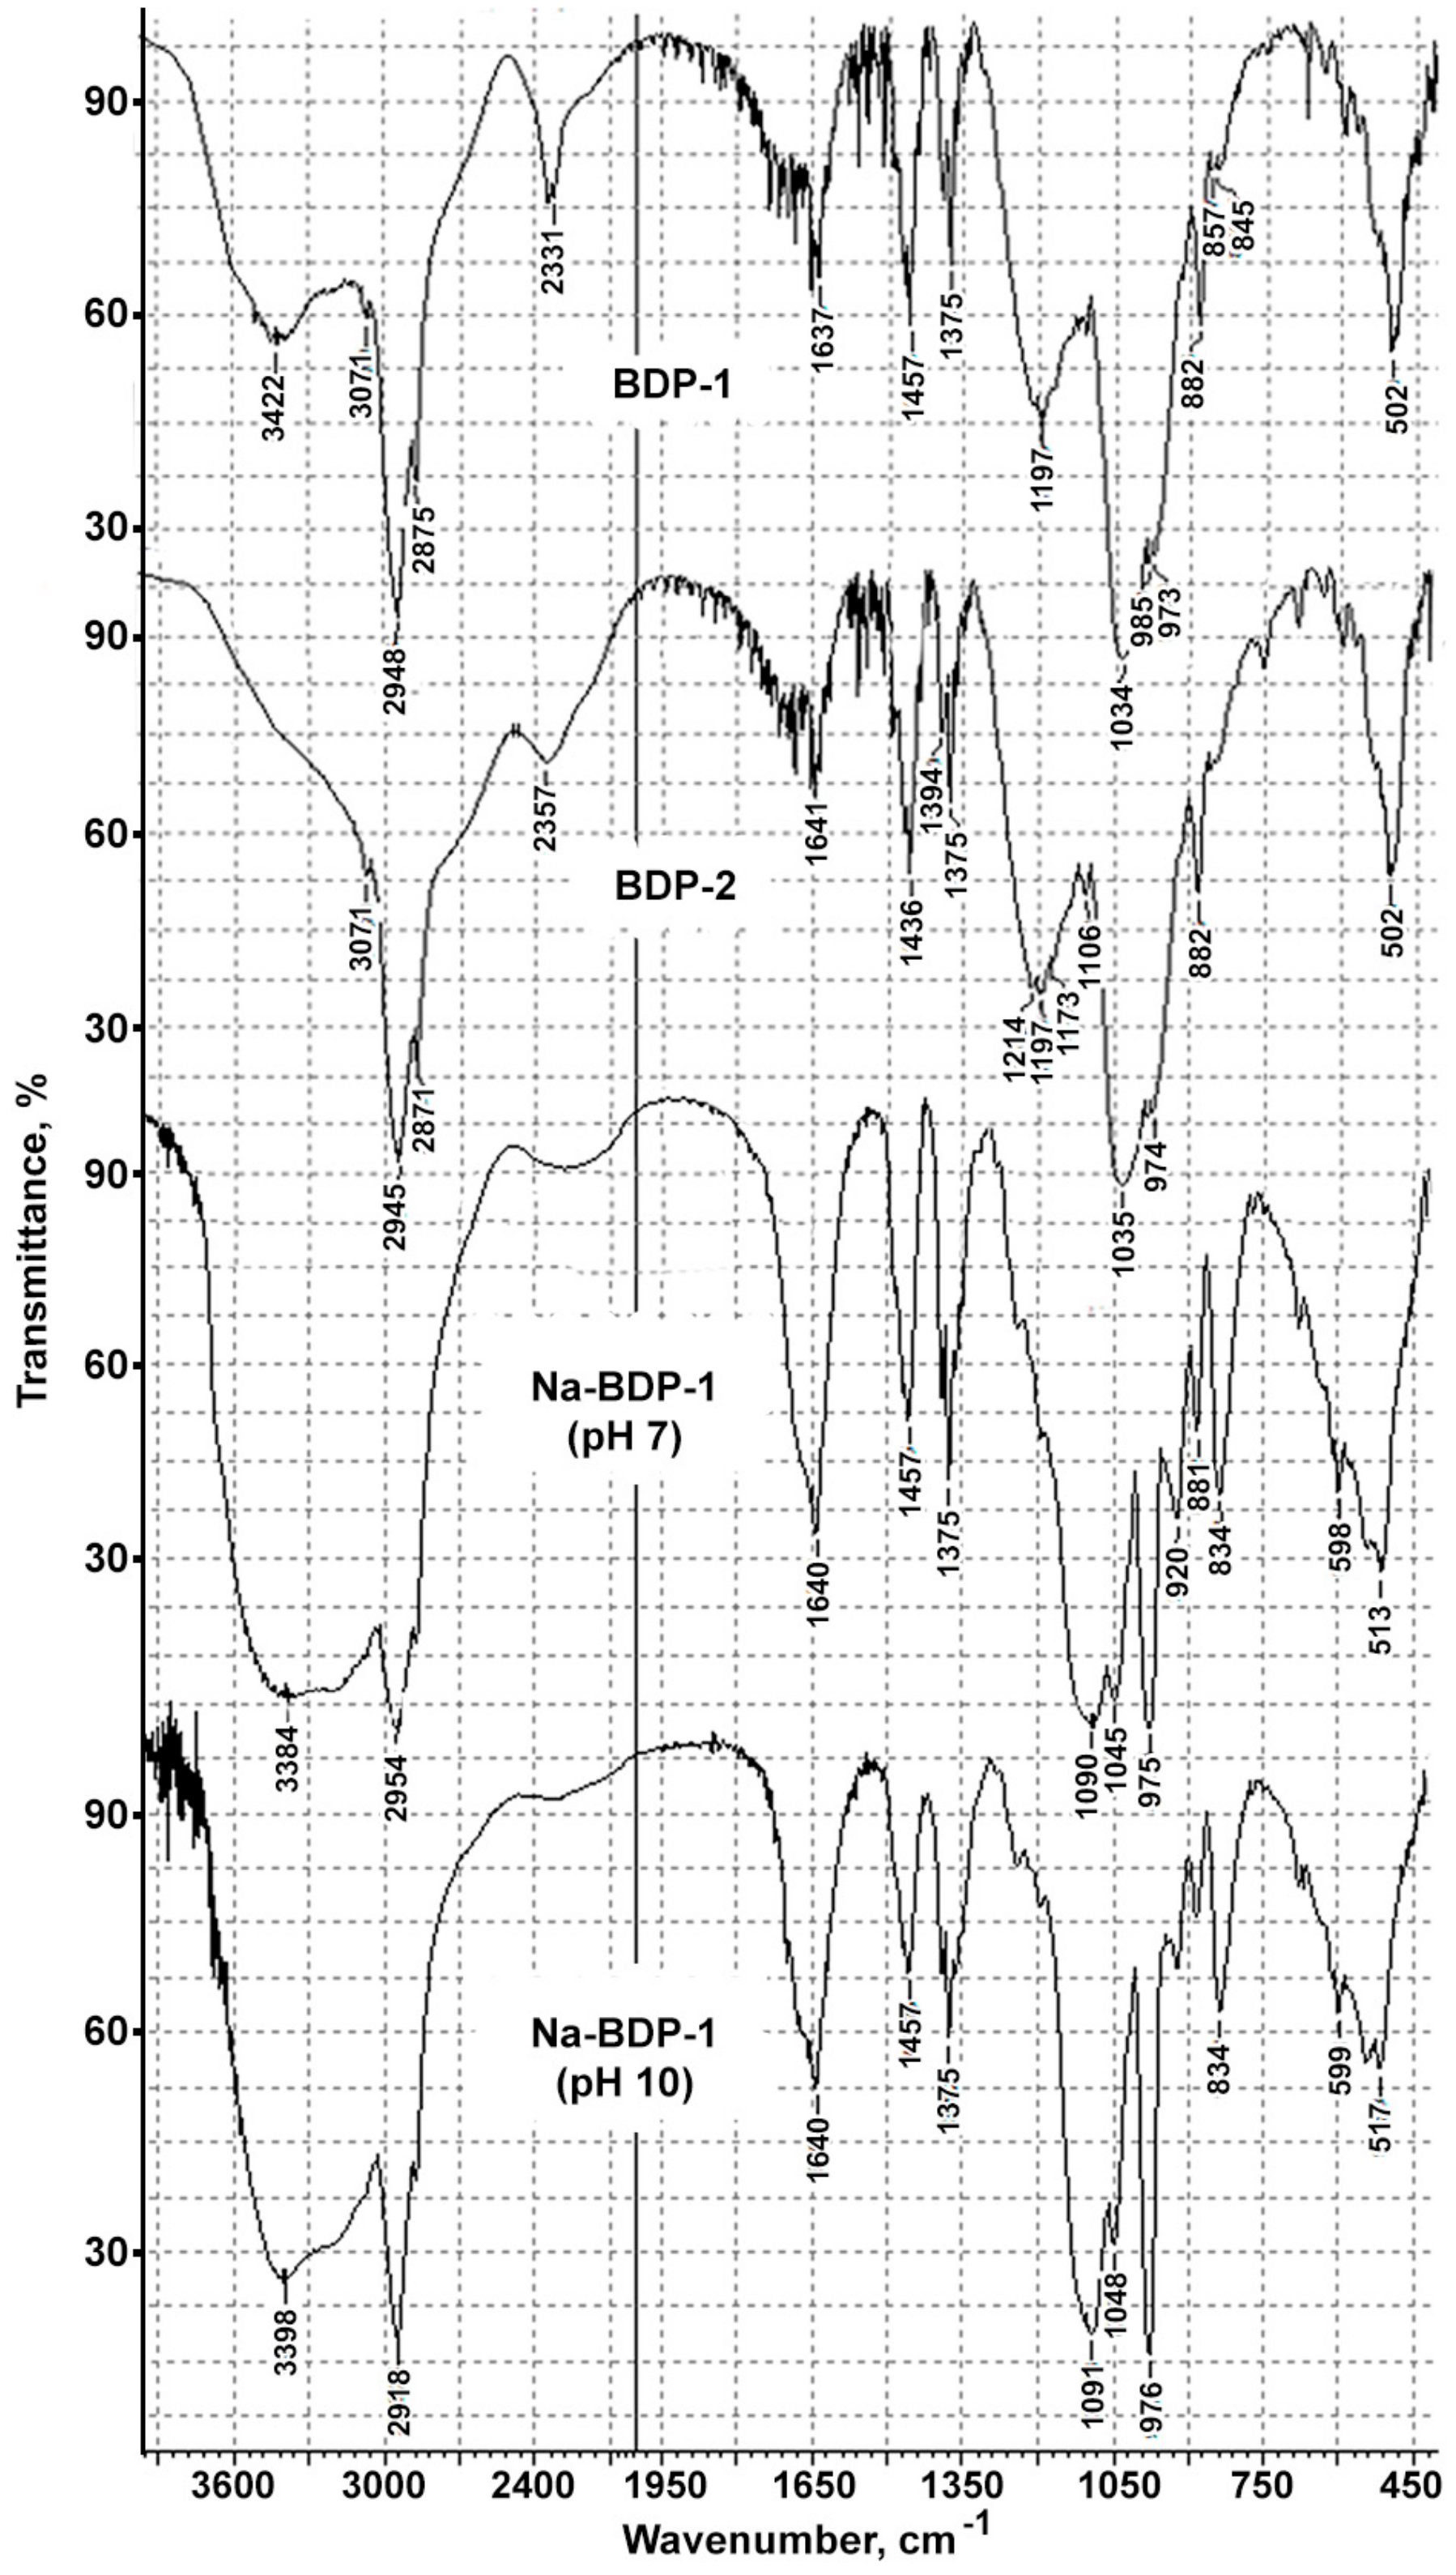
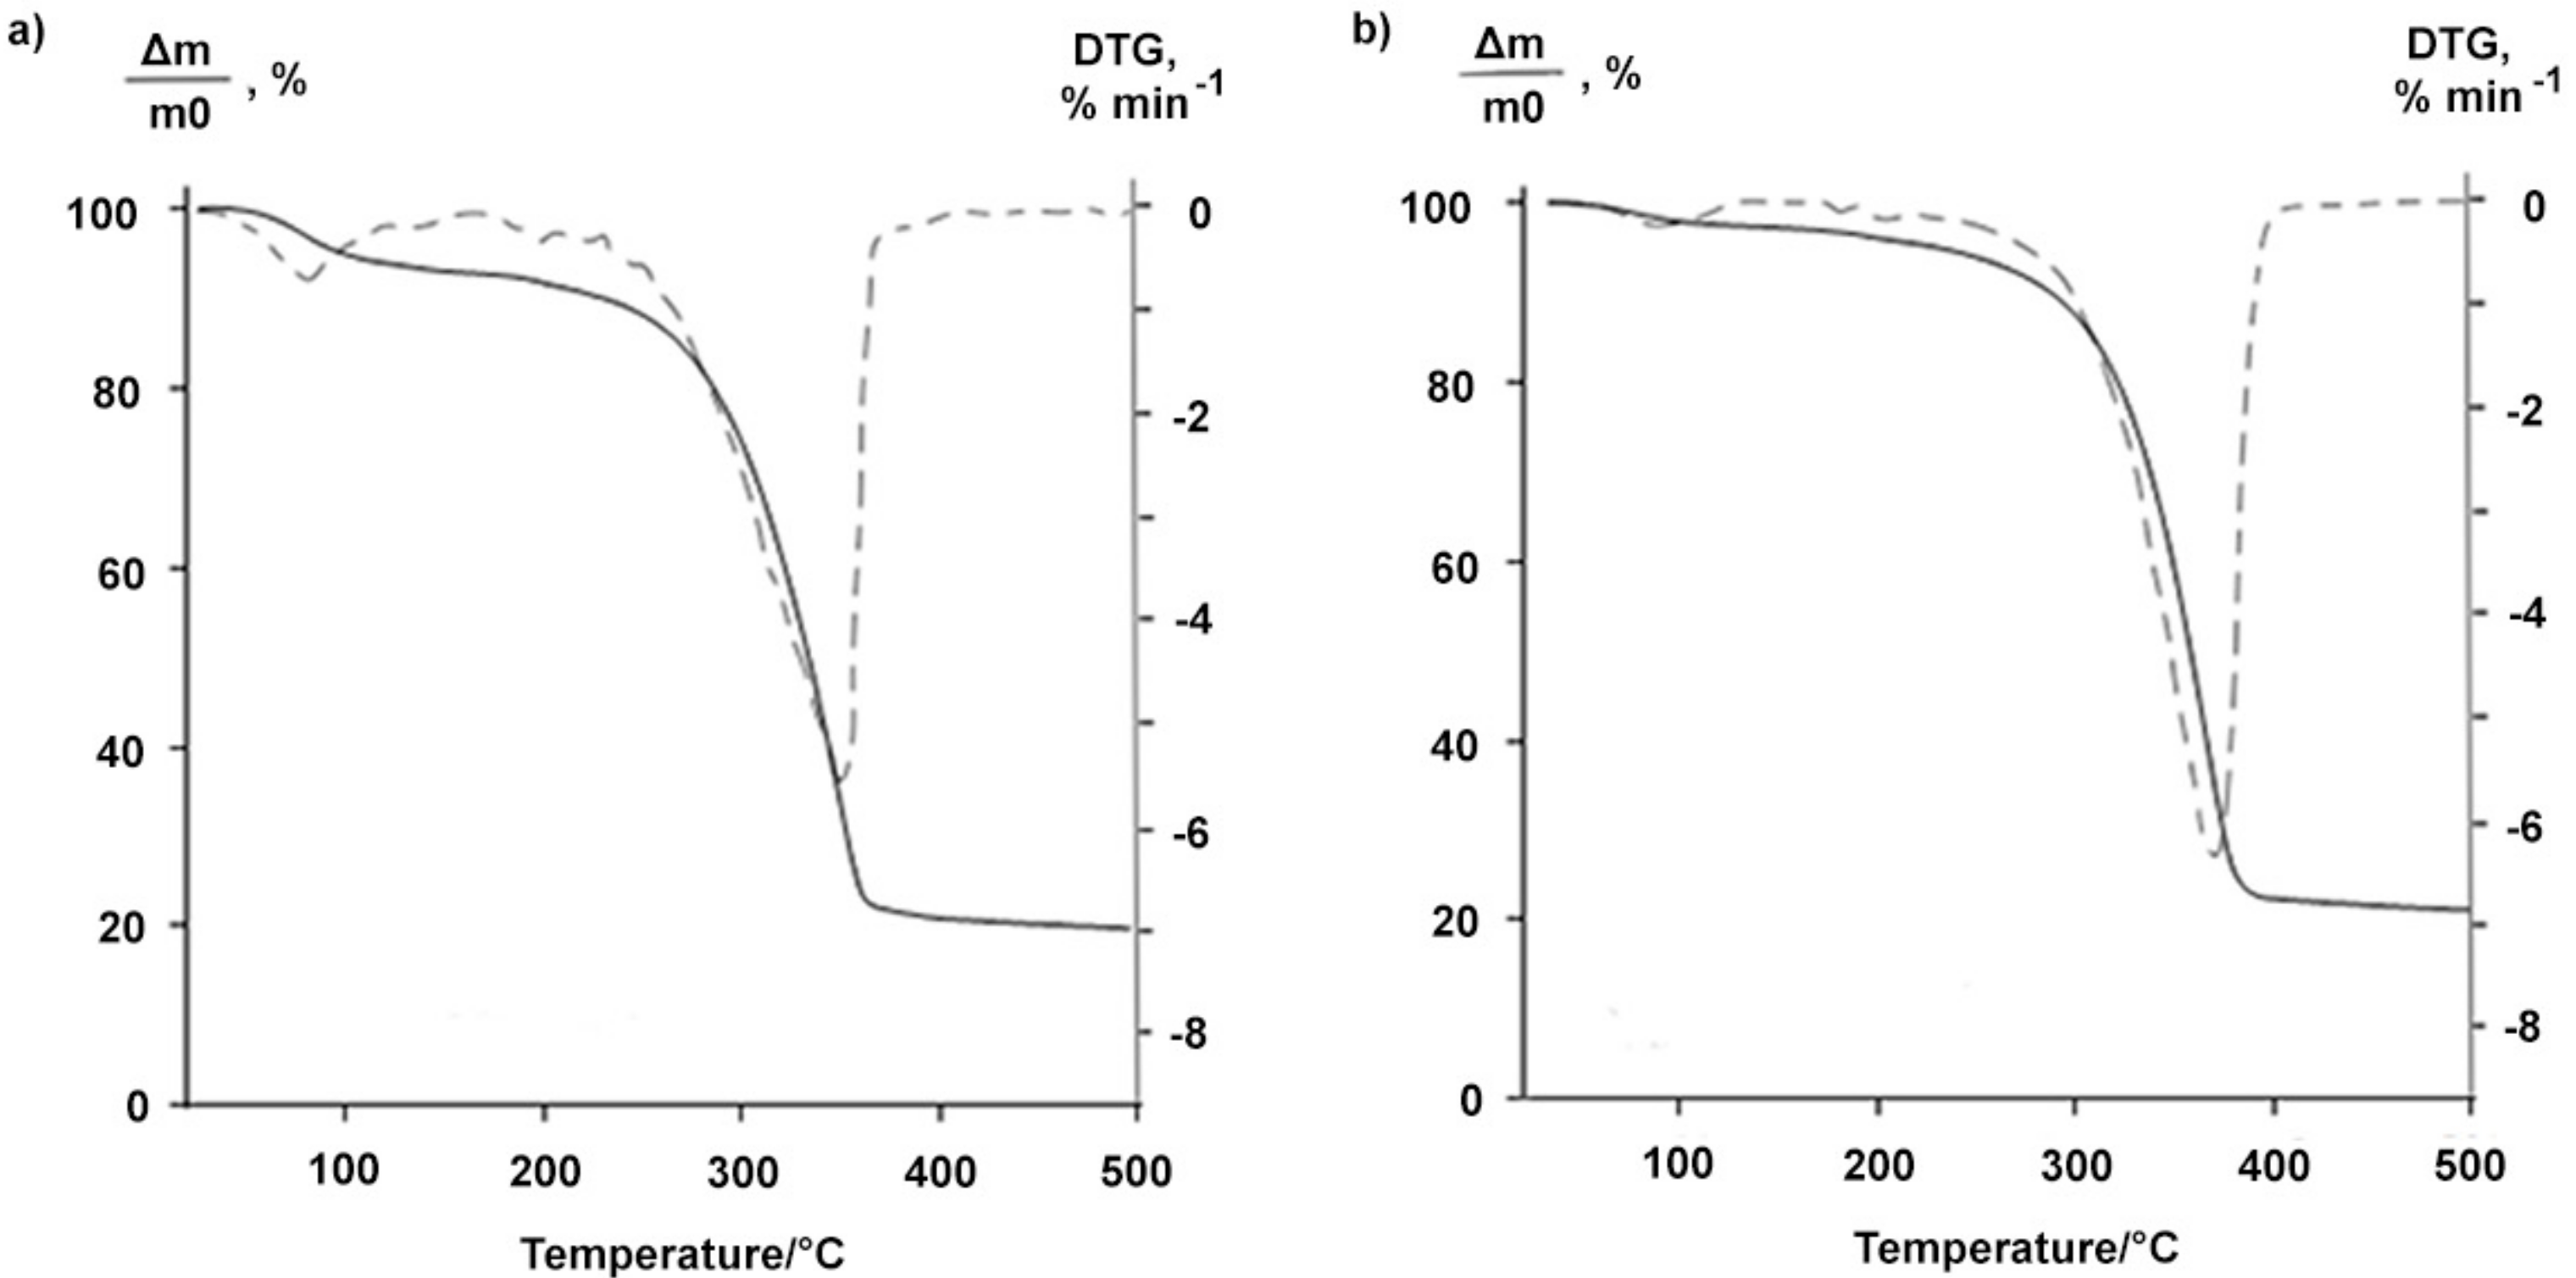
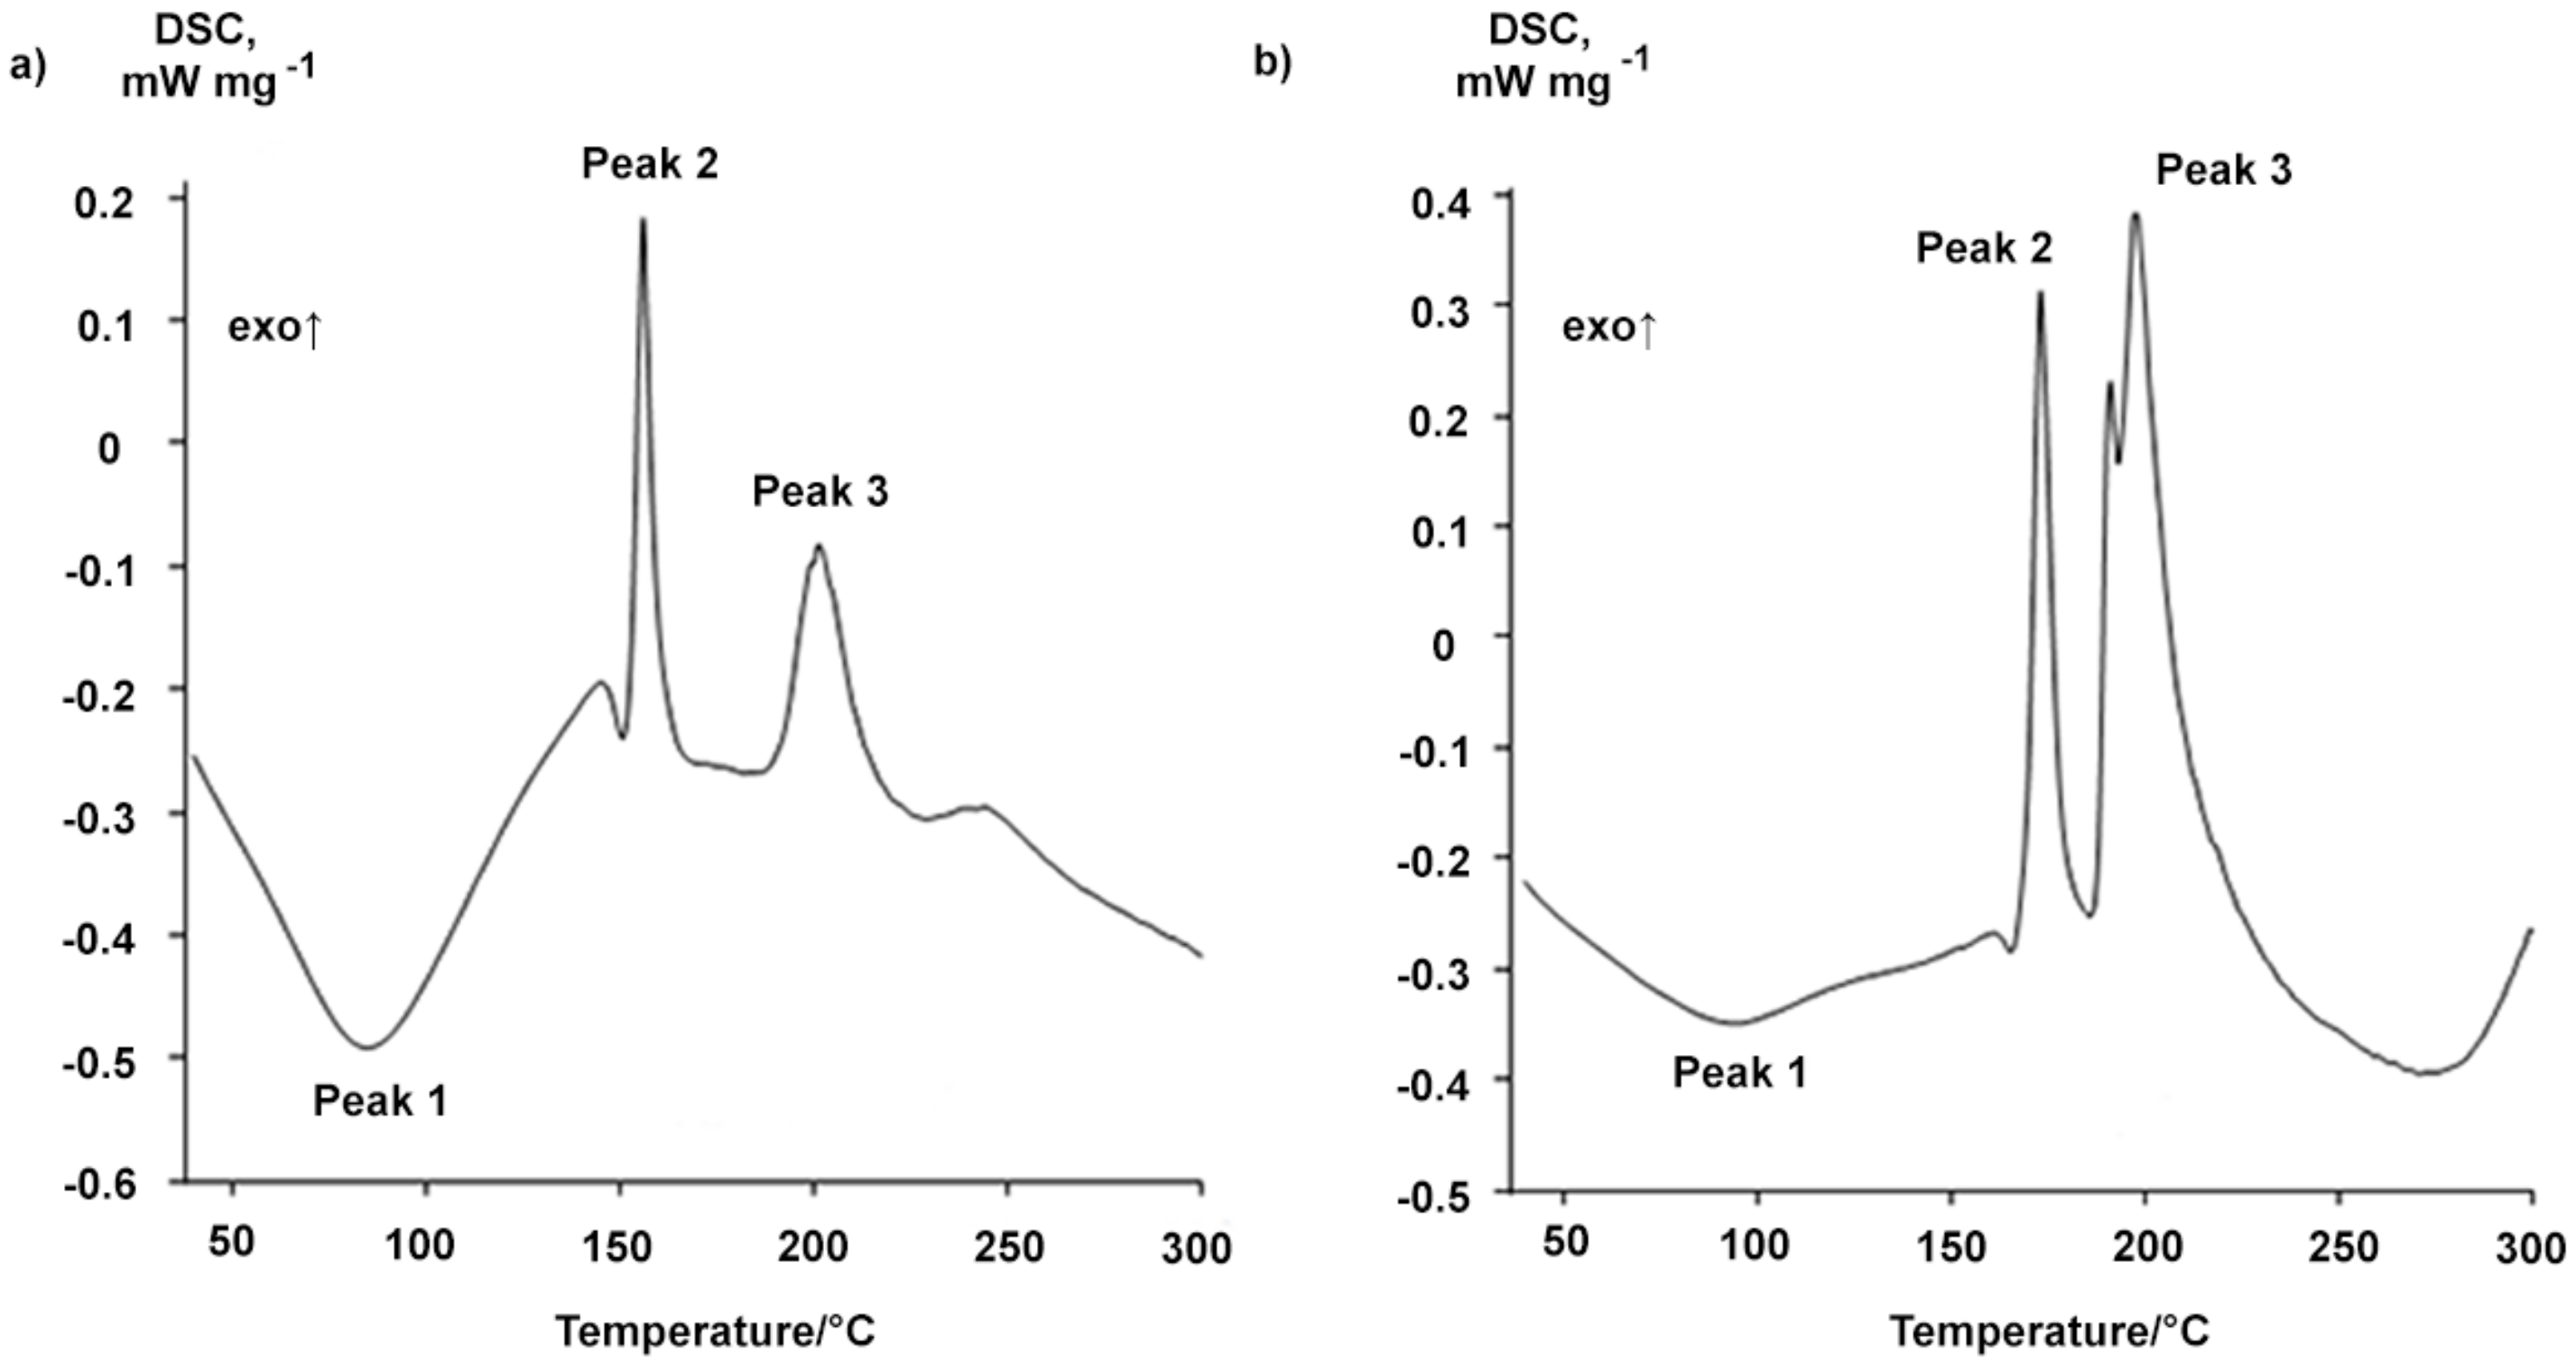
2.1. Properties of the Betulin-3,28-diphosphate
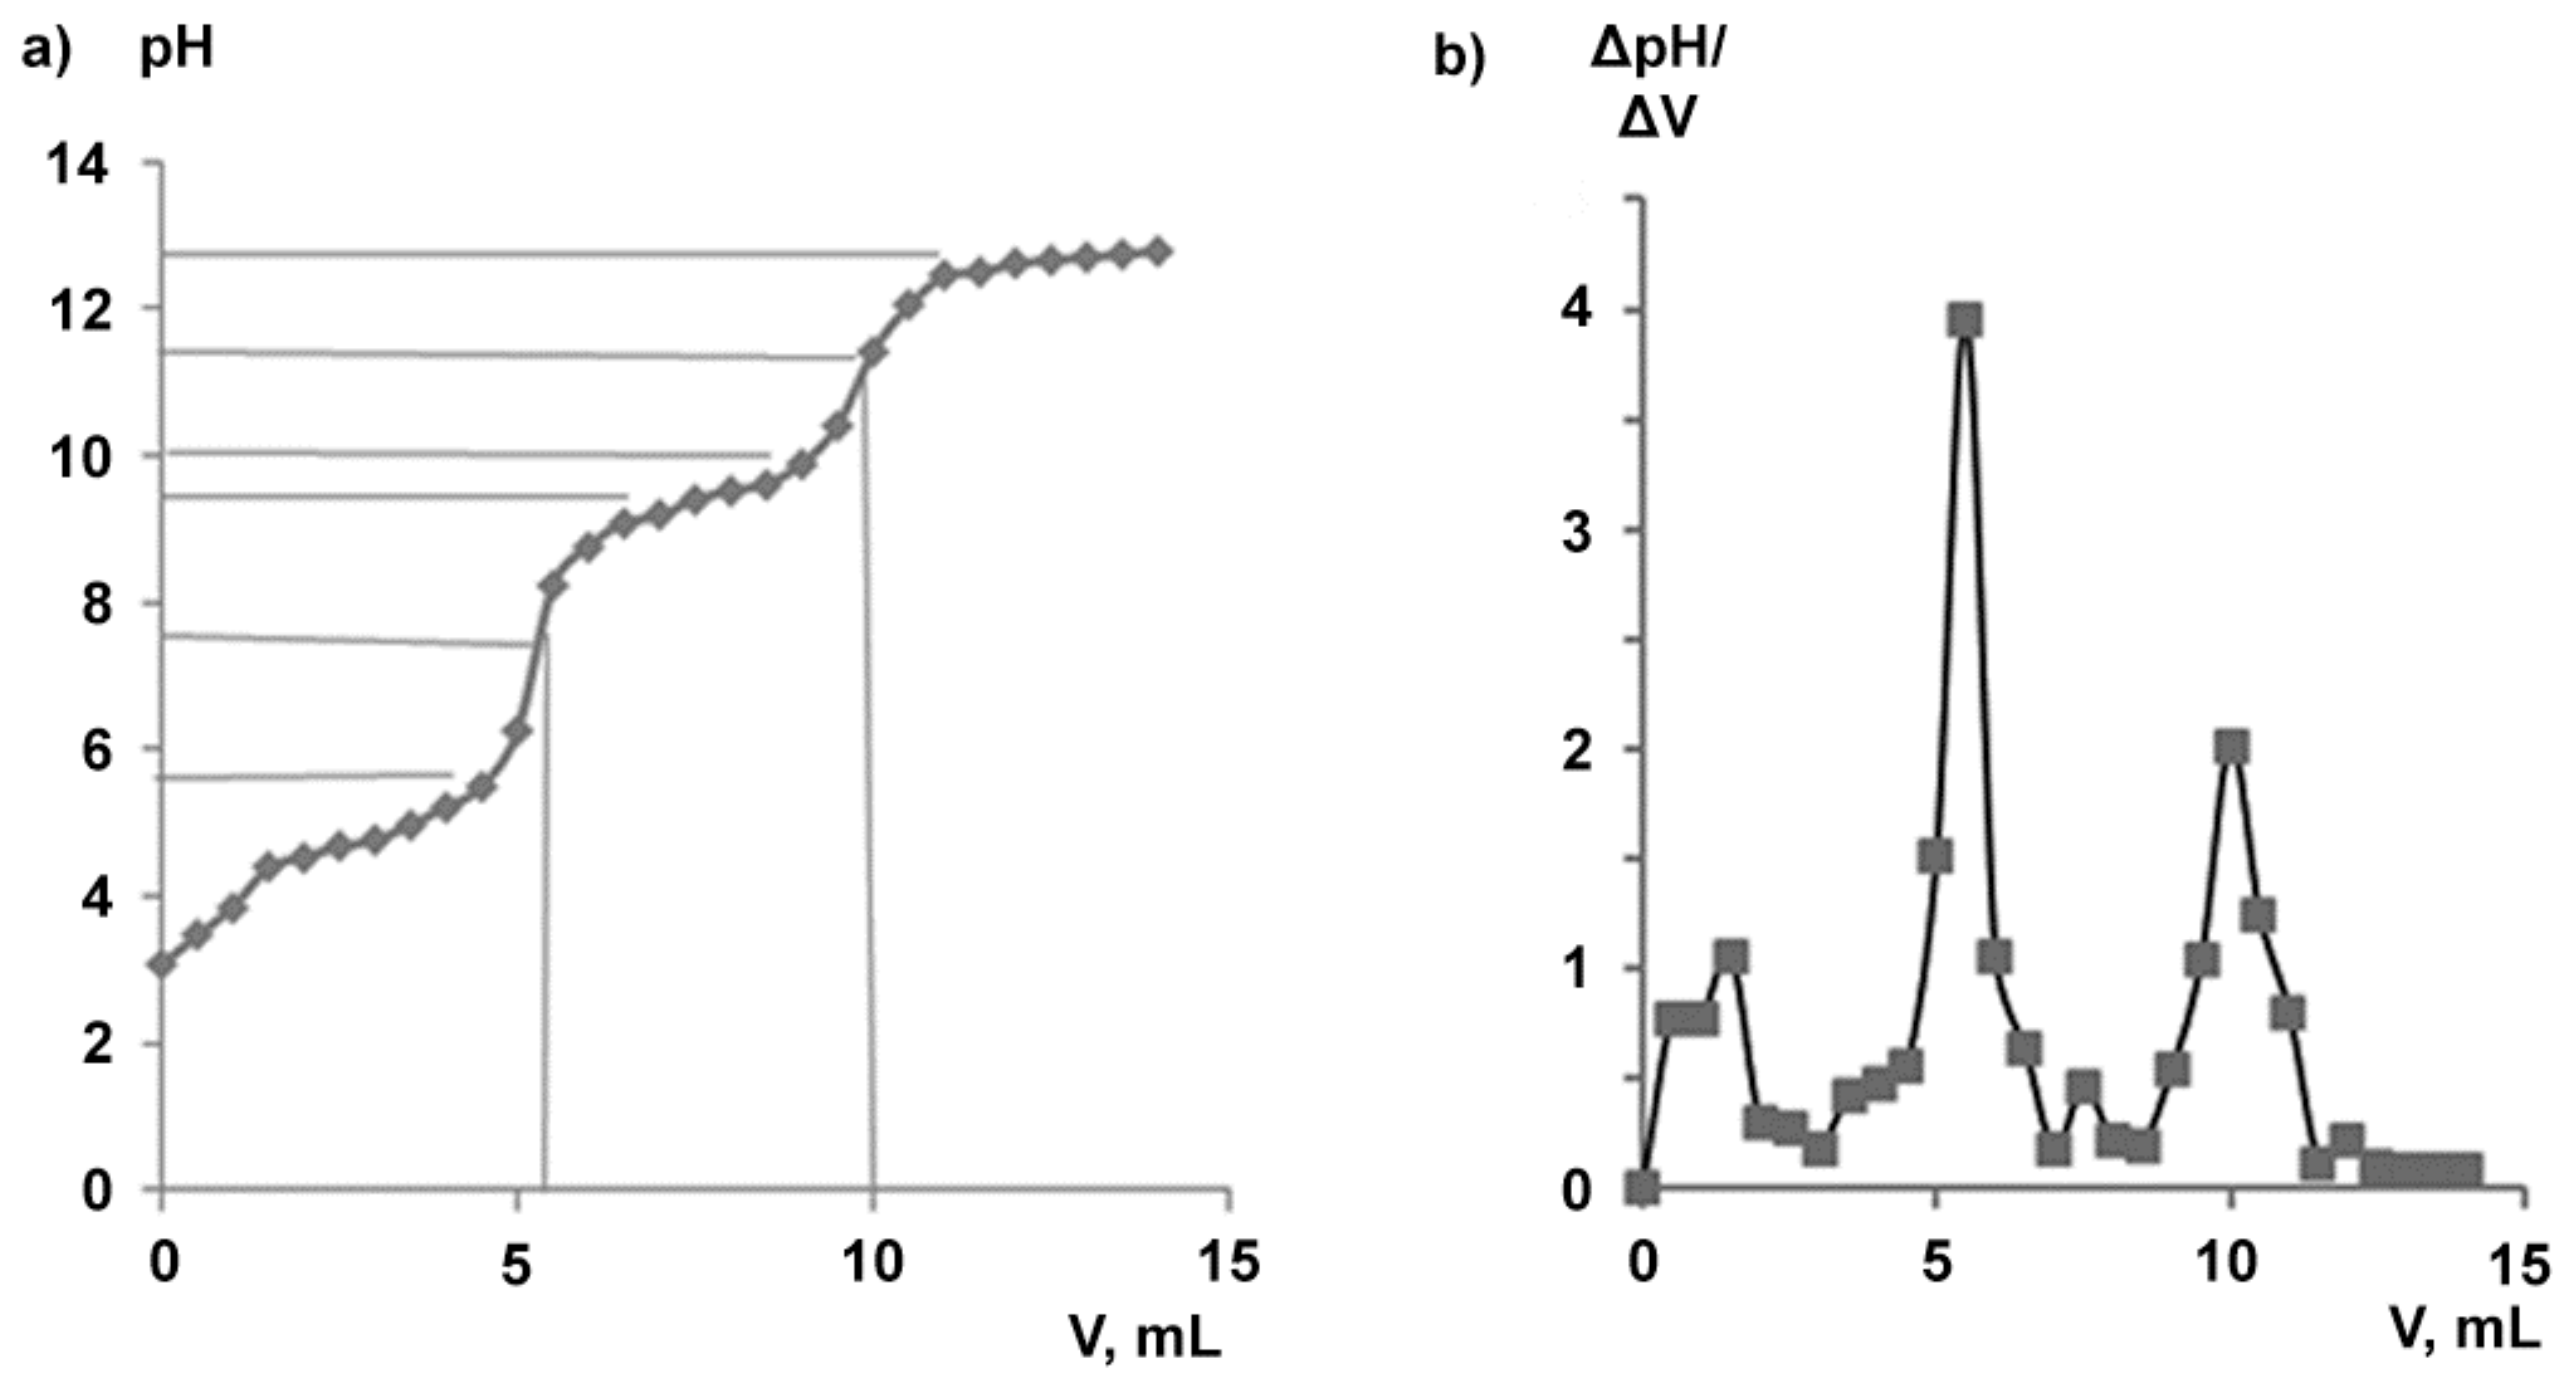
2.2. Water-Soluble Sodium Salt of Betulin-3,28-diphosphate
2.3. Biological Activity of Betulin-3,28-diphosphate In Vitro Experiments
3. Materials and Methods
3.1. Materials
3.2. FTIR Analysis
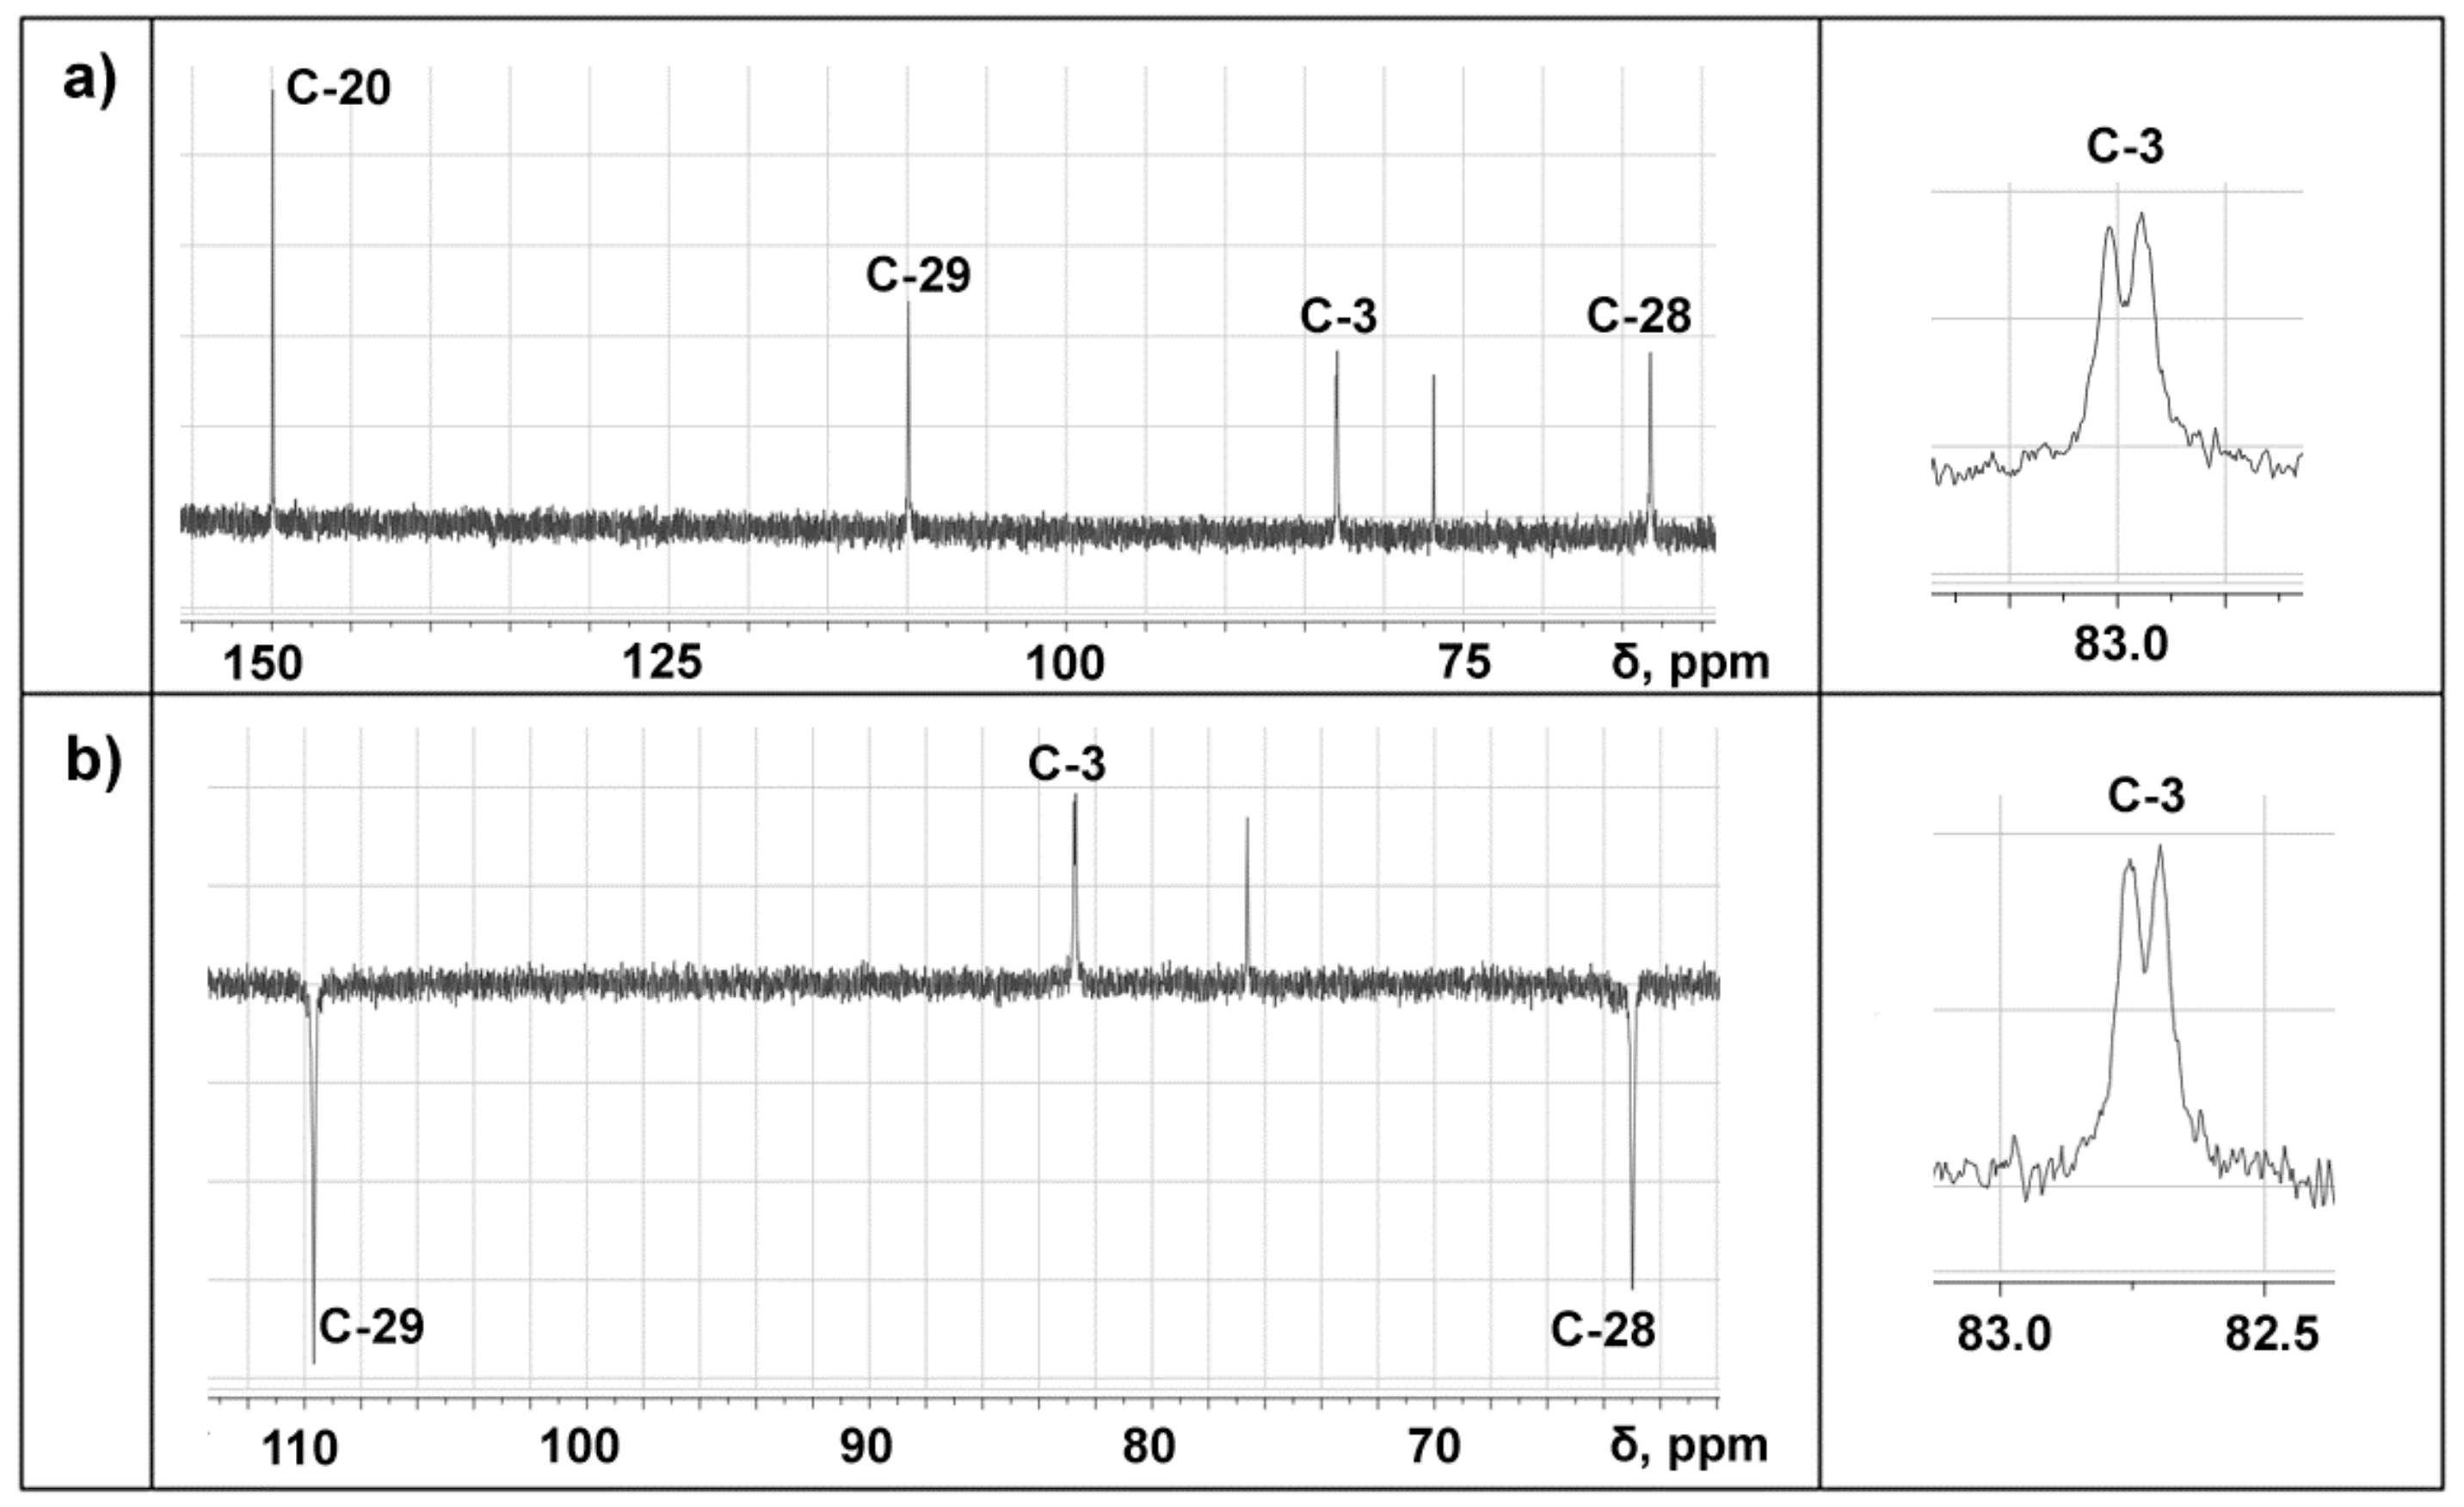
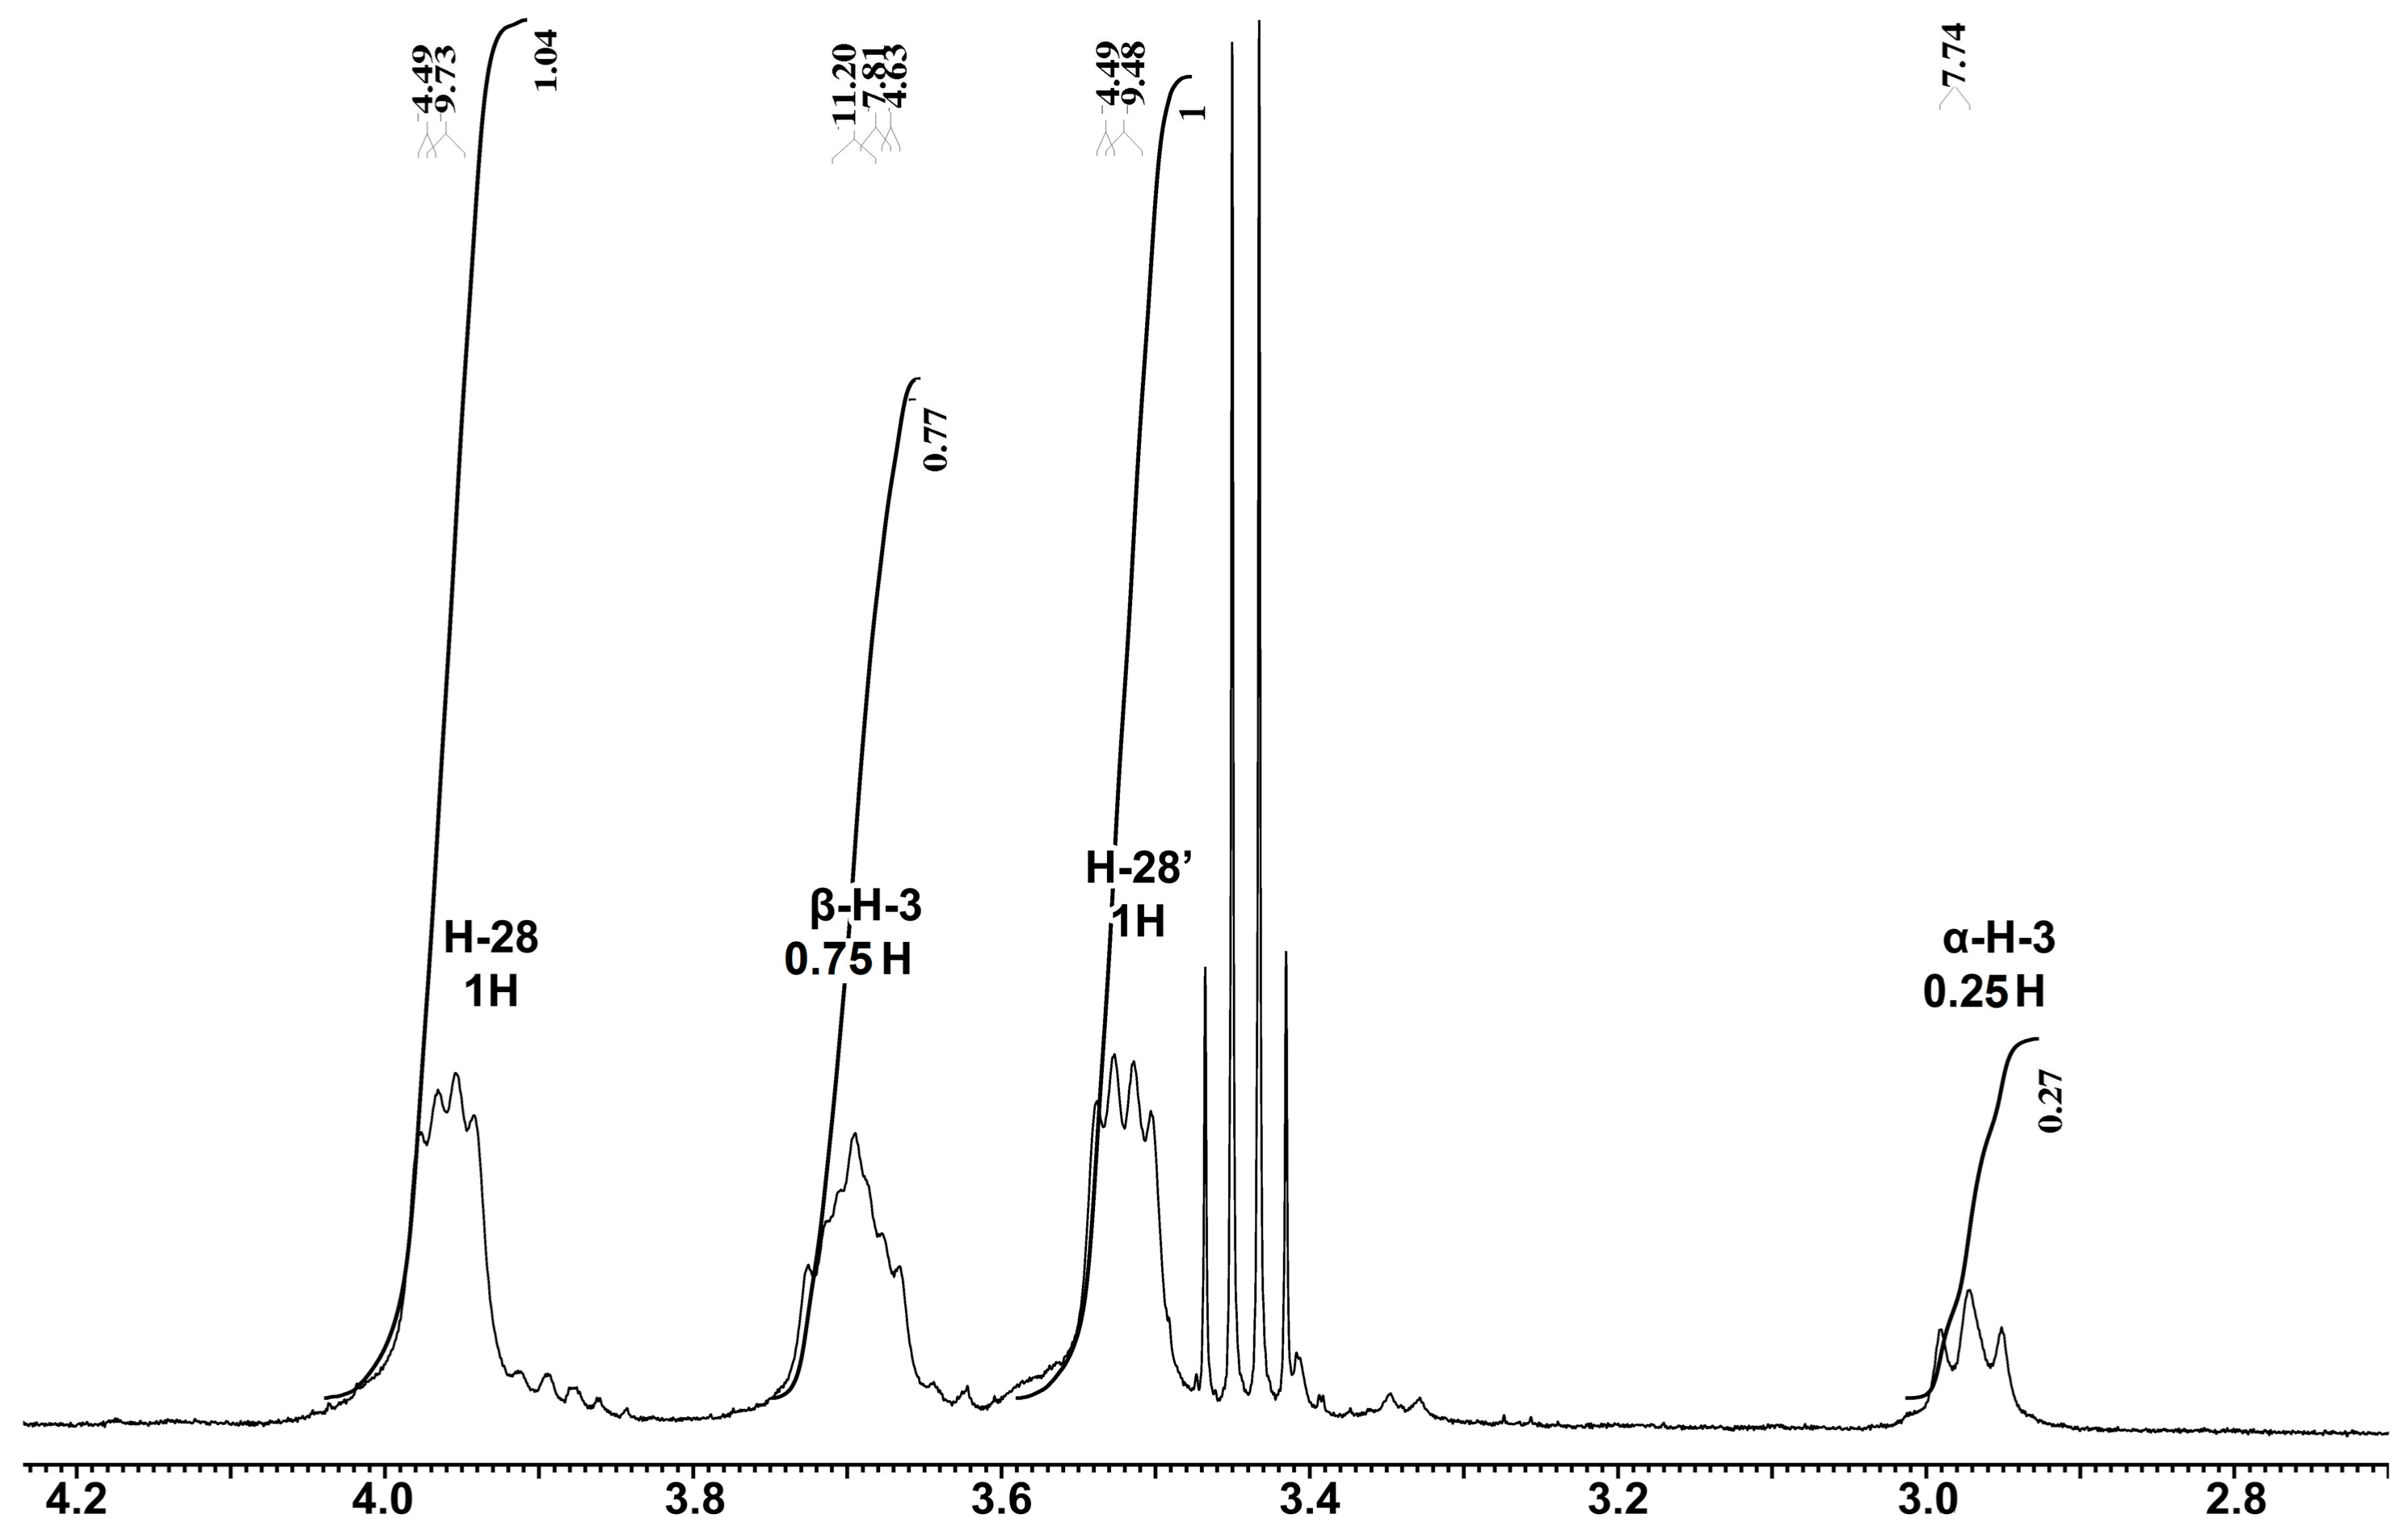
3.3. NMR Analysis
3.4. Differential Scanning Calorimetry
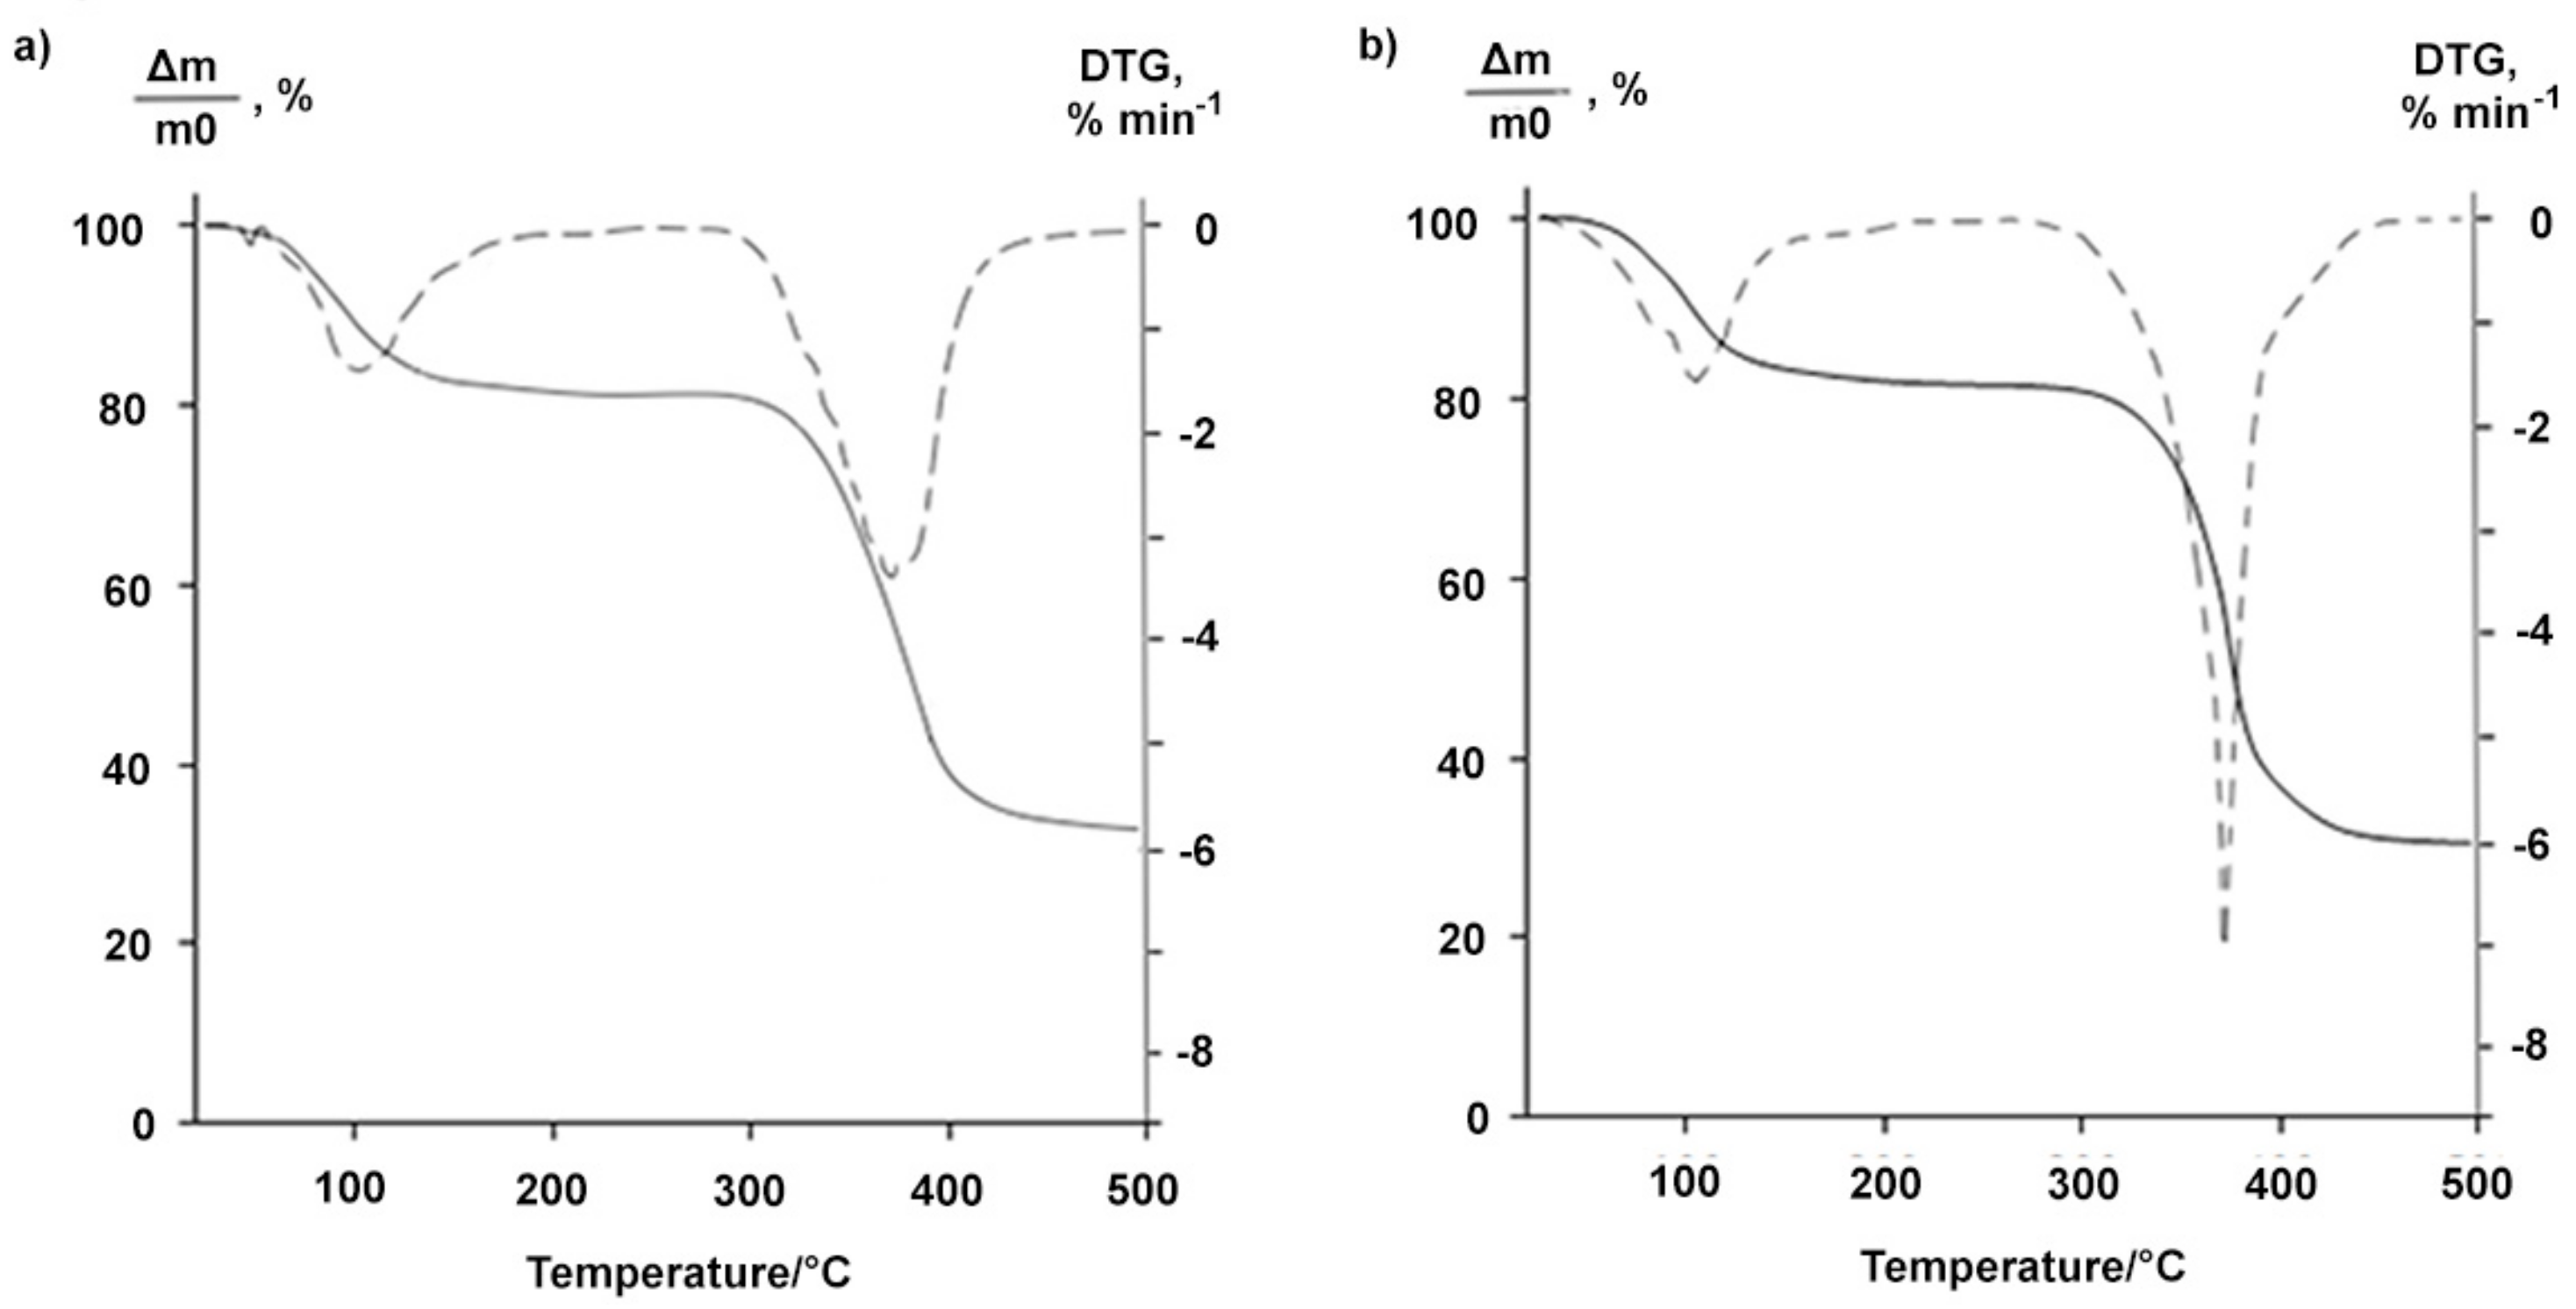
3.5. Thermogravimetric Analysis
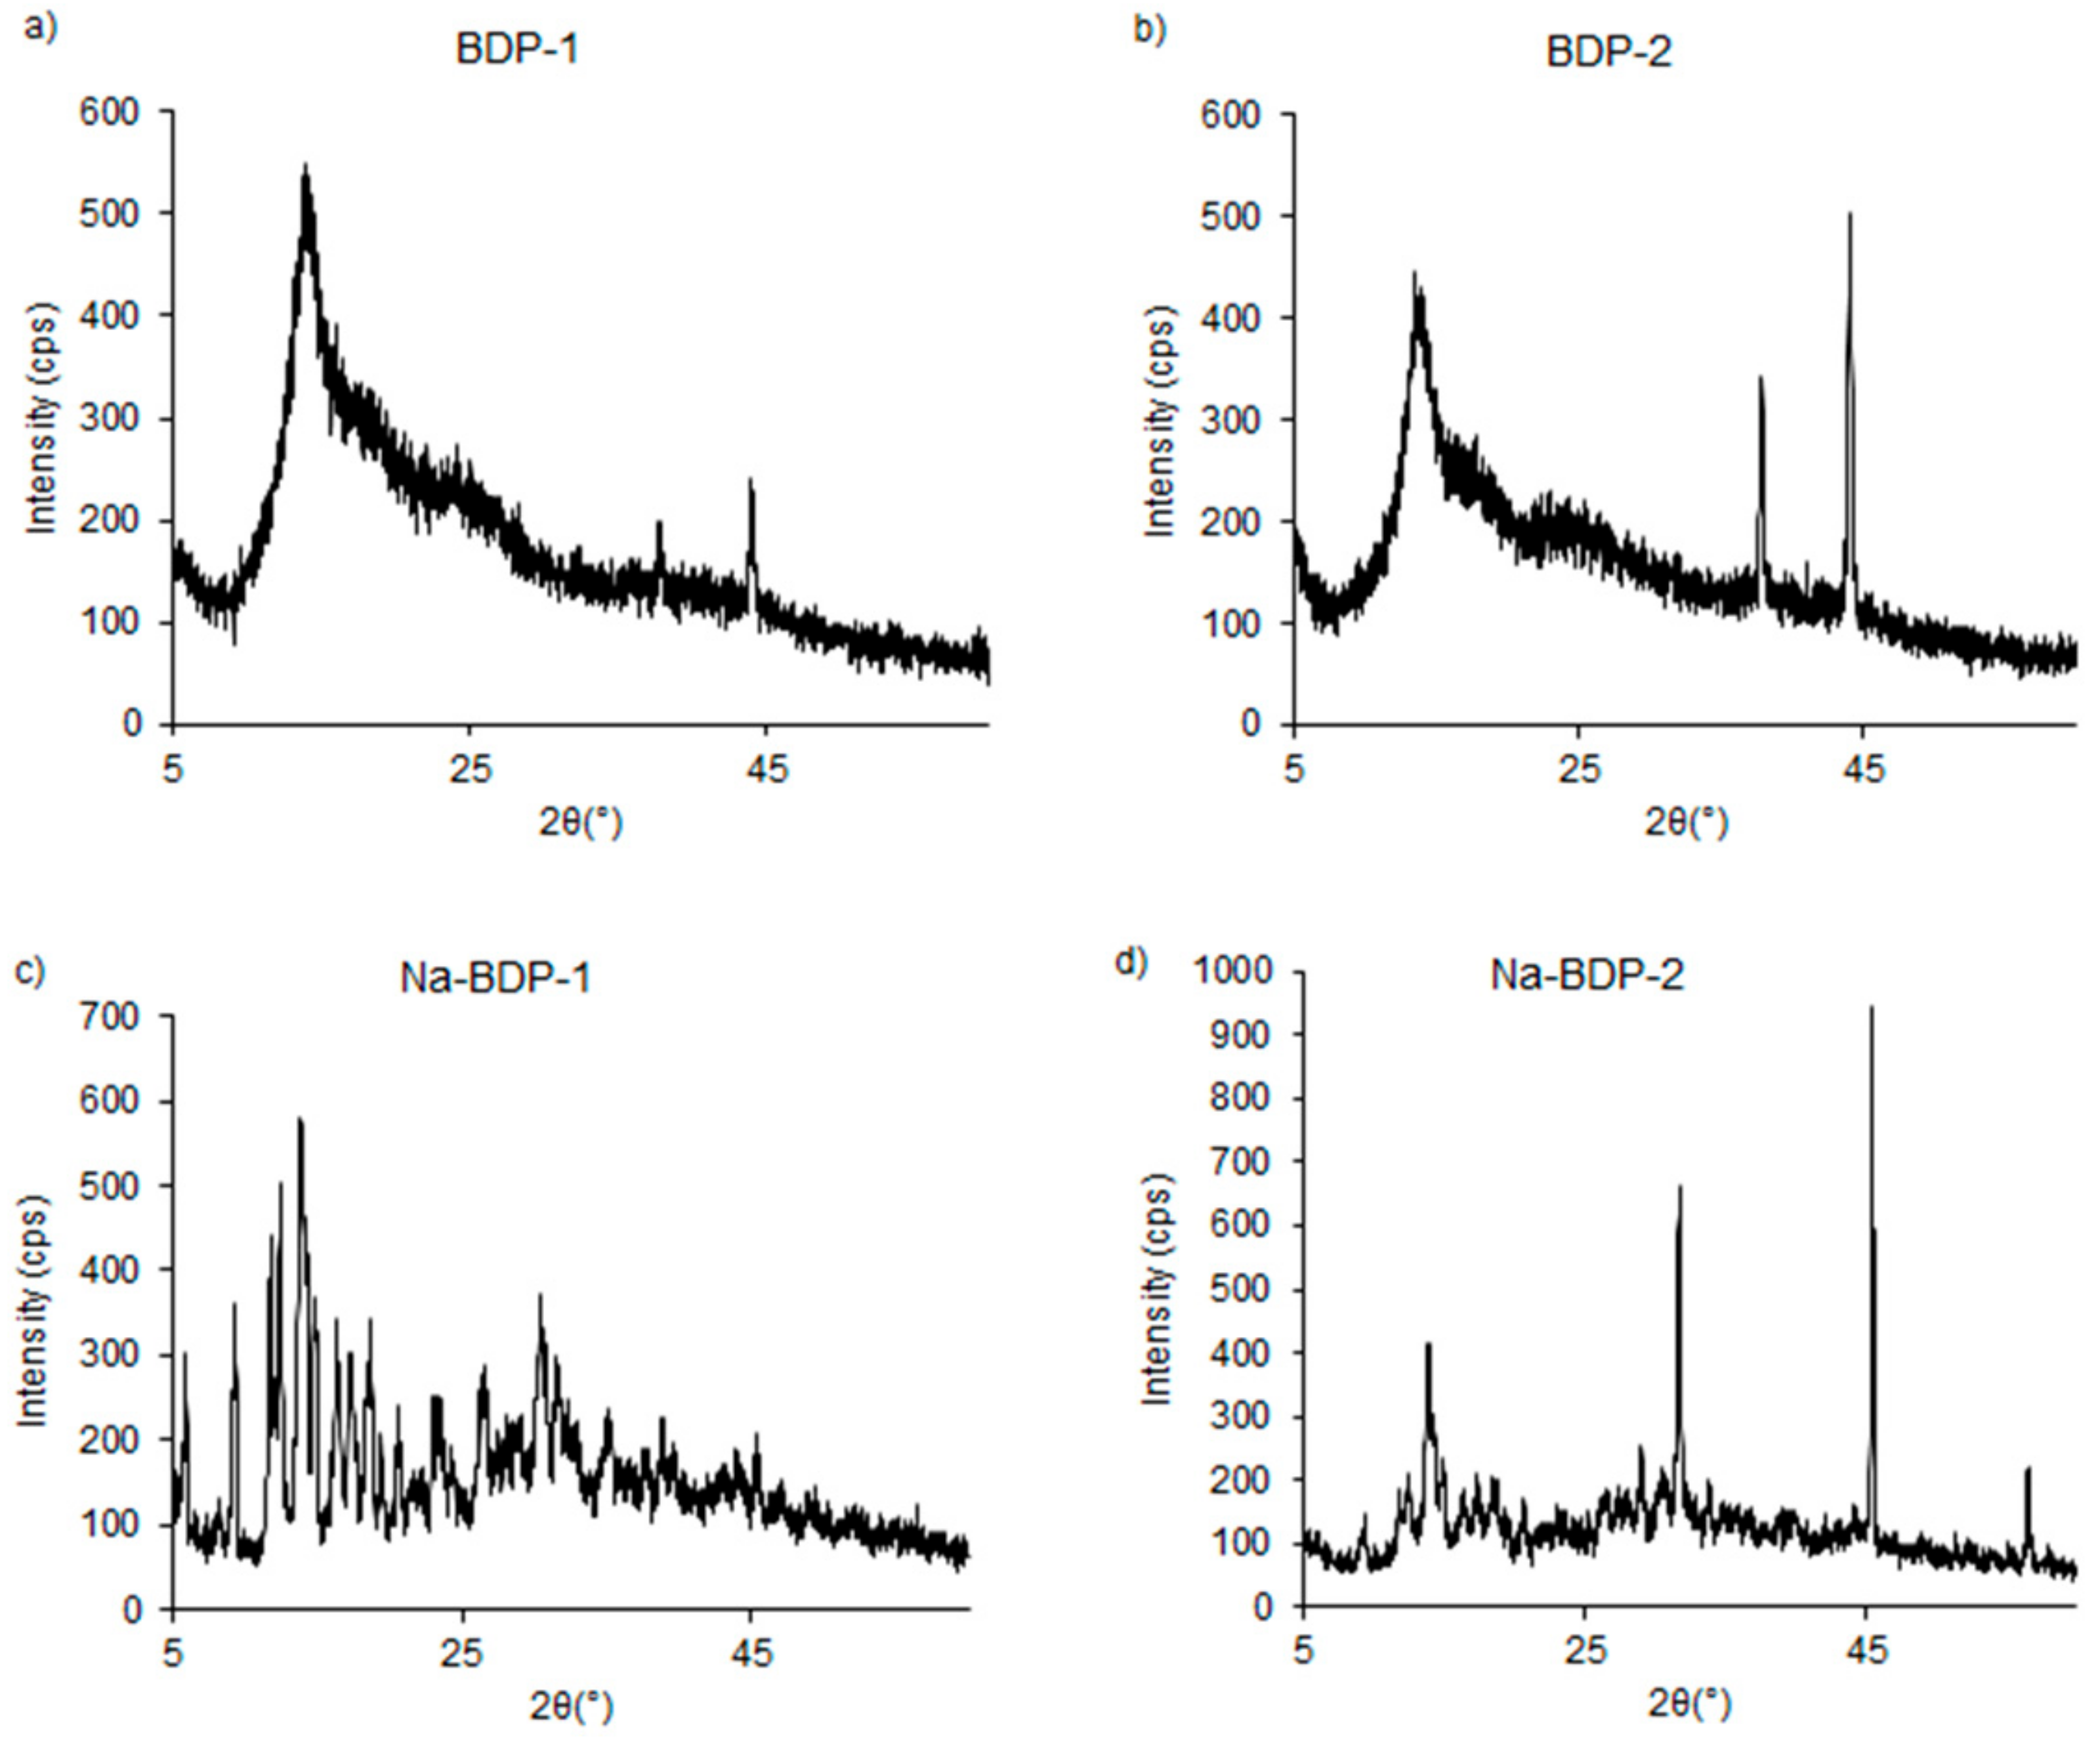
3.6. Powder X-ray Diffraction Analysis
3.7. Synthetic Procedures
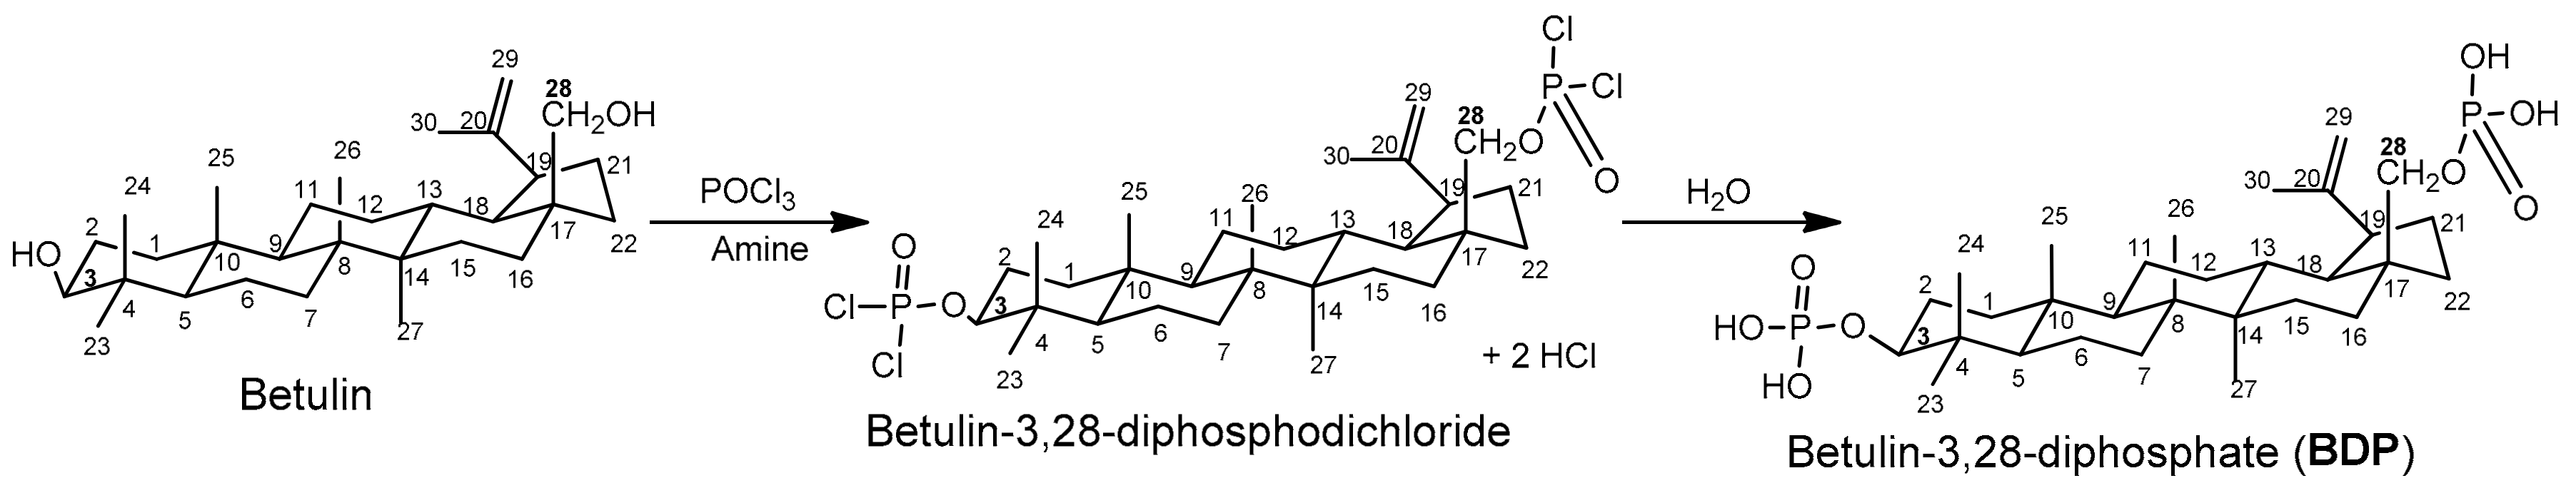
3.7.1. Synthesis of Betulin-3,28-diphosphate (BDP, 3β,28-diphosphate-lup-20(29)-ene)
3.7.2. Synthesis of the Sodium Salt of Betulin-3,28-diphosphate
3.8. Biological Activity In Vitro
4. Conclusions
Supplementary Materials
Author Contributions
Funding
Conflicts of Interest
References
- Falamas, A.; Pinzaru, S.C.; Chis, V.; Dehelean, C. Spectroscopic investigations of newly formed betulin-cyclodextrin quest-host type complexes as potential anti skin cancer candidates. J. Mol. Struct. 2011, 993, 297–301. [Google Scholar] [CrossRef]
- Yogeeswari, P.; Sriram, D. Betulinic acid and its derivatives: A review on their biological properties. Curr. Med. Chem. 2005, 12, 657–666. [Google Scholar] [CrossRef] [PubMed]
- Cichewicz, R.H.; Kouzi, S.A. Chemistry, biological activity, and chemotherapeutic potential of betulinic acid for the prevention and treatment of cancer and HIV infection. Med. Res. Rev. 2004, 24, 90–114. [Google Scholar] [CrossRef] [PubMed]
- Barret, J.P.; Podmelle, F.; Lipový, B.; Rennekampff, H.O.; Schumann, H.; Schwieger-Briel, A.; Zahn, T.R.; Metelmann, H.R. Accelerated re-epithelialization of partial-thickness skin wounds by a topical betulin gel: Results of a randomized phase III clinical trials program. Burns 2017, 43, 1284–1294. [Google Scholar] [CrossRef] [PubMed]
- Yu, H.; Dong, S.; Wang, L.; Liu, Y. The effect of triterpenoid saponins on pancreatic lipase in vitro: Activity, conformation, kinetics, thermodynamics and morphology. Biochem. Eng. J. 2017, 125, 1–9. [Google Scholar] [CrossRef]
- Bureeva, S.; Andia-Pravdivy, J.; Symon, A.; Bichucher, A.; Moskaleva, V.; Popenko, V.; Shpak, A.; Shvets, V.; Kozlov, L.; Kaplun, A. Selective inhibition of the interaction of C1q with immunoglobulins and the classical pathway of complement activation by steroids and triterpenoids sulfates. Bioorg. Med. Chem. 2007, 15, 3489–3498. [Google Scholar] [CrossRef] [PubMed]
- Chrobak, E.; Bebenek, E.; Kadela-Tomanek, M.; Latocha, M.; Jelsch, Ch.; Wenger, E.; Boryczka, S. Betulin phosphonates; Synthesis, structure, and cytotoxic activity. Molecules 2016, 21, 1123. [Google Scholar] [CrossRef] [PubMed]
- Muhammad, A.; Carlson, R.M.; Karim, M.R.; Krasutsky, P.A. Inhibition of Epstein-Barr virus by the triterpenoid betulin diphosphate and uvaol. J. Microbiol. Biotechnol. 2004, 14, 1086–1088. [Google Scholar]
- Pradere, U.; Garnier-Amblard, E.C.; Coats, S.J.; Amblard, F.; Schinazi, R.F. Synthesis of nucleoside phosphate and phosphonate prodrugs. Chem. Rev. 2014, 114, 9154–9218. [Google Scholar] [CrossRef] [PubMed]
- Krasutsky, P.A.; Carlson, R.M.; Karim, M.R. Triterpenes having Antibacterial Activity. U.S. Patent US 6,689,767 B2, 10 February 2004. [Google Scholar]
- Krasutsky, P.A.; Carlson, R.M.; Karim, M.R. Triterpenes having Human Antifungal and Antiyeast Activity. U.S. Patent US 6,642,217 B2, 4 November 2003. [Google Scholar]
- Kaplun, A.P.; Andija-Pravdivyi, J.E.; Bureeva, S.V.; Kozlov, L.V.; Shvets, V.I. The Derivatives of Betulin as Inhibitors of the Complement System. Rus. Patent RU 2,243,233, 27 December 2004. [Google Scholar]
- Pfeffer-Hennig, S.; Piechon, P.; Bellus, M.; Goldbronn, C.; Tedesco, E. Physico-chemical characterization of an active pharmaceutical ingredient. Crystal polymorphism and structural analysis. J. Therm. Anal. Calorim. 2004, 77, 663–679. [Google Scholar] [CrossRef]
- Veronez, I.P.; Daniel, J.S.P.; Garcia, J.S.; Trevisan, M.G. Characterization and compatibility study of desloratadine. J. Therm. Anal. Calorim. 2014, 115, 2407–2414. [Google Scholar] [CrossRef]
- Almeida, M.M.; Bou-Chacra, N.A.; Lima, C.R.R.C.; Matos, J.R.; Filho, E.M.; Mercuri, L.P.; Baby, A.R.; Kaneko, T.M.; Velasco, M.V.R. Characterization and evaluation of free and nanostructured ursolic acid incorporated in cosmetic formulation using thermal analysis. J. Therm. Anal. Calorim. 2014, 115, 2401–2406. [Google Scholar] [CrossRef]
- Aitipamula, S. Polymorphism in molecular crystals and cocrystals. In Advances in Organic Crystal Chemistry, 1st ed.; Tamura, R., Miyata, M., Eds.; Springer: Tokyo, Japan, 2015; pp. 265–298. [Google Scholar]
- Wiedemann, H.G.; Felder-Casagranda, S. Thermomicroscopy. In Handbook of Thermal Analysis and Calorimetry, 1st ed.; Brown, M.E., Ed.; Elsevier Science B.V.: Amsterdam, The Netherlands, 1998; Volume 1, pp. 472–496. [Google Scholar]
- Perrenot, B.; Widmann, G. Polymorphism by differential scanning calorimetry. Thermochim. Acta 1994, 234, 31–39. [Google Scholar] [CrossRef]
- Wang, X.; Gong, N.; Yang, S.; Du, G.; Lu, Y. Studies on solvatomorphism of betulinic acid. J. Pharm. Sci. 2014, 103, 2696–2703. [Google Scholar] [CrossRef] [PubMed]
- Markin, A.V.; Markhasin, E.; Sologubov, S.S.; Ni, Q.Z.; Smirnova, N.N.; Griffin, R.G. Low-temperature polymorphic phase transition in a crystalline tripeptide l-Ala-l-Pro-Gly·H2O revealed by adiabatic calorimetry. J. Phys. Chem. B 2015, 119, 1787–1792. [Google Scholar] [CrossRef] [PubMed]
- Wesolowski, M.; Rojek, B. Thermogravimetric detection of incompatibilities between atenolol and excipients using multivariate techniques. J. Therm. Anal. Calorim. 2013, 113, 169–177. [Google Scholar] [CrossRef]
- Elks, J.; May, P.J.; Phillipps, G.H. 21-Phosphate Esters of 17α-acyloxy-21 Hydroxy Steroids of the Pregnane Series. U.S. Patent No. US 3,764,616, 9 October 1973. [Google Scholar]
- Symon, A.V.; Kaplun, A.P.; Vlasenkova, N.K.; Gerasimova, G.K.; Shon, L.B.; Litvin, E.F.; Kozlova, L.M.; Surkova, E.L.; Shvets, V.I. Epimerization of Hydroxyl Group in Lupan Series Triterpenoids. Rus. J. Bioorg. Chem. 2003, 29, 185–189. [Google Scholar] [CrossRef]
- Son, L.B.; Kaplun, A.P.; Spilevskiĭ, A.A.; Andiia-Pravdivyĭ, I.E.; Alekseeva, S.G.; Gribor’ev, V.B.; Shvets, V.I. Synthesis of betulinic acid from betulin and study of its solubilization usingliposomes. Bioorganicheskaia Khimiia 1998, 24, 787–793. [Google Scholar] [PubMed]
- Kuznetsova, S.A.; Skvortsova, G.P.; Maliar, I.N.; Skurydina, E.S.; Veselova, O.F. Extraction of betulin from birch bark and study of its physico-chemical and pharmacological properties. Russ. J. Bioorganic Chem. 2014, 40, 742–747. [Google Scholar] [CrossRef]
- Shimkin, A. Optimization of DSC calibration procedure. Thermochim. Acta 2013, 566, 71–76. [Google Scholar] [CrossRef]
- Höhne, G.W.H.; Hemminger, W.F.; Flammersheim, H.-J. Differential Scanning Calorimetry, 2nd ed.; Springer: New York, NY, USA, 2003. [Google Scholar]
- Drebushchak, V.A. Calibration coefficient of heat-flow DSC. Part II: Optimal calibration procedure. J. Therm. Anal. Calorim. 2005, 79, 213–218. [Google Scholar] [CrossRef]
- Khromova, N.Y.; Malekin, S.I.; Kisin, A.V.; Nosova, V.M.; Kruglyak, Y.L.; Kurochkin, V.K. Preparative synthesis of 1,2- and 1,3-disubstituted phosphatidic acids. Russ. J. Bioorg. Chem. 1999, 25, 268–272. [Google Scholar]
- Mahadevaiah, M.S.; Yogendra, K.; Abdul Galil, M.S.; Suresha, M.S.; Sathish, M.A.; Nagendrappa, G. A simple spectrophotometric determination of phosphate in sugarcane juices, water and detergent samples. J. Chem. 2007, 4, 467–473. [Google Scholar] [CrossRef]
- Mihara, M.; Uchiyama, M. Determination of malonaldehyde precursor in tissues by thiobarbituric acid test. Anal. Biochem. 1978, 86, 271–278. [Google Scholar] [PubMed]
- Solovyeva, A.G.; Zimin, Y.V. A new estimation method of blood metabolism dynamics of patients with heat injuries. Mod. Technol. Med. 2012, 2, 116–117. [Google Scholar]
- Waterborg, J.H.; Matthews, H.R. The Lowry method for protein quantitation. Methods Mol. Biol. 1994, 32, 1–4. [Google Scholar] [PubMed]
Sample Availability: Samples of the compounds are available from the authors. |


| Type of BDP | Sample | Melting Point, °С | Peak 1 | Peak 2 | Peak 3 | ||||
|---|---|---|---|---|---|---|---|---|---|
| Tpeak, °С | Tonset, °С | Tpeak, °С | Exo-Effect ΔH, kJ∙mol−1 | Tonset, °С | Tpeak, °С | Exo-Effect ΔH, kJ∙mol−1 | |||
| 1 | Readily soluble in ethanol (up to 10%) | 148 | 85.3 ± 0.5 | 151.2 ± 0.5 | 155.9 ± 0.5 | −15.5 ± 0.2 | 183.5 ± 0.5 | 200.8 ± 0.5 | −19.7 ± 0.2 |
| 2 | After boiling water treatment during 1 h | 157 | 77.0 ± 0.5 | 143.2 ± 0.5 | 161.0 ± 0.5 | −10.0 ± 0.1 | 171.0 ± 0.5 | 185.1 ± 0.5 | −80.4 ± 0.8 |
| Synthesis from Na-BDP 2 | 156 | 90.8 ± 0.5 | 137.5 ± 0.5 | 148.5 ± 0.5 | −21.4 ± 0.2 | 164.2 ± 0.5 | 187.3 ± 0.5 | −67.1 ± 0.7 | |
| Reprecipitation by acetone | 160 | 94.1 ± 0.5 | 161.3 ± 0.5 | 172.8 ± 0.5 | −23.5 ± 0.2 | 185.9 ± 0.5 | 197.3 ± 0.5 | −70.5 ± 0.7 | |
| Parameters | % of Control | |
|---|---|---|
| BDP-1 as Sodium Salt | Mixture of BDP-1 and BDP-2 (2:1) 2 | |
| Catalase | 299.0 ± 13.6 | 170.5 ± 3.5 |
| SOD | 334.9 ± 2.0 | 165.2 ± 2.5 |
| MDAplasma | 98.9 ± 13.0 | 115.07 ± 0.2 |
| MDAerythrocyte | 57.0 ± 8.0 | 83.1 ± 3.7 |
| LDHdirect | 423.6 ± 7.0 | 271.2 ± 6.5 |
| LDHreverse | 236.6 ± 4.0 | 110.0 ± 3.0 |
| LPOplasma | 92.8 ± 0.9 | 101.2 ± 0.7 |
| LPOerythrocyte | 68.6 ± 0.5 | 96.8 ± 1.4 |
| TAS | 117.6 ± 1.9 | 102.7 ± 4.0 |
© 2018 by the authors. Licensee MDPI, Basel, Switzerland. This article is an open access article distributed under the terms and conditions of the Creative Commons Attribution (CC BY) license (http://creativecommons.org/licenses/by/4.0/).
Share and Cite
Melnikova, N.B.; Malygina, D.S.; Klabukova, I.N.; Belov, D.V.; Vasin, V.A.; Petrov, P.S.; Knyazev, A.V.; Markin, A.V. Betulin-3,28-diphosphate. Physico-Chemical Properties and In Vitro Biological Activity Experiments. Molecules 2018, 23, 1175. https://doi.org/10.3390/molecules23051175
Melnikova NB, Malygina DS, Klabukova IN, Belov DV, Vasin VA, Petrov PS, Knyazev AV, Markin AV. Betulin-3,28-diphosphate. Physico-Chemical Properties and In Vitro Biological Activity Experiments. Molecules. 2018; 23(5):1175. https://doi.org/10.3390/molecules23051175
Chicago/Turabian StyleMelnikova, Nina B., Darina S. Malygina, Irina N. Klabukova, Denis V. Belov, Viktor A. Vasin, Pavel S. Petrov, Alexander V. Knyazev, and Alexey V. Markin. 2018. "Betulin-3,28-diphosphate. Physico-Chemical Properties and In Vitro Biological Activity Experiments" Molecules 23, no. 5: 1175. https://doi.org/10.3390/molecules23051175