Article

A Highly Selective and Strong Anti-Interference Host-Guest Complex as Fluorescent Probe for Detection of Amantadine by Indicator Displacement Assay

The State Key Laboratory of Refractories and Metallurgy, School of Chemistry and Chemical Engineering, Wuhan University of Science and Technology, Wuhan 430081, China
*
Author to whom correspondence should be addressed.
Molecules 2018, 23(4), 947; https://doi.org/10.3390/molecules23040947
Submission received: 24 March 2018 / Revised: 6 April 2018 / Accepted: 13 April 2018 / Published: 18 April 2018
(This article belongs to the Special Issue Molecules for Biotechnologies)

Abstract

:
Amantadine (AMA) and its derivatives are illicit veterinary drugs that are hard to detect at very low concentrations. Developing a fast, simple and highly sensitive method for the detection of AMA is highly in demand. Here, we designed an anthracyclic compound (ABAM) that binds to a cucurbit[7]uril (CB[7]) host with a high association constant of up to 8.7 × 10⁸ M−1. The host-guest complex was then used as a fluorescent probe for the detection of AMA. Competition by AMA for occupying the cavity of CB[7] allows ABAM to release from the CB[7]-ABAM complex, causing significant fluorescence quenching of ABAM (indicator displacement assay, IDA). The linear range of the method is from 0.000188 to 0.375 μg/mL, and the detection limit can be as low as 6.5 × 10⁻⁵ μg/mL (0.35 nM). Most importantly, due to the high binding affinity between CB[7] and ABAM, this fluorescence host-guest system shows great anti-interference capacity. Thus, we are able to accurately determine the concentration of AMA in various samples, including pharmaceutical formulations.

1. Introduction

Amantadine (AMA, Figure 1) was first found by Davies in 1964, and was used to treat influenza virus [1]. Because of its effective treatment and low cost, AMA was recognized as the first anti-influenza drug by the U.S. Food and Drug Administration (FDA) in 1966 [2,3]. With its advantages, AMA has been mixed with fodder, aiming to prevent and treat animal diseases, especially in chicken farming [4]. This kind of drug abuse results in the accumulation of AMA in the human body, causing various kinds of poisonous effects. Additionally, the abuse of AMA may also cause virus resistance and virus variation, which have bad effects on human treatment [5]. Because of these potential risks, AMA has been banned in livestock farming by USA and China since 2005 [6,7]. So far, lots of assays have been reported for the detection of AMA, including near-infrared spectroscopy [8,9], HPLC-MS/GC-MS [6,10,11,12,13,14,15,16], micellar electrokinetic chromatography (MEKC) [17], capillary electrophoresis [18,19], and potentiometry [20,21]. However, those methods normally require complicated, expensive equipment and labor-intensive sample preparation procedures. Moreover, some of them are not sensitive enough. Spectrofluorimetry is regarded as one of the most convenient analytical techniques in pharmaceutical analysis, owing to its inherent simplicity, high sensitivity, and availability in most quality-controlled and clinical laboratories. Considering that the aqueous solution of AMA has no native fluorescence, the concentration of AMA cannot be directly determined through the normal fluorimetric method. Therefore, spectrofluorometric methods have been developed via the derivatization of AMA with a chromophore [22,23,24].
Cucurbit[n]uril (CB[n], n = 5–8, 10, 13–15) is a family of macrocyclic compounds with a hydrophobic cavity and 2n carbonyl group on the portals [25,26,27]. As a novel synthetic host molecule, CB[n] shows its molecular recognition properties towards cationic and neutral guests with high selectivity and high affinity, and has been widely utilized in applications in nanoreactors/catalyst, supramolecular materials, and drug delivery/biomedicine [28,29,30,31,32,33,34,35,36]. CB[7] (Figure 1), one of the most studied members of the CB[n] family, shows its abilities to recognize a variety of guests with high association constant in aqueous solution, such as adamantylamine derivatives [37,38]. Due to the ability to alter the photophysical properties of fluorescent dyes [39], CB[7] has been applied to form a host-dye complex, which has been further used for determining analyte concentrations via indicator displacement assays (IDA) [40].
The first host-guest fluorescent probe system aiming at detecting AMA was reported in 2012 [41]. A natural isoquinoline alkaloid-coptisine (COP) was selected as the indicator, and the system was quite sensitive to AMA. Owing to the week binding interaction between COP and CB[7] (Ka = 1.86 × 10⁴ M−1), other non-target drug molecules may also displace COP from the complex and significantly skew measurement results. In another example, a bis-pyridine fluorescent molecule is used as the indicator [42]. But still, the binding interaction between the indicator and CB[7] is not strong enough (Ka = 9.44 × 10⁴ M−1). In order to achieve the detection of AMA with high selectivity, sensitivity, and anti-interference capacity, we designed a fluorescence indicator N-(4-(aminomethyl)benzyl)-1-(anthracen-9-yl)methanamine (ABAM, Figure 1). We expect that aminomethyl-benzyl moiety could be encapsulated in CB[7] [37]; anthracene moiety could stay out of the cavity of CB[7] and its fluorescence signal could change upon complexation/decomplexation of ABAM with CB[7]. Since the binding constants of CB[7]·xylylenediamine and CB[7]·AMA are 1.84 × 10⁹ M−1 and 4.2 × 10¹² M−1, respectively [37], we expect the system could show high anti-interference capacity and maintain high sensitivity (Scheme 1). After making the new indicator, we investigated the binding behaviour of ABAM with CB[7], including the emission properties of ABAM upon encapsulation in CB[7], and plotted the standard curves upon the fluorescence change of CB[7]-ABAM system with addition of AMA. Finally, we determined the concentration of AMA in different samples, including mixture samples even pharmaceutical formulations.

2. Results and Discussion

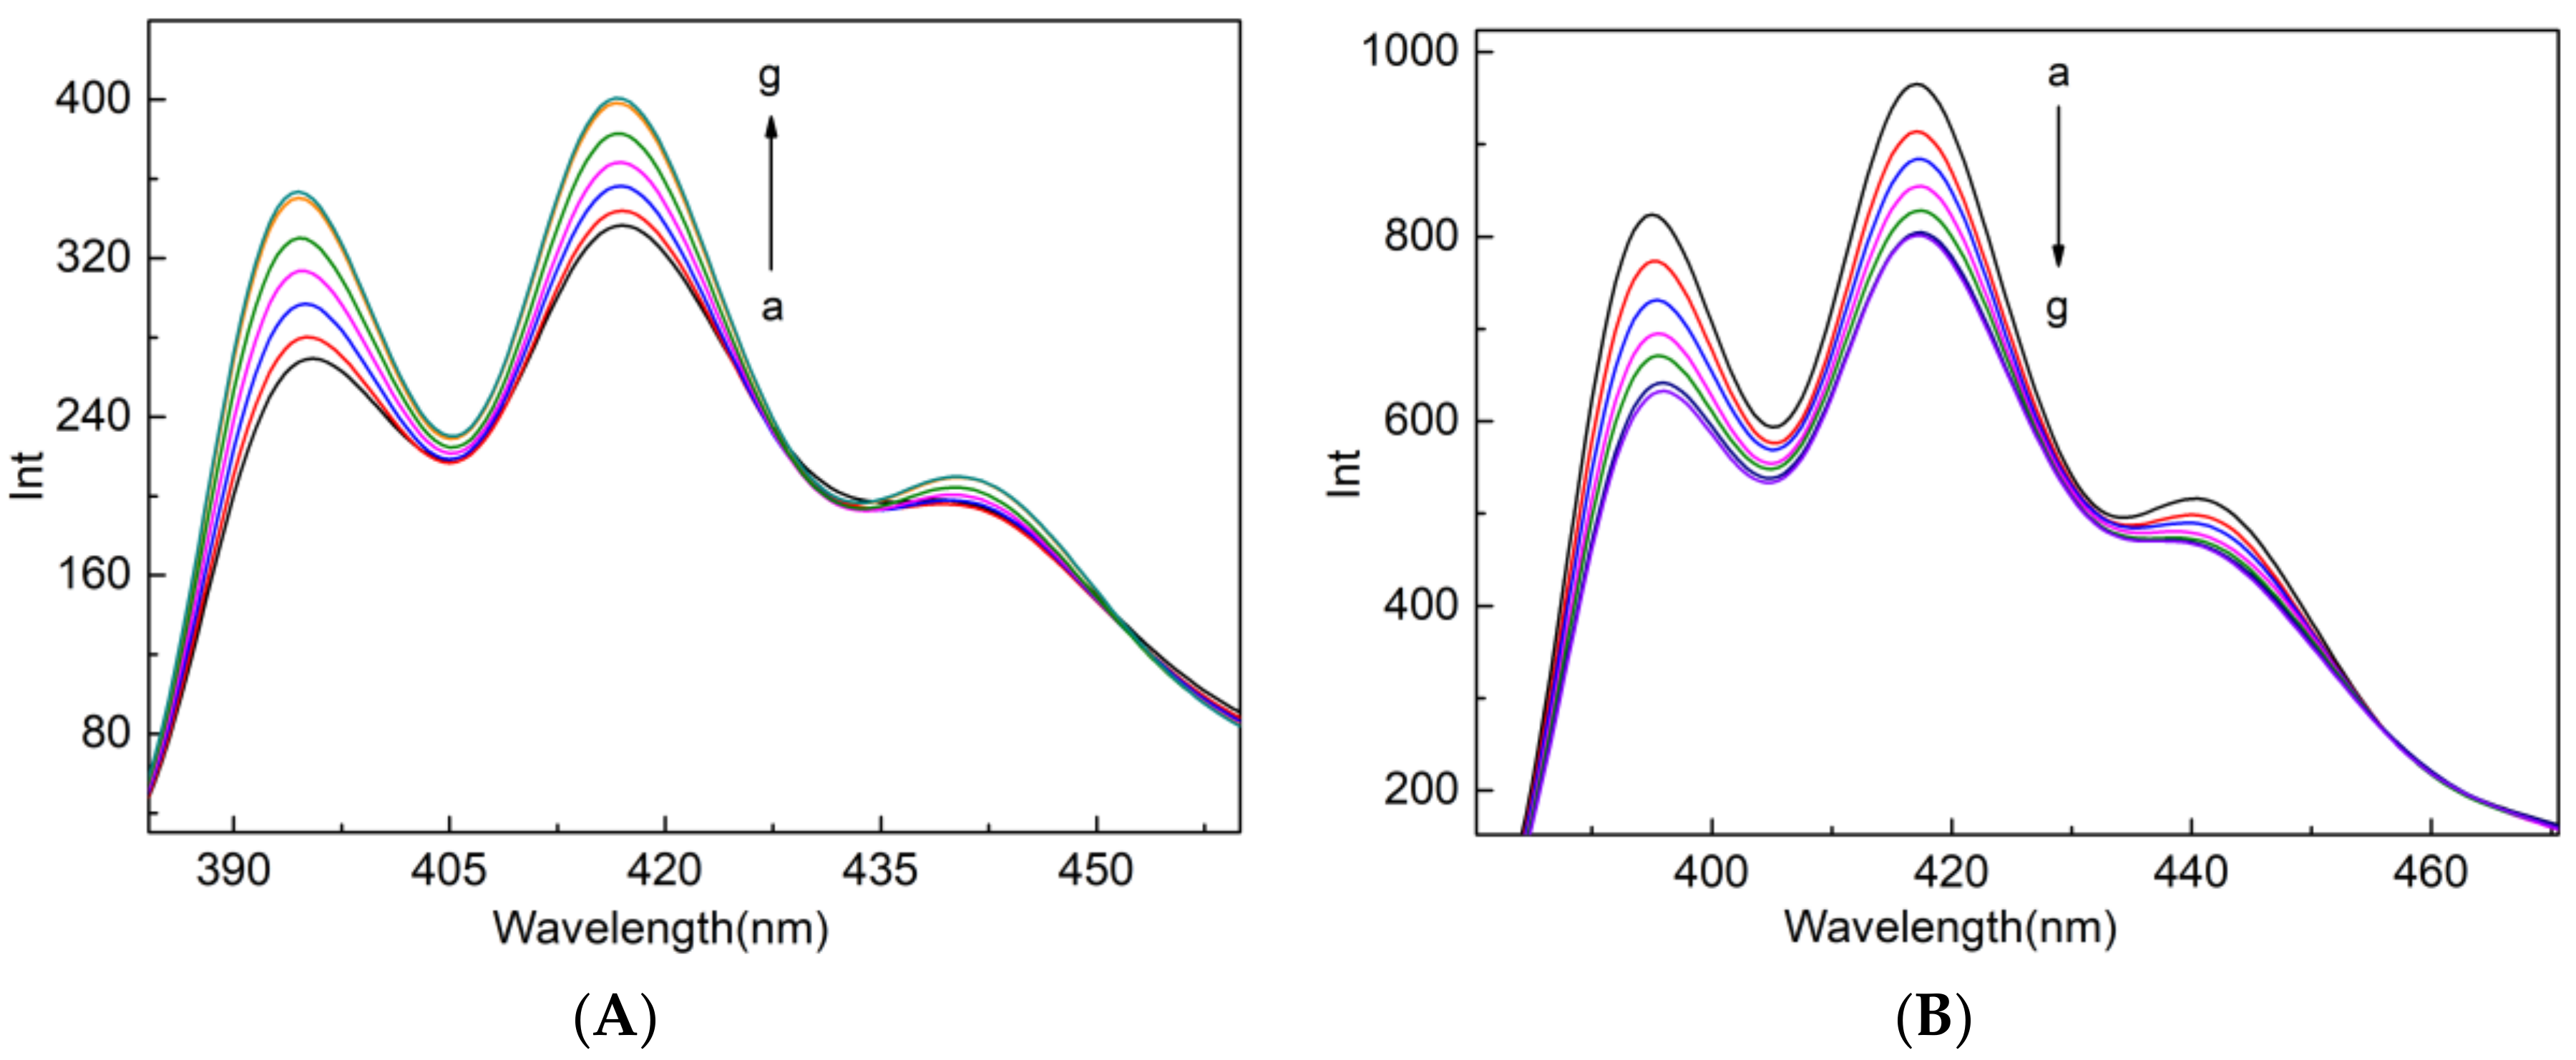
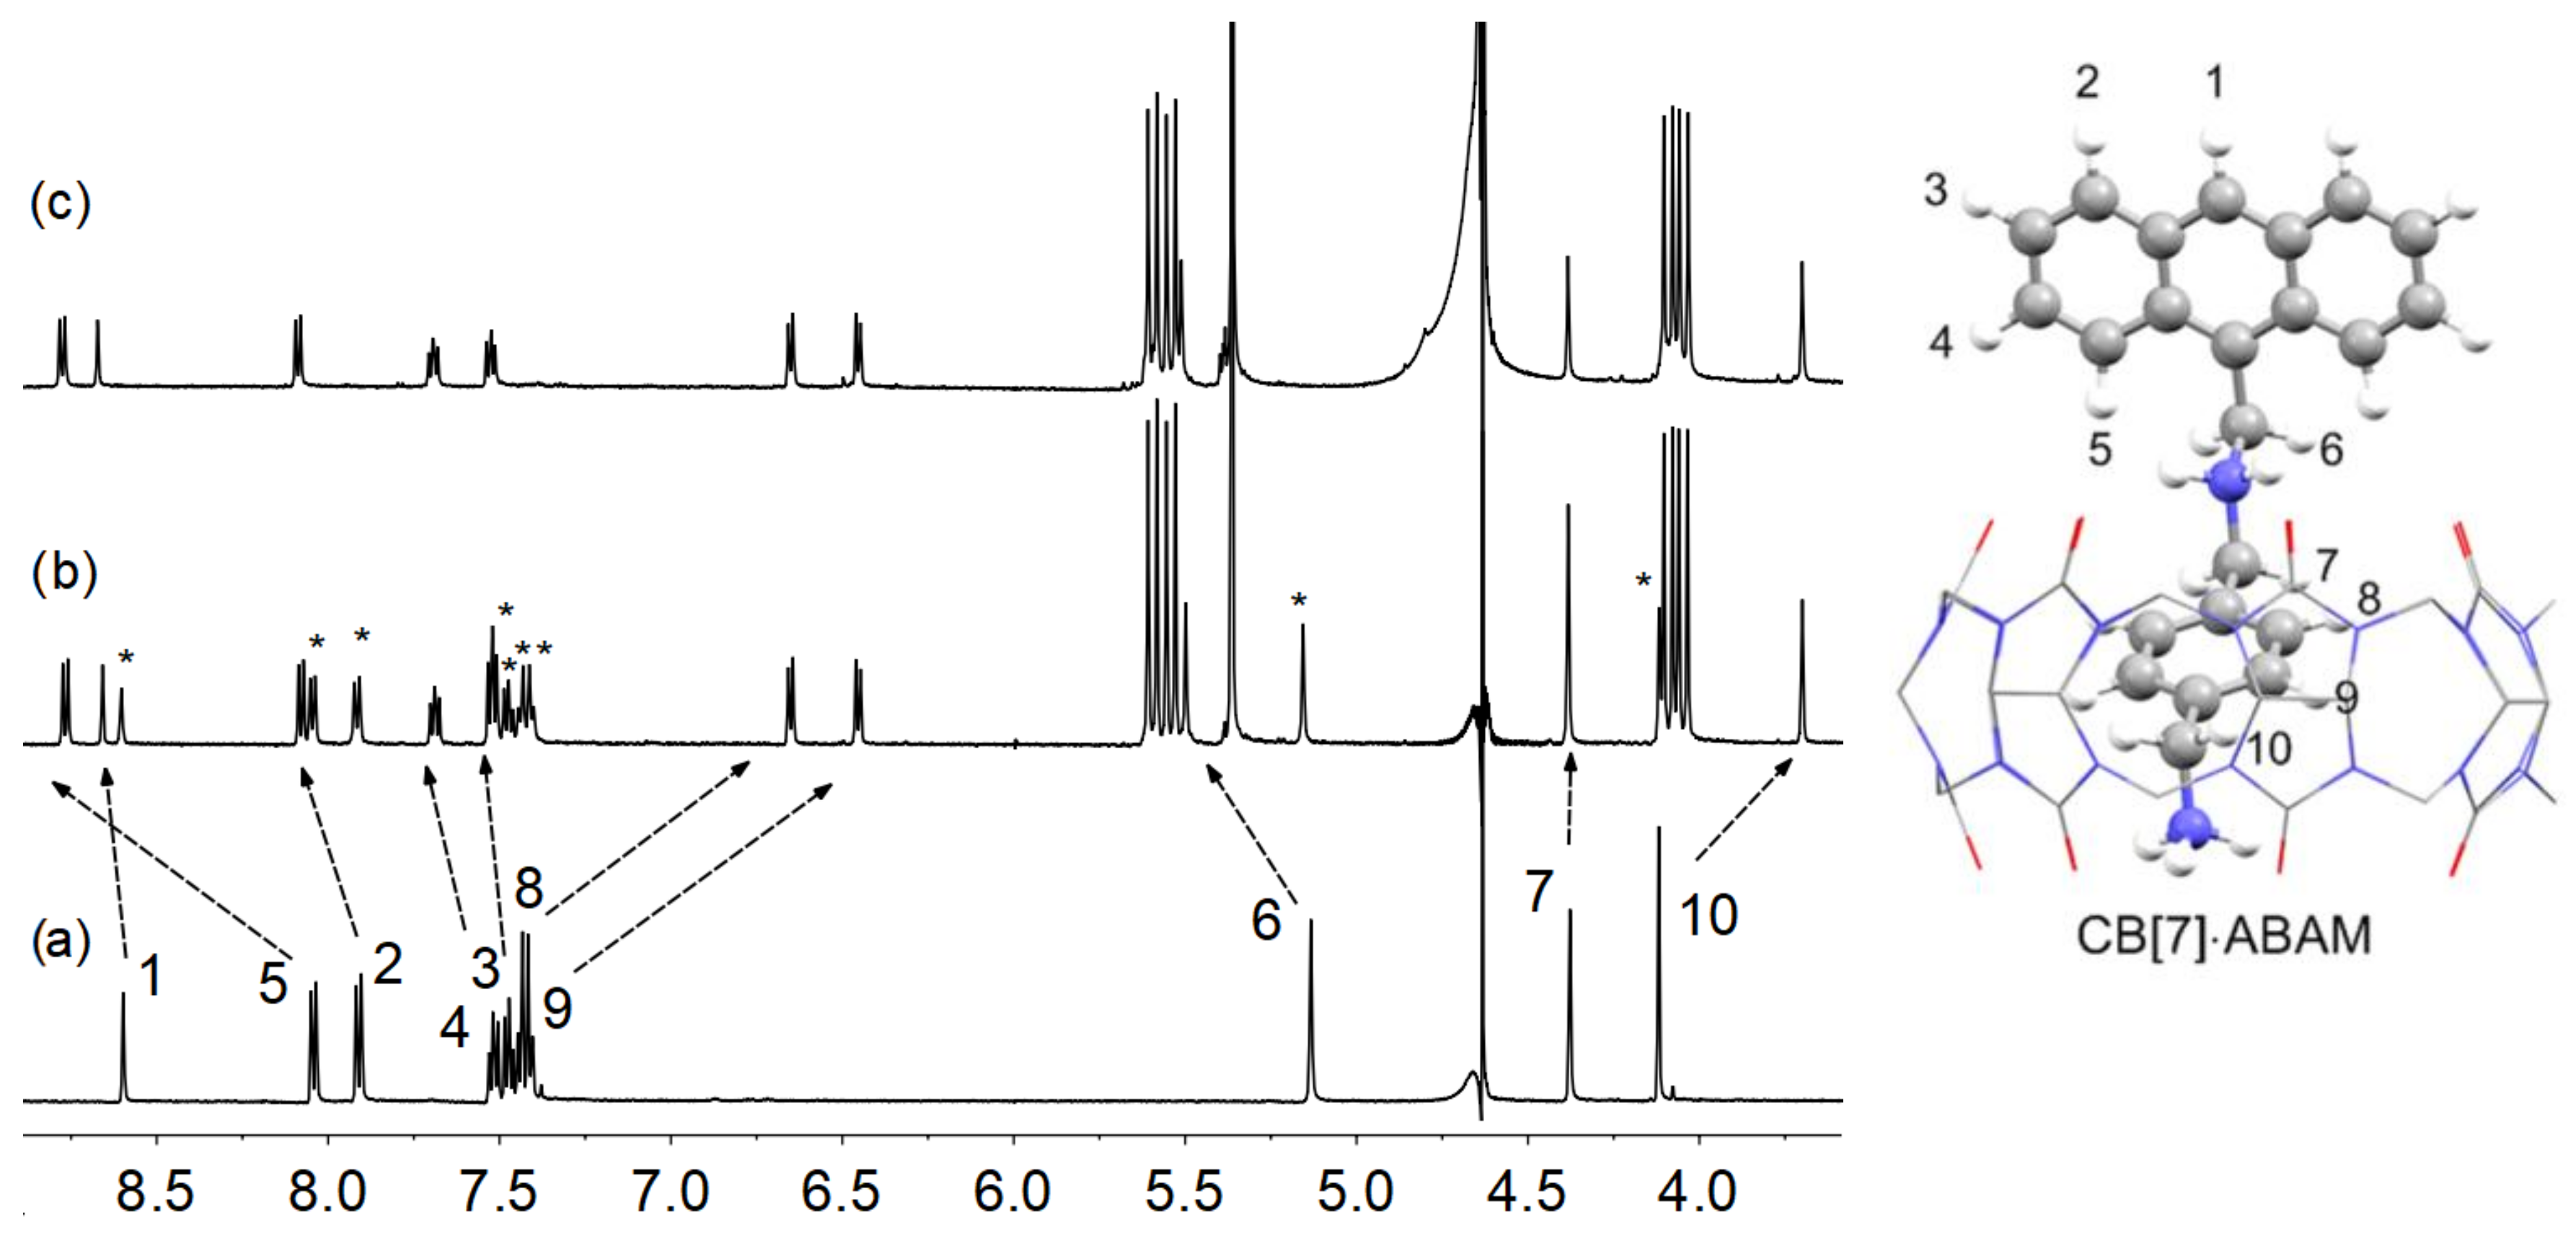
2.1. Binding Studies of the Fluorescent Indicator with CB[7]

The fluorescence indicator ABAM (as HCl salt) was synthesized by the reaction of 9-(chloromethyl) anthracene with 1,4-di(aminomethyl) benzene (Scheme 2 in Section 3). The binding between ABAM (as HCl salt) and CB[7] was first investigated by 1H NMR spectroscopy in D2O (Figure 2). As shown in Figure 2b, when the molar ratio between ABAM and CB[7] was 2:1, both free and bound peaks of ABAM molecule were observed, indicating the complexation-decomplexation processes between ABAM and CB[7] is slow exchange kinetics on the 1H NMR time scale. The resonance signals of H8, H9, as well as H10 protons shifted upfield significantly (Δδ = 0.79 ppm, 0.96 ppm, and 0.42 ppm respectively), suggesting the encapsulation of the 4-aminomethyl-benzyl moieties in the cavity of CB[7]. The signals of H5 and H6 protons shifted downfield significantly because of their location in the de-shielding region of CB[7]. The slight downfield shifts of H1-4 proton signals is caused by weakened π−π stacking interactions between anthracene moieties upon the encapsulation of ABAM in CB[7] [43]. Adding more than 1 eq. of CB[7] did not induce further chemical shifts of ABAM proton signals, indicating the 1:1 host-guest complexation between the indicator and CB[7]. Based on this, a plausible schematic configuration of the inclusion complex CB[7]·ABAM is given in Figure 2. Further, association constants of the CB[7]·ABAM complex as high as 8.7 × 10⁸ M−1 were obtained by 1H NMR competition experiment (Figure S4 and Table S1) [37].
Considering the pH value may have influence on fluorescence intensity changes in experiments, the pH value in all experiments for the detection of AMA was set as 4.70 using sodium acetate buffer (50 mM). The fluorescence changes of the indicator in the presence of CB[7] host were investigated. As shown in Figure 3A, with addition of CB[7] to the ABAM solution, the fluorescence intensity of ABAM was significantly increased. As with most introduced CB[7]-dye systems, the enhancement of fluorescence intensity of ABAM results from the dispersion of ABAM upon its inclusion in CB[7] [39]. Adding more than 1 eq. of CB[7] could not change fluorescence much, verifying the stable 1:1 host-guest complex formation of ABAM with CB[7]. These results are in agreement with the NMR consequences. Considering that protonation/deprotonation could influence the emission of dye molecules, we recorded the fluorescence of ABAM and ABAM·CB[7] under various pH values. The results indicate that the acidities of ABAM and CB[7]·ABAM are 8.8 and 11.5, respectively (Figure S5 and S6), which verifies that in the buffer (pH 4.70) the fluorescence changes of ABAM are completely irrelevant to the protonation/deprotonation of amino groups on ABAM. Additionally, the data proves the ability of CB[7] to increase the pKa value of the encapsulated guest molecule [44].

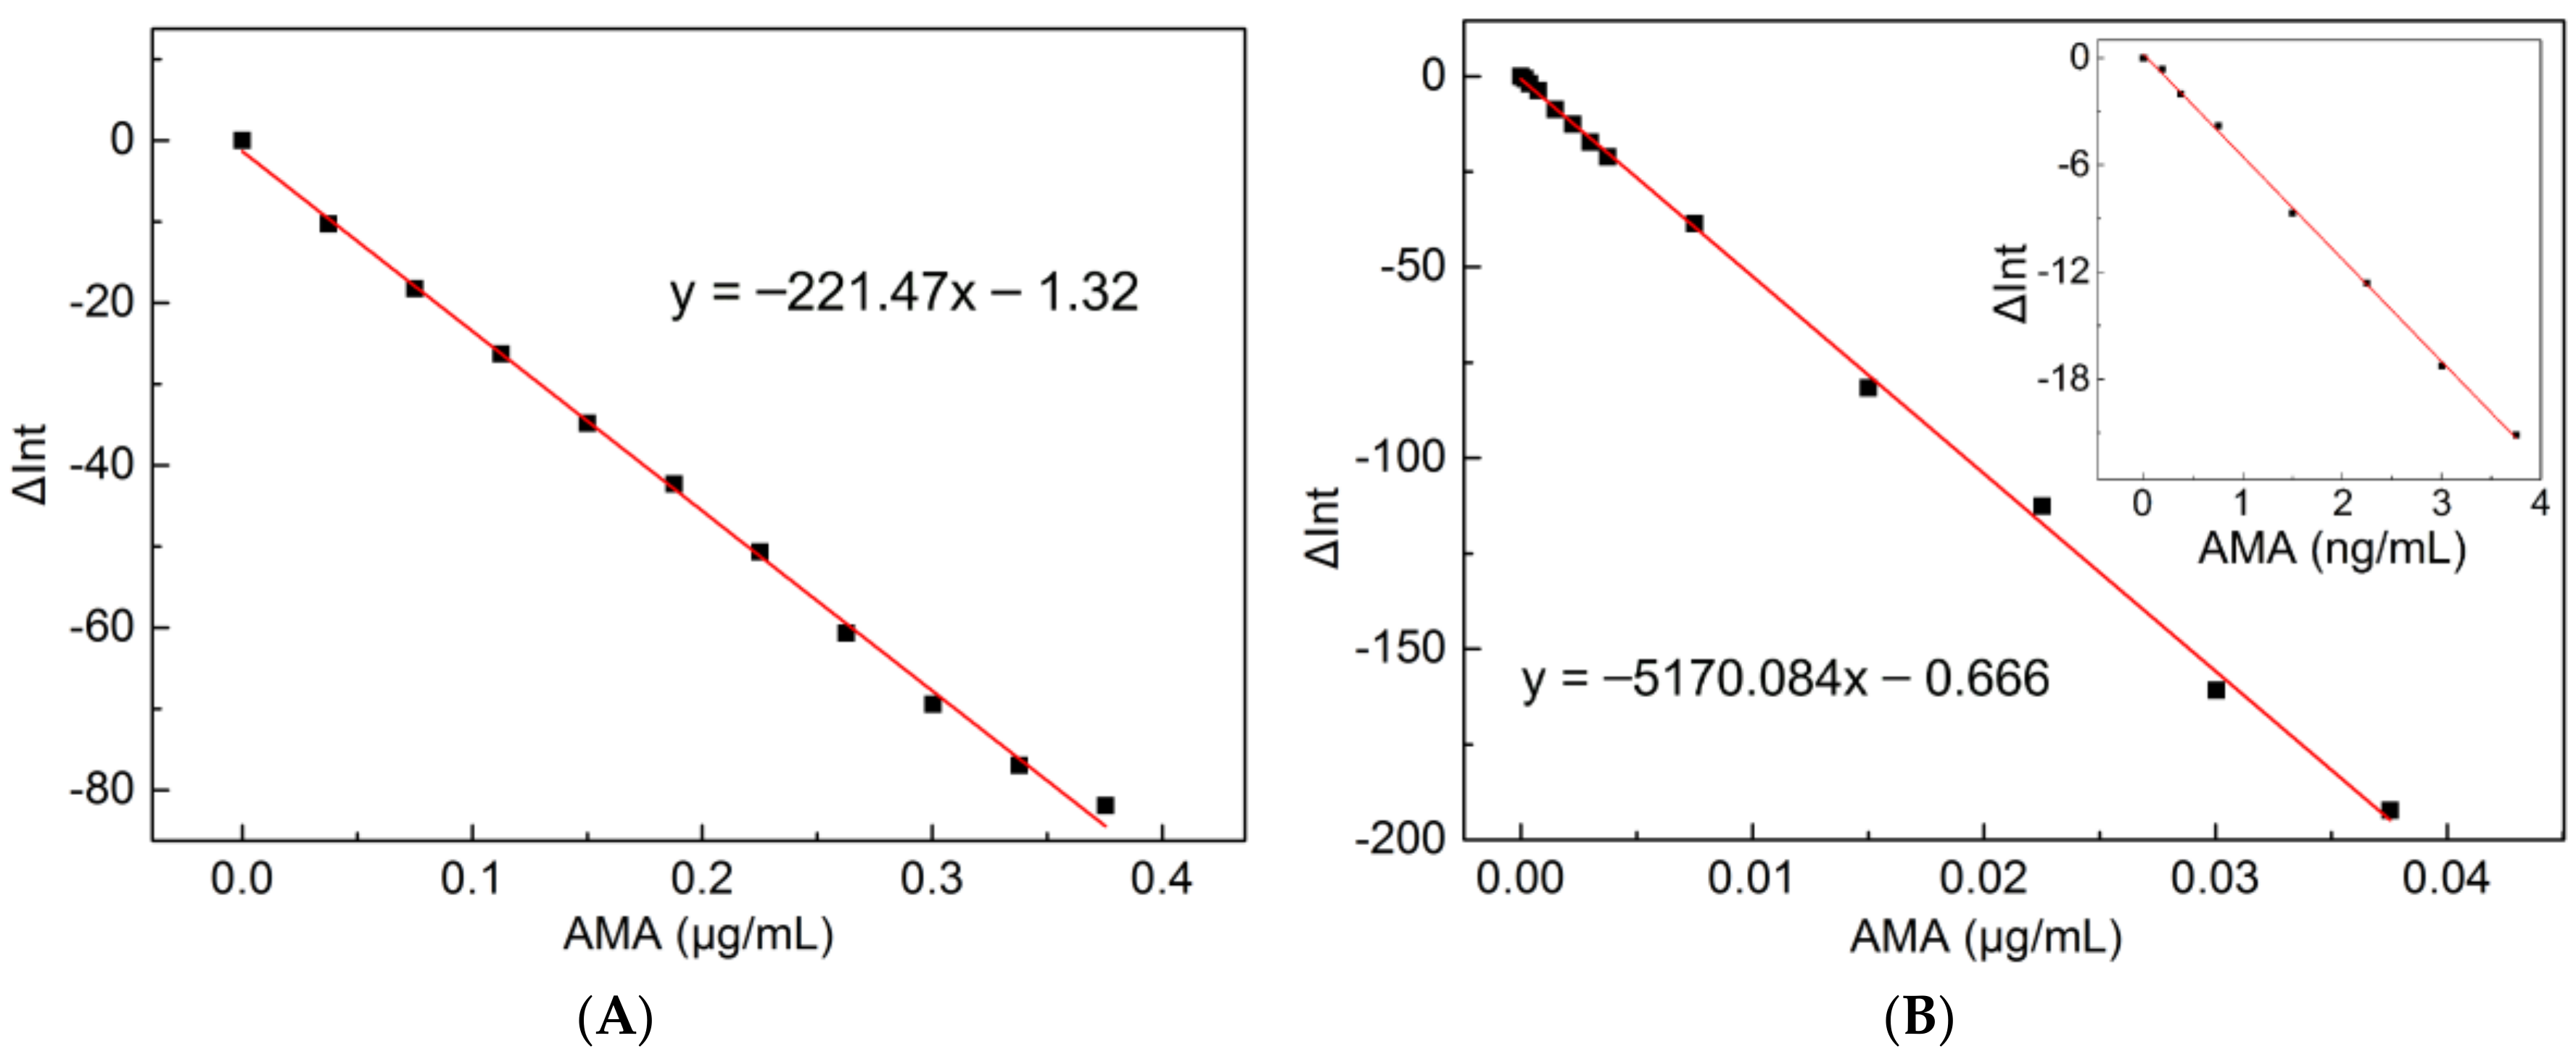
2.2. Plots of Standard Curve

Since the binding constant of CB[7]·AMA is ~3.5 order of magnitude higher than that of CB[7]·ABAM, it is expected that AMA can easily displace ABAM from the complex CB[7]·ABAM. Indeed, adding AMA (as HCl salt) into the solution of CB[7]·ABAM complex caused an obvious decrease of fluorescence intensity of CB[7]-ABAM system (Figure 3B). Similarly, after adding more than 1 eq. of AMA, the fluorescence intensity no longer decreased, because all of the indicator had been squeezed out of the cavity of CB[7]. Determining the proper concentration of the host-guest fluorescence system is crucial. If the concentration of probe system is too low, the sensitivity and accuracy could be low. Conversely, the high concentration may not help in determining the optimum detection limit of the analyte. After several attempts, we found the widest AMA detection range when the concentration of the host-guest probe system was 0.2 μM.
According to the changes of the fluorescence intensity of CB[7]-ABAM system as a function of the concentration of AMA, we plotted two standard curves for determining different ranges of AMA concentration (Figure 4) (the titration graphs are shown in Figures S7 and S8). When the concentrations of CB[7]-ABAM system are 2.0 μM (Figure 4A) and 0.2 μM (Figure 4B), the linear regression equations are y = −221.47x (μg/mL) − 1.32 and y = −5170.084x (μg/mL) − 0.666, respectively (y represents the change value of the fluorescence intensity, x represents the mass concentration of AMA). The correlation coefficients of two equations are 0.998 and 0.999, indicating good linearity. The linear ranges are 0.0375–0.375 μg/mL and 0.000188–0.0375 μg/mL for AMA, respectively. These equations can be directly used for the detection of AMA in real samples according to the change value of fluorescence intensity of CB[7]-ABAM system. With the detection limit as 6.5 × 10⁻⁵ μg/mL, this method proved to have higher sensitivity for detecting AMA than any other method reported in the literature (Table 1).

2.3. Detection of AMA in Different Samples

We firstly investigated the effect of interfering substances on this fluorescent probe system. Four different veterinary drugs—ribavirin, doxycycline, levofloxacin and florfenicol—were selected. From the fluorescence titration (Figure S9) we can see, after adding these interfering molecule mixtures to the host-guest probe system, that the fluorescence intensity didn’t show any obvious change. Then, we tried to analyse the simulative samples. The four veterinary drugs mentioned above were mixed into the solution of AMA to simulate a real sample. Three simulated samples were prepared in which the concentrations of AMA were 150 nM, 25 nM and 5 nM, respectively. The concentration of each interfering molecule was 100 times higher than AMA, which means the total concentration of interfering substances was 400 times. A highly concentrated solution of the host-guest probe system in 50 mM NaOAc buffer was prepared, and then diluted to 0.2 μM with the simulative sample. The fluorescence intensity values of the solution (FICB[7]-ABAM-AMA) and the blank solution (FICB[7]-ABAM) were measured at 417 nm with an excitation wavelength of 366 nm (Figure S10). Again, the change value of the fluorescence intensity (ΔFI) was put into the equation to calculate the concentration of AMA. In Table 2, the almost 100% recovery value indicates the system has strong anti-interference capacity, with high accuracy when the concentration of AMA in the sample was as low as 25 nM (4.69 ng/mL). Even when the concentration of AMA in the sample was as low as 5 nM (0.94 ng/mL), a recovery value of 95% is good enough at such a low concentration. These results indicate that the fitting equations are very practical.
Furthermore, the real pharmaceutical formulation was tested. The amantadine hydrochloride tablet was obtained from Northeast Pharm. Each tablet contains: acetaminophen 250 mg, AMA hydrochloride 100 mg, artificial bezoar 10 mg, caffeine 15 mg, and chlorpheniramine maleate 2 mg. The other accessories include starch, magnesium stearate, hydroxypropyl cellulose. Weighed tablets were carefully pulverized, placed and sonicated with water in a 100 mL calibrated flask, and then the solution was filtered. AMA hydrochloride was regarded as undergoing no loss in the filtering operation, due to its good water solubility in buffer solution (pH 4.70). The solution of AMA sample was further diluted to 100 nM, according to the AMA content per tablet in the drug instructions. The measuring operation was the same as that for the simulative samples. On the basis of this method, the detected concentration of AMA was 96.56 nM, and the recovery was up to 96.6% (Figure S11).

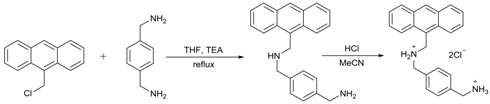
3. Materials and Methods

3.1. Materials

CB[7] was prepared according to the corresponding procedures in the literature [26]. Other compounds used in this study were purchased from commercial suppliers and used without further purification.
Synthesis of ABAM:
1,4-di(aminomethyl) benzene (0.48 g, 3.53 mmol) and triethylamine (0.45 mL, 3.11 mmol) were mixed in 30 mL dry THF in a flask, stirring at room temperature for an hour. After that, 9-(chloromethyl) anthracene (0.40 g, 1.76 mmol) was added slowly to the solution, and the mixture was refluxed overnight. The mixture was filtered and evaporated to yield a yellow solid, which was purified by column chromatography with a 20:1 mixture of methylene dichloride/methanol. The product (Rf = 0.34) was collected as a pale yellow solid-ABAM (340 mg, 60%). Dissolving the pure product into acetonitrile, bubbling hydrogen chloride gas in the solution, and then a white precipitate formed. The precipitate was collected and dried to give ABAM hydrochloride (390 mg, 94%). 1H NMR (600 MHz D2O) δ (ppm) = 4.12 (s, 2H, CH2), 4.38 (s, 2H, CH2), 5.14 (s, 2H, CH2), 7.42 (m, 2H, CH), 7.44 (d, 2H, CH), 7.43 (t, 2H, CH), 7.52 (t, 2H, CH), 7.92 (d, 2H, CH), 8.05 (d, 2H, CH), 8.60 (s, 1H, CH). 13C NMR (150 MHz D2O) δ (ppm) = 134.18, 130.94, 130.84, 130.27, 130.03, 129.67, 129.46, 129.18, 127.35, 125.27, 121.78, 119.78, 50.15, 42.59, 40.65. ESI-MS (positive ion): m/z 327.19 [ABAM + H+]+ (calcd. C23H23N2+ 327.18).

3.2. Instrumentation

NMR spectra (1H, 13C and COSY) were collected on Agilent 600 MHz DD2. Mass spectrometry was performed using a Bruker Agilent 1290-micrOTOF Q II. Fluorescence spectra were measured on a PerkinElmer LS-55 machine, with an excitation wavelength of 366 nm.

3.3. Determination of Krel

We use Equation (1) to determine Krel for the interaction of ABAM and p-xylylenediamine (PXDA) for CB[7]. For this purpose, we prepared a solution containing CB[7] (1.0 mM), ABAM (1.0 mM), PXDA (1.0 mM) and allowed it to reach equilibrium. Next, we determined the relative concentration of CB[7]·ABAM by integration of the appropriate resonances in the 1H NMR spectrum.
Krel = ([CB[7]·PXDA][ABAM]free)/([CB[7]·ABAM][PXDA]free)
[PXDA]Total = 1mM = [PXDA]free + [CB[7]·PXDA]
[ABAM]Total = 1mM = [ABAM]free + [CB[7]·ABAM]
[CB[7]·PXDA] = 1 − [CB[7]·ABAM]

4. Conclusions

In summary, we have designed a new indicator compound ABAM bearing benzylamine unit as the binding group for CB[7] host and anthracene group as the chromophore. The high association constant of ABAM with CB[7] of up to 8.7 × 10⁸ M−1 suggests the strong anti-interference performance of the CB[7]-indicator system; the strong emission of the fluorescent probe at low concentration implies the low detection limit of the system. Indeed, through indicator displacement assay, we were able to fit the data to get nice linear equations, which could then be used in real sample detection. Further investigations revealed that as we expected, this system shows a low detection limit (6.5 × 10⁻⁵ μg/mL, the lowest detection limit ever reported) and strong anti-interference capacity. In combination with its easy synthesis and purification process, this system could be of great significance to the detection of AMA concentration in drugs and other samples, such as animal meats.

Supplementary Materials

The following are available online, Figures S1–S3: NMR spectrum of fluorescence indicator (ABAM hydrochloride); Figure S4: Competitive binding 1H NMR spectrum; Table S1: Results of the determination of Krel; Figures S5 & S6: The fluorescence intensity changes of ABAM and CB[7]·ABAM with different pH; Figures S7 & S8: Fluorescence spectra recorded for CB[7]·ABAM with addition of AMA; Figure S9: Fluorescence spectra recorded for CB[7]·ABAM in the presence of interference sample; Figures S10 & S11: Fluorescence spectra recorded for CB[7]·ABAM for determining the concentration of AMA in samples.

Acknowledgments

This work was financially supported by the National Natural Science Foundation of China (Nos. 21472143, 21604066 and 21372183), the Thousand Youth Talents Program of China, and Program for Innovative Teams of Outstanding Young and Middle-aged Researchers in the Higher Education Institutions of Hubei Province (No. T201602).

Author Contributions

F.L. and S.L. conceived and designed the experiments; L.Z. performed the experiments; L.Z. and Z.Z. and X.Z. analysed the data; H.Z. contributed reagents/materials/analysis tools; L.Z. and S.L. wrote the paper.

Conflicts of Interest

The authors declare no conflict of interest.

References

  1. Davies, W.L.; Grunert, R.R.; Haff, R.F.; Mcgahen, J.W.; Neumayer, E.M.; Paulshock, M.; Watts, J.C.; Wood, T.R.; Hermann, E.C.; Hoffmann, C.E. Antiviral activity of 1-adamantanamine (amantadine). Science 1964, 144, 862–863. [Google Scholar] [CrossRef] [PubMed]
  2. Oxford, J.S.; Galbraith, A. Antiviral activity of amantadine: a review of laboratory and clinical data. Pharmacol. Ther. 1980, 11, 181–262. [Google Scholar] [CrossRef]
  3. Dobrovolny, H.M.; Gieschke, R.; Davies, B.E.; Jumbe, N.L.; Beauchemin, C.A. Neuraminidase inhibitors for treatment of human and avian strain influenza: A comparative modeling study. J. Theor. Biol. 2011, 269, 234–244. [Google Scholar] [CrossRef] [PubMed]
  4. Dal, P.F.; Thiry, E. Antiviral chemotherapy in veterinary medicine: current applications and perspectives. Rev. Sci. Tech. 2014, 33, 791–801. [Google Scholar]
  5. Hayden, F.G. Antivirals for influenza: Historical perspectives and lessons learned. Antivir. Res. 2006, 71, 372–378. [Google Scholar] [CrossRef] [PubMed]
  6. Chan, D.; Tarbin, J.; Sharman, M.; Carson, M.; Smith, M.; Smith, S. Screening method for the analysis of antiviral drugs in poultry tissues using zwitterionic hydrophilic interaction liquid chromatography/tandem mass spectrometry. Anal. Chim. Acta 2011, 700, 194–200. [Google Scholar] [CrossRef] [PubMed]
  7. He, G.; Qiao, J.; Dong, C.; He, C.; Zhao, L.; Tian, Y. Amantadine resistance among H5N1 avian influenza viruses isolated in Northern China. Antivir. Res. 2008, 77, 72–76. [Google Scholar] [CrossRef] [PubMed]
  8. Dou, Y.; Sun, Y.; Ren, Y.; Ju, P.; Ren, Y. Simultaneous non-destructive determination of two components of combined paracetamol and amantadine hydrochloride in tablets and powder by NIR spectroscopy and artificial neural networks. J. Pharm. Biomed. 2005, 37, 543–549. [Google Scholar] [CrossRef] [PubMed]
  9. Titova, A.V.; Arzamastsev, A.P.; Gretskii, S.V. Analysis of rimantadine hydrochloride by near-infrared spectroscopy. Pharm. Chem. J. 2009, 43, 534–537. [Google Scholar] [CrossRef]
  10. Tsuruoka, Y.; Nakajima, T.; Kanda, M.; Hayashi, H.; Matsushima, Y.; Yoshikawa, S.; Nagata, M.; Koike, H.; Nagano, C.; Sekimura, K.; et al. Simultaneous determination of amantadine, rimantadine, andmemantine in processed products, chicken tissues, and eggs by liquidchromatography with tandem mass spectrometry. J. Chromatogr. B 2017, 1044–1045, 142–148. [Google Scholar] [CrossRef] [PubMed]
  11. Farajzadeh, M.A.; Nouri, N.; Nabil, A.A.A. Determination of amantadine in biological fluids using simultaneousderivatization and dispersive liquid–liquid microextraction followedby gas chromatography-flame ionization detection. J. Chromatog. B 2013, 940, 142–149. [Google Scholar] [CrossRef] [PubMed]
  12. Duh, T.H.; Wu, H.L.; Pan, C.W.; Kou, H.S. Fluorimetric liquid chromatographic analysis of amantadine in urine and pharmaceutical formulation. J. Chromatogr. A 2005, 1088, 175–181. [Google Scholar] [CrossRef] [PubMed]
  13. Higashi, Y.; Nakamura, S.; Matsumura, H.; Fujii, Y. Simultaneous liquid chromatographic assay of amantadine and its four related compounds in phosphate-buffered saline using 4-fluoro-7-nitro-2,1,3-benzoxadiazole as a fluorescent derivatization reagent. Biomed. Chromatogr. 2006, 20, 423–428. [Google Scholar] [CrossRef] [PubMed]
  14. Xu, M.; Ju, W.; Xia, X.; Tan, H.; Chen, M.; Zhang, J.; Xiong, N.; Jiang, M.; Chen, L.; Gong, L. Determination of rimantadine in rat plasma by liquid chromatography/electrospray mass spectrometry and its application in a pharmacokinetic study. J. Chromatogr. B 2008, 864, 123–128. [Google Scholar] [CrossRef] [PubMed]
  15. Cui, S.J.; Fang, F.; Han, L.; Ming, M. New method for high-performance liquid chromatographic determination of amantadine and its analogues in rat plasma. J. Pharm. Biomed. 2007, 44, 1100–1105. [Google Scholar]
  16. Askal, H.F.; Khedr, A.S.; Darwish, I.A.; Mahmoud, R.M. Quantitative thin-layer chromatographic method for determination of amantadine hydrochloride. Int. J. Biomed. Sci. 2008, 4, 155–160. [Google Scholar] [PubMed]
  17. Yeh, H.H.; Yang, Y.H.; Chen, S.H. Simultaneous determination of memantine and amantadine in human plasma as fluorescein derivatives by micellar electrokinetic chromatography with laser-induced fluorescence detection and its clinical application. Electrophoresis 2010, 31, 1903–1911. [Google Scholar] [CrossRef] [PubMed]
  18. Pazourek, J.; Revilla, A.L.; Gajdosová, D.; Havel, J. Validation of a capillary zone electrophoresis method for determination of rimantadine hydrochloride in rimantadin100 Tablets and the method application to dissolution test monitoring. Drug. Dev. Ind. Pharm. 2004, 30, 125–134. [Google Scholar] [CrossRef] [PubMed]
  19. Reichová, N.; Pazourek, J.; Polásková, P.; Havel, J. Electrophoretic behavior of adamantane derivatives possessing antiviral activity and their determination by capillary zone electrophoresis with indirect detection. Electrophoresis 2002, 23, 259–262. [Google Scholar] [CrossRef]
  20. Abdel-Ghani, N.T.; Shoukry, A.F.; Hussein, S.H. Flow injection potentiometric determination of amantadine HCl. J. Pharm. Biomed. 2002, 30, 601–611. [Google Scholar] [CrossRef]
  21. Jalali, F.; Maghooli, R. Potentiometric Determination of trace amounts of amantadine using a modified carbon-paste electrode. Anal. Sci. 2009, 25, 1227–1230. [Google Scholar] [CrossRef] [PubMed]
  22. Mahmoud, A.M.; Khalil, N.Y.; Darwish, I.A.; Aboul-Fadl, T. Selective spectrophotometric and spectrofluorometric methods for the determination of amantadine hydrochloride in capsules and plasma via derivatization with 1,2-Naphthoquinone-4-sulphonate. Int. J. Anal. Chem. 2009, 2009, 1–8. [Google Scholar] [CrossRef] [PubMed]
  23. Darwish, I.A.; Khedr, A.S.; Askal, H.F.; Mahmoud, R.M. Simple fluorimetric method for determination of certain antiviral drugs via their oxidation with cerium (IV). Rev. Bras. Farmacogn. 2005, 60, 555–562. [Google Scholar] [CrossRef] [PubMed]
  24. Mustafa, A.A.; Abdel-Fattah, S.A.; Toubar, S.S.; Sultan, M.A. Spectrophotometric determination of acyclovir and amantadine hydrochloride through metals complexation. J. Anal. Chem. 2004, 59, 33–38. [Google Scholar] [CrossRef]
  25. Kim, J.; Jung, I.S.; Kim, S.Y.; Lee, E.; Kang, J.K.; Sakamoto, S.; Yamaguchi, K.; Kim, K. New Cucurbituril Homologues: Syntheses, Isolation, Characterization, and X-ray Crystal Structures of Cucurbit[n]uril (n = 5, 7, and 8). J. Am. Chem. Soc. 2000, 122, 540–541. [Google Scholar] [CrossRef]
  26. Day, A.; Arnold, A.P.; Blanch, R.J.; Snushall, B. Controlling factors in the synthesis of cucurbituril and its homologues. J. Org. Chem. 2001, 66, 8094–8100. [Google Scholar] [CrossRef] [PubMed]
  27. Li, Q.; Qiu, S.C.; Zhang, J.; Chen, K.; Huang, Y.; Xiao, X.; Zhang, Y.; Li, F.; Zhang, Y.Q.; Xue, S.F.; et al. Twisted Cucurbit[n]urils. Org. Lett. 2016, 18, 4020–4023. [Google Scholar] [CrossRef] [PubMed]
  28. Lagona, J.; Mukhopadhyay, P.; Chakrabarti, S.; Isaacs, L. The Cucurbit[n]uril Family. Angew. Chem. Int. Ed. 2005, 44, 4844–4870. [Google Scholar] [CrossRef] [PubMed]
  29. Masson, E.; Ling, X.; Joseph, R.; Kyeremeh, M.L.; Lu, X. Cucurbituril chemistry: A tale of supramolecular success. RSC Adv. 2012, 2, 1213–1247. [Google Scholar] [CrossRef]
  30. Assaf, K.I.; Nau, W.M. Cucurbiturils: from synthesis to high-affinity binding and catalysis. Chem. Soc. Rev. 2015, 44, 394–418. [Google Scholar] [CrossRef] [PubMed]
  31. Barrow, S.J.; Kasera, S.; Rowland, M.J.; Barrio, J.D.; Scherman, O.A. Cucurbituril-Based Molecular Recognition. Chem. Rev. 2015, 115, 12320–12406. [Google Scholar] [CrossRef] [PubMed]
  32. Shetty, D.; Khedkar, J.K.; Park, K.M.; Kim, K. Can we beat the biotin-avidin pair? cucurbit[7]uril-based ultrahigh affinity host-guest complexes and their applications. Chem. Soc. Rev. 2015, 44, 8747–8761. [Google Scholar] [CrossRef] [PubMed]
  33. Tian, J.; Wang, H.; Zhang, D.; Liu, Y.; Li, Z. Supramolecular organic frameworks (SOFs): Homogeneous regular 2D and 3D pores in water. Natl. Sci. Rev. 2017, 4, 426–436. [Google Scholar] [CrossRef]
  34. Gao, R.H.; Chen, L.X.; Chen, K.; Tao, Z.; Xiao, X. Development of hydroxylated cucurbit[n]urils, their derivatives and potential applications. Coord. Chem. Rev. 2017, 348, 1–24. [Google Scholar] [CrossRef]
  35. Kuok, K.I.; Li, S.; Wyman, I.W.; Wang, R. Cucurbit[7]uril: An emerging candidate for pharmaceutical excipients. Ann. N.Y. Acad. Sci. 2017, 1398, 108–119. [Google Scholar] [CrossRef] [PubMed]
  36. Yang, X.; Liu, F.; Zhao, Z.; Liang, F.; Zhang, H.; Liu, S. Cucurbit[10]uril-based chemistry. Chin. Chem. Lett. 2018. [Google Scholar] [CrossRef]
  37. Liu, S.; Ruspic, C.; Mukhopadhyay, P.; Chakrabarti, S.; Zavalij, P.Y.; Isaacs, L. The cucurbit[n]uril family: Prime components for self-sorting systems. J. Am. Chem. Soc. 2005, 127, 15959–15967. [Google Scholar] [CrossRef] [PubMed]
  38. Moghaddam, S.; Yang, C.; Rekharsky, M.; Ko, Y.H.; Kim, K.; Inoue, Y.; Gilson, M.K. New ultrahigh affinity host-guest complexes of cucurbit[7]uril with bicyclo[2.2.2]octane and adamantane guests: Thermodynamic analysis and evaluation of M2 affinity calculations. J. Am. Chem. Soc. 2011, 133, 3570–3581. [Google Scholar] [CrossRef] [PubMed]
  39. Dsouza, R.N.; Pischel, U.; Nau, W.M. Fluorescent dyes and their supramolecular host/guest complexes with macrocycles in aqueous solution. Chem. Rev. 2011, 111, 7941–7980. [Google Scholar] [CrossRef] [PubMed]
  40. Ghale, G.; Nau, W.M. Dynamically analyte-responsive macrocyclic host−fluorophore systems. Acc. Chem. Res. 2014, 47, 2150–2159. [Google Scholar] [CrossRef] [PubMed]
  41. Wang, G.Q.; Qin, Y.F.; Du, L.M.; Li, J.F.; Jing, X.; Chang, Y.X.; Wu, H. Determination of amantadine and rimantadine using a sensitive fluorescent probe. Spectrochem. Acta A 2012, 98, 275–281. [Google Scholar] [CrossRef] [PubMed]
  42. Yang, H.; Liu, Y.L.; Yang, L.L.; Liu, K.; Wang, Z.Q.; Zhang, X. Cucurbit[7]uril as a ‘‘protective agent’’: Controlling photochemistry and detecting 1-adamantanamine. Chem. Commun. 2013, 49, 3905–3907. [Google Scholar] [CrossRef] [PubMed]
  43. Kuang, S.; Hu, Z.; Zhang, H.; Zhang, X.; Liang, F.; Zhao, Z.; Liu, S. Enhancement of metal–metal interactions inside a large-cavity synthetic host in water. Chem. Commun. 2018, 54, 2169–2172. [Google Scholar] [CrossRef] [PubMed]
  44. Ghosh, I.; Nau, W.M. The strategic use of supramolecular pKa shifts to enhance the bioavailability of drugs. Adv. Drug. Deliv. Rev. 2012, 64, 764–783. [Google Scholar] [CrossRef] [PubMed]
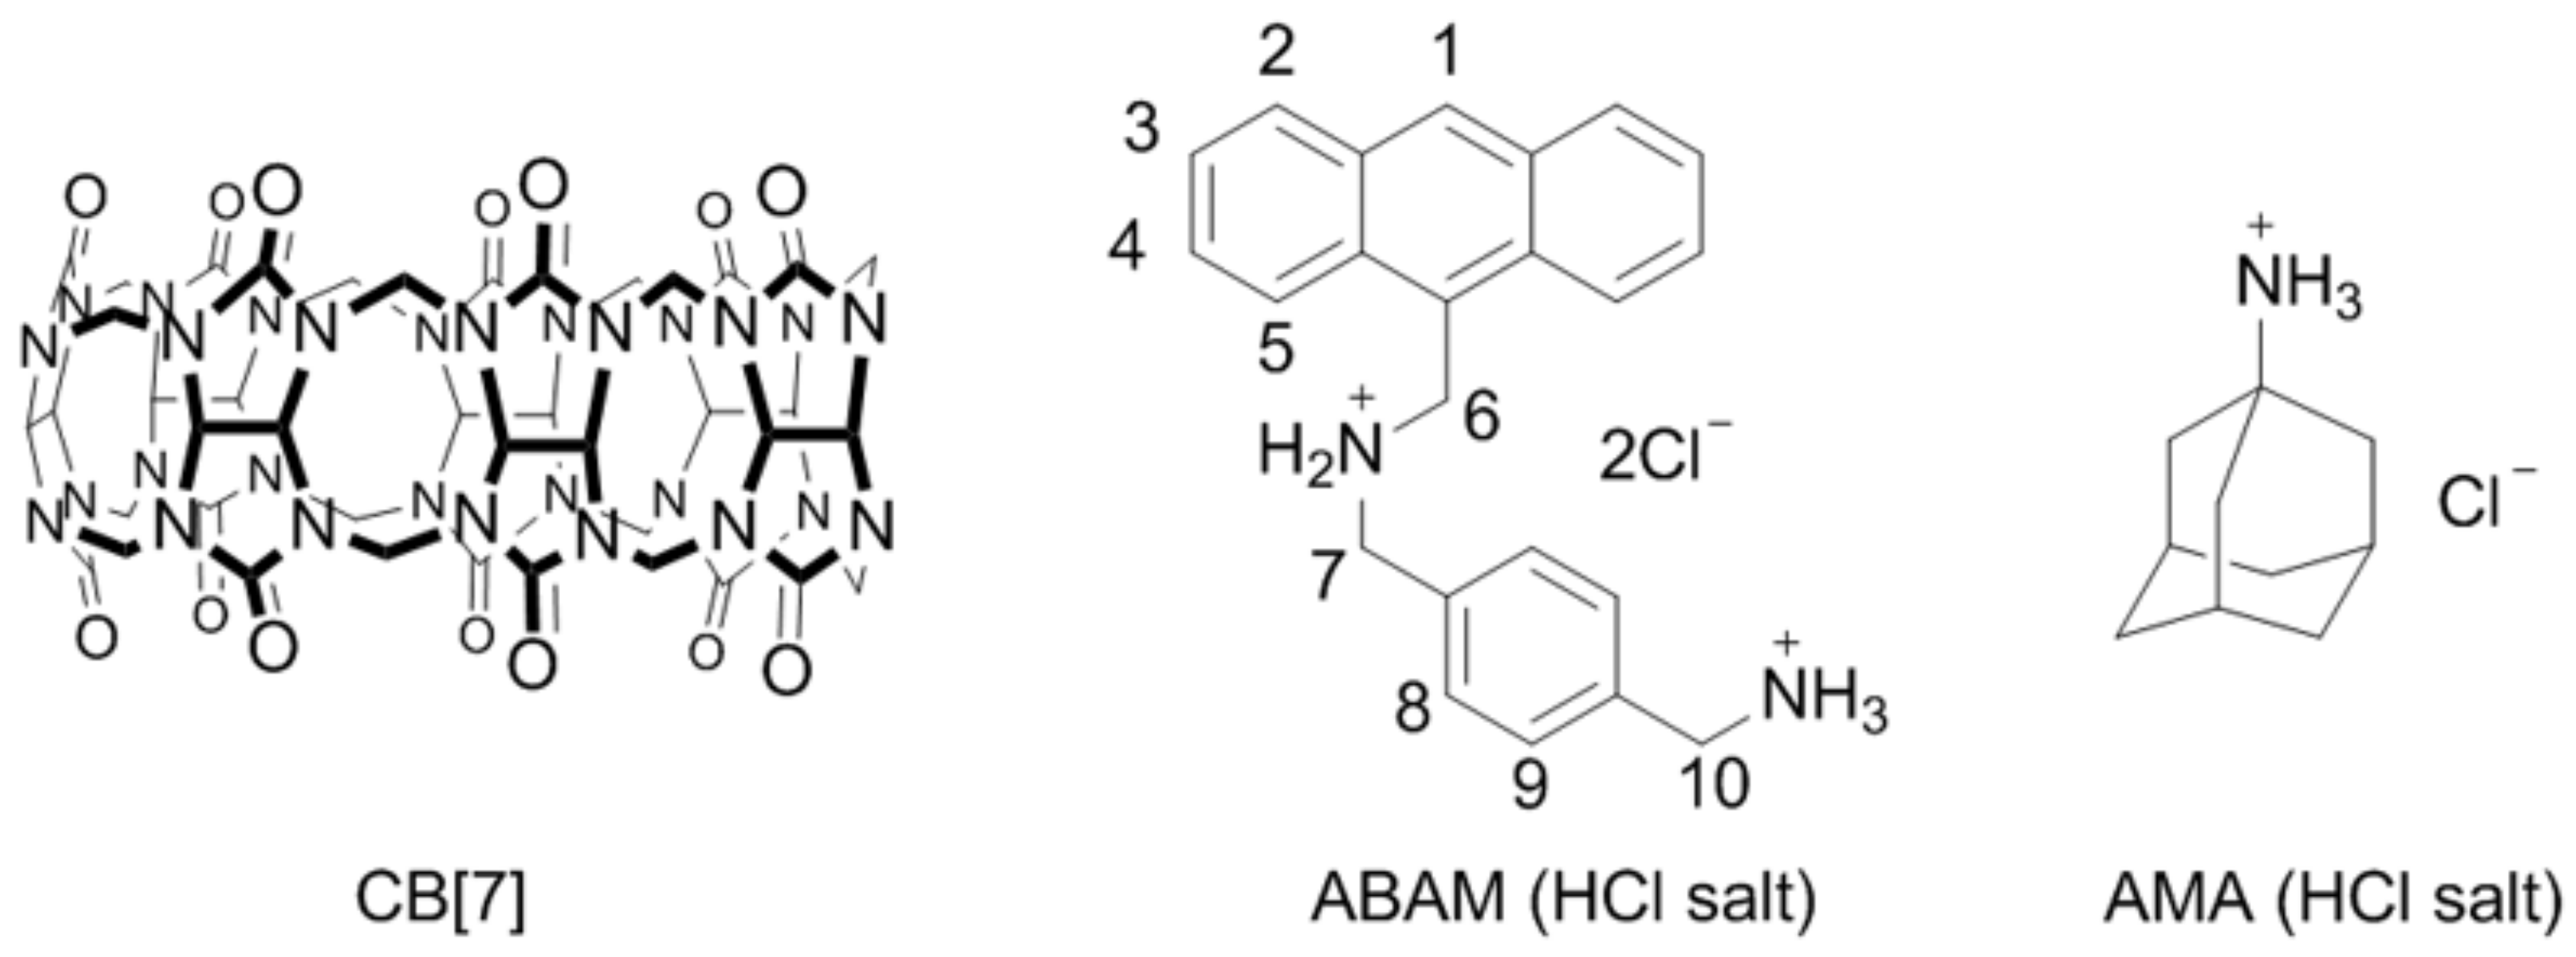
Sample Availability: Samples of the compounds ABAM and CB[7] are available from the authors.
Figure 1. The structures of CB[7], ABAM, and AMA.
Molecules 23 00947 g001
Scheme 1. Schematic representation of the principle of indicator displacement assay for the detection of AMA using the complex CB[7]·ABAM as a fluorescent probe.
Molecules 23 00947 sch001
Scheme 2. Synthesis of fluorescence indicator ABAM (as HCl salt).
Molecules 23 00947 sch002
Figure 2. 1H NMR spectra (600 MHz, D2O, 298 K) of: (a) free ABAM (1.0 mM); (b) 2:1 mixture of ABAM and CB[7] (resonances of free ABAM are marked with *); (c) 1:1 mixture of ABAM and CB[7]. The plausible schematic configuration of the inclusion complex CB[7]·ABAM.
Molecules 23 00947 g002
Figure 3. (A) Fluorescence spectra of the ABAM with addition of CB[7]: (a) 0; (b) 0.2 eq.; (c) 0.4 eq.; (d) 0.6 eq.; (e) 0.8 eq.; (f) 1.0 eq.; (g) 1.2 eq. ([ABAM] = 2 μM, pH = 4.70, λexem = 366/417 nm, the excitation and emission monochromator bandpasses were set at 15 nm and 3 nm, respectively). (B) Fluorescence spectra of the ABAM in the presence of CB[7] with addition of AMA: (a) 0; (b) 0.2 eq.; (c) 0.4 eq.; (d) 0.6 eq.; (e) 0.8 eq.; (f) 1.0 eq.; (g) 1.2 eq. ([CB[7]·ABAM] = 0.2 μM, pH = 4.70, λexem = 366/417 nm, the excitation and emission monochromator bandpasses were set at 10 nm and 6 nm, respectively).
Molecules 23 00947 g003
Figure 4. (A) The standard curve of AMA ranging from 0.0375 μg/mL–0.375 μg/mL ([CB[7]·ABAM] = 2.0 μM, pH = 4.70, λexem = 366/417 nm). (B) The standard curve of AMA ranging from 0.000188 μg/mL–0.0375 μg/mL ([CB[7]·ABAM] = 0.2 μM, pH = 4.70, λexem = 366/417 nm).
Molecules 23 00947 g004
Table 1. Various methods and detection limits for the detection of AMA.
TechniqueSampleLinear Range (μg/mL)Minimum Working Level (μg/mL)Refs
HPLCBiological samples0.025~2.50.02[13]
LC-MS/MSRat plasma0.002~0.750.002[14]
MEKChuman plasma0.002~0.060.0005[17]
DLLMEurine0.0087~50.0027[11]
potentiometryblood-serum0.000118~0.0131.18 × 10−4[21]
SpectrofluorimertyTabellae urine0.004~0.90.0012[41]
SpectrofluorimertyTabellae0.000188~0.3756.5 × 10−5This work 1
1 Calculated with the molecular weight of AMA·HCl.
Table 2. Detecting result of simulative samples.
Setting Concentration of AMA (μg/mL)Δ IntCalculate Value (μg/mL)Recovery (%) ± S.D 1
0.0282 (150 nM)−144.060.02899.3 ± 0.34
0.00469 (25 nM)−24.860.0046899.8 ± 0.78
0.000939 (5 nM)−5.260.0008994.8 ± 1.09
1 Average of five determinations; all measurements were performed in 50 mM NaOAc buffer (pH = 4.70).

