Article

A Metabolomics Approach Uncovers Differences between Traditional and Commercial Dairy Products in Buryatia (Russian Federation)

1
Key Laboratory of Dairy Biotechnology and Engineering, Education Ministry of China, Inner Mongolia Agricultural University, Huhhot 010018, China
2
Key Laboratory of Dairy Products Processing, Ministry of Agricultural, Department of Food Science and Engineering, Inner Mongolia Agricultural University, Hohhot 010018, China
*
Author to whom correspondence should be addressed.
Molecules 2018, 23(4), 735; https://doi.org/10.3390/molecules23040735
Submission received: 8 February 2018 / Revised: 20 March 2018 / Accepted: 21 March 2018 / Published: 22 March 2018
(This article belongs to the Section Metabolites)

Abstract

:
Commercially available and traditional dairy products differ in terms of their manufacturing processes. In this study, commercially available and traditionally fermented cheese, yogurt, and milk beverages were analyzed and compared. The metabolomic technique of ultra-performance liquid chromatography-quadrupole-time of flight mass spectrometry (UPLC-Q-TOF) in the MSE mode was used in combination with statistical methods, including univariate analysis and chemometric analysis, to determine the differences in metabolite profiles between commercially and traditionally fermented dairy products. The experimental results were analyzed statistically and showed that traditional and commercial dairy products were well differentiated in both positive and negative ion modes, with significant differences observed between the samples. After screening for metabolite differences, we detected differences between traditional milk beverages and yogurt and their commercial counterparts in terms of the levels of compounds such as l-lysine, l-methionine, l-citrulline, l-proline, l-serine, l-valine and l-homocysteine, and of short peptides such as Asp-Arg, Gly-Arg, His-Pro, Pro-Asn. The greatest difference between commercially available and traditional cheese was in the short peptide composition, as commercially available and traditional cheese is rich in short peptides.

Graphical Abstract

1. Introduction

The dairy industry has developed rapidly in recent years. Dairy products are a fundamental component of most people’s daily diets, and dairy products account for an increasing proportion of people’s caloric intake. Today, fermented food accounts for nearly 25–30% of the typical diet worldwide [1]. The dairy industry has also been a bright spot in the food industry due to its huge potential market and high rate of growth. Among dairy products, traditional fermented dairy products, such as fermented milk curd, cheese and yogurt are very rich in nutrients. Russia is a country with a long history and Buryatia is one of the member states of the Russian Federation. Due to their lifestyle the Mongolian people in Buryatia have abundant experience in making traditional dairy products. Jie et al. collected traditional dairy products including cheese from Buryatia and other parts of Russia. A total of 599 strains of lactic acid bacteria belonging to seven genera and 30 species were isolated. The dominant strains are Lactobacillus helveticus and Lactobacillus plantarum. The results demonstrate that the traditional dairy products from Russia have a complex lactic acid bacteria composition [2].
In traditional dairy products, Lactobacillus and yeast play important roles in determining flavor and aroma. The morphological diversity and variety of these microorganisms indicate a complex and stable biological environment [3,4,5]. However, due to a lack of in-depth research, certain deficiencies remain in terms of the flavor, texture and aroma of dairy products. Commercially available dairy products are produced according to the fermentation characteristics of commercial strains screened from traditional fermented dairy products having good characteristics. These optimized strains have been screened for stability and fermentation capability to obtain commercially viable dairy products. Dairy products fermented from a commercial starter culture are popular due to their unique flavor and high stability [6].
Fermented dairy products, which are consumed around the world, are produced by interactions among microorganisms. Lactic acid bacteria are commonly used in the starter culture. Koji, a fungus that has been consumed in Japan for over a thousand years, is used in the traditional Japanese fermented beverage amazake [7]. In one study, the components and functional compounds in koji were identified and analyzed using capillary electrophoresis time of flight mass spectrometry (CE-MS). The aim of this study was to explore the major differences between koji containing Lactobacillus sakei UONUMA and common koji amazake by means of metabolomics analysis. More than 300 compounds, including sugars, amino acids, organic acids and B-complex vitamins, were detected in koji amazake. Finally, 13 types of sugars, including two unknown trisaccharides, were identified. There was no significant difference in the bulk composition of the two koji amazake samples. However, lactic acid, vitamins B2 (riboflavin), B3 (nicotinic acid and nicotinamide), and B6 (pyridoxine) were significantly increased in koji amazake supplemented with lactic acid bacteria (LAF-amazake), while glutamine was decreased. LAF-amazake also produced the well-known neurotransmitter acetylcholine [7]. Metabolomics is widely used in modern food science and microbiology, in particular to address several systemic issues related to the safety, quality and nutritional status of food in studies of food quality, nutrition, and food safety [8]. Researchers have also applied metabolomics to fermented foods to observe the metabolomic changes during fermentation, which aids prediction of the organoleptic and nutritional qualities of the final product [9].
Metabolomic methods offer significant advantages for the identification of metabolites. Metabolomics can be used as an effective means of identifying biomarkers and applied to the protection of dairy products with regional characteristics unique to specific areas.
This technology mainly includes three part of sample pretreatment, metabolite determination and data analysis. The determination of metabolites is the core of metabolomics analysis. The three commonly used analytical methods of metabolomics are NMR, LC-MS and GC-MS. These analytical methods can both identify the structure of the metabolite and determine the concentration of the molecule [10,11]. After the data was collected, the original spectra from different analysis platforms were preprocessed. Combined with multivariate statistics and bioinformatics methods, the data were analyzed to find out the metabolic differences and biomarkers.
The correlation between the composition and metabolic status of milk can be determined through a combination of high-resolution nuclear magnetic resonance (NMR) spectroscopy and gas chromatography-mass spectrometry, and allows systematic study of the diverse range of physiological metabolites present in dairy cows during lactation [12]. Using metabolomic techniques, 44 different milk metabolic differences were identified and specific biomarkers, such as acetone and β-hydroxybutyrate, were significantly associated with metabolic stress in dairy cows during early lactation. Further metabolomic analysis may support selection of cows that can tolerate early lactation metabolic stress [13]. During the fermentation of soybeans into meju, 22 metabolites were identified as biomarkers of metabolic pathways [14].
The most commonly used metabolomic techniques are high-resolution proton NMR spectroscopy (1H-NMR), liquid chromatography-mass spectrometry (LC-MS), gas chromatography-mass spectrometry (GC-MS), and capillary electrophoresis-mass spectrometry (CE-MS) [9,15].
These techniques have been successfully utilized for determination of metabolites in fermented dairy products during fermentation, maturation and storage [1,9,16,17]. The 1H-NMR technique was used to identify changes in non-volatile metabolites at six time points during the fermentation of soybean paste [18]. To study changes in the metabolites present during the fermentation of the soybean pastes doenjang and cheonggukjang, GC-MS was applied [19,20]. Multivariate analysis with gas chromatography/time-of-flight mass spectrometry (GC-MS) was performed on 13 cheeses, including six cheddar, six Gouda and one Parmigiano-Reggiano cheese, and the results showed that principal component analysis (PCA) based on metabolomics can identify the distinctive sensory characteristics associated with maturation, and GC-MS can also be used for modeling the sensory predictive of cheese [21]. Recent reports show that metabolomics analysis has made a significant contribution to research on milk and dairy products. Han et al. established a selection-specific assay involving ultra-high-performance liquid chromatography–tandem mass spectrometry (UPLC-MS/MS). Their method rapidly identified a total of 38 veterinary antibiotic residues, across six different classes, in raw milk. When this method was applied to 25 samples of raw milk collected on site, traces of four veterinary antibiotic residues were detected in three samples [22].
In this study, cheese, yoghurt and milk beverages, including traditional and commercially available dairy products, were subjected to analysis. The ultra-performance liquid chromatography-quadrupole-time of flight mass spectrometry (UPLC-Q-TOF MS) in the MSE mode was used to analyze traditional and commercial dairy products. This technique combines univariate and chemometric data processing methods to analyze differences in the metabolite profiles of dairy products from different sources. The results of this study provide reference data for understanding the compositional differences between traditional and commercial dairy products.

2. Results and Discussion

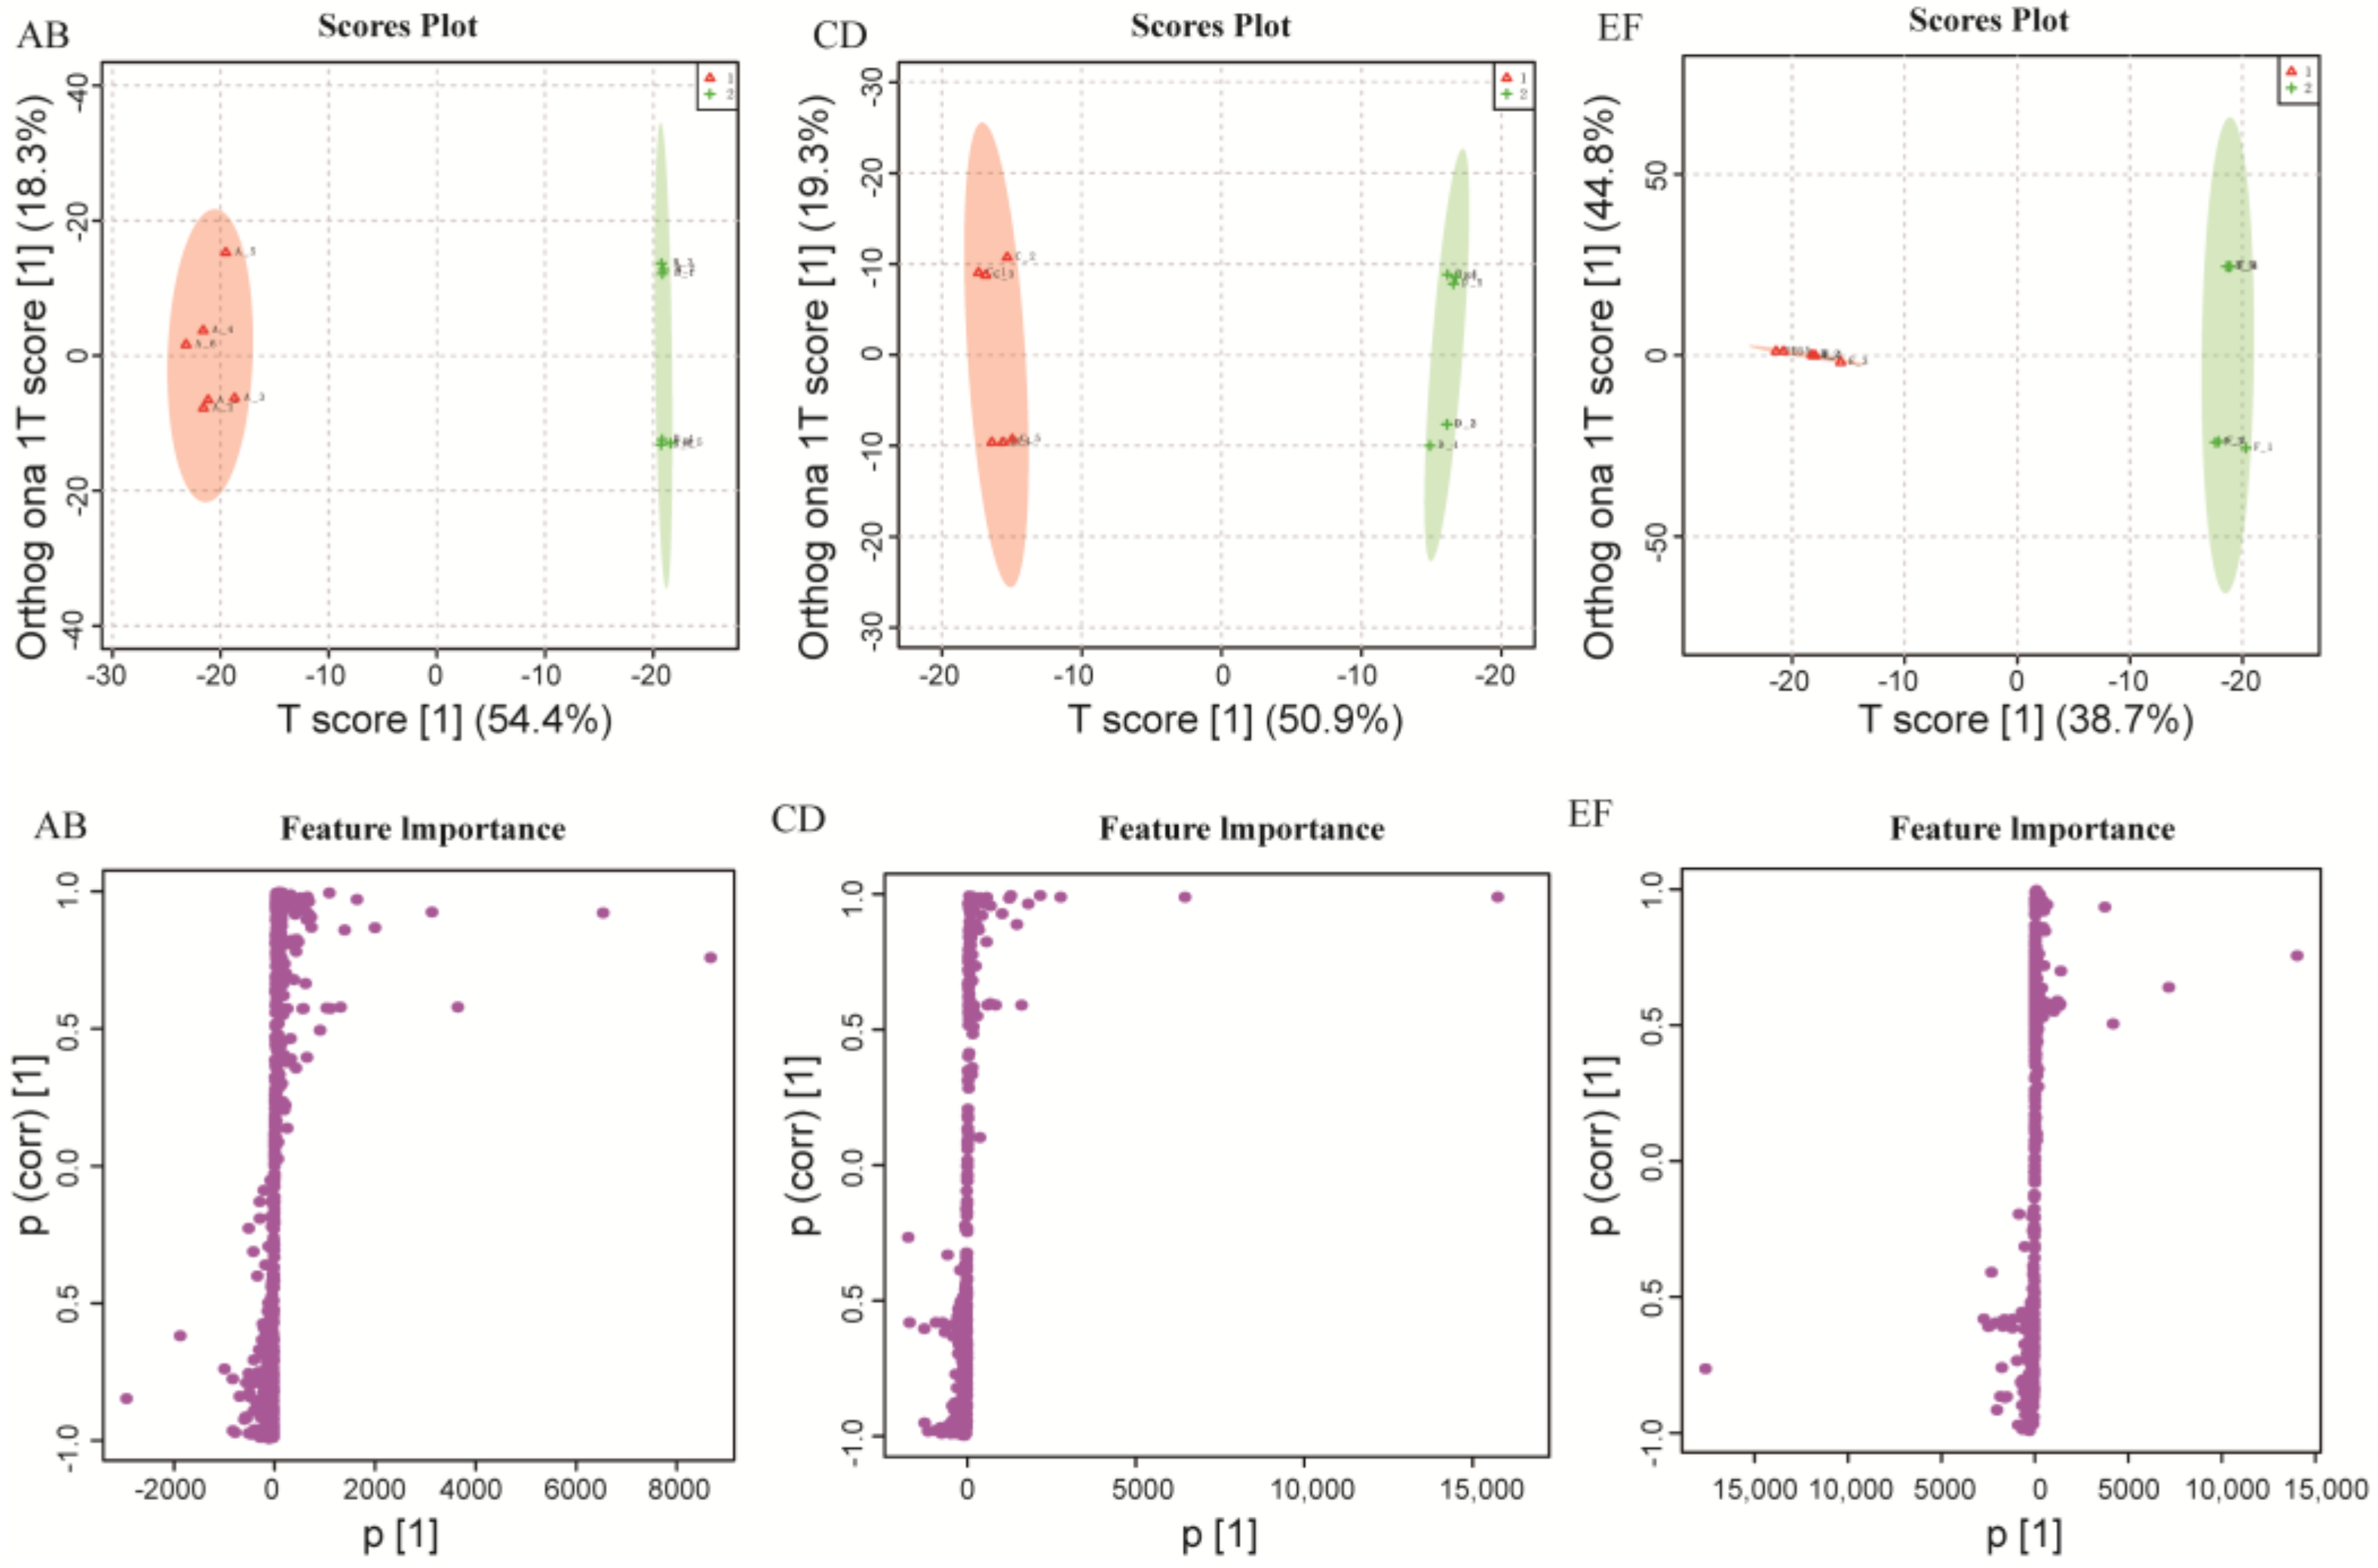
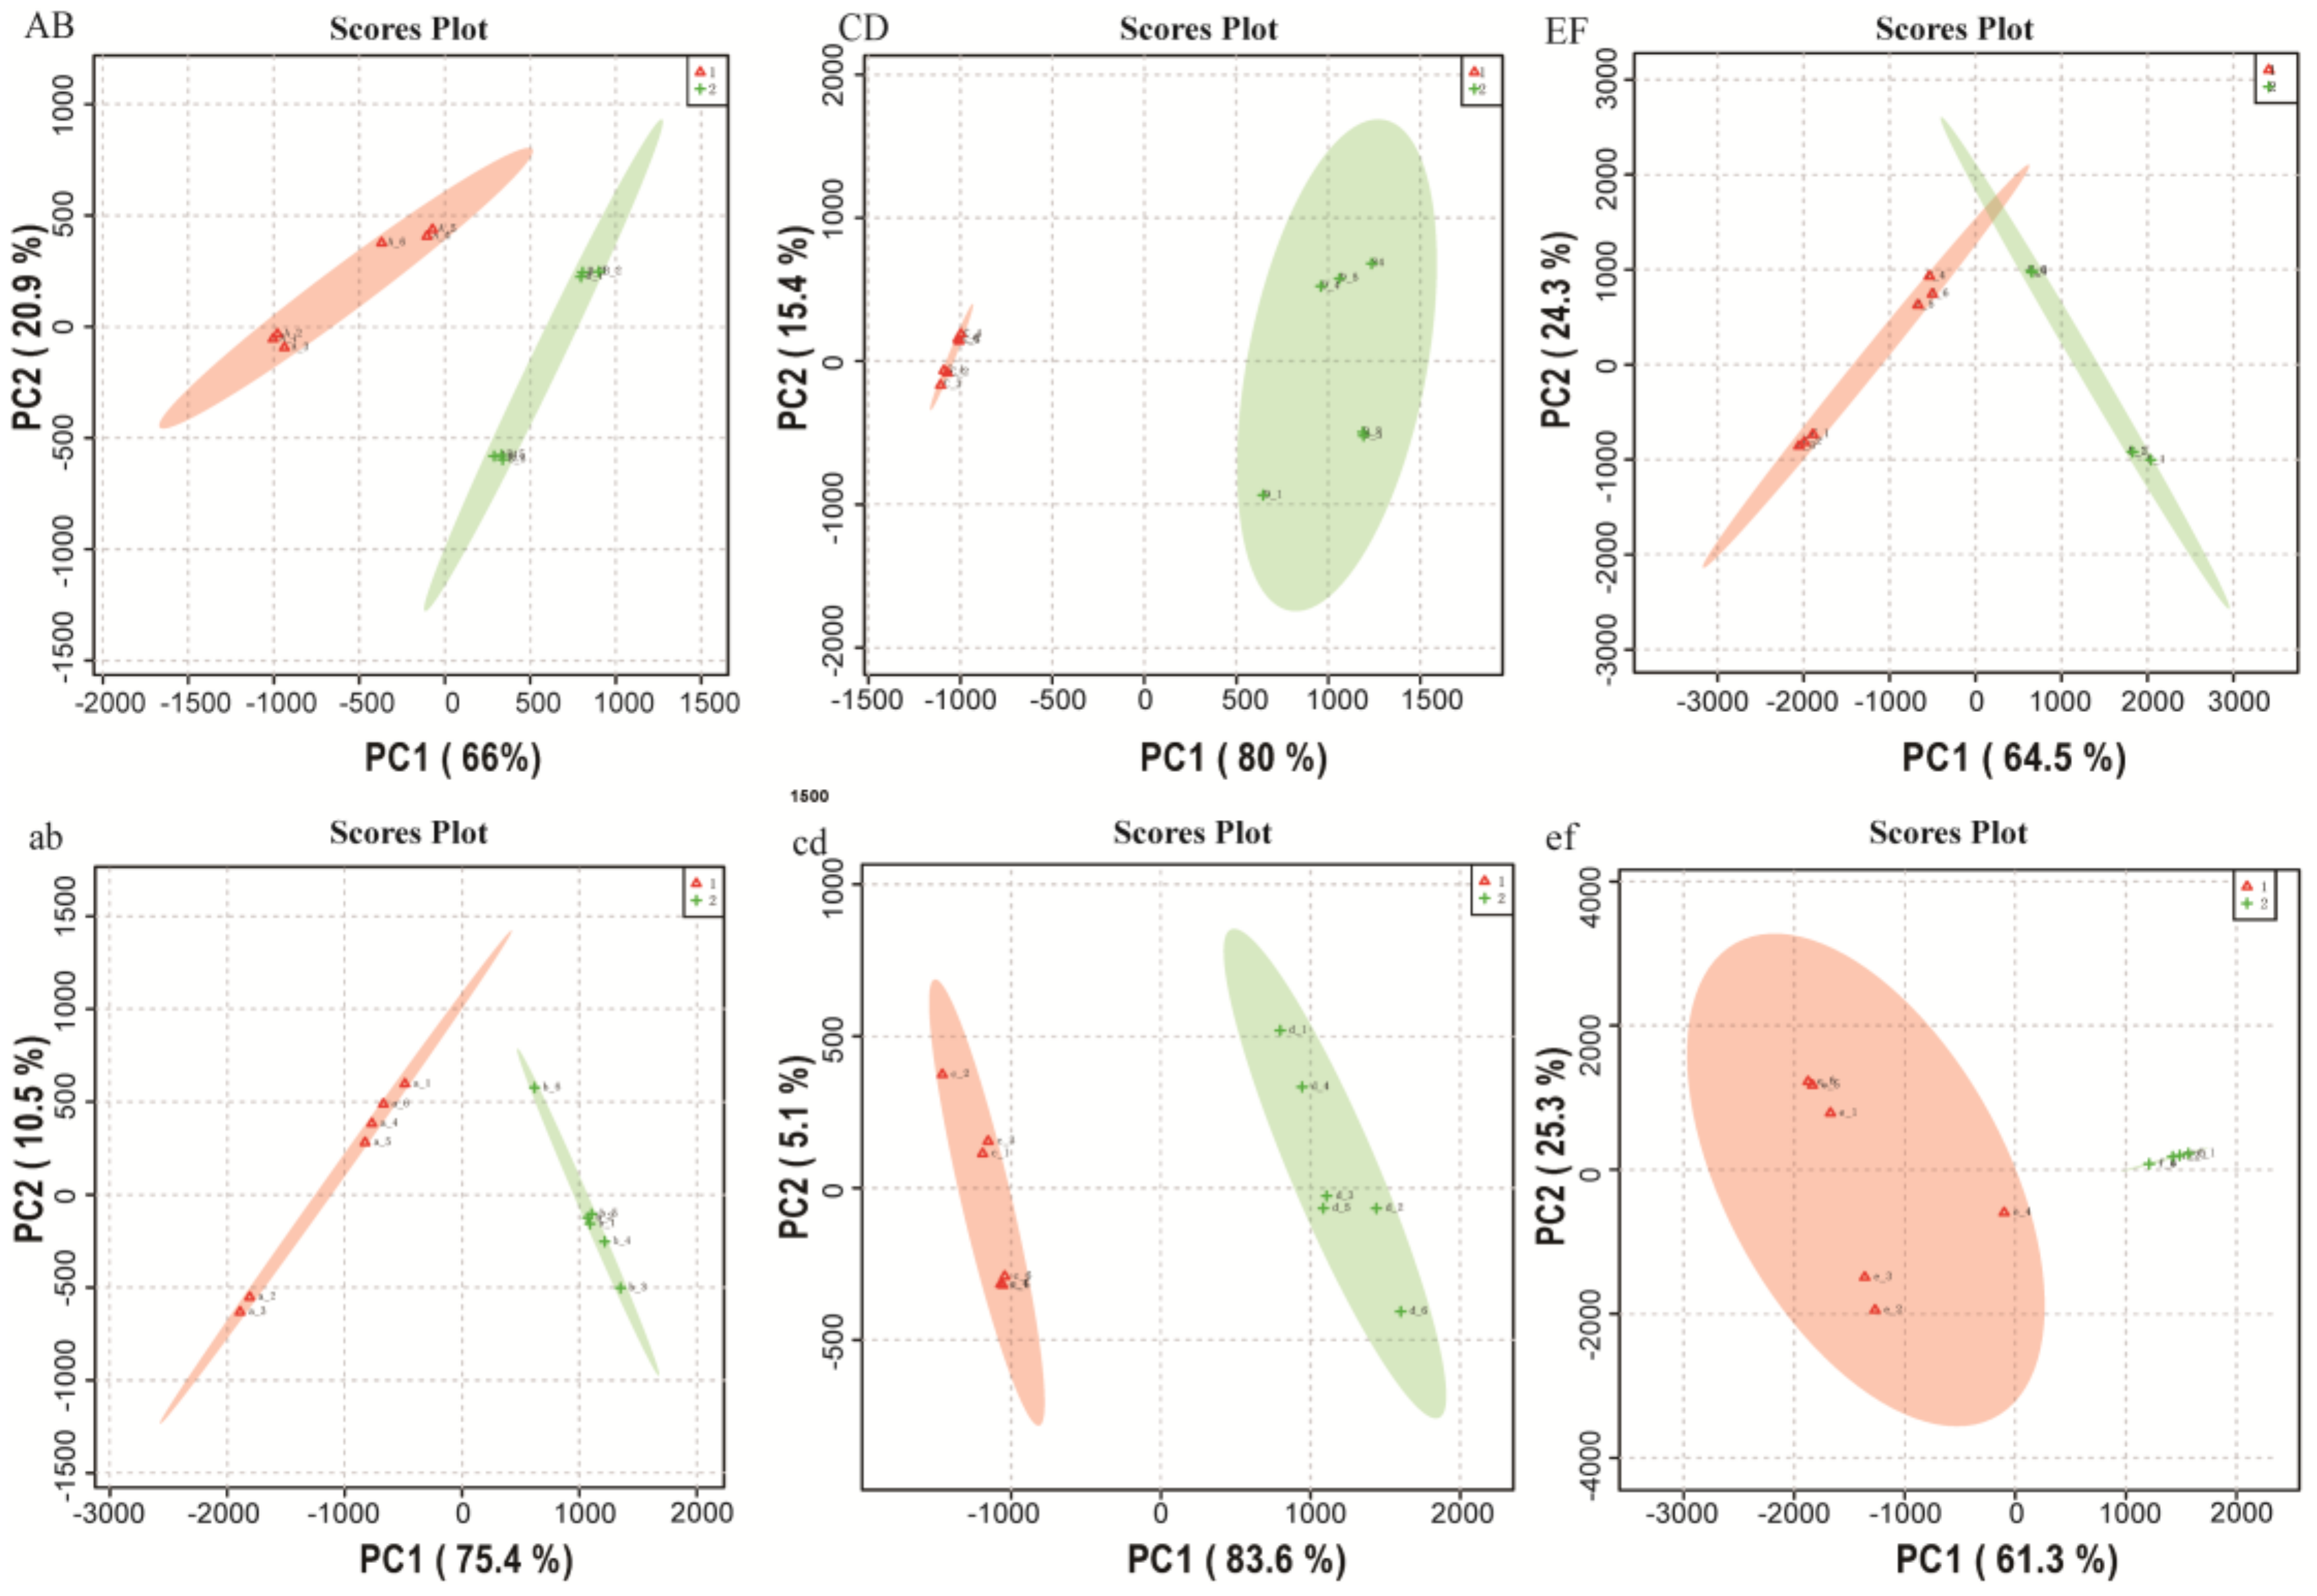
2.1. Metabolomics Data Analysis

After three series of samples were processed, base peak ion (BPI) chromatograms were obtained in positive and negative electrospray ionization (ESI+/ESI) scanning modes under optimized LC-MS conditions.
Under the optimized LC-MS conditions, a small-molecule metabolite profile of each sample was established. First, the BPI chromatograms of all samples were visually inspected, and a preliminary analysis of the overlapping BPI images in the three groups of samples was conducted (Figures S1–S3). The chromatographic peaks were well separated, with almost all of them reaching the baseline separation; the retention time (RT) and distribution of the main peaks showed good reproducibility. No differences in the spectra of the groups were identified from the BPI images. To identify the metabolic characteristics of each population, their omics features were determined using a combination of unidimensional and multidimensional statistics.
Chemometrics is an important tool for analyzing metabolomic differences among samples, as it enables identification of metabolites associated with specific conditions. To investigate the differences in metabolites among the three groups of samples, two multivariate statistical analyses, unsupervised PCA and orthogonal partial least squares discriminant analysis (OPLS-DA), were performed on the dairy product data obtained under the ESI+ and ESI scanning modes using the MassLynx software (version 4.1, Waters Corporation, Milford, MA, USA).
Because the samples were independent, the PCA score plots (Figure 1) of the dairy product data obtained under the ESI+/ESI scanning mode could be aggregated into groups, which differed markedly and were clearly separable. The plots show the same results as actually divided into two groups between commercially available and traditional dairy products, and there were statistically significant differences between the commercial and traditional products within each of the three groups of dairy products sampled in terms of their metabolite profiles.
OPLS uses orthogonal signal correction (OSC) to filter out information that has no relationship with the quantity matrix (Y) in the independent variable matrix (X), that is, random noise. Thus, OPLS-DA can better identify differences between groups of samples and thereby improve a model’s effectiveness and analytical power. Mass spectrometry data of the three groups of dairy product samples were analyzed using OPLS-DA to obtain S-plots of each ESI+ and ESI pair (Figure 2 and Figure S4).
The OPLS-DA data (Figure 2) show that traditional dairy products are well distinguished from commercial dairy products in both ESI+ and ESI modes. The fitness power and predictive power are represented by R2Y and Q2, respectively. In ESI+ mode, R2Y = 0.994 and Q2 = 0.978 for group AB; R2Y = 0.992 and Q2 = 0.975 for group CD; and R2Y = 0.763 and Q2 = 0.684 for group F. In ESI mode, R2Y = 0.965 and Q2 = 0.88 for group AB; R2Y = 0.997 and Q2 = 0.892 for group CD; and R2Y = 0.934 and Q2 = 0.819 for group EF. The R2Y and Q2 value of the six models are relatively high, showing that they are well differentiated and have good predictive power, and that the samples comprising each have significant metabolic differences based on their OPLS-DA scores.
On the S-plots, each point represents a metabolite. The metabolite has greater divergence between the two groups farther from the center axis. It is apparent from the S-plots that the metabolite profiles of the commercially and traditionally fermented dairy products are distinctly different. By reference to the p values of the OPLS-DA data, and by using the variable importance in projection (VIP) method and assessing other parameters, differences in metabolites between commercially and traditionally fermented dairy products can be better explained.

2.2. Comparison of Metabolite Profiles Between the Different Groups

MassLynx software (version 4.1) was used, in combination with a database (Kyoto Encyclopedia of Genes and Genomes; KEGG; www.genome.jp/kegg), ChemSpider (www.chemspider.com), Human Metabolome Database (HMDB; www.hmdb.ca) and METLIN (www.metlin.scripps.edu), to identify metabolites within the MSE data, which contain precursor and corresponding fragment ion information.
The ESI+ and ESI scanning mode data for group AB contained a total of 23,595 compounds, among which 22,123 metabolites were in positive ion scanning and 1472 metabolites were in negative ion scanning state. A total of 23,595 compounds were detected in group CD, among which there were 743 positive ions and 20,578 negative ions. A total of 21,404 metabolites were detected in group EF, including 1752 positive ions and 1652 negative ions.
According to multivariate statistical analysis combined with three criteria. The result is shown in Table 1, which indicates that the compounds identified in the two types of fermented milk samples were mainly amino acids, short peptides, lipids, nucleic acids, carbohydrates, and compounds related to energy metabolism.
A total of 58 compounds were identified, as listed in Table 1, of which 22 were amino acids such as l-lysine, l-methionine, l-citrulline, l-proline, l-lysine, l-serine, l-valine, and l-homocysteine. Sixteen peptides were identified, including Asp-Arg, Gly-Arg, His-Pro, and Pro-Asn. Other classes of metabolites that were well-represented included lipids, nucleic acids, and compounds related to energy metabolism, such as hexadecenoic acid, purine, and trimethylamine. A few of the compounds identified are involved in the biosynthesis of secondary metabolites, metabolism of cofactors and vitamins, membrane transport and gene translation. The proportion of amino acids, such as l-lysine, l-citrulline, l-proline, d-fructose, and purine, was significantly higher in the metabolites of traditional versus commercially available dairy products.
In group CD, the most abundant compounds were amino acids and short peptides. Pretyrosine, aldosterone, β-alanyl-l-arginine, O-acetyl-l-serine, N-formyl-l-methionine, phenylacetylglycine, l-phenylalanine, cystathionine, pyrimidine, threonine, l-cysteine, l-leucine, Cys-Ser, Gly-Phe, carnosine, Ser-Met, Pro-His, Met-Asn, Gln-His, Lys-Phe, and Pro-Asn were found in higher amounts in traditional versus commercial dairy products.
In group EF, the metabolites was less than that in group AB and CD, but in positive ion scan mode, it was observed that the differences metabolites of cheese was rich in short peptides. Aspartic acid, N-acetyl-l-cysteine, Asp-Val, Leu-Asp, Asp-Asp, Gln-Phe, Trp-Arg, methanesulfonic acid, benzoquinone, cytosine, l-proline, l-valine, 4-oxoproline 3-sulfino-l-alanine, phosphocreatine, and Ser-Trp were present in higher amounts in traditional dairy products than in commercially available dairy products, while Cys-Asn, His-Val, Lys-Lys, l-homoserine, alanyl-d-alanine, Thr-Val, l-cysteine, and Lys-Phe contents were higher than traditional dairy products.

3. Discussion

Different types of dairy products have different starters, which is also one of the important influencing factors of metabolites. Emerging technological and analytical metabolomics approaches have been widely used to study drug toxicity and its underlying mechanisms in microbial and plant research, animal models, food nutrition studies, and gene function investigations, as well as for disease diagnosis [12,23]. Metabolomics can be used to accurately identify amino acids, carbohydrates, organic acids, vitamins, peptides, nucleotides and other metabolites in complex samples.

3.1. Effects of Starter Diversity on the Metabolites of Dairy Products

In one study, Lactobacillus rhamnosus GG (Y-LGG) and Bifidobacterium animalis subsp. lactis BB12 (Y-BB12) were combined in yoghurt fermentation. The metabolites were measured by headspace solid phase microextraction-gas chromatography/MS (SPME-GC/MS) and 1H-NMR techniques. The final PCA and loading plot result shows that the metabolites of Y-LGG and Y-BB12 are clearly separated [24]. In addition, starters under nutrition stress can also lead to changes in metabolites. Lactobacillus plantarum WCFS1 was pre-cultured under elevated NaCl and low pH stress conditions and metabolomics analyses revealed that the presence of stress-adapted probiotics induced significant changes in the overall metabolite profile of yoghurt [25].

3.2. Amino Acids

In fermented dairy products, the type and quantity of amino acids are often used as important indicators of nutritional quality. Kang et al. increased the fermentation time of meju and identified metabolites responsible for the unique flavor and nutritional attributes of soybean foods, including amino acids, small peptides, nucleotides, urea cycle intermediates and organic acids based on the ultra-performance liquid chromatography-quadrupole-time of flight mass spectrometry (UPLC-Q-TOF MS) assay method. In that experiment, 22 metabolic compounds were identified as biomarkers of the metabolic pathways of meju fermentation [14]. In metabolomics research on doenjang fermentation, the concentrations of amino acids including alanine, threonine, glycine and serine increased between 140 and 160 days of fermentation, while those of leucine and isoleucine increased continuously from day 100 [19]. In PCA, 50% methanol extracts of a fermented soybean paste showed clear differences by fermentation time: the major compounds identified were isoleucine, leucine and tyrosine [18]. Amino acids identified in the present experiment included l-proline, l-methionine, l-citrulline, l-lysine, serine, valine, glycine, proline, and threonine, which are commonly found in fermented milk [16,17,21,26,27,28].

3.3. Peptides

Milk can be degraded into various metabolites by lactic acid bacteria, including aromatic compounds and peptides. Short peptides, including Asp-Arg, Gly-Arg, Pro-Asn and Arg-Cys were detected in the samples in our experiment. These metabolites have been shown to affect the texture and flavor of fermented dairy products.
In a previous study, 223 metabolites were identified in 10 different commercially available types of milk using a combination of liquid chromatography and gas chromatography. These metabolites included amino acids, lipids, carbohydrates, nucleotides, energy metabolites, vitamins, adjuvant factors, and short peptides [16]. During the fermentation process, casein is degraded into short peptides through the actions of protease and peptidase. Researchers have used metabonomics to determine that these short peptides may have beneficial effects on human health, such as lowering cholesterol, easing stress and exerting antioxidant activity [29]. Milk fermented by Streptococcus thermophilus and Lactobacillus plantarum can improve the functional and probiotic properties of yoghurt, as the milk protein degrades into a large number of short peptides and amino acids that have biological activities [27]. The most significant changes revealed by an NMR-PCA method during the 90-day fermentation of traditional Italian raw ewe’s milk cheese, Fiore Sardo, were that the carbohydrate, citric acid and lactic acid contents decreased at the beginning of maturation, while amino acids and smaller peptides formed toward the end of maturation [17].

3.4. Other Metabolites

Fermented milk, a popular and healthy food, is favored by a growing number of individuals, and the unique flavor that was formerly perceived as problematic is now widely accepted by consumers. Among metabolites, organic acids are an important determinant of yogurt flavor. Therefore, determination of the organic acid composition and content plays an important role in evaluating the nutritional value, aroma, flavor and biological activity of fermented milk products. Several organic acids in fermented products, including lactic acid, acetic acid, and citric acid have been reported as differential metabolites compared with non-fermented products through high-resolution magic angle spinning nuclear magnetic resonance (1H-RMAS-NMR) and GC-MS analyses [19,20,30]. Pisano et al. characterized the metabolites in Italian buffalo cheese and compared them with those of cow mozzarella. Lactic acid, citric acid, succinic acid, fumaric acid, glyceric acid, and gluconic acid have also been identified as differential metabolites using GC-MS [28].
Vitamins, amines and fatty acids are also common metabolites in fermented dairy products [21]. Saccharides such as galactose, maltose, ribose and myo-inositol have been identified in fermented dairy products, along with lactic acid dimers. Long-chain fatty acids, including stearic acid, oleic acid and palmitic acid, have also been observed [28].

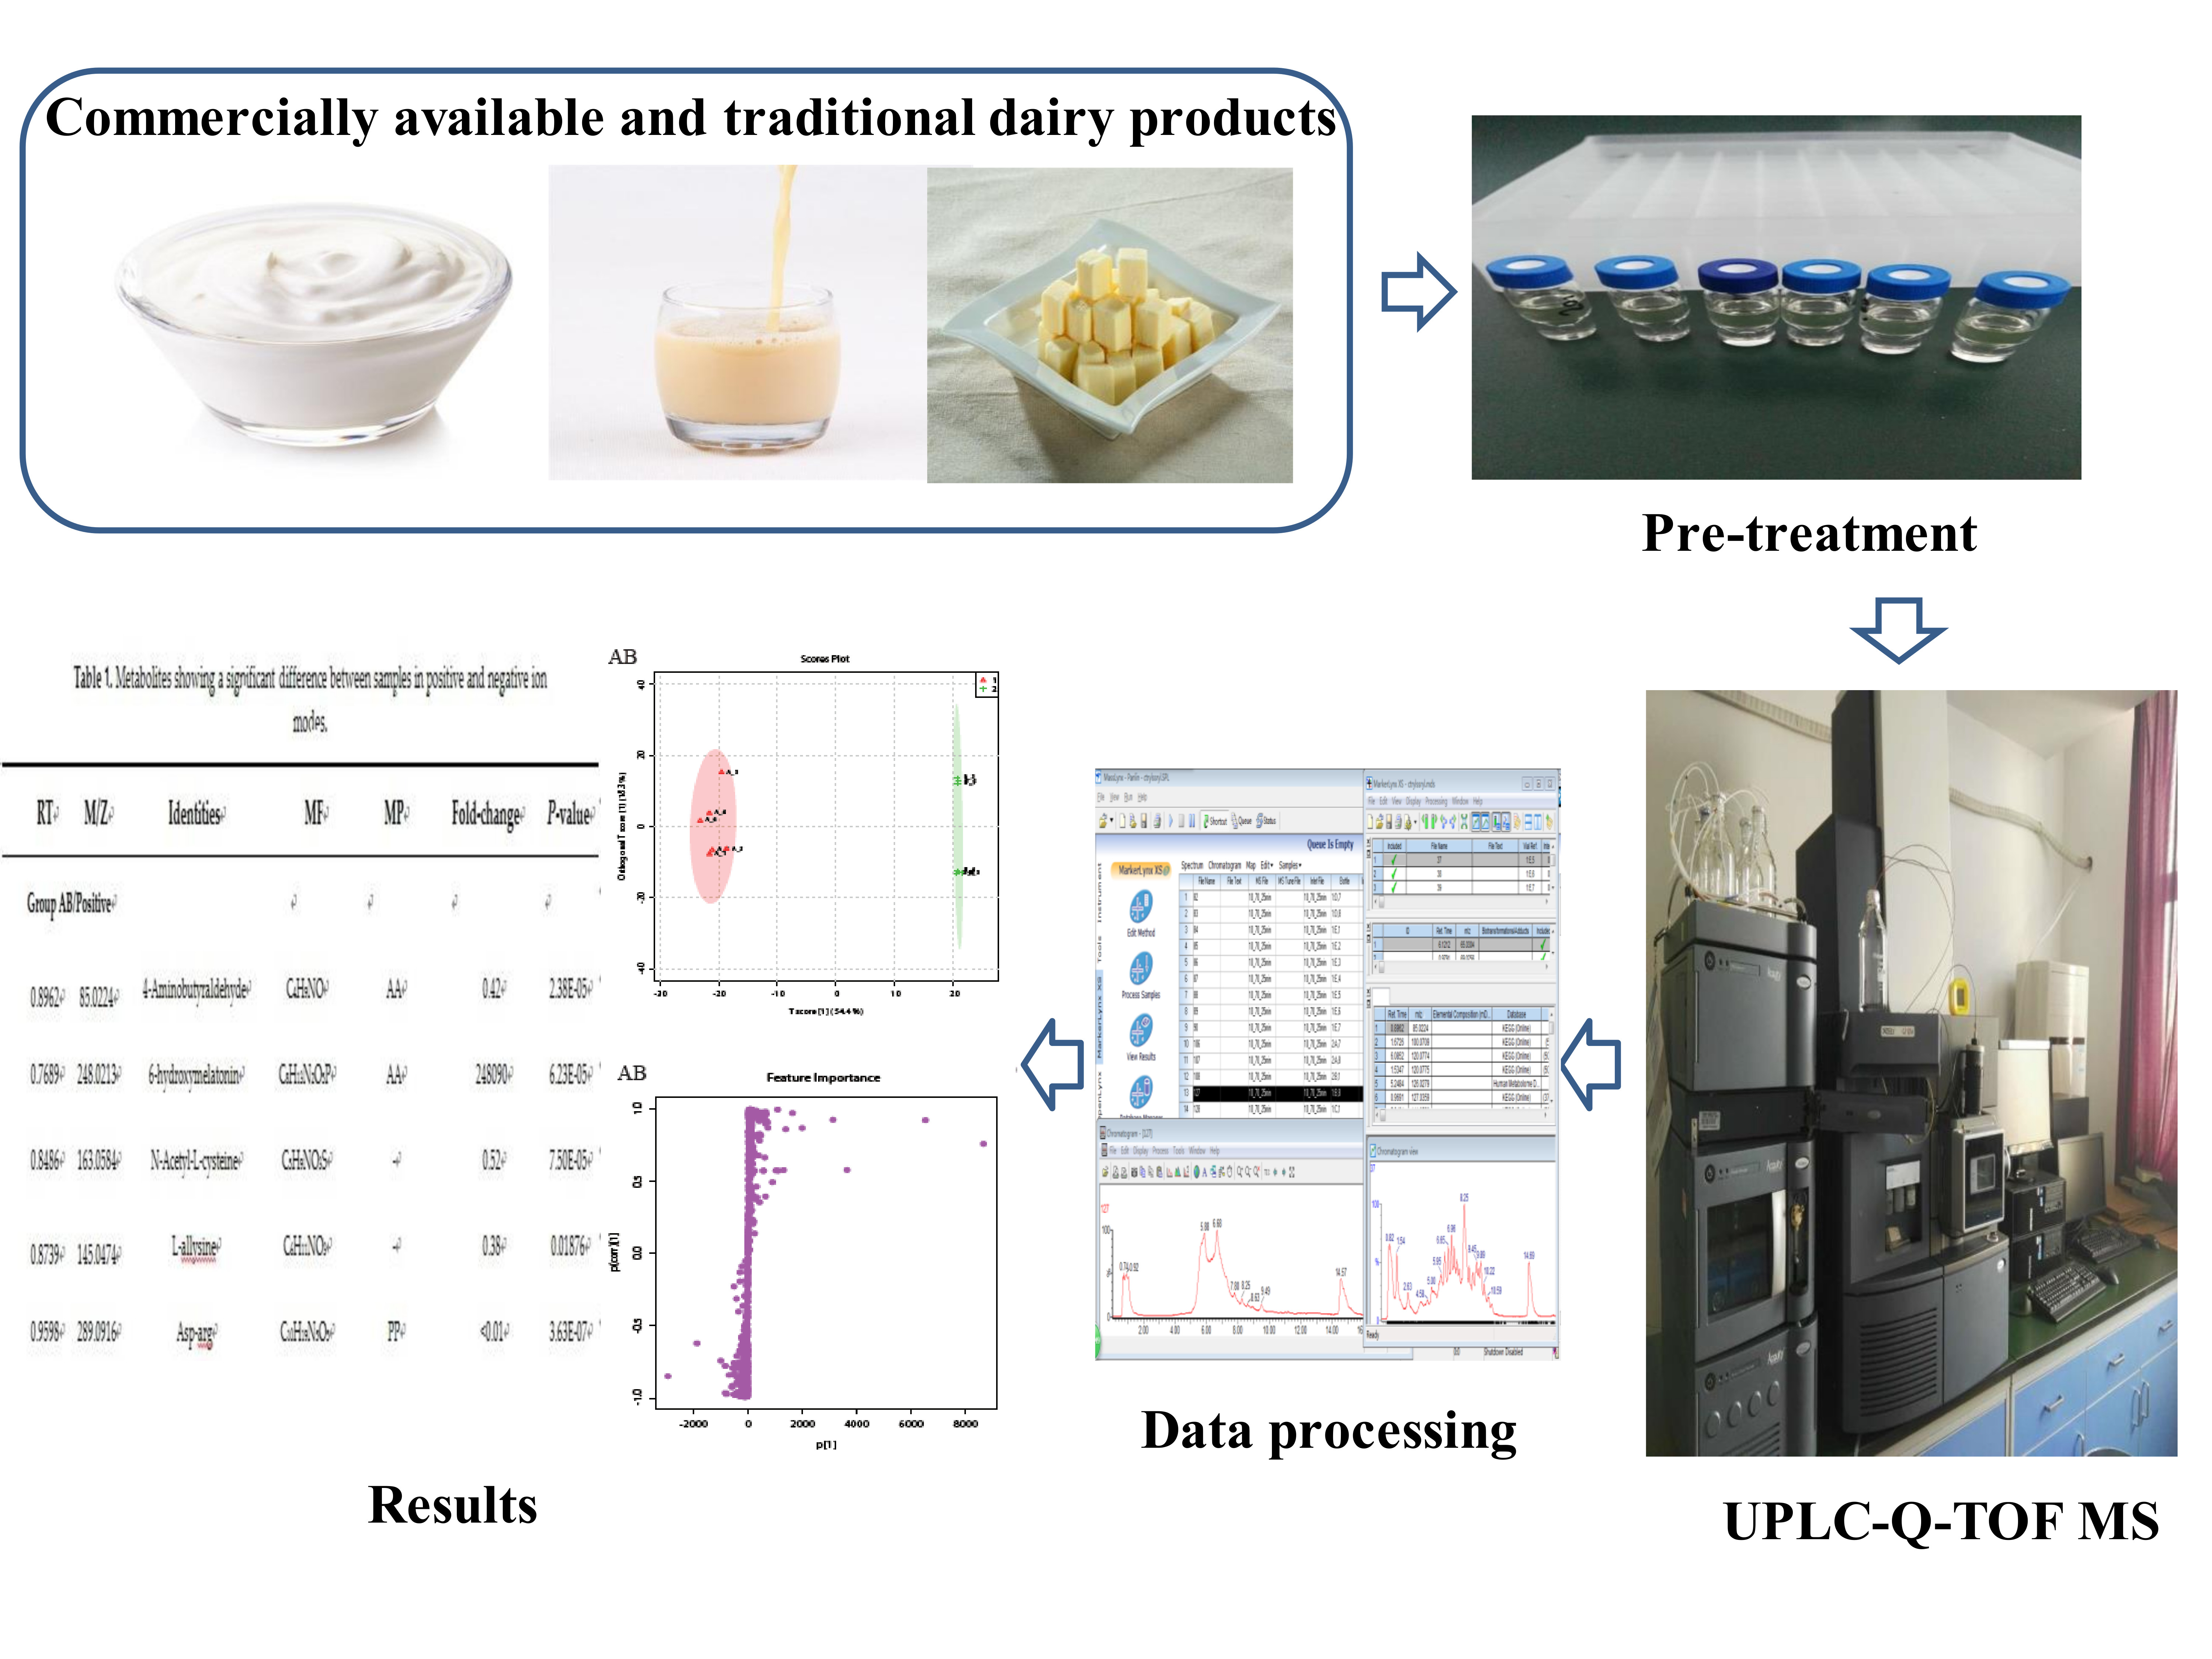
4. Materials and Methods

4.1. Sample Collection

Commercially available samples study in this experiment was imported from Buryatia (Russian Federation) and purchased from a Chinese supermarket. Each of the commercially available dairy products had the same expiry date and were taken from the same store shelf. In order to avoid the influence of the season, all dairy products samples were purchased on the same day. In the selection of commercially available milk beverages, we choose samples containing only Lactobacillus casei as a starter. In the process of choosing yoghurt, we only selected the yogurt with Lactobacillus bulgaricus subsp. bulgaricus and Streptococcus thermophilus. When we selected the samples of cheese, only Lactococcus lactis as starters can be involved. Traditional dairy products were obtained from the residence of a Mongolian herdsman in Village of Tunka (Buryatia). Both commercially available dairy products and traditional dairy products have the same fermentation end-point, that is, the value of pH is equal to 4.5. Milk samples were collected into 50-mL sterile screw-top tubes, sealed and labeled, and preserved in a freezer at −80 °C. Commercial samples with a production date close to the date of collection were chosen, placed into sterile centrifuge tubes and stored at −80 °C for later use. The samples were divided into three groups: AB, comprising one commercial and one traditional homemade fermented milk beverage; CD, comprising one commercial yogurt and one traditional homemade fermented yogurt; and group EF, comprising one commercial and one traditional homemade fermented cheese.

4.2. Sample Preparation for UPLC-Q-TOF MSE Analysis

Samples were thawed and centrifuged at 4500× g for 10 min, and then the fat layer was discarded. From the supernatant, 2 mL was collected, to which 14 mL acetonitrile was added, and the mixture was vortexed for 2 min. Ultrasonic extraction of the sample was conducted for 5 min, followed by 12,000× g high-speed centrifugation for about 15 min. Then, the supernatant was collected, concentrated through drying in a vacuum rotary enrichment apparatus, and reconstituted in 500 μL of 40% (v/v) acetonitrile. After reconstitution, the sample solution was filtered through a 0.22-μm water-insoluble microporous membrane into a vial, and preserved at −20 °C until testing.

4.3. UPLC-Q-TOF MSE Analysis

An ACQUITY UPLC®/Xevo® G2 Q TOF-MSE (Waters Corporation, Milford, MA, USA) was used to extract MS spectral peaks of dairy products. Pre-treated milk samples were chromatographed using a C18-UPLC system. The column was HSS T3 (2.1 mm × 100 mm, 1.8 μm, Waters). Each sample infusion flow rate of 0.3 μL/min and the column was maintained at 35 °C. The injection volume is 4 μL.
As for ESI+ ion mode, the mobile phase A is an aqueous phase containing 0.1% formic acid (Sigma-Aldrich, St. Louis, MO, USA). Mobile phase B is an organic phase containing 0.1% formic acid in acetonitrile (Optima® LC/MS-grade, Fisher, Grand Island, NY, USA). The elution gradient was as follows: initial, 90% A, 10% B (0–2 min); 90% A, 10% B (2–12 min); 60% A, 40% B (12–20 min); 30% A, 70% B (20–23 min); 30% A, 70% B (23–24 min).
In the scanning of ESI-ion mode, the mobile phase consisted of water (Millipore, Bedford, MA, USA) containing 10% acetonitrile (solution A) and 50% acetonitrile (solution B). The elution gradient was as follows: initial, 90% A, 10% B (0–2 min); 90% A, 10% B (2–12 min); 60% A, 40% B (12–20 min); 30% A, 70% B (20–23 min); 90% A, 10% B (23–24 min).
When the dairy products in this experiment were analyzed by metabolomics, the Q-TOF mass spectrometer carried out data scanning using the positive positive [electrospray ionization, ESI+] and negative [ESI] ion modes. Source temperature, 100 °C; desolvation Temperature 150 °C; desolvation gas flow, 50 L/H(+) and 800 L/H(−), respectively; cone gas flow, 50 L/H, capillary 3 kV; cone voltage, 40 V; the acquisition scan range was from 50 to 2000 m/z; scan frequency 10.00 s.
In order to ensure the accuracy of data acquisition, leucineen-kephalin was used as the lock mass for positive ion mode (556.2771 [M + H]+) and negative ion mode (554.2615 [M − H]).

4.4. UPLC-Q-TOF MSE Data Processing and Multivariate Statistical Analyses

After LC-MS analysis of the fermented milk samples, the raw UPLC-Q-TOF MSE data were imported into MassLynx software (ver. 4.1) which was employed for peak matching, peak alignment, peak extraction and normalization. After normalization and standardization of the original data, SIMCA-P + 11 (Umetrics AB, Umea, Sweden) was used for multivariate statistical analysis. The data were exported in .txt format from SIMCA-P + 11 and included the mass-to-charge ratio (m/z) and RT. Finally, six sets of data were obtained in positive ion detection mode. Negative ion data were obtained as described above. PCA and PLS-DA were used to identify differences in metabolite profiles among samples. Second, the PCA and PLS-DA data were analyzed using Metaboanalyst (www.metaboanalyst.ca). Finally, using multivariate statistical analysis combined with the three criteria, which are VIP value ≥ 2, fold-change ≥ 2 and p-value < 0.05, the most significant variance was selected. The structure of the screened differential metabolites were determined according to the m/z, RT, and fragment ion information.

4.5. Identification of Key Metabolites

Following the data analysis, the metabolites were screened according to their RT, m/z and fragment ion information using MassLynx softwere (ver. 4.1) online, which is linked to the commonly used metabolomic databases Kyoto Encyclopedia of Genes and Genomes (KEGG; www.genome.jp/kegg), ChemSpider (www.chemspider.com), Human Metabolome Database (HMDB; www.hmdb.ca) and METLIN (www.metlin.scripps.edu) [31]. The final data were reviewed according to relevant literature to determine the compounds present. Each aromatic compound was analyzed using the MetaboAnalyst (http://www.metaboanalyst.ca) and KEGG (http://www.genome.jp/kegg/pathway.html) databases to identify the metabolic pathways showing significant differences between the commercial and traditional products within each of the three groups of dairy products sampled.

5. Conclusions

In this study, we showed that metabolomics analysis combined with statistical methods has great potential for distinguishing between different types of dairy products with different starters from Buryatia in the Russian Federation. Metabolomic methods can be used to identify and analyze differenti compounds in fermented dairy products, which could serve as potential biomarkers. This study shows that metabolomics is an ideal technology for distinguishing among, and identifying compounds in, dairy products.

Supplementary Materials

The following are available online, Figure S1: BPI chromatograms for groups AB in ESI+/ESI scanning modes, Figure S2: BPI chromatograms for groups CD in ESI+/ESI- scanning modes, Figure S3: BPI chromatograms for groups EF in ESI+/ESI- scanning modes, Figure S4: Orthogonal partial least squares discriminant analysis (OPLS-DA) : S-plots of the data for three groups of samples (AB, CD, EF) obtained in ESI- ion mode.

Acknowledgments

This work was sponsored by the Excellent Young Scientist Foundation of Inner Mongolia Agricultural University of China (Grant No. 2017XYQ-4), the National Natural Science Fund of China (31660450).

Author Contributions

Jie Yu and Bilige Menghe conceived and designed the experiments; Lin Pan, Lanxin Mo, Hao Jin, Caiqing Yao and Dongyan Ren performed the experiments; Lin Pan analyzed the data; Zhihui Mi contributed reagents and analysis tools; Lin Pan and Jie Yu wrote the paper. All authors read and approved the final version.

Conflicts of Interest

The authors declare no conflict of interest.

References

  1. Le Boucher, C.; Courant, F.; Jeanson, S.; Chereau, S.; Maillard, M.B.; Royer, A.L.; Thierry, A.; Dervilly-Pinel, G.; Le Bizec, B.; Lortal, S. First mass spectrometry metabolic fingerprinting of bacterial metabolism in a model cheese. Food Chem. 2013, 141, 1032–1040. [Google Scholar] [CrossRef] [PubMed]
  2. Yu, J.; Wang, H.M.; Zha, M.S.; Qing, Y.T.; Bai, N.; Ren, Y.; Xi, X.X.; Liu, W.J.; Menghe, B.L.G.; Zhang, H.P. Molecular identification and quantification of lactic acid bacteria in traditional fermented dairy foods of Russia. J. Dairy Sci. 2015, 98, 5143–5154. [Google Scholar] [CrossRef] [PubMed]
  3. Álvarez-Martín, P.; Flórez, A.B.; Hernández-Barranco, A.; Mayo, B. Interaction between dairy yeasts and lactic acid bacteria strains during milk fermentation. Food Control 2008, 19, 62–70. [Google Scholar] [CrossRef]
  4. Gadaga, T.H.; Mutukumira, A.N.; Narvhus, J.A. The growth and interaction of yeasts and lactic acid bacteria isolated from Zimbabwean naturally fermented milk in UHT milk. Int. J. Food Microbiol. 2001, 68, 21–32. [Google Scholar] [CrossRef]
  5. Hugenholtz, J. Citrate metabolism in lactic acid bacteria. FEMS Microbiol. Rev. 1993, 12, 165–178. [Google Scholar] [CrossRef]
  6. Panesar, P.S. Fermented Dairy Products: Starter Cultures and Potential Nutritional Benefits. Food Nutr. Sci. 2011, 2, 47–51. [Google Scholar] [CrossRef]
  7. Oguro, Y.; Nishiwaki, T.; Shinada, R.; Kobayashi, K.; Kurahashi, A. Metabolite profile of koji amazake and its lactic acid fermentation product by Lactobacillus sakei UONUMA. J. Biosci. Bioeng. 2017, 124, 178–183. [Google Scholar] [CrossRef] [PubMed]
  8. Le Boucher, C.; Courant, F.; Royer, A.-L.; Jeanson, S.; Lortal, S.; Dervilly-Pinel, G.; Thierry, A.; Le Bizec, B. LC–HRMS fingerprinting as an efficient approach to highlight fine differences in cheese metabolome during ripening. Metabolomics 2015, 11, 1117–1130. [Google Scholar] [CrossRef]
  9. Mozzi, F.; Ortiz, M.E.; Bleckwedel, J.; De Vuyst, L.; Pescuma, M. Metabolomics as a tool for the comprehensive understanding of fermented and functional foods with lactic acid bacteria. Food Res. Int. 2013, 54, 1152–1161. [Google Scholar] [CrossRef]
  10. Nicholson, J.K.; Lindon, J.C. Systems biology: Metabonomics. Nature 2008, 455, 1054–1056. [Google Scholar] [CrossRef] [PubMed]
  11. Reaves, M.L.; Rabinowitz, J.D. Metabolomics in systems microbiology. Curr. Opin. Biotechnol. 2011, 22, 17–25. [Google Scholar] [CrossRef] [PubMed]
  12. Lindon, J.C.; Holmes, E.; Nicholson, J.K. Metabonomics techniques and applications to pharmaceutical research & development. Pharm. Res. 2006, 23, 1075–1088. [Google Scholar] [PubMed]
  13. Klein, M.S.; Almstetter, M.F.; Schlamberger, G.; Nurnberger, N.; Dettmer, K.; Oefner, P.J.; Meyer, H.H.; Wiedemann, S.; Gronwald, W. Nuclear magnetic resonance and mass spectrometry-based milk metabolomics in dairy cows during early and late lactation. J. Dairy Sci. 2010, 93, 1539–1550. [Google Scholar] [CrossRef] [PubMed]
  14. Kang, H.J.; Yang, H.J.; Kim, M.J.; Han, E.S.; Kim, H.J.; Kwon, D.Y. Metabolomic analysis of meju during fermentation by ultra performance liquid chromatography-quadrupole-time of flight mass spectrometry (UPLC-Q-TOF MS). Food Chem. 2011, 127, 1056–1064. [Google Scholar] [CrossRef] [PubMed]
  15. Sundekilde, U.K.; Larsen, L.B.; Bertram, H.C. NMR-Based Milk Metabolomics. Metabolites 2013, 3, 204–222. [Google Scholar] [CrossRef] [PubMed]
  16. Boudonck, K.J.; Mitchell, M.W.; Wulff, J.; Ryals, J.A. Characterization of the biochemical variability of bovine milk using metabolomics. Metabolomics 2009, 5, 375–386. [Google Scholar] [CrossRef]
  17. Piras, C.; Marincola, F.C.; Savorani, F.; Engelsen, S.B.; Cosentino, S.; Viale, S.; Pisano, M.B. A NMR metabolomics study of the ripening process of the Fiore Sardo cheese produced with autochthonous adjunct cultures. Food Chem. 2013, 141, 2137–2147. [Google Scholar] [CrossRef] [PubMed]
  18. Yang, S.O.; Kim, M.S.; Liu, K.H.; Auh, J.H.; Kim, Y.S.; Kwon, D.Y.; Choi, H.K. Classification of fermented soybean paste during fermentation by 1H nuclear magnetic resonance spectroscopy and principal component analysis. Biosci. Biotechnol. Biochem. 2009, 73, 502–507. [Google Scholar] [CrossRef] [PubMed]
  19. Namgung, H.J.; Park, H.J.; Cho, I.H.; Choi, H.K.; Kwon, D.Y.; Shim, S.M.; Kim, Y.S. Metabolite profiling of doenjang, fermented soybean paste, during fermentation. J. Sci. Food Agric. 2010, 90, 1926–1935. [Google Scholar] [CrossRef] [PubMed]
  20. Park, M.K.; Cho, I.H.; Lee, S.; Choi, H.K.; Kwon, D.Y.; Kim, Y.S. Metabolite profiling of Cheonggukjang, a fermented soybean paste, during fermentation by gas chromatography-mass spectrometry and principal component analysis. Food Chem. 2010, 122, 1313–1319. [Google Scholar] [CrossRef]
  21. Ochi, H.; Naito, H.; Iwatsuki, K.; Bamba, T.; Fukusaki, E. Metabolomics-based component profiling of hard and semi-hard natural cheeses with gas chromatography/time-of-flight-mass spectrometry, and its application to sensory predictive modeling. J. Biosci. Bioeng. 2012, 113, 751–758. [Google Scholar] [CrossRef] [PubMed]
  22. Han, R.W.; Zheng, N.; Yu, Z.N.; Wang, J.; Xu, X.M.; Qu, X.Y.; Li, S.L.; Zhang, Y.D.; Wang, J.Q. Simultaneous determination of 38 veterinary antibiotic residues in raw milk by UPLC-MS/MS. Food Chem. 2015, 181, 119–126. [Google Scholar] [CrossRef] [PubMed]
  23. Wishart, D.S. Metabolomics: Applications to food science and nutrition research. Trends Food Sci. Technol. 2008, 19, 482–493. [Google Scholar] [CrossRef]
  24. Settachaimongkon, S.; Nout, M.J.; Antunes Fernandes, E.C.; Hettinga, K.A.; Vervoort, J.M.; van Hooijdonk, T.C.; Zwietering, M.H.; Smid, E.J.; van Valenberg, H.J. Influence of different proteolytic strains of Streptococcus thermophilus in co-culture with Lactobacillus delbrueckii subsp. bulgaricus on the metabolite profile of set-yoghurt. Int. J. Food Microbiol. 2014, 177, 29–36. [Google Scholar] [CrossRef] [PubMed]
  25. Settachaimongkon, S.; van Valenberg, H.J.; Gazi, I.; Nout, M.J.; van Hooijdonk, T.C.; Zwietering, M.H.; Smid, E.J. Influence of Lactobacillus plantarum WCFS1 on post-acidification, metabolite formation and survival of starter bacteria in set-yoghurt. Food Microbiol. 2016, 59, 14–22. [Google Scholar] [CrossRef] [PubMed]
  26. Baek, J.G.; Shim, S.M.; Kwon, D.Y.; Choi, H.K.; Lee, C.H.; Kim, Y.S. Metabolite profiling of Cheonggukjang, a fermented soybean paste, inoculated with various Bacillus strains during fermentation. Biosci. Biotechnol. Biochem. 2010, 74, 1860–1868. [Google Scholar] [CrossRef] [PubMed]
  27. Ghosh, D.; Chattoraj, D.K.; Chattopadhyay, P. Studies on changes in microstructure and proteolysis in cow and soy milk curd during fermentation using lactic cultures for improving protein bioavailability. J. Food Sci. Technol. 2013, 50, 979–985. [Google Scholar] [CrossRef] [PubMed]
  28. Pisano, M.B.; Scano, P.; Murgia, A.; Cosentino, S.; Caboni, P. Metabolomics and microbiological profile of Italian mozzarella cheese produced with buffalo and cow milk. Food Chem. 2016, 192, 618–624. [Google Scholar] [CrossRef] [PubMed]
  29. Hagi, T.; Kobayashi, M.; Nomura, M. Metabolome analysis of milk fermented by gamma-aminobutyric acid-producing Lactococcus lactis. J. Dairy Sci. 2016, 99, 994–1001. [Google Scholar] [CrossRef] [PubMed]
  30. Mazzei, P.; Piccolo, A. 1H HRMAS-NMR metabolomic to assess quality and traceability of mozzarella cheese from Campania buffalo milk. Food Chem. 2012, 132, 1620–1627. [Google Scholar] [CrossRef] [PubMed]
  31. Sumner, L.W.; Amberg, A.; Barrett, D.; Beale, M.H.; Beger, R.; Daykin, C.A.; Fan, T.W.; Fiehn, O.; Goodacre, R.; Griffin, J.L.; et al. Proposed minimum reporting standards for chemical analysis Chemical Analysis Working Group (CAWG) Metabolomics Standards Initiative (MSI). Metabolomics 2007, 3, 211–221. [Google Scholar] [CrossRef] [PubMed]
Sample Availability: Samples of all dairy products are available from the authors.
Figure 1. Principal component analysis (PCA) score plots (S plots) of three groups of samples. Data were obtained in positive electrospray ionization (ESI+: AB, CD, EF) and negative electrospray ionization (ESI: ab, cd, ef) ion modes.
Molecules 23 00735 g001
Figure 2. Orthogonal partial least squares discriminant analysis (OPLS-DA): S-plots of the data for three groups of samples (AB, CD, EF) obtained in ESI+ ion mode.
Molecules 23 00735 g002
Table 1. Metabolites showing a significant difference between samples in positive and negative ion modes.
RT (min)m/zIdentitiesMFMPFold-Changep-Value
Group AB/Positive
0.896285.02244-AminobutyraldehydeC4H9NOAA0.422.38 × 10−5
0.7689248.02134,4′-SulfonyldianilineC12H12N2O2SAA248,0906.23 × 10−5
0.8486163.0584N-Acetyl-l-cysteineC5H9NO3S-0.527.50 × 10−5
0.8739145.0474l-allysineC6H11NO3-0.380.01876
0.9598289.0916Asp-ArgC10H19N5O5PP0.00518763.63 × 10−7
0.9691127.0359N-CyclohexylformamideC7H13NO-0.070.00059
0.9945254.1610Hexadecenoic acidC16H30O2LL0.021.31 × 10−8
1.5347120.7750PhenylacetaldehydeC8H8OAA1.362.46 × 10−5
1.6726100.07094-MethylpentanalC6H12OLL12.841.76 × 10−8
2.6366146.0578l-LysineC6H14N2O2AA/SM/LL/MT/CV/TL3.154.14 × 10−5
2.6422188.0694homo-cis-AconitateC7H8O6AA3.972.96 × 10−5
3.7878227.1748DeoxycytidineC9H13N3O4NT240,0706.62 × 10−7
3.9296246.1697Methionyl prolineC10H18N2O3STL191,1300.00021
5.2484141.0520HistidinolC6H11N3OAA/SM4.64 × 10−71.35 × 10⁻⁶
8.7712230.1133ErgothioneineC9H15N3O2SAA9.161.83 × 10−9
5.2484126.0279ThymineC5H6N2O2NT0.00013418.27 × 10−9
6.0582120.0774PurineC5H4N4NT/CH286,0002.64 × 10−7
8.2841251.1497DeoxyadenosineC10H13N5O3NT197,9204.11 × 10−7
9.4986231.1697Gly-argC8H17N5O3PP4.87 × 10−61.42 × 10⁻⁶
14.6231274.2742Lys-LysC12H26N4O3PP123.700.00381
15.2054149.0212l-MethionineC5H11NO2SAA/TL/SM1.62 × 10−61.29 × 10⁻⁵
Group AB/Negative
1.5263252.0899His-ProC11H16N4O3PP1.91 × 10−70.00020
1.6961229.1568Pro-AsnC9H15N3O4PP4,255,8002.97 × 10−7
2.3017119.0502ThreonineC4H9NO3AA2.59 × 10−72.52 × 10⁻⁹
2.6692236.0936Ala-Phe-AlaC12H16N2O3PP3.33 × 10−73.00 × 10⁻⁷
1.0490218.0679N-AcetylserotoninC12H14N2O2AA3.40 × 10−75.55 × 10⁻⁶
2.0917109.0293AminophenolC6H7NOAA3.78 × 10−75.44 × 10⁻⁸
4.6603277.1568Arg-CysC9H19N5O3SPP1,862,3000.00020
1.5262188.0940Ethyl glutarateC9H16O4-5.78 × 10−76.58 × 10−6
2.5673140.1082Ethyl furoateC7H8O3-5.92 × 10−75.11 × 10−6
2.2441158.1203Pentyl butyrateC9H18O2-1.40 × 10−63.29 × 10−5
0.709595.9522Sodium propionateC3H5NaO2-578,6604.89 × 10−5
1.8233144.0477Octanoic acidC8H16O2-504,8400.00070
1.7620175.0628l-CitrullineC6H13N3O3AA/SM371,4000.00043
1.7515115.0419l-ProlineC5H9NO2AA/SM/MT/TL360,6008.55 × 10−5
1.0344305.0895Thr-TrpC15H19N3O4PP0.0001046.20 × 10−6
1.5826242.0134ThymidineC10H14N2O5NT0.0008729.14 × 10−9
1.7400180.0685d-FructoseC6H12O6CH604.441.32 × 10−6
1.5606162.0562TrimethylamineC3H9NEG/CH0.0029534.10 × 10−7
0.7924197.0226N-Hydroxy-l-tyrosineC9H11NO4SM<0.0036011.43 × 10−5
2.7630204.0687Ala-AspC7H12N2O5PP<0.0044263.90 × 10−5
1.0189190.0735Asp-GlyC6H10N2O5PP0.011.80 × 10−7
1.7732252.0892Ala-TyrC12H16N2O4PP140.780.00041
2.5732263.1406Asn-MetC9H17N3O4SPP132.268.29 × 10−7
0.7738149.0453l-MethionineC5H11NO2SAA/TL/SM0.0115861.33 × 10−5
1.0465146.0453L-LysineC6H14N2O2AA/SM/LL/MT/CV/TL0.022.29 × 10−5
0.9995129.0195IsoquinolineC9H7NAA/SM0.031.56 × 10−9
0.9995220.0733Met-AlaC8H16N2O3SPP0.030.00019
1.4599181.0513TyrosineC9H11NO3AA0.042.68 × 10−7
1.4716258.0065His-CysC9H14N4O3SPP0.067.40 × 10−7
0.7334105.0183l-SerineC3H7NO3AA/SM0.074.63 × 10−5
1.0926117.0190l-ValineC5H11NO2AA0.071.43 × 10−6
1.4746163.0403N-Acetyl-l-cysteineC5H9NO3S-0.091.96 × 10−5
1.4847119.0499ThreonineC4H9NO3AA0.102.38 × 10−5
1.4851135.0452l-HomocysteineC4H9NO2SAA/SM0.116.19 × 10−5
1.3484218.1040Thr-ValC9H18N2O4PP0.133.68 × 10−5
1.7620208.0990Cys-SerC6H12N2O4SPP7.350.00038
1.7771147.0336O-Acetyl-l-serineC5H9NO4AA6.190.00068
Group CD/Positive
0.9984343.1224Coenzyme BC11H22NO7PS-2.54 × 10−63.37 × 10−11
1.0121149.2115MethionineC5H11NO2SAA/SM0.570.00035
3.7640227.1748PretyrosineC10H13NO5AA89,5061.12 × 10−7
0.7825360.1494AldosteroneC21H28O5LL87,4891.23 × 10−8
8.2828229.1543Pro-AsnC9H15N3O4PP5852.702.76 × 10−7
8.7424245.1130β-Alanyl-l-arginineC9H19N5O3-693.81245.11300
0.8106219.0260O-SuccinylhomoserineC8H13NO6AA0.001788219.02600
0.7955203.0515Lys-GlyC8H17N3O3PP0.0136651.92 × 10−9
1.0017145.04712-OxoglutaramateC5H7NO4AA0.039.12 × 10−9
0.979485.0226PiperidineC5H11NAA0.341.46 × 10−6
Group CD/Negative
0.805759.0112TrimethylamineC3H9NEG0.051.41 × 10−7
0.697479.9565PyrimidineC4H4N2NT/AA/CH34,6770.00034
2.4645103.0543N,N-DimethylglycineC4H9NO2AA0.0004953.01 × 10−5
0.8080119.0356l-HomoserineC4H9NO3AA0.036.21 × 10−11
3.0080119.0507ThreonineC4H9NO3AA45,0260.00058
4.8198121.0595l-CysteineC3H7NO2SAA4.295.07 × 10−6
0.8044125.02525-MethylcytosineC5H7N3OAA/SM0.071.95 × 10−6
1.0160129.02064-OxoprolineC5H7NO3AA0.301.53 × 10−6
0.7957131.0359l-LeucineC6H13NO2AA18.698.05 × 10−5
1.7654147.0343O-Acetyl-l-serineC5H9NO4AA12.010.00037
0.7748161.0462O-Acetyl-l-homoserineC6H11NO4AA0.351.09 × 10−5
1.7504162.0563Gly-SerC5H10N2O4PP31,1597.46 × 10−5
2.9981165.0566l-PhenylalanineC9H11NO2AA/TL1,200,1000.00061
1.0140177.0224N-Formyl-l-methionineC6H11NO3SAA13.717.75 × 10−5
1.5544181.0513TyrosineC9H11NO3AA0.440.00051
4.4615193.0874PhenylacetylglycineC10H11NO3AA1062.600.00031
0.7555202.9701CystathionineC7H14N2O4SAA57,7530.00044
1.6778208.0980Cys-SerC6H12N2O4SPP3.775.36 × 10−5
1.6254222.0797Gly-PheC11H14N2O3PP5.030.00029
5.0840226.0190CarnosineC9H14N4O3AA14.70226.01900
0.8045236.0386Ser-MetC8H16N2O4SPP53,5410.00051
2.9149242.0137ThymidineC10H14N2O5NT0.128.74 × 10−5
1.7009252.0893Pro-HisC11H16N4O3PP111.387.03 × 10−9
2.5898263.1405Met-AsnC9H17N3O4SPP568.340.00035
0.7992269.0884His-AsnC10H15N5O4PP0.063.72 × 10−5
2.8149283.0847Gln-HisC11H17N5O4PP151,1900.00049
1.6477293.1519Lys-PheC15H23N3O3PP73.110.00022
0.8082341.1089His-TrpC17H19N5O3PP0.0010723.93 × 10−12
Group EF/Positive
0.7924133.0260Aspartic acidC4H7NO4-109.940.00018
0.8467163.0592N-Acetyl-l-cysteineC5H9NO3S-2.940.00824
3.9198187.0960N-HeptanoylglycineC9H17NO3-6.411.18 × 10−8
0.9499193.0341PhenylacetylglycineC10H11NO3-106.369.63 × 10−5
0.9514210.0607d-Glucaric acidC6H10O8-608.640.00012
1.9229232.1542Asp-ValC9H16N2O5PP4.482.74 × 10−8
0.9217235.0874Cys-AsnC7H13N3O4SPP1.76 × 10−50.00808
3.9316246.1701Leu-AspC10H18N2O5PP6.994.74 × 10−9
0.7986248.0219Asp-AspC8H12N2O7PP214,9300.00021
0.9859254.1610His-ValC11H18N4O3PP0.080.00063
14.5615274.2738Lys-LysC12H26N4O3PP6.13 × 10−70.00424
0.8153293.0983Gln-PheC14H19N3O4PP753760.001205
0.8302360.1497Trp-ArgC17H24N6O3PP11.743.78 × 10−5
Group EF/Negative
0.783989.0235l-AlanineC3H7NO2AA/SM/TL1.06 × 10−50.00079
0.740495.9509Methanesulfonic acidCH4O3SEG1387.501.19 × 10−5
0.6579107.9440BenzoquinoneC6H4O2SM4959.204.51 × 10−6
0.9486111.0112CytosineC4H5N3ONT3.656.50 × 10−5
1.6075115.0384l-ProlineC5H9NO2AA/SM5.531.06 × 10−5
1.5504117.0549l-ValineC5H11NO2AA/TL/SM20.243.07 × 10−7
1.6300119.0499l-HomoserineC4H9NO3AA2.02 × 10−50.00039
0.9670129.01864-OxoprolineC5H7NO3AA61287.20 × 10−8
0.7902146.9834Glutamic acidC5H9NO4-1.34 × 10−58.08 × 10−5
0.6532152.91723-Sulfino-l-alanineC3H7NO4S-106,1000.00022
1.7560160.0406d-Alanyl-d-alanineC6H12N2O3-4.43 × 10−50.00197
0.7889161.0465O-Acetyl-l-homoserineC6H11NO4-0.210.00013
0.9159211.0028PhosphocreatineC4H10N3O5P-51.190.00298
1.3969218.1037Thr-ValC9H18N2O4PP0.260.00024
1.7541239.9973l-CystineC6H12N2O4S2-<0.010.00303
0.7222291.0835Ser-TrpC14H17N3O4PP89.855.05 × 10−5
10.5696293.1765Lys-PheC15H23N3O3PP0.0015260.00025
0.7730426.9988Adenosine diphosphateC10H15N5O10P2-6227.707.00 × 10−5
Notes: RT, retention time; m/z, the measured m/z; MF, molecular formula; MP, Metabolic pathway; AA, Amino acid metabolites; PP, peptides; EG, energy metabolites; LL, lipid metabolites; NT, nucleotide metabolites; SM, biosynthesis of secondary metabolites; MT, membrane transport; CV, metabolism of cofactors and vitamins; CH, carbohydrate metabolism; TL, translation; “-”, unknown pathway.

