Preliminary Quality Evaluation and Characterization of Phenolic Constituents in Cynanchi Wilfordii Radix

 ,
,
Abstract
:1. Introduction
2. Results and Discussion
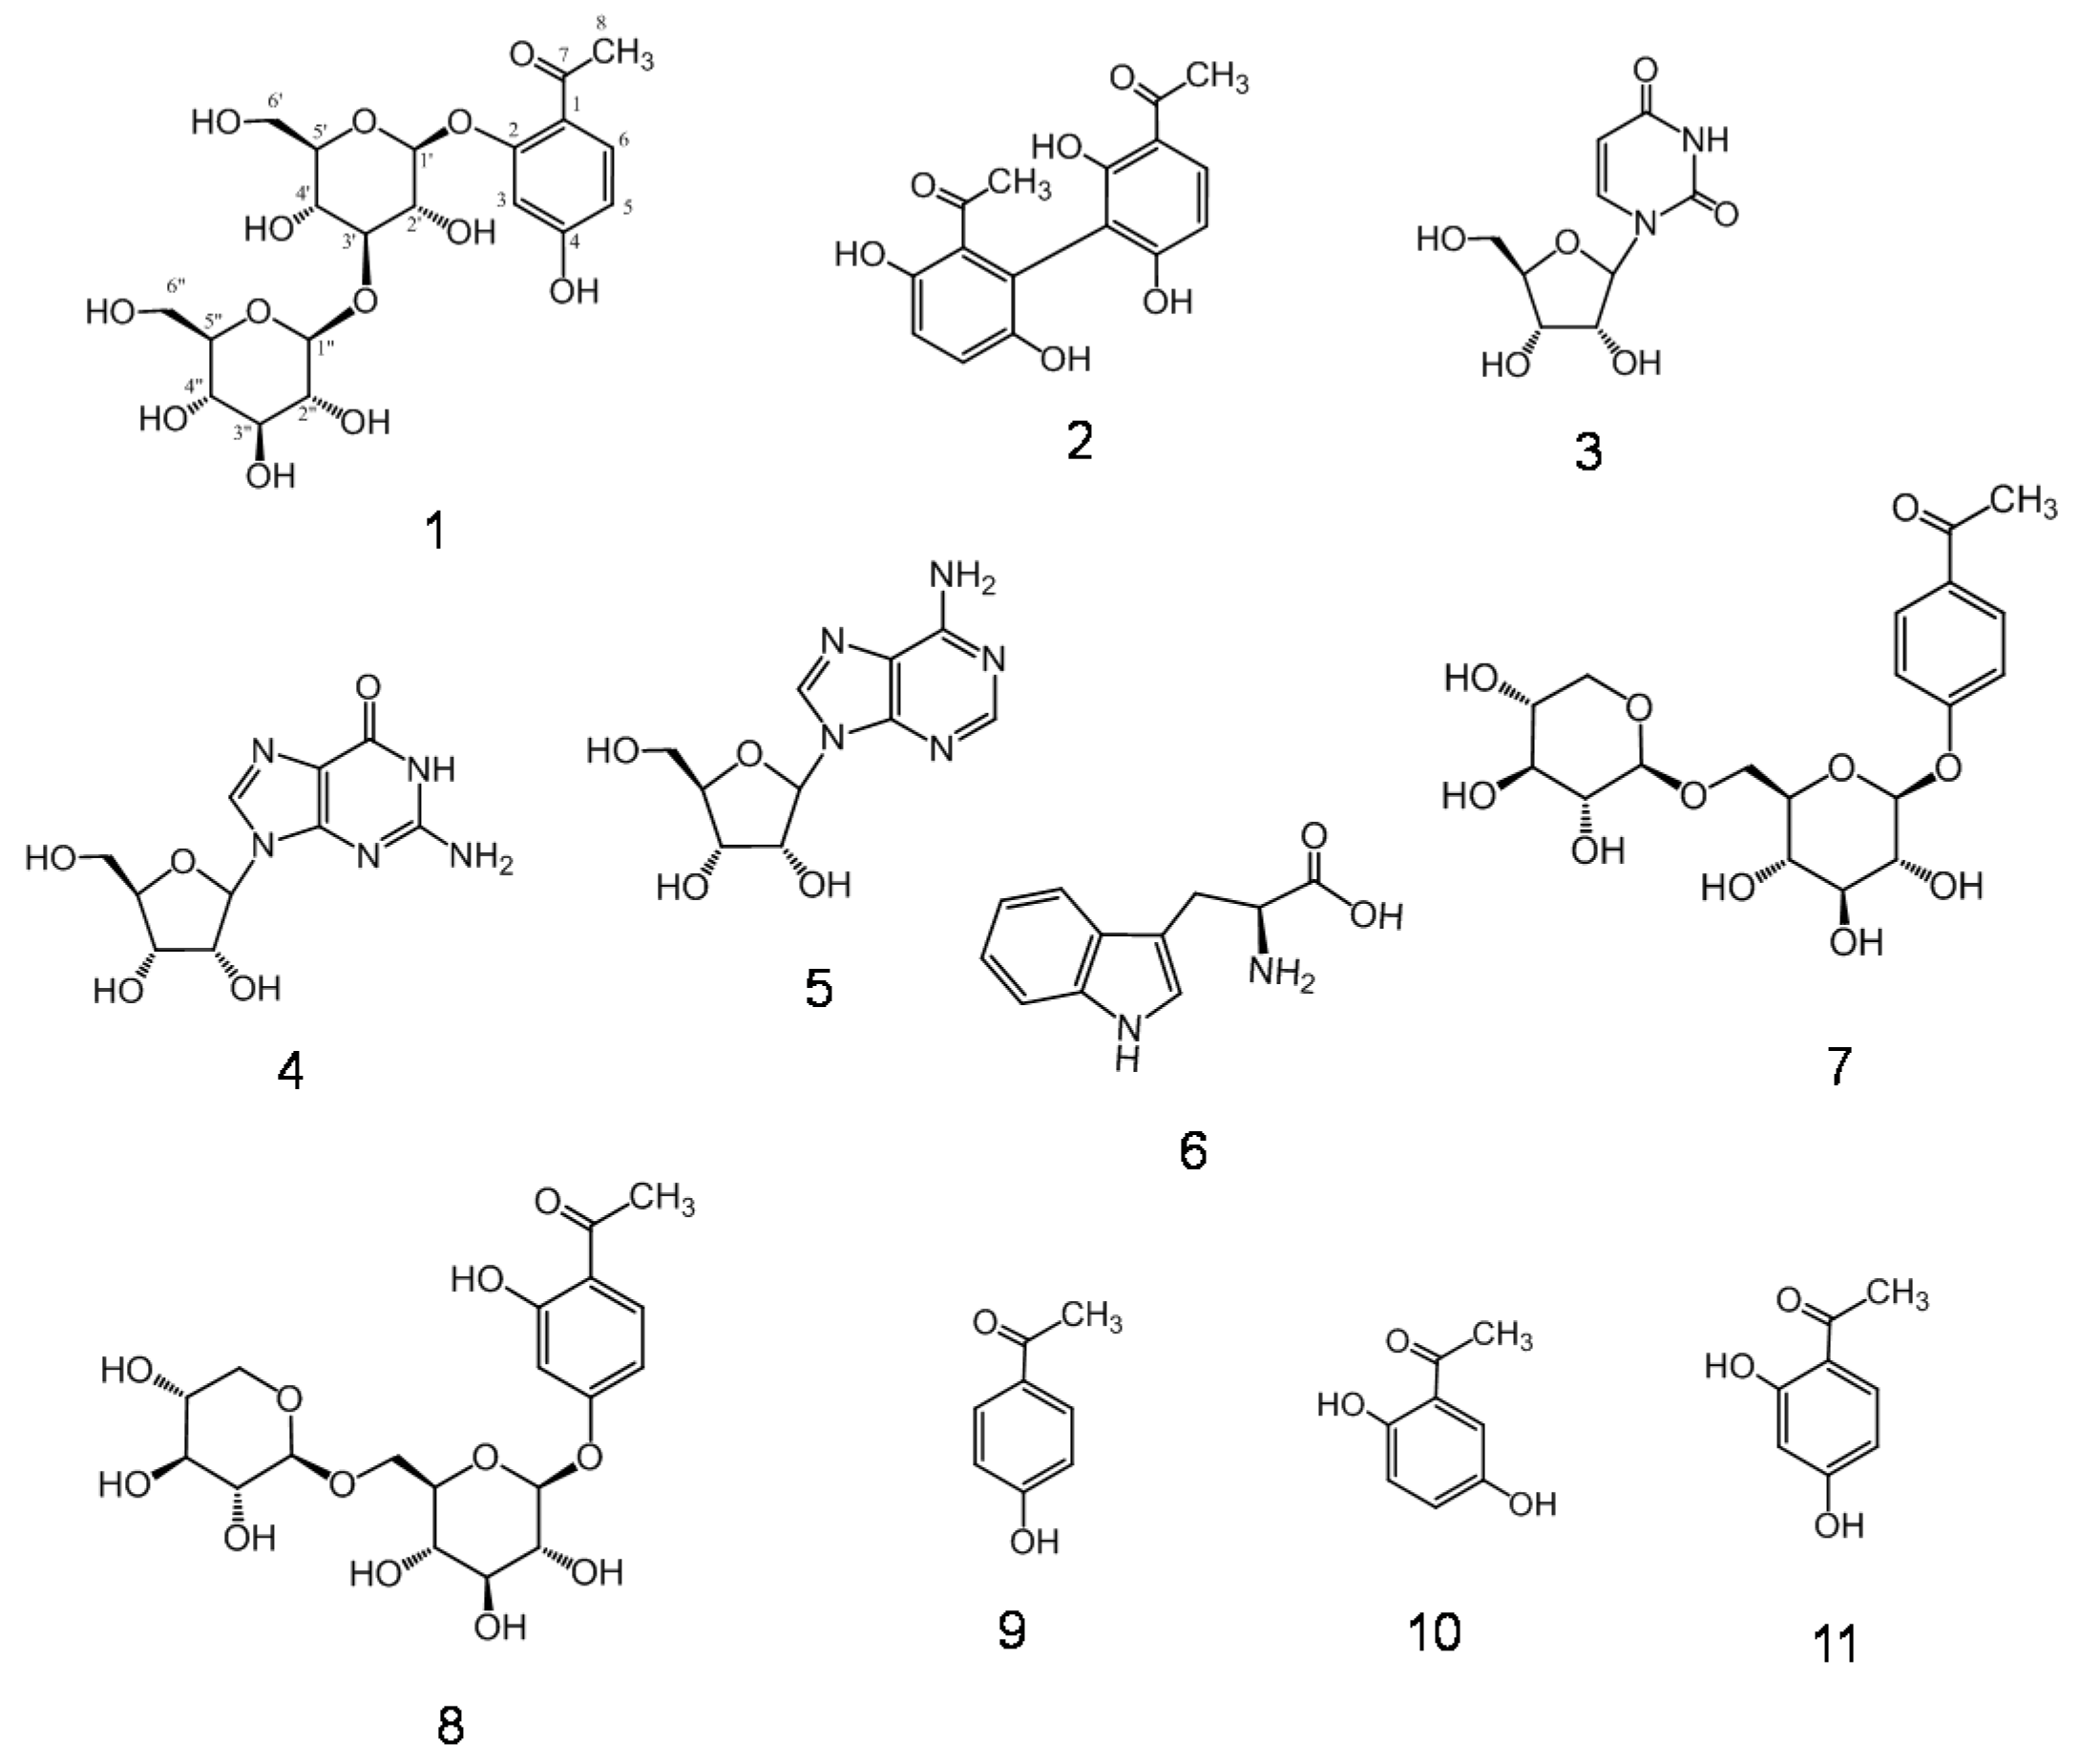
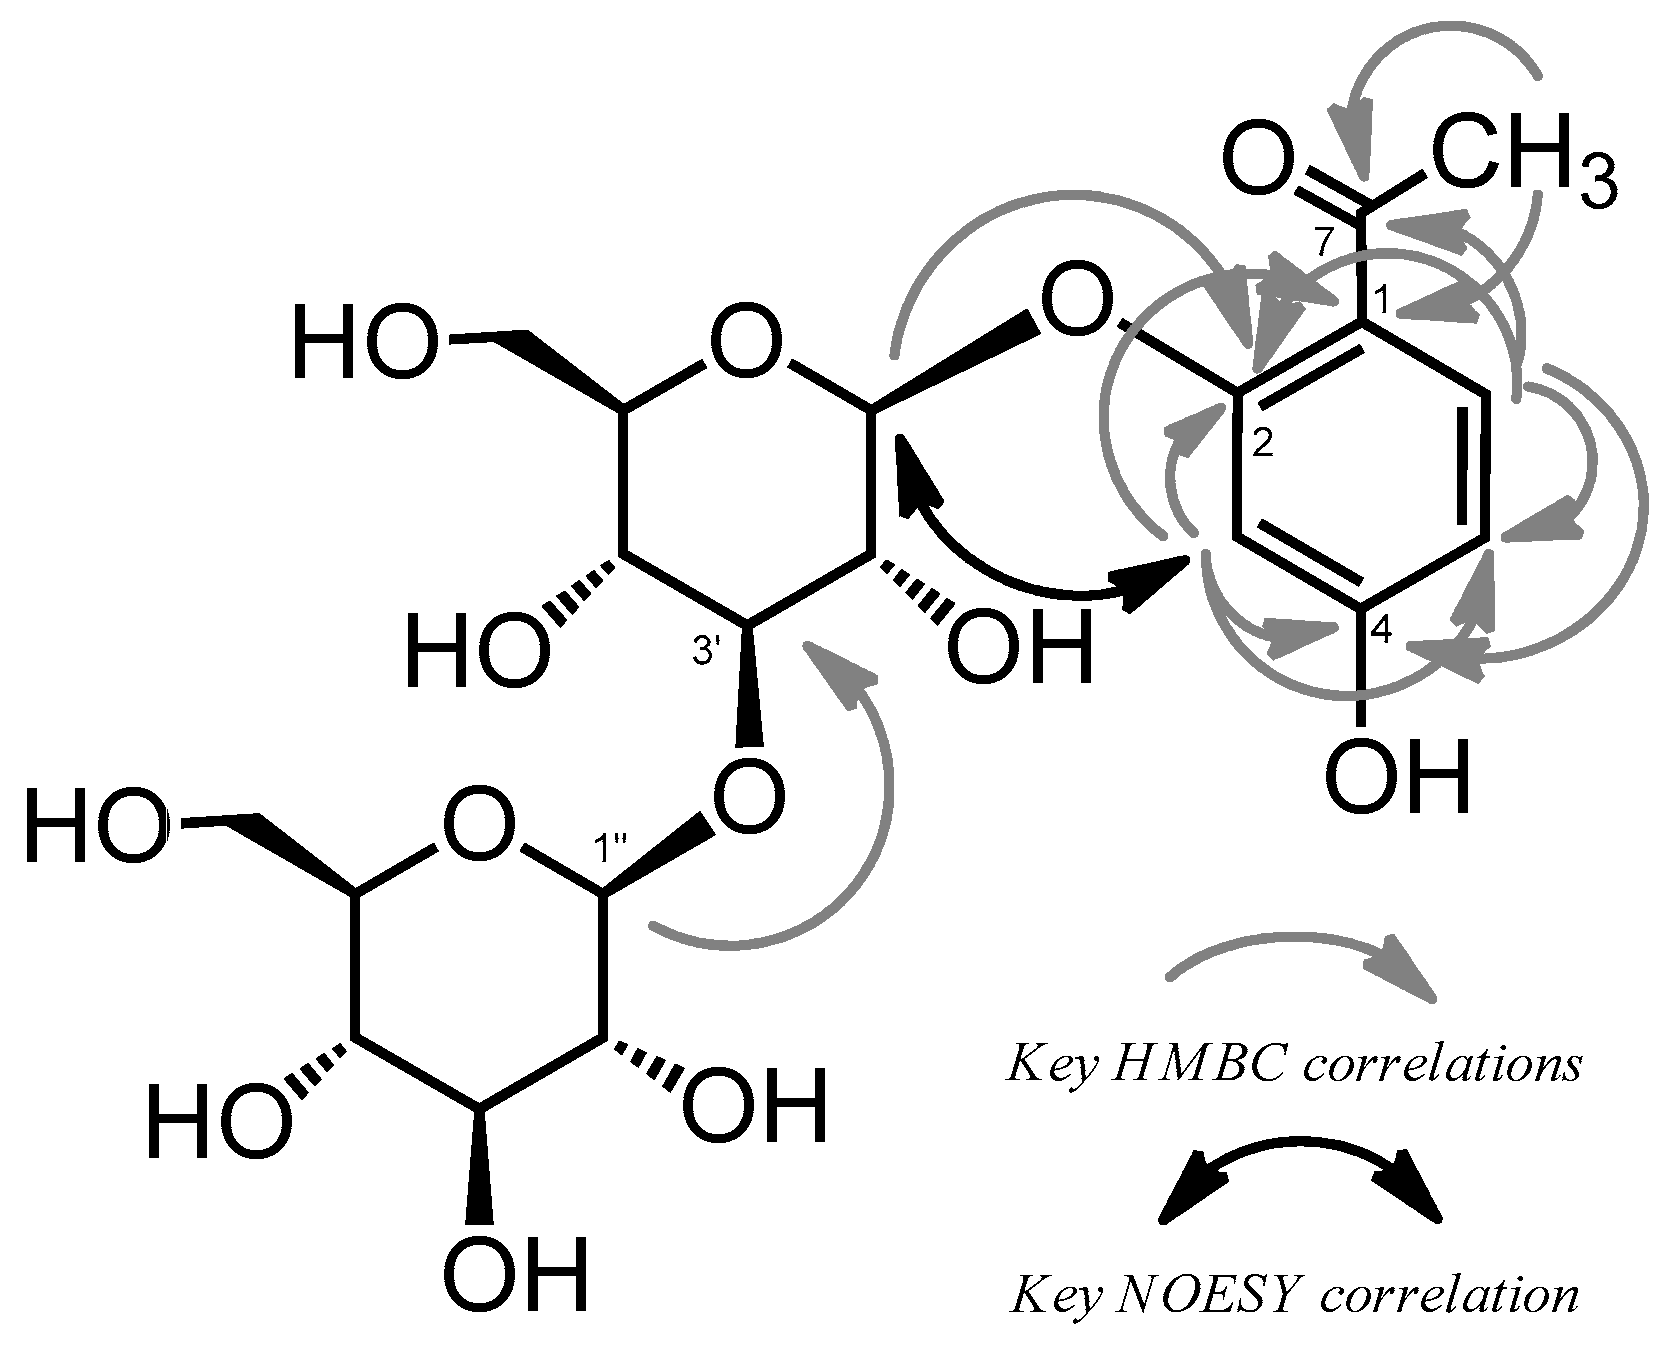
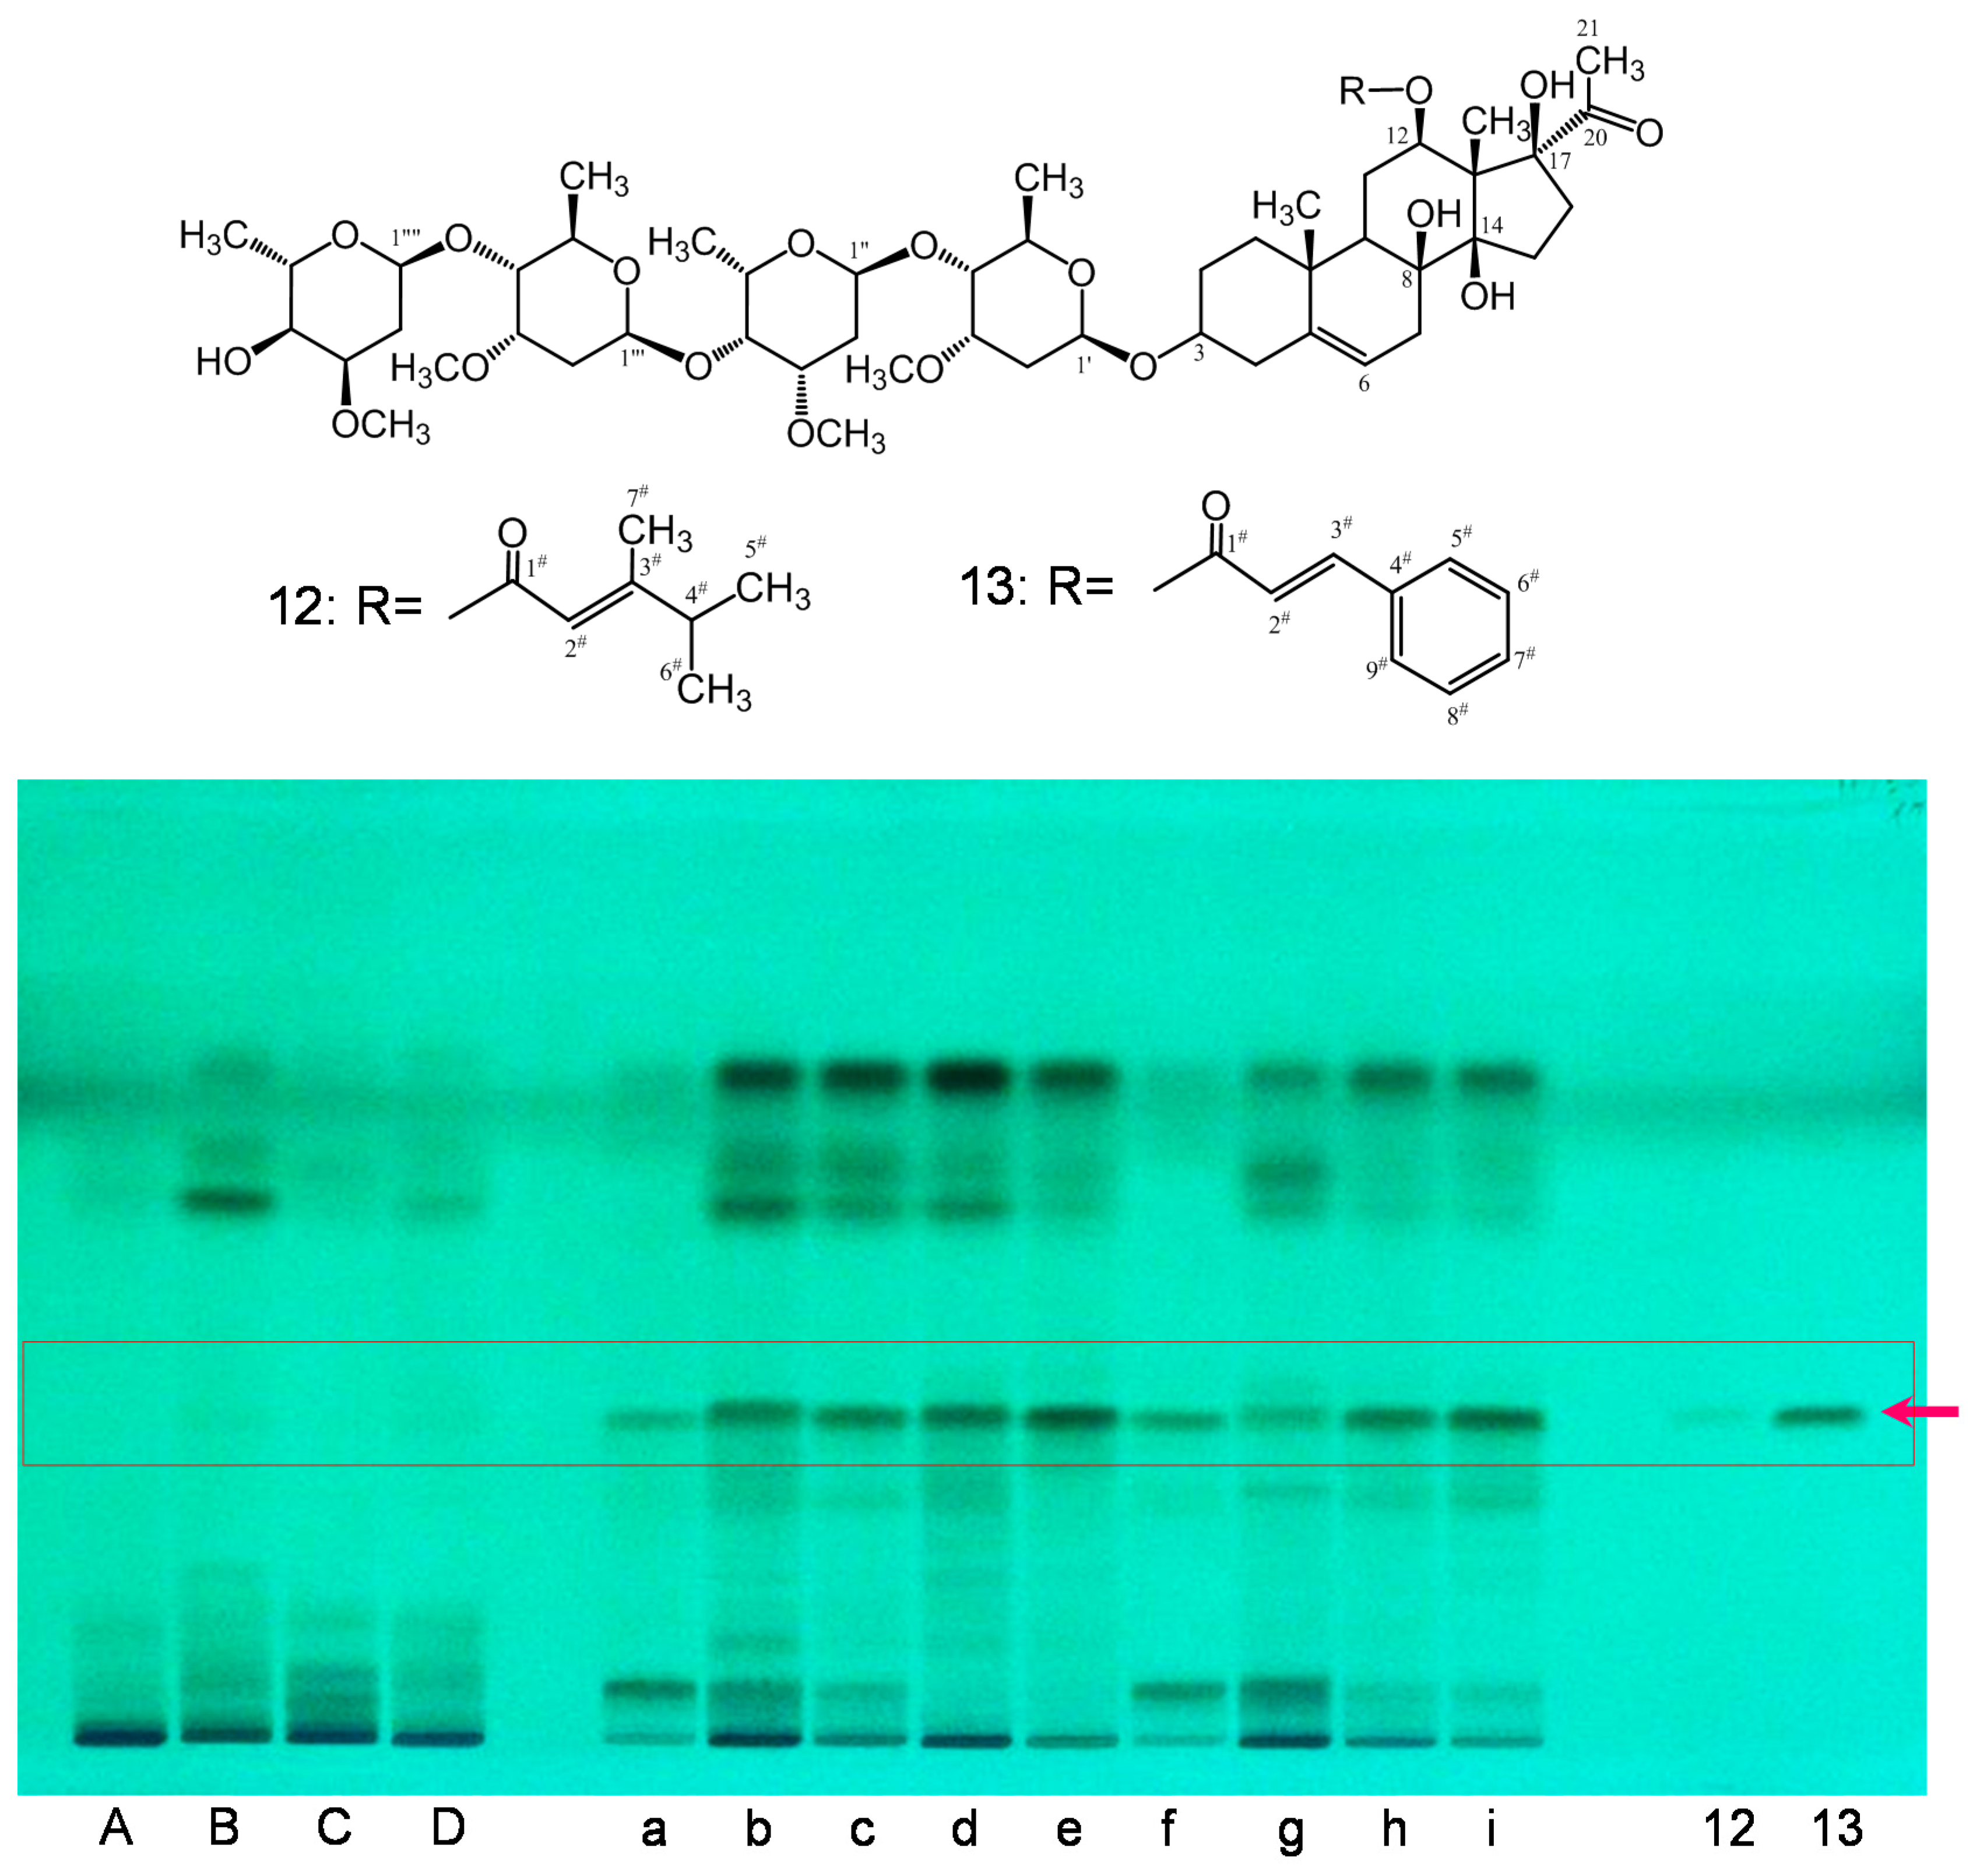
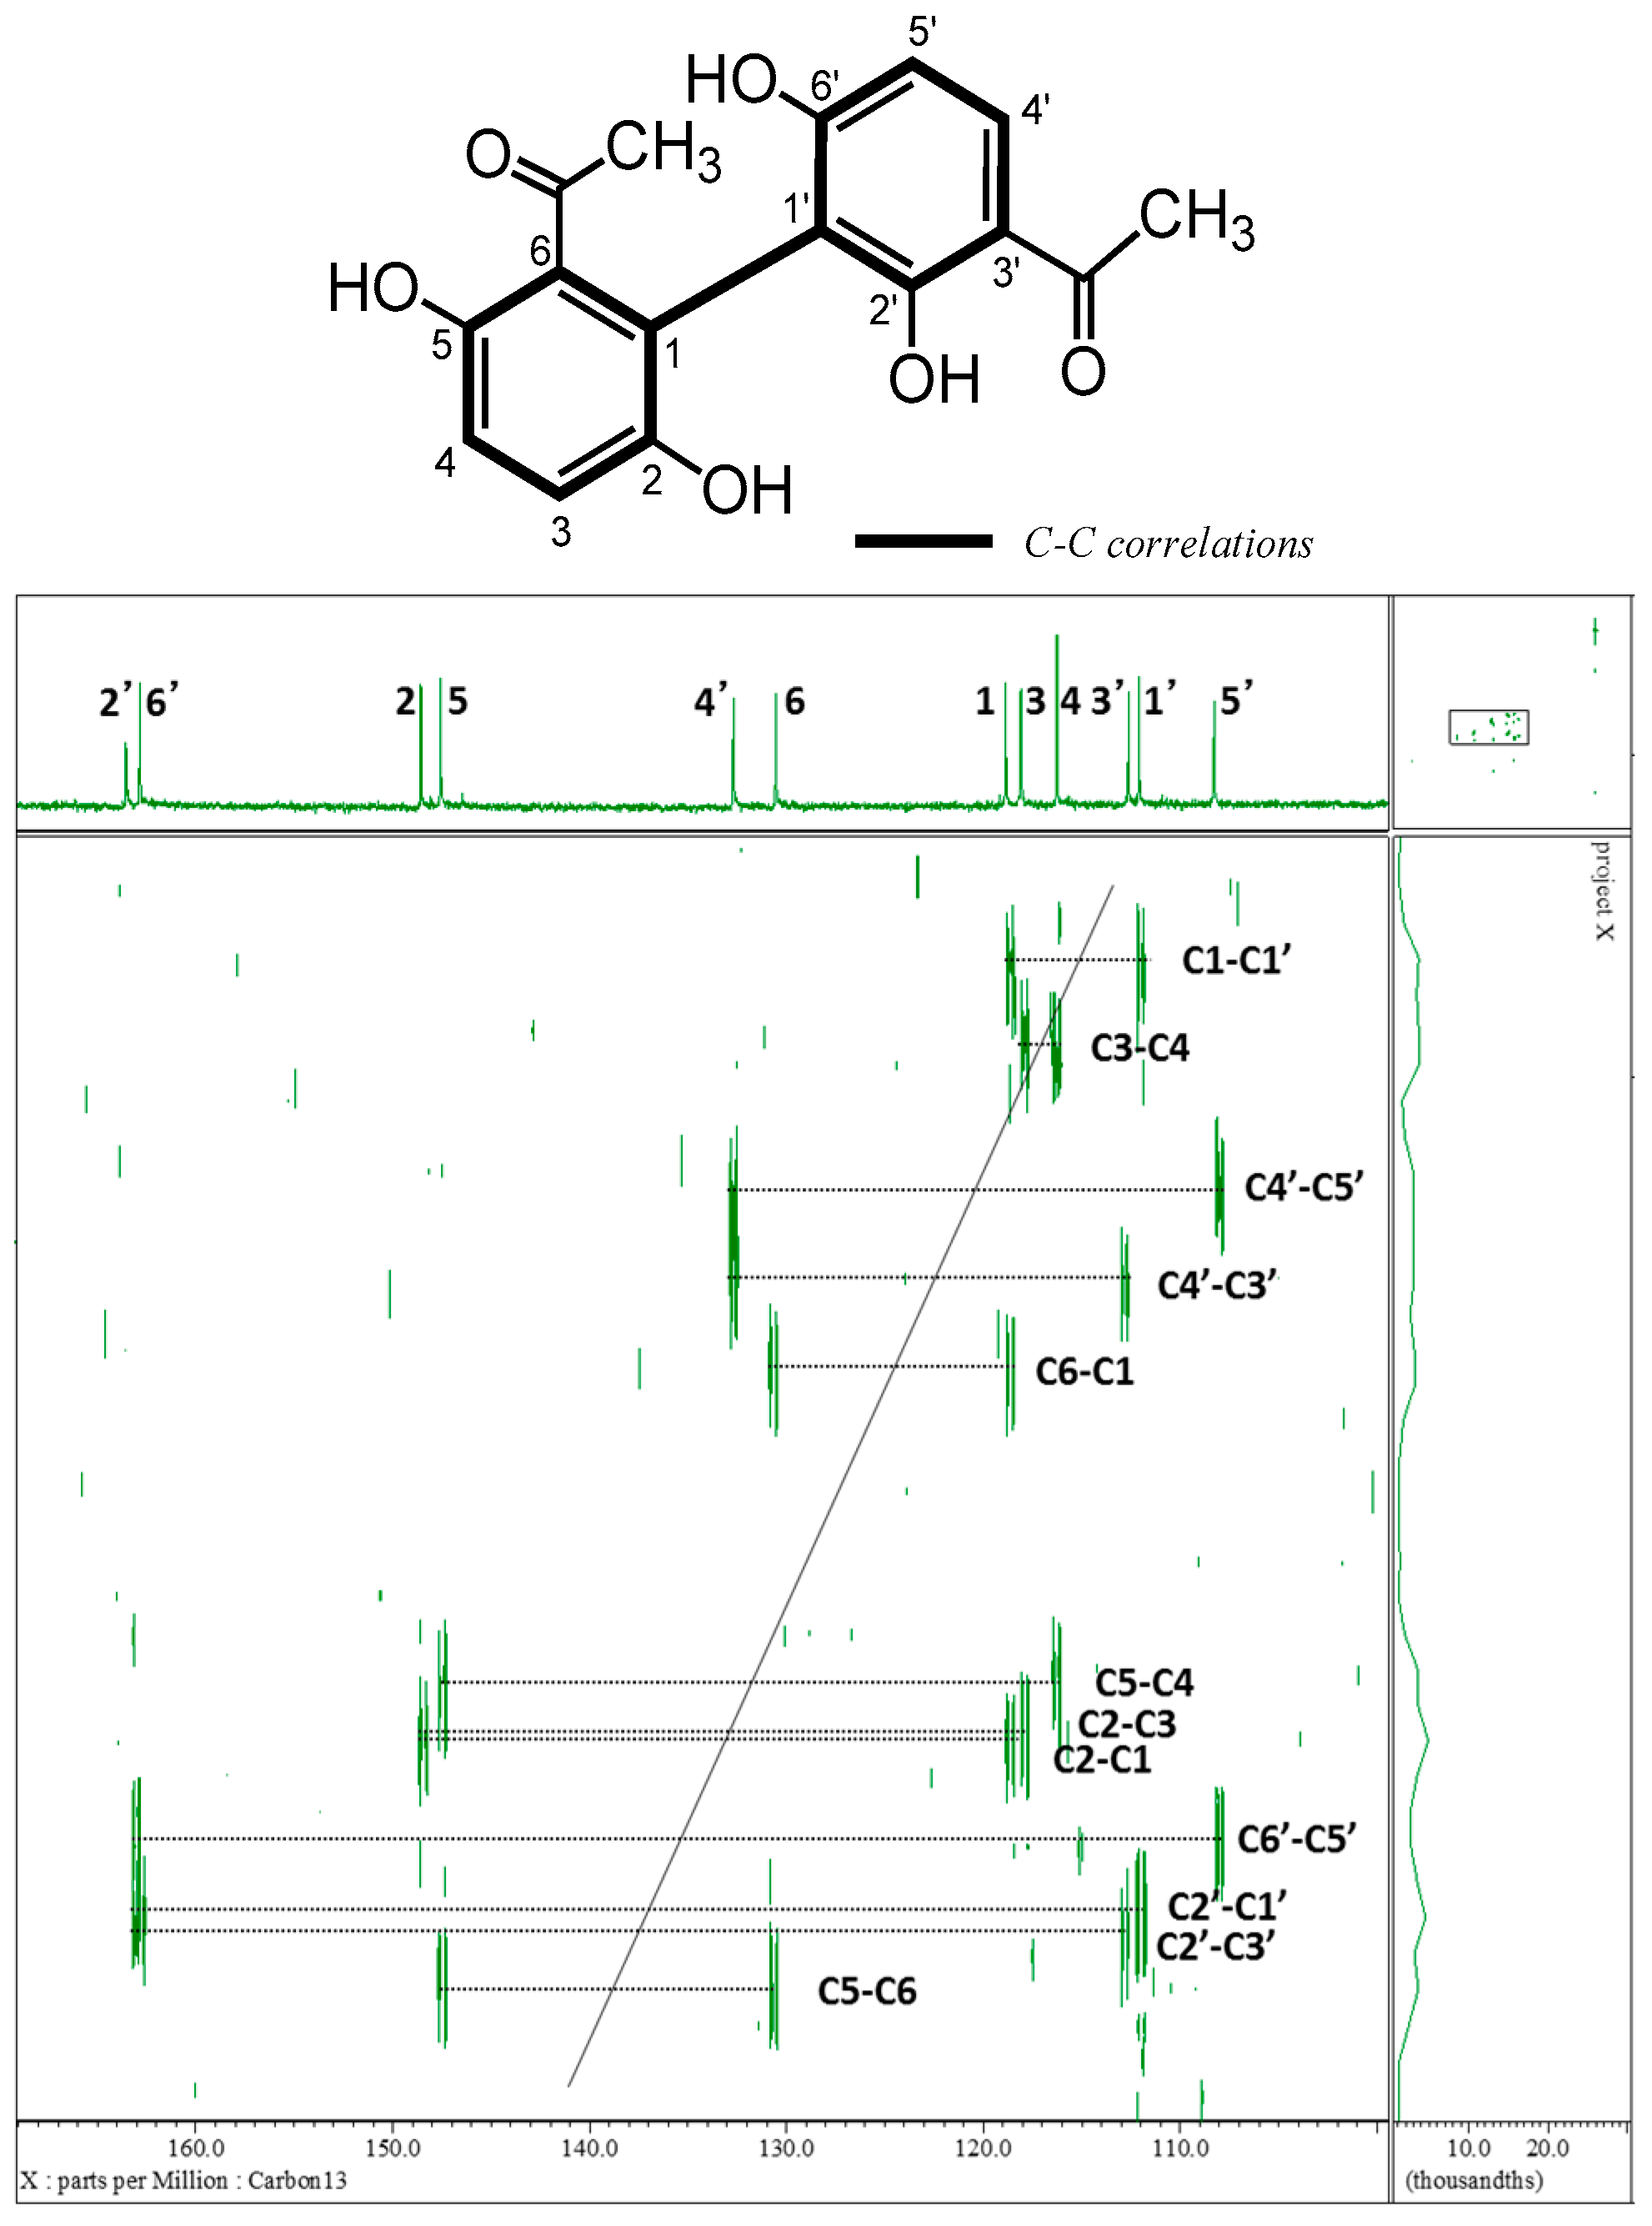
2.1. Isolation and Characterization
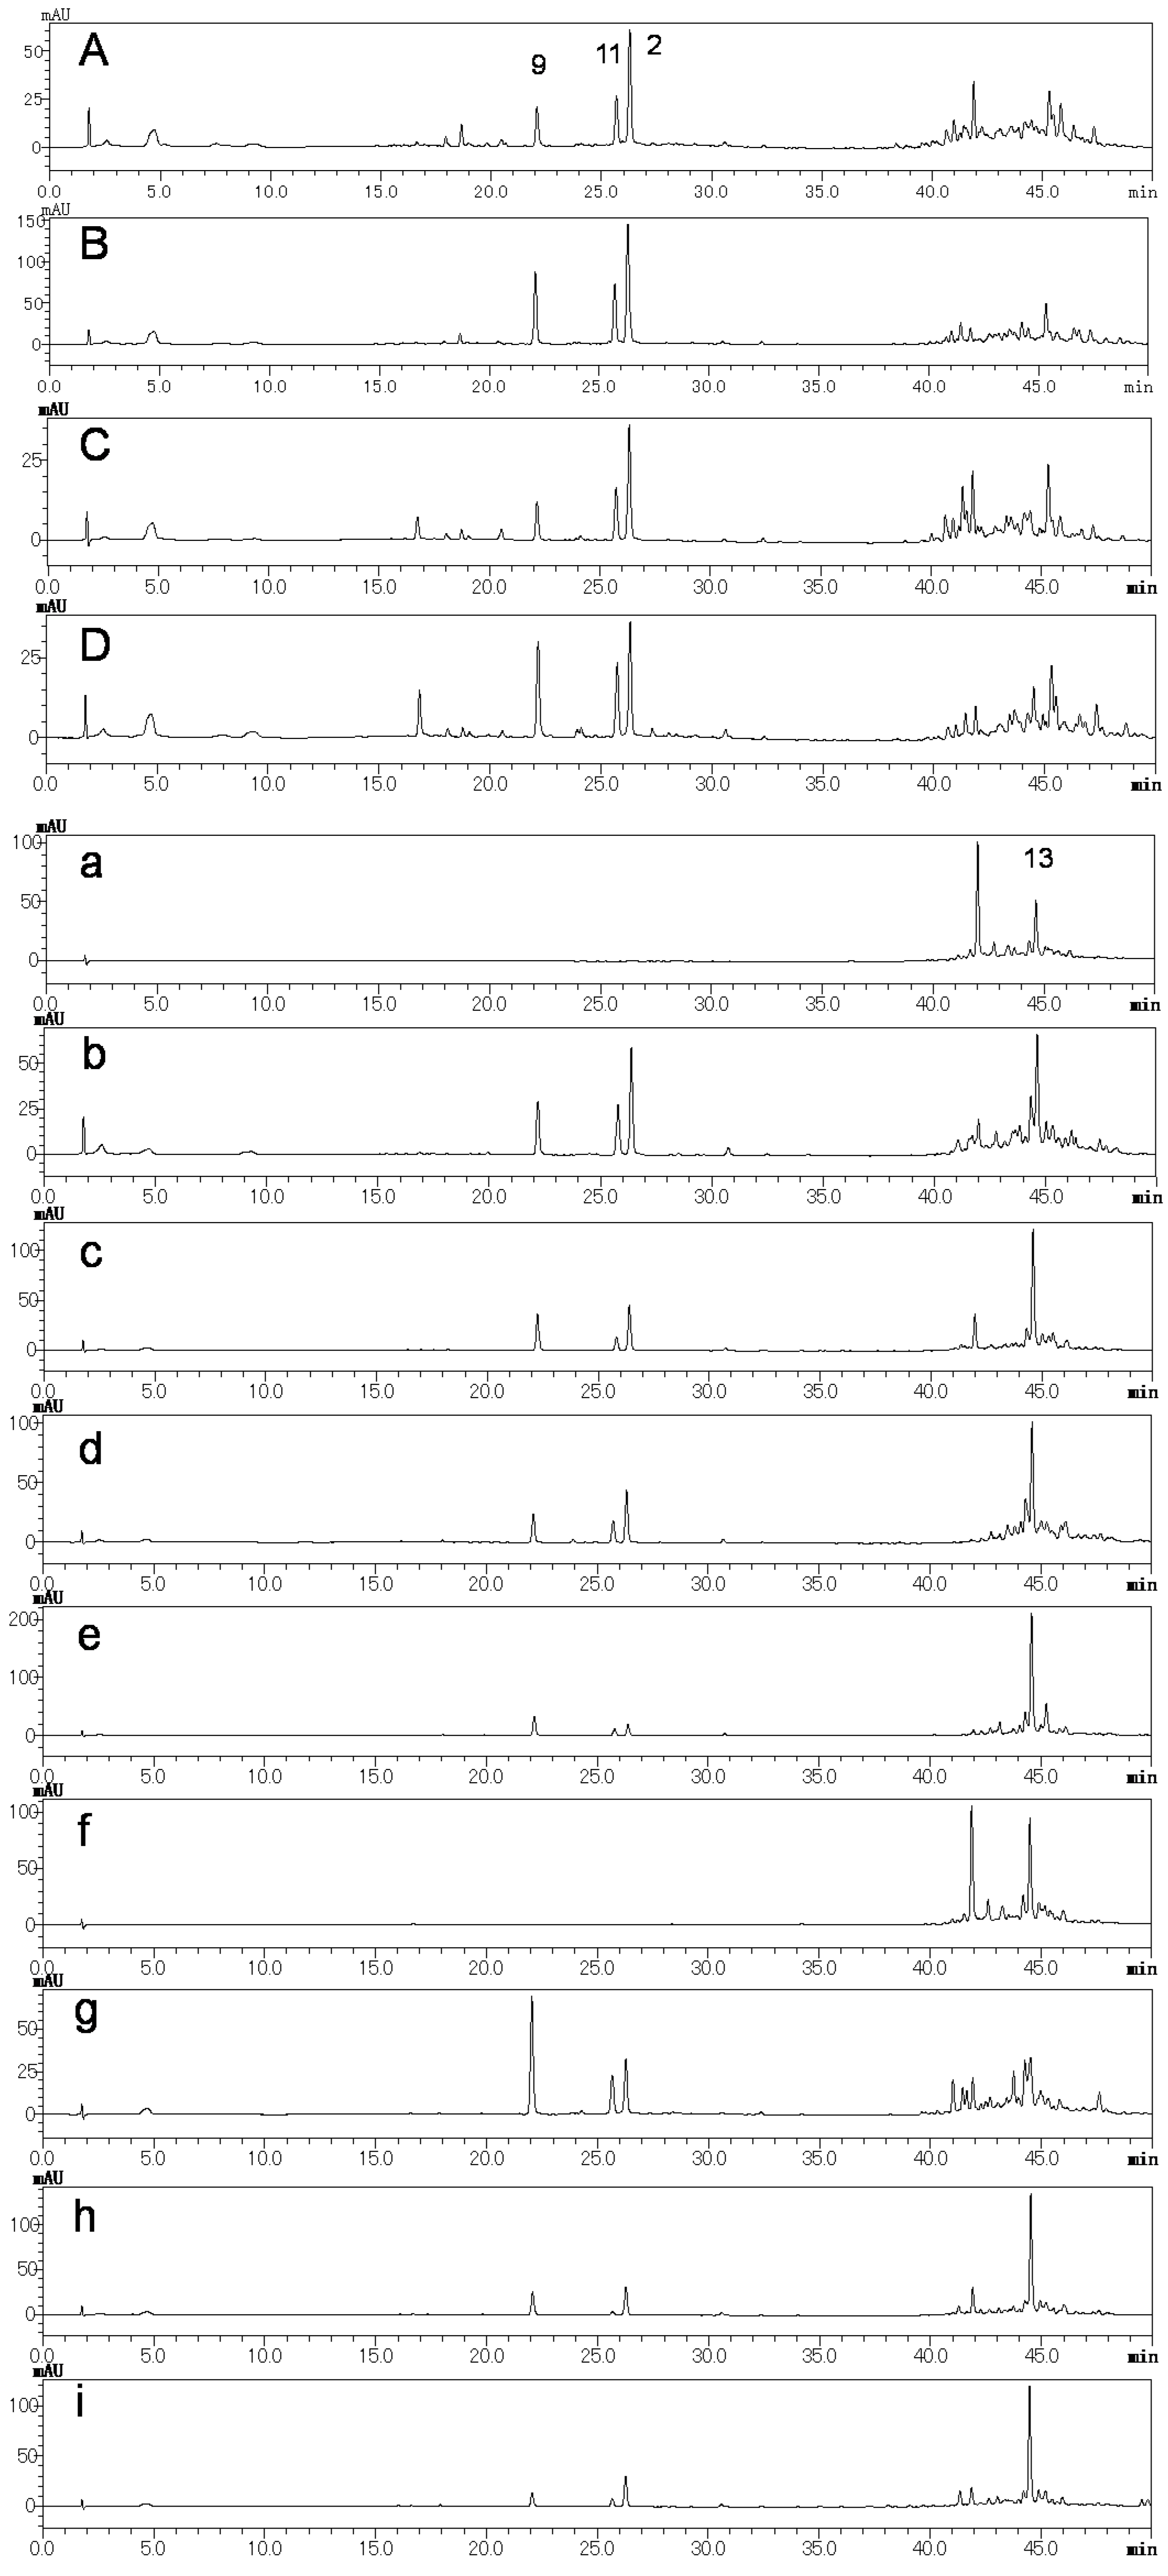
2.2. Preliminary Quality Evaluation of CWR and CAR Using TLC
3. Experimental Section
3.1. General
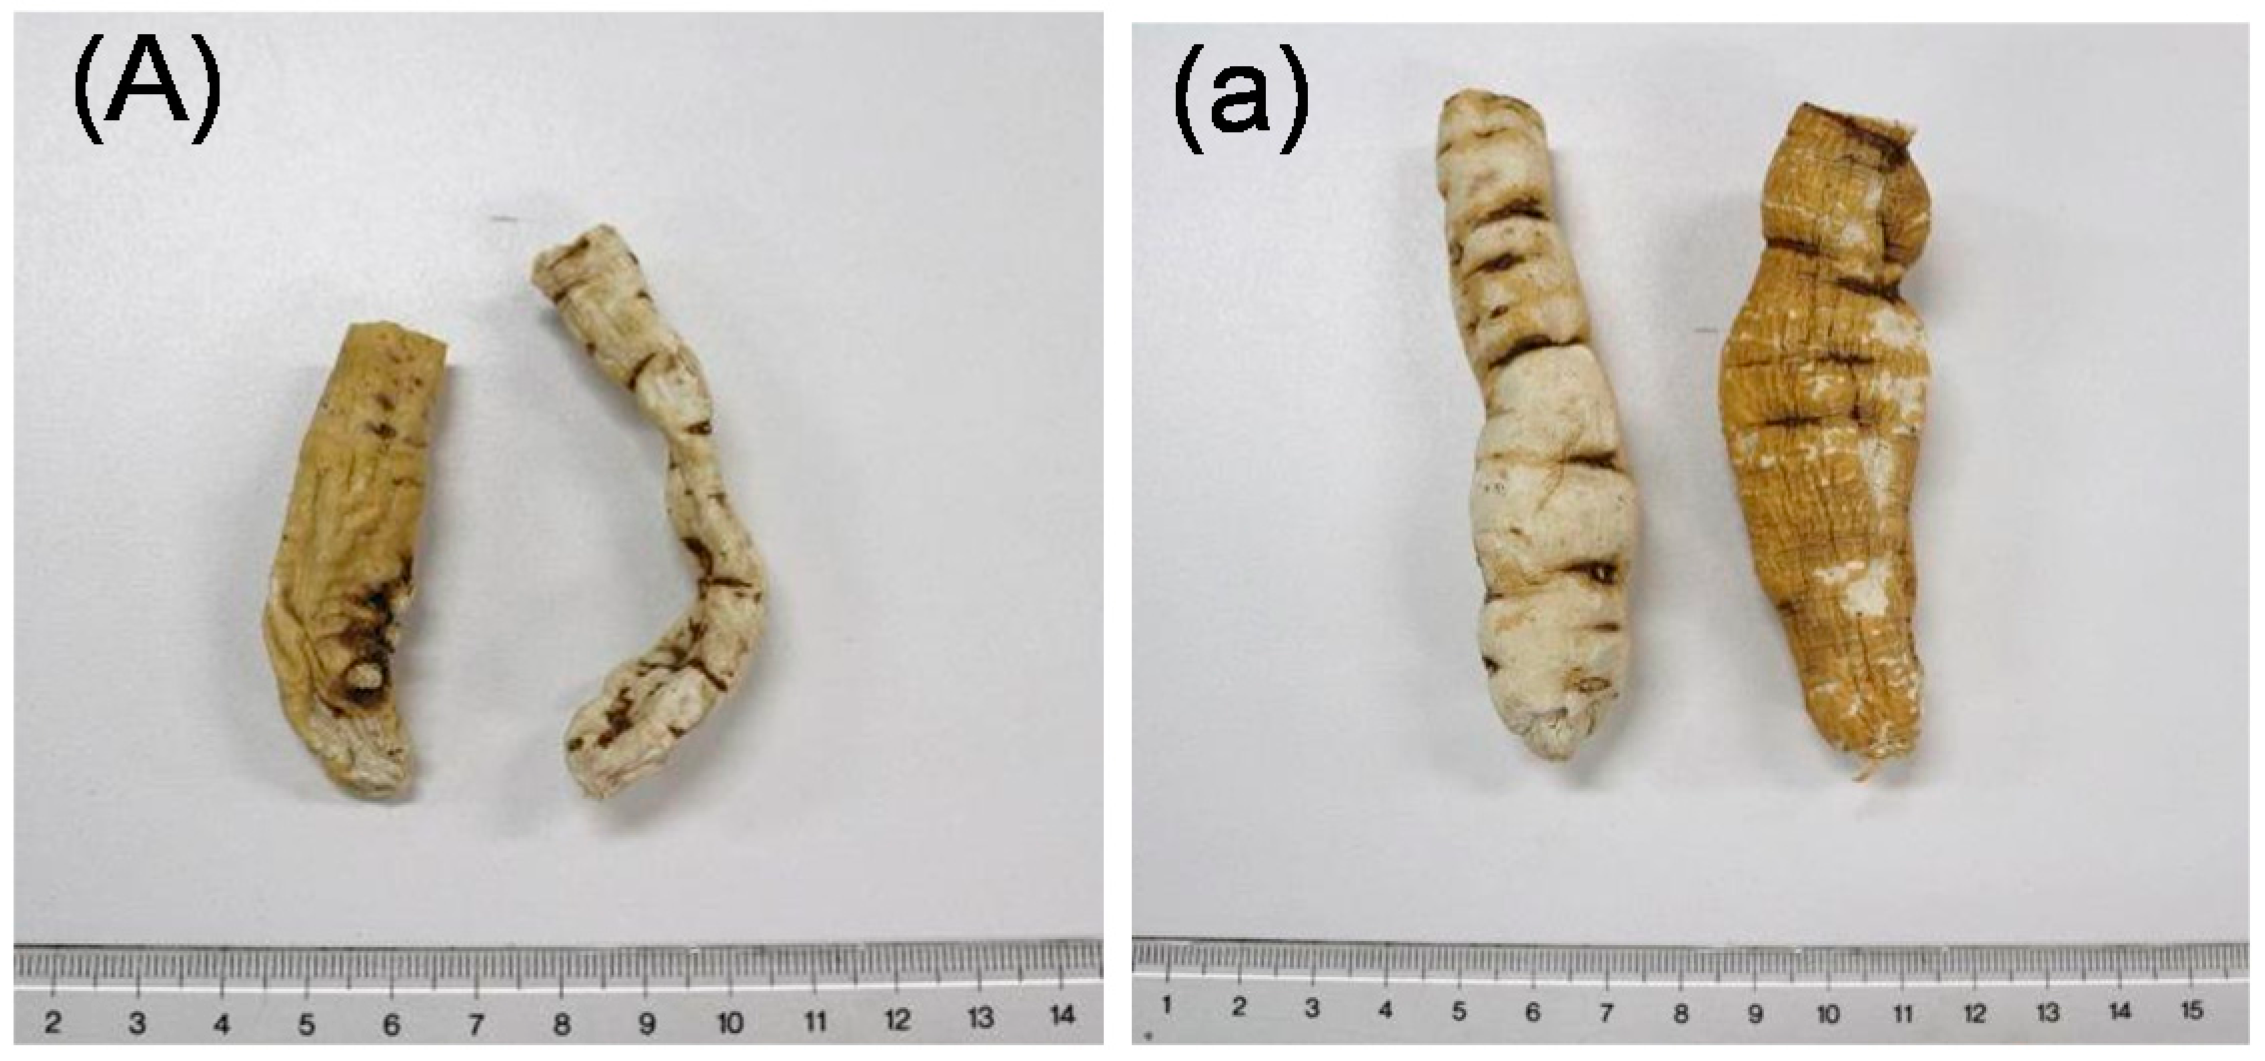
3.2. Materials
3.3. Extraction and Isolation
3.4. Partial Acid Hydrolysis of Compound 1
3.5. Determination of Sugar Configuration of Compound 1
3.6. Preparation of Test Solution of the Crude Drugs for HPLC and TLC
4. Conclusions
Supplementary Materials
Acknowledgments
Author Contributions
Conflicts of Interest
References
- Korea Food and Drug Administration. The Korean Herbal Pharmacopoeia; Korea Food and Drug Administration: Seoul, Korea, 2002; p. 98. [Google Scholar]
- Ministry of Food and Drug Safety, Korea. Available online: http://www.mfds.go.kr/index.do?mid=676&seq=27270 (accessed on 25 January 2018).
- Division of Safety Information on Drug and Food, National Institute of Health Sciences. Food Safety Information. Available online: http://www.nihs.go.jp/hse/food-info/foodinfonews/2015/foodinfo201509c.pdf (accessed on 25 January 2018).
- U.S. Food and Drug Administration (FDA). FDA Poisonous Plant Database. Available online: https://www.accessdata.fda.gov/scripts/Plantox/Detail.CFM?ID=11513 (accessed on 25 January 2018).
- Sato-Masumoto, N.; Uchikura, T.; Sugiwaki, H.; Yoshimura, M.; Masada, S.; Atsumi, T.; Watanabe, M.; Tanaka, N.; Uchiyama, N.; Amakura, Y.; et al. Survey on the original plant species of crude drugs distributed as Cynanchi Wilfordii radix and its related crude drugs in the korean and chinese markets. Biol. Pharm. Bull. 2017, 40, 1693–1699. [Google Scholar] [CrossRef] [PubMed]
- Tsukamoto, S.; Hayashi, K.; Mistuhashi, H. Studies on the constitunets of Asclepiadanceae plants. LX. Further studies on glycosides with a novel sugar chain containing a pair of optically isomeric sugars, d- and l-cymarose, from Cynanchum wilfordi. Chem. Pharm. Bull. 1985, 33, 2294–2304. [Google Scholar] [CrossRef]
- Hwang, B.Y.; Kim, S.E.; Kim, Y.H.; Kim, H.S.; Hong, Y.-S.; Ro, J.S.; Lee, K.S.; Lee, J.J. Pregnane glycosides multidrug-resistance modulators from Cynanchum wilfordii. J. Nat. Prod. 1999, 62, 640–643. [Google Scholar] [CrossRef] [PubMed]
- Yoon, M.-Y.; Choi, N.H.; Min, B.S.; Choi, G.J.; Choi, Y.H.; Jang, K.S.; Han, S.-S.; Cha, B.; Kim, J.-C. Potent in vivo antifugal activity against powdery mildews of pregnane glycosides from the roots of Cynanchum wilfordii. J. Agric. Food Chem. 2011, 59, 12210–12216. [Google Scholar] [CrossRef] [PubMed]
- Li, J.-L.; Gao, Z.-B.; Zhao, W.-M. Identification and evaluation of antiepilepic activity of C21 steroidal glycosides from the roots of Cynanchum wilfordii. J. Nat. Prod. 2016, 79, 89–97. [Google Scholar] [CrossRef] [PubMed]
- Hwang, B.Y.; Kim, Y.H.; Ro, J.S.; Lee, K.S.; Lee, J.J. Acetophenones from roots of Cynanchum wilfordii HEMSLEY. Arch. Pharm. Res. 1999, 22, 72–74. [Google Scholar] [CrossRef] [PubMed]
- Li, J.-L.; Fu, Y.F.; Zhang, H.-Y.; Zhao, W.-M. Two new humulanolides from the root of Cynanchum wilfordii. Tetrahedron Lett. 2015, 56, 6503–6505. [Google Scholar] [CrossRef]
- Jiang, Y.F.; Choi, H.G.; Li, Y.; Park, Y.M.; Lee, J.H.; Kim, D.H.; Lee, J.-H.; Son, J.K.; Na, M.; Lee, S.H. Chemical constitunets of Cynanchum wilfodii and the chemotaxonomy of two species of the family Aslepiadacease, C. wilfordii and C. auriculatum. Arch. Pharm. Res. 2011, 34, 2021–2027. [Google Scholar] [CrossRef] [PubMed]
- Li, Y.; Piao, D.; Zang, H.; Woo, M.-H.; Lee, J.-H.; Moon, D.-C.; Lee, S.-H.; Chang, H.W.; Son, J.K. Quality assessment and discrimination of the roots of Cynanchum auriculatum and Cynanchum wilfordii by HPLC-UV analysis. Arch. Pharm. Res. 2013, 36, 335–344. [Google Scholar] [CrossRef] [PubMed]
- Lin, C.-N.; Huang, P.-L.; Lu, C.-M.; Yen, M.-H.; Wu, R.-R. Revised structure for five acetophenoes from Cynanchum taiwanianum. Phytochemistry 1997, 44, 1359–1363. [Google Scholar]
- SDBSWeb. National Institute of Advanced Industrial Science and Technology. Available online: http://sdbs.db.aist.go.jp (accessed on 25 January 2018).
- Li, J.; Kadota, S.; Kawata, Y.; Hattori, M.; Xu, G.-J.; Namba, T. Constutuents of the roots of Cynanchum bungei DECNE. Isoation and structures of four new glucosides, bungeiside-A, -B, -C, and -D. Chem. Pharm. Bull. 1992, 40, 3133–3137. [Google Scholar] [CrossRef] [PubMed]
- Tanaka, T.; Nakashima, T.; Ueda, T.; Tomii, K.; Kouno, I. Facile discrimination of aldose enantiomers by reversed-phase HPLC. Chem. Pharm. Bull. 2007, 55, 899–901. [Google Scholar] [CrossRef] [PubMed]
- Liu, S.; Chen, Z.; Wu, J.; Wang, L.; Wang, H.; Zhao, W. Appetite suppressing pregnane glycosides from the roots of Cynanchum auriculatum. Phytochemistry 2013, 93, 144–153. [Google Scholar] [CrossRef] [PubMed]
Sample Availability: Samples of the compounds 1–13 are available from the authors. |


| Positions | δC | δH (J in Hz) |
|---|---|---|
| 1 | 121.3 | |
| 2 | 160.9 | |
| 3 | 103.7 | 6.69 (d, J = 2.0) |
| 4 | 164.9 | |
| 5 | 110.8 | 6.50 (dd, J = 2.0, 8.5) |
| 6 | 133.3 | 7.68 (d, J = 8.5) |
| 7 | 200.3 | |
| 8 | 32.1 | 2.62 (3H, s) |
| Glucose-1′ | 102.1 | 5.05 (d, J = 7.5) |
| 2′ | 74.1 | 3.74 (m) d |
| 3′ | 88.2 | 3.67 (t, J = 9.0) |
| 4′ | 69.7 | 3.54 (t, J = 9.0) |
| 5′ | 78.0 a | 3.52 (m) d |
| 6′ | 62.4 b | 3.94 (dd, J = 1.5, 12.0) c, 3.75 (m) c,d |
| Glucose-1″ | 105.3 | 4.58 (d, J = 7.5) |
| 2″ | 75.5 | 3.30 (m) d |
| 3″ | 77.9 a | 3.39 (t, J = 9.5) |
| 4″ | 71.6 | 3.30 (m) d |
| 5″ | 78.2 a | 3.35 (m) d |
| 6″ | 62.6 b | 3.89 (dd, J = 2.0, 11.5) c, 3.63 (m) c,d |
| Products | Crude Drug | Locality | Market |
|---|---|---|---|
| A | Cynanchi Wilfordii Radix (CWR) | Korea | Korea |
| B | Cynanchi Wilfordii Radix (CWR) | Korea | Korea |
| C | Cynanchi Wilfordii Radix (CWR) | Yeongcheon | Korea |
| D | Cynanchi Wilfordii Radix (CWR) | Yeongcheon | Korea |
| a | Cynanchi Auriculati Radix (CAR) | Jiangsu | China |
| b | Cynanchi Auriculati Radix (CAR) | Jiangsu | China |
| c | Cynanchi Auriculati Radix (CAR) | Jiangsu | China |
| d | Cynanchi Auriculati Radix (CAR) | Jiangsu | China |
| e | Cynanchi Auriculati Radix (CAR) | Jiangsu | China |
| f | Cynanchi Auriculati Radix (CAR) | Jiangsu | China |
| g | Cynanchi Auriculati Radix (CAR) | Jiangsu | China |
| h | Cynanchi Auriculati Radix (CAR) | Korea | Korea |
| i | Cynanchi Auriculati Radix (CAR) | Korea | Korea |
© 2018 by the authors. Licensee MDPI, Basel, Switzerland. This article is an open access article distributed under the terms and conditions of the Creative Commons Attribution (CC BY) license (http://creativecommons.org/licenses/by/4.0/).
Share and Cite
Uchikura, T.; Tanaka, H.; Sugiwaki, H.; Yoshimura, M.; Sato-Masumoto, N.; Tsujimoto, T.; Uchiyama, N.; Hakamatsuka, T.; Amakura, Y. Preliminary Quality Evaluation and Characterization of Phenolic Constituents in Cynanchi Wilfordii Radix. Molecules 2018, 23, 656. https://doi.org/10.3390/molecules23030656
Uchikura T, Tanaka H, Sugiwaki H, Yoshimura M, Sato-Masumoto N, Tsujimoto T, Uchiyama N, Hakamatsuka T, Amakura Y. Preliminary Quality Evaluation and Characterization of Phenolic Constituents in Cynanchi Wilfordii Radix. Molecules. 2018; 23(3):656. https://doi.org/10.3390/molecules23030656
Chicago/Turabian StyleUchikura, Takashi, Hiroaki Tanaka, Hidemi Sugiwaki, Morio Yoshimura, Naoko Sato-Masumoto, Takashi Tsujimoto, Nahoko Uchiyama, Takashi Hakamatsuka, and Yoshiaki Amakura. 2018. "Preliminary Quality Evaluation and Characterization of Phenolic Constituents in Cynanchi Wilfordii Radix" Molecules 23, no. 3: 656. https://doi.org/10.3390/molecules23030656