Qualitative and Quantitative Phytochemical Analysis of Different Extracts from Thymus algeriensis Aerial Parts

 , , , , , ,
  and
and
Abstract
:1. Introduction
2. Experimental Section
2.1. Materials
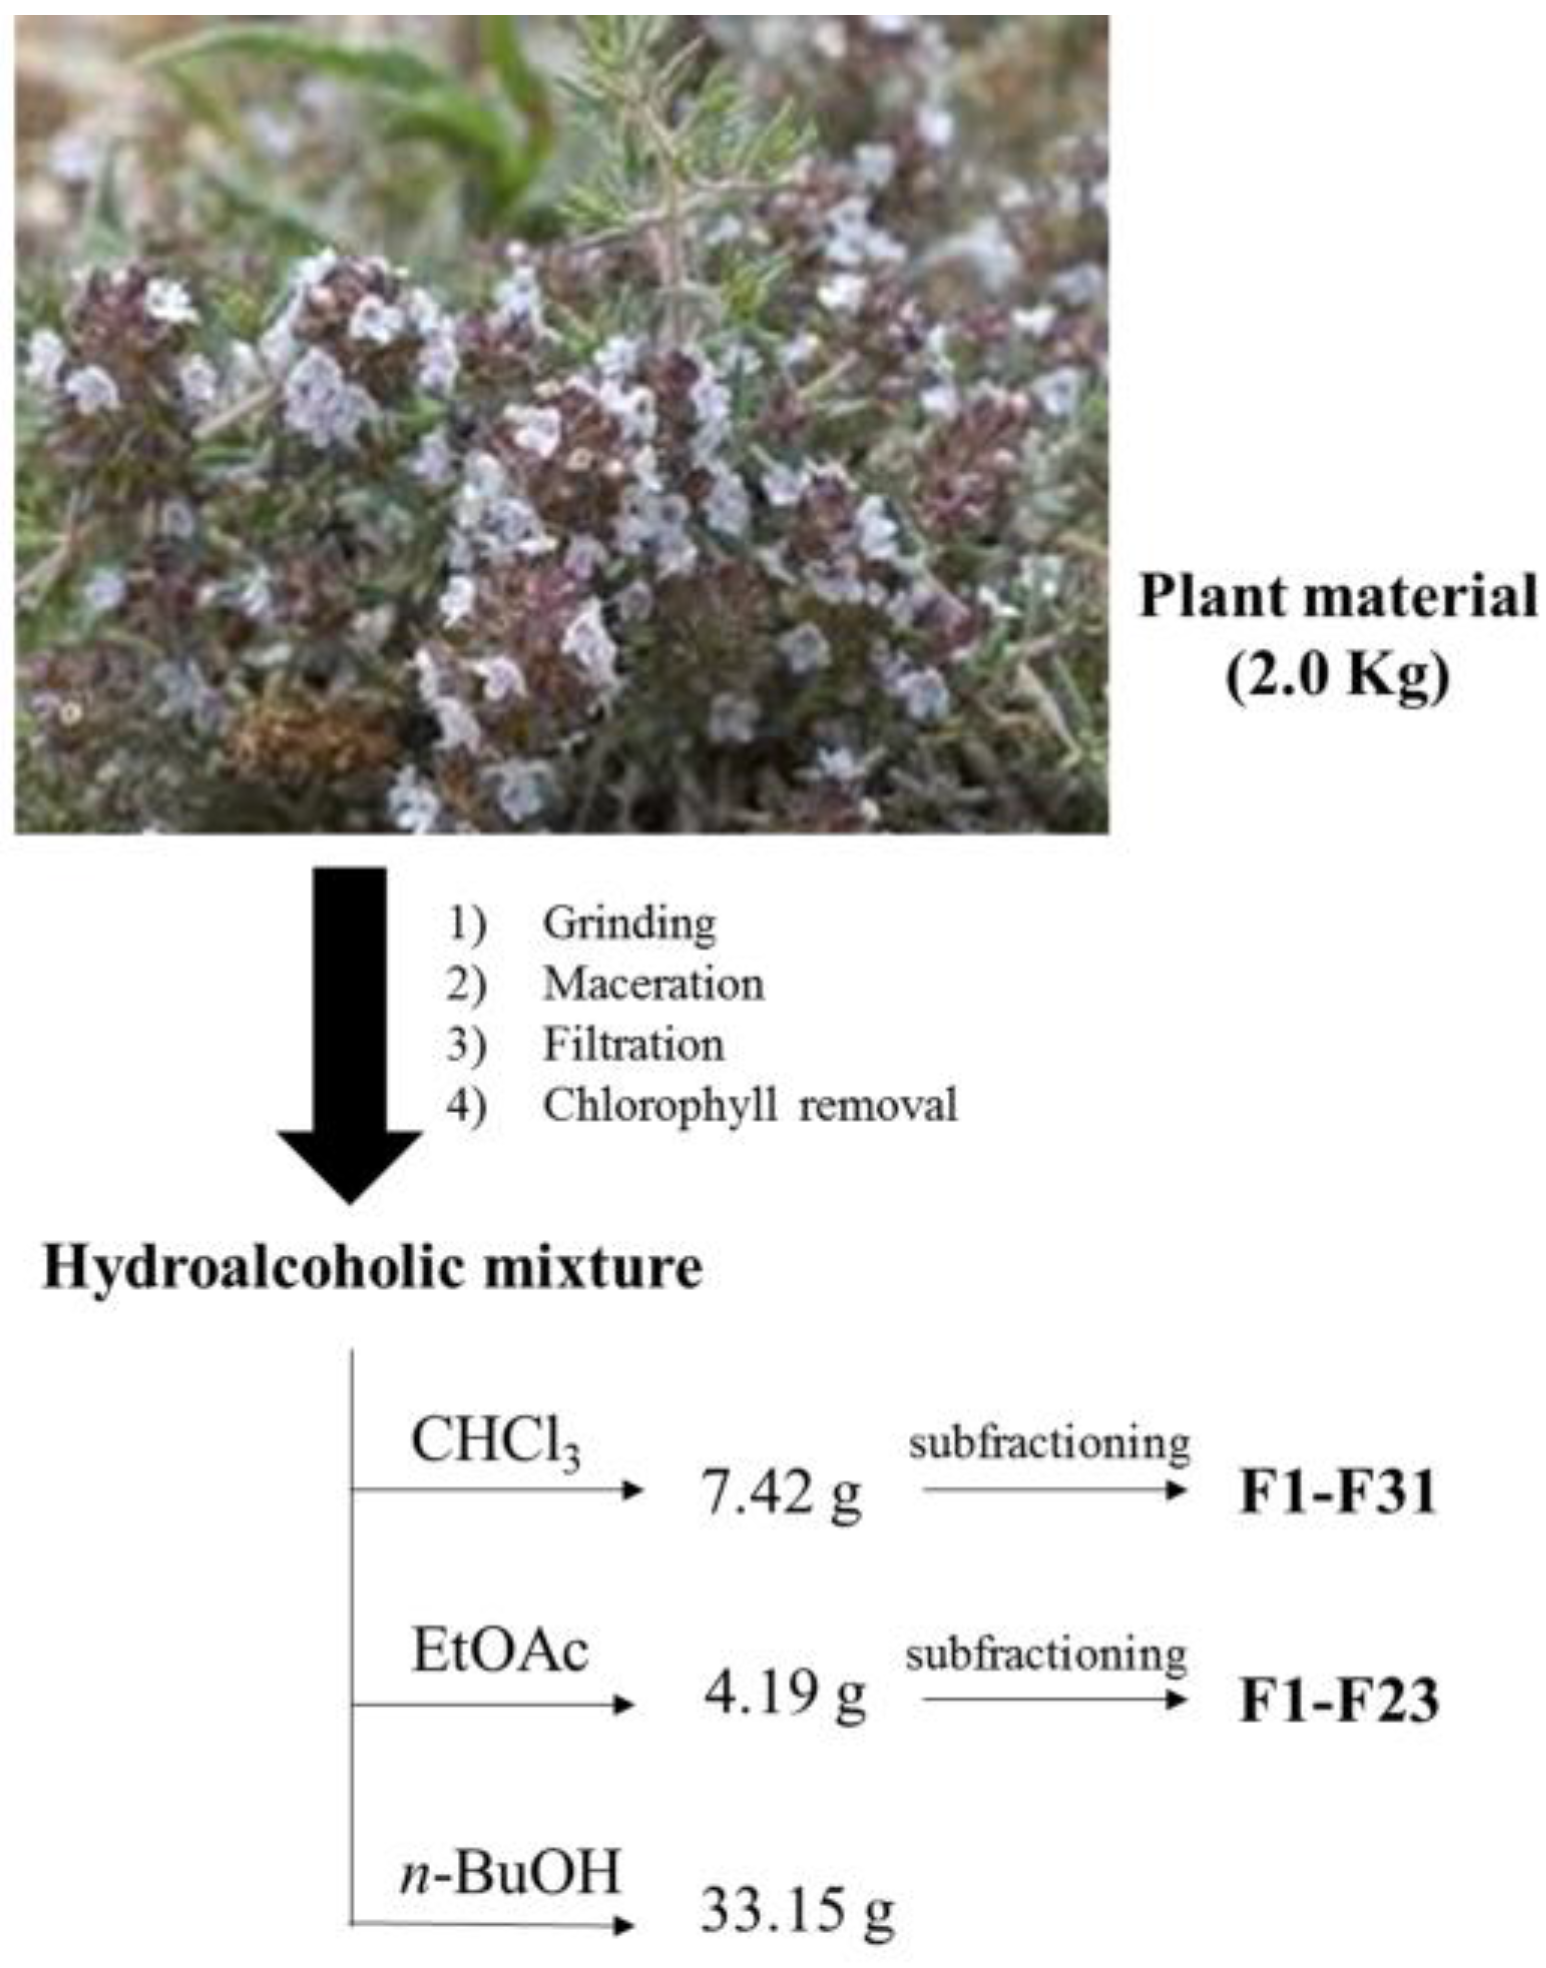
2.2. Plant Material
3. Extraction Procedures
3.1. Hydroalcoholic Extraction and Fractionation
3.2. Supercritical Fluid Extraction (SFE)
3.3. Microwave-Assisted Extraction (MAE)
3.4. HPLC Analysis
4. Color Analysis
5. Carotenoids and Chlorophylls Analysis
6. Results and Discussion
6.1. Hydroalcoholic Extracts and Subfractions
6.2. Supercritical Fluid Extraction (SFE)
6.3. Microwave-Assisted Extraction (MAE)
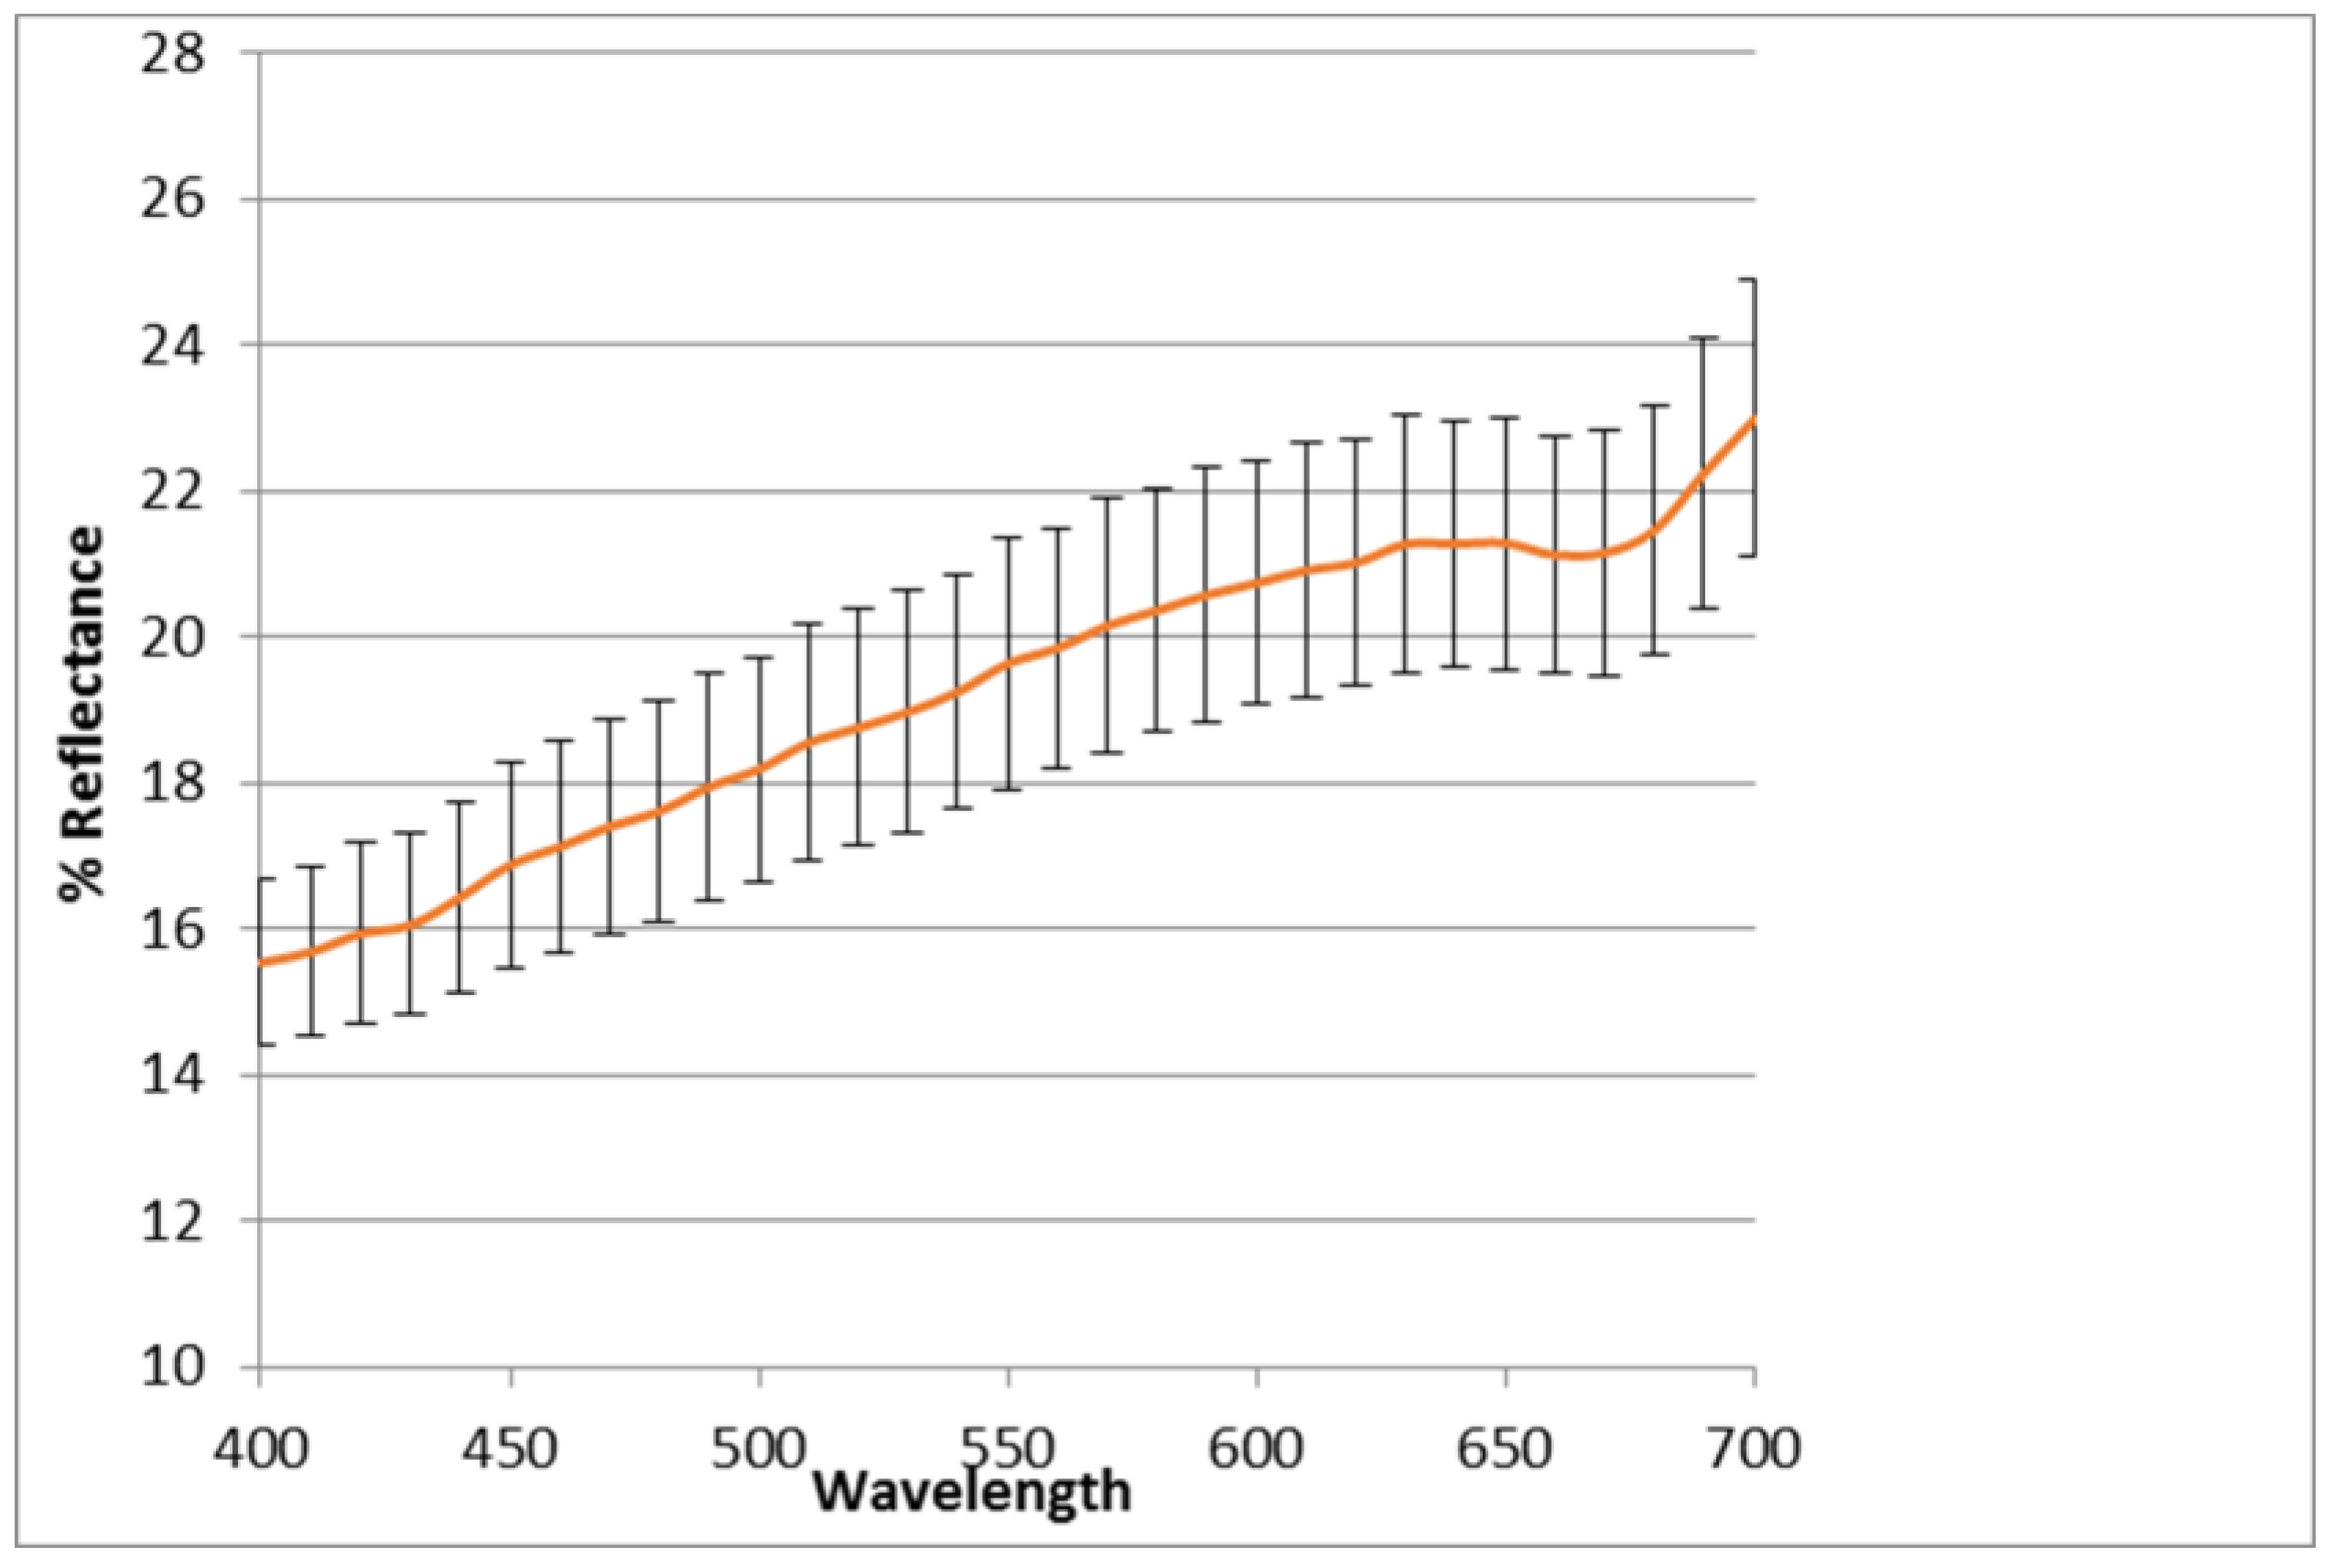
6.4. Color Analysis
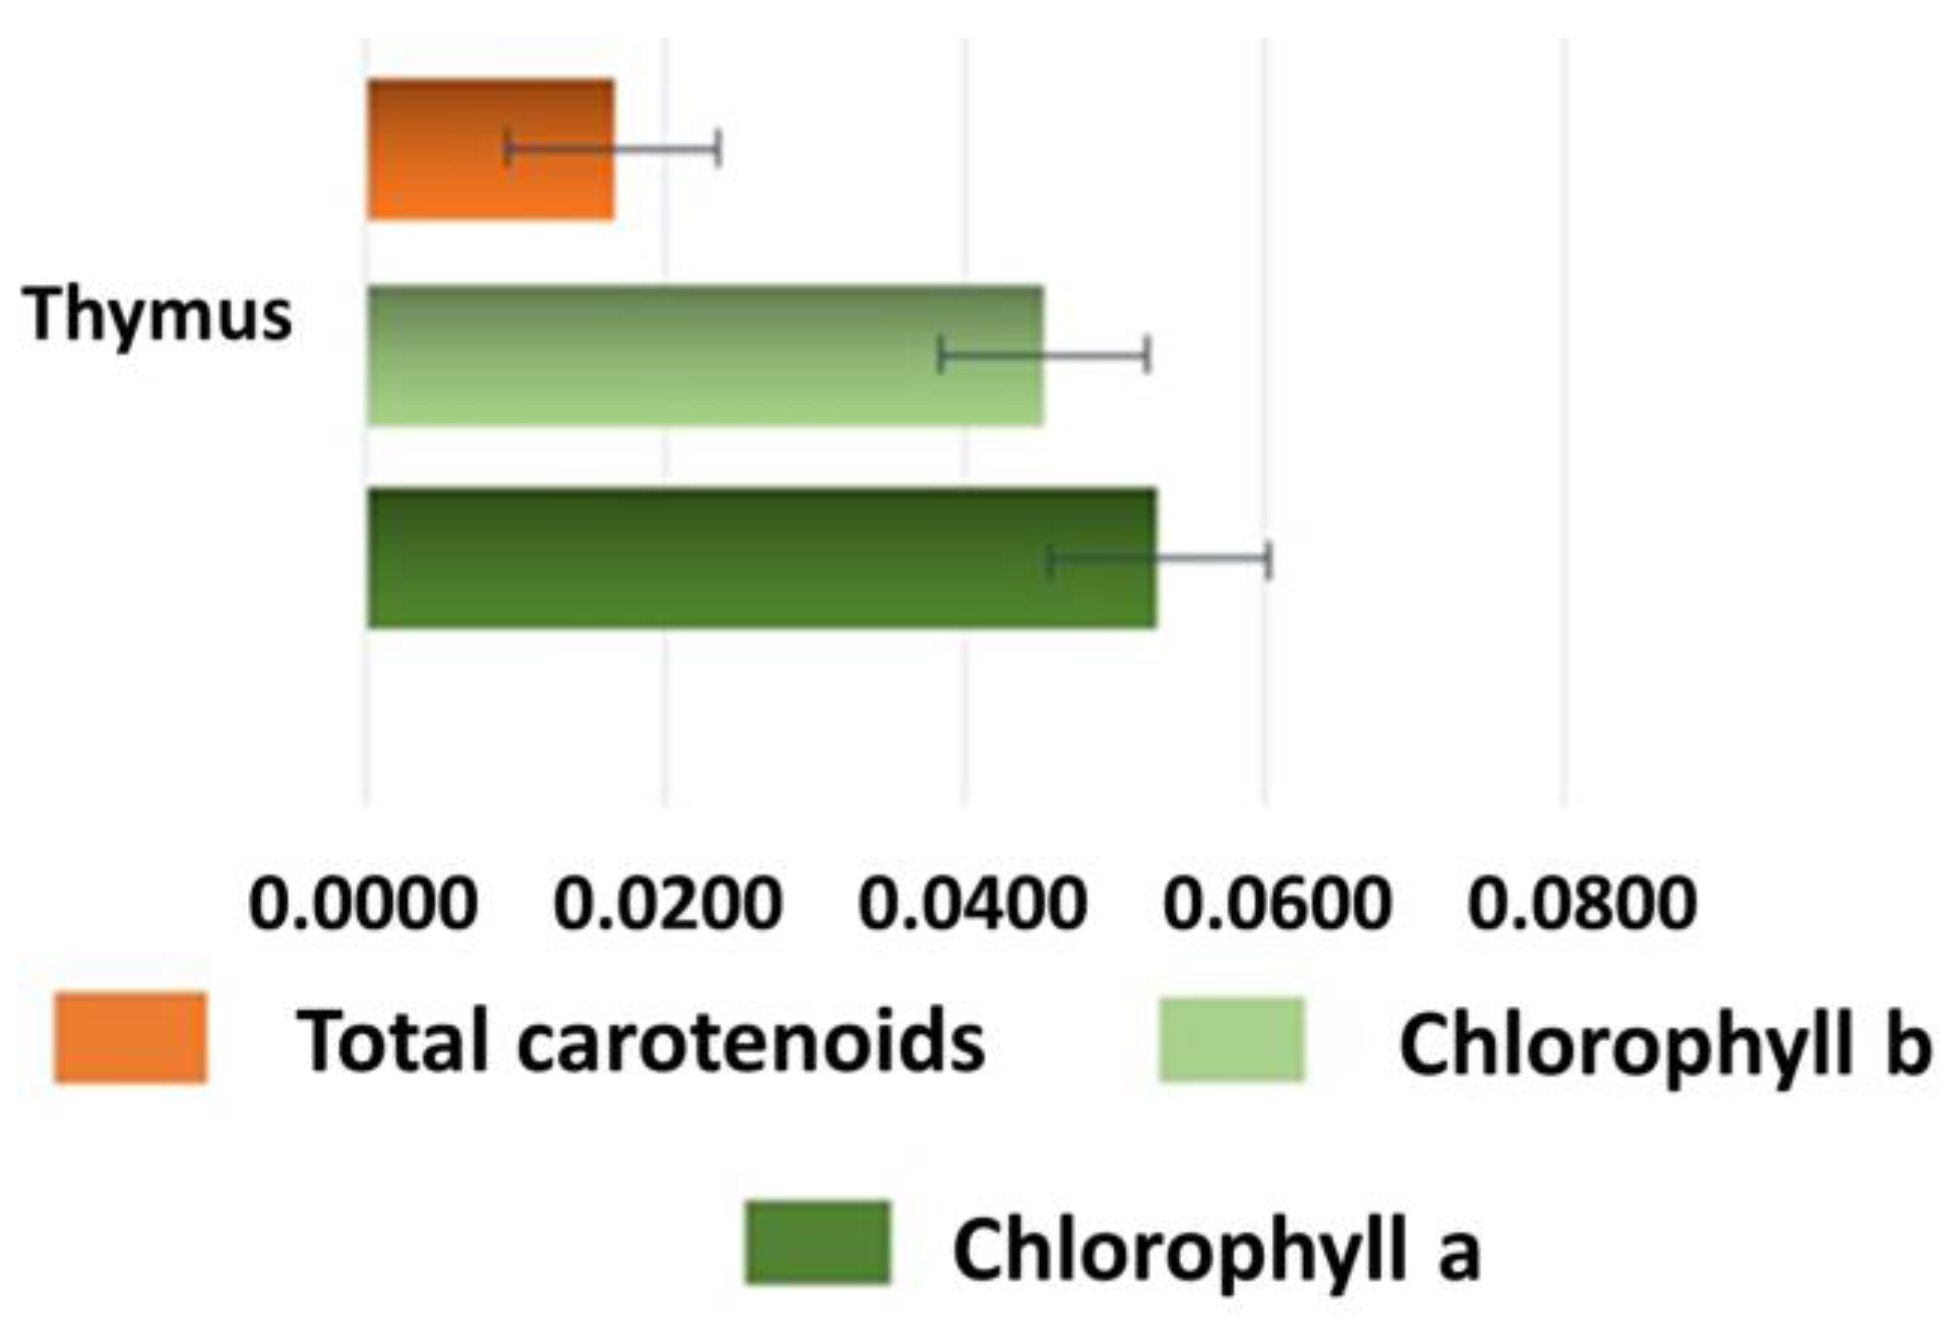
6.5. Pigments Determination (Total Carotenoids, Chlorophyll a and Chlorophyll b)
7. Conclusions
Supplementary Materials
Acknowledgments
Author Contributions
Conflicts of Interest
References
- Figueiredo, A.C.; Barroso, J.G.; Pedro, L.G. Volatiles from Thymbra and Thymus species of the western Mediterranean basin, Portugal and Macaronesia. Nat. Prod. Commun. 2010, 5, 1465–1476. [Google Scholar] [PubMed]
- Nabavi, S.M.; Marchese, A.; Izadi, M.; Curti, V.; Daglia, M.; Nabavi, S.F. Plants belonging to the genus Thymus as antibacterial agents: from farm to pharmacy. Food Chem. 2015, 173, 339–347. [Google Scholar] [CrossRef] [PubMed]
- Maksimović, Z.; Stojanović, D.; Sostaric, I.; Dajić, Z.; Ristić, M. Composition and radical-scavenging activity of Thymus glabrescens Willd. (Lamiaceae) essential oil. J. Sci. Food Agric. 2008, 88, 2036–2041. [Google Scholar] [CrossRef]
- Jarić, S.; Mitrović, M.; Pavlović, P. Review of ethnobotanical, phytochemical, and pharmacological study of Thymus serpyllum L. Evid. Based Complement. Alternat. Med. 2015, 2015, 101978. [Google Scholar] [CrossRef] [PubMed]
- Guesmi, F.; Ben, F.M.; Mejri, M.; Landoulsi, A. In-vitro assessment of antioxidant and antimicrobial activities of methanol extracts and essential oil of Thymus hirtus sp. algeriensis. Lipids Health Dis. 2014, 13, 114–125. [Google Scholar]
- Guesmi, F.; Ali, M.B.; Barkaoui, T.; Tahri, W.; Mejri, M.; Ben-Attia, M.; Bellamine, H.; Landoulsi, A. Effects of Thymus hirtus sp. algeriensis Boiss. et Reut. (Lamiaceae) essential oil on healing gastric ulcers according to sex. Lipids Health Dis. 2014, 13, 138–150. [Google Scholar] [PubMed]
- Espina, L.; García-Gonzalo, D.; Laglaoui, A.; Mackey, B.M.; Pagán, R. Synergistic combinations of high hydrostatic pressure and essential oils or their constituents and their use in preservation of fruit juices. Int. J. Food Microbiol. 2013, 161, 23–30. [Google Scholar] [CrossRef] [PubMed]
- Guesmi, F.; Beghalem, H.; Tyagi, A.K.; Ali, M.B.; Mouhoub, R.B.; Bellamine, H.; Landoulsi, A. Prevention of H2O2 induced oxidative damage of rat testis by Thymus algeriensis. Biomed. Environ. Sci. 2016, 29, 275–285. [Google Scholar] [PubMed]
- Giordiani, R.; Hadef, Y.; Kaloustina, J. Compositions and antifungal activities of essential oils of some Algerian aromatic plants. Fitoterapia 2008, 79, 199–203. [Google Scholar] [CrossRef] [PubMed]
- Hazzit, M.; Baaliouamer, A.; Verissimo, A.R.; Faleiro, M.L.; Miguel, M.G. Chemical composition and biological activities of Algerian Thymus oils. Food Chem. 2009, 116, 714–721. [Google Scholar] [CrossRef]
- Chemat, S.; Cherfouh, R.; Meklati, B.Y.; Belanteur, K. Composition and microbial activity of thyme (Thymus algeriensis genuinus) essential oil. J. Essent. Oil Res. 2012, 24, 5–11. [Google Scholar] [CrossRef]
- Nikolic, M.; Glamoclija, J.; Ferreira, I.C.F.R.; Calhelha, R.C.; Fernandes, A.; Markovic, T.; Marković, D.; Giweli, A.; Soković, M. Chemical composition, antimicrobial, antioxidant and antitumor activity of Thymus serpyllum L., Thymus algeriensis Boiss. and Reut and Thymus vulgaris L. essential oils. Ind. Crops Prod. 2014, 52, 183–190. [Google Scholar] [CrossRef]
- Diuzheva, A.; Carradori, S.; Andruch, V.; Locatelli, M.; De Luca, E.; Tiecco, M.; Germani, R.; Menghini, L.; Nocentini, A.; Gratteri, P.; et al. Use of innovative (micro)extraction techniques to characterize Harpagophytum procumbens root and its commercial food supplements. Phytochem. Anal. 2018. [Google Scholar] [CrossRef]
- Delazar, A.; Nahar, L.; Hamedeyazdan, S.; Sarker, S.D. Microwave-assisted extraction in natural products isolation. Methods Mol. Biol. 2012, 864, 89–115. [Google Scholar] [PubMed]
- da Silva, R.P.F.F.; Rocha-Santos, T.A.P.; Duarte, A.C. Supercritical fluid extraction of bioactive compounds. Trends Analyt. Chem. 2016, 76, 40–51. [Google Scholar] [CrossRef]
- Petrović, N.V.; Petrović, S.S.; Džamić, A.M.; Ćirić, A.D.; Ristić, M.S.; Milovanović, S.L.; Petrović, S.D. Chemical composition, antioxidant and antimicrobial activity of Thymus praecox supercritical extracts. J. Supercrit. Fluids 2016, 110, 117–125. [Google Scholar] [CrossRef]
- Mollica, A.; Locatelli, M.; Macedonio, G.; Carradori, S.; Sobolev, A.P.; De Salvador, R.F.; Monti, S.M.; Buonanno, M.; Zengin, G.; Angeli, A.; et al. Microwave-assisted extraction, HPLC analysis, and inhibitory effects on carbonic anhydrase I, II, VA, and VII isoforms of 14 blueberry Italian cultivars. J. Enzyme Inhib. Med. Chem. 2016, 31, 1–6. [Google Scholar] [CrossRef] [PubMed]
- Zengin, G.; Menghini, L.; Malatesta, L.; De Luca, E.; Bellagamba, G.; Uysal, S.; Aktumsek, A.; Locatelli, M. Comparative study of biological activities and chemical fingerprint of two wild Turkish species: Asphodeline anatolica and Potentilla speciosa. J. Enzyme Inhib. Med. Chem. 2016, 31, 203–208. [Google Scholar] [CrossRef] [PubMed]
- Clydesdale, F.M.; Ahmed, E.M. Colorimetry-methodology and applications. CRC Crit. Rev. Food Sci. Nutr. 1978, 10, 243–301. [Google Scholar] [CrossRef] [PubMed]
- Solovchenko, A.E.; Chivkunova, O.B.; Merzlyak, M.N.; Reshetnikova, I.V. A spectrophotometric analysis of pigments in apples. Russian J. Plant. Physiol. 2001, 48, 693–700. [Google Scholar] [CrossRef]
- Wellburn, A. The spectral determination of chlorophylls a and b, as well as total carotenoids, using various solvents with spectrophotometers of different resolution. J. Plant Physiol. 1994, 144, 307–313. [Google Scholar] [CrossRef]
- Williamson, G. The role of polyphenols in modern nutrition. Nutr. Bull. 2017, 42, 226–235. [Google Scholar] [CrossRef] [PubMed]
- Cushnie, T.P.; Lamb, A.J. Antimicrobial activity of flavonoids. Int. J. Antimicrob. Agents. 2005, 26, 343–356. [Google Scholar] [CrossRef] [PubMed]
- Cesa, S.; Carradori, S.; Bellagamba, G.; Locatelli, M.; Casadei, M.A.; Masci, A.; Paolicelli, P. Evaluation of processing effects on anthocyanin content and colour modifications of blueberry (Vaccinium spp.) extracts: Comparison between HPLC-DAD and CIELAB analyses. Food Chem. 2017, 232, 114–123. [Google Scholar] [CrossRef] [PubMed]
- Cesa, S.; Casadei, M.A.; Cerreto, F.; Paolicelli, P. Infant milk formulas: effect of storage conditions on the stability of powdered products towards autoxidation. Foods 2015, 4, 487–500. [Google Scholar] [CrossRef] [PubMed]
- Ivanov, L.A.; Ivanova, L.A.; Ronzhina, D.A.; Yudina, P.K. Changes in the chlorophyll and carotenoid contents in the leaves of steppe plants along a latitudinal gradient in South Ural. Russian J. Plant Physiol. 2013, 60, 812–820. [Google Scholar] [CrossRef]
- Park, J.-Y.; Park, C.-M.; Kim, J.-J.; Noh, K.-H.; Cho, C.-W.; Song, Y.-S. The protective effect of chlorophyll a against oxidative stress and inflammatory processes in LPS-stimulated macrophages. Food Sci. Biotechnol. 2007, 16, 205–211. [Google Scholar]
- Atanasov, A.G.; Waltenberger, B.; Pferschy-Wenzig, E.M.; Linder, T.; Wawrosch, C.; Uhrin, P.; Temml, V.; Wang, L.; Schwaiger, S.; Heiss, E.H.; et al. Discovery and resupply of pharmacologically active plant-derived natural products: A review. Biotechnol. Adv. 2015, 33, 1582–1614. [Google Scholar] [CrossRef] [PubMed]
Sample Availability: Samples of the compounds are available from the authors of the Unité de recherche Valorisation des Ressources Naturelles, Molécules Bioactives et Analyses Physicochimiques et Biologiques. Université Frères Mentouri, Constantine 1, Route d’Aïn El Bey, 25000 Constantine, Algérie. |


| Identified Compound | Content (µg/g ± SD, DW) | ||||||
|---|---|---|---|---|---|---|---|
| F16 (CHCl3) | F24 (CHCl3) | F30 (CHCl3) | F13 (EtOAc) | F22 (EtOAc) | F27 (EtOAc) | n-BuOH | |
| Catechin | 1.12 ± 0.01 | 6.23 ± 0.05 | |||||
| 4-Hydroxy-benzoic acid | 16.31 ± 0.91 | 3.61 ± 0.30 | 0.66 ± 0.02 | ||||
| Vanillic acid | 5.17 ± 0.11 | 0.23 ± 0.01 | 0.22 ± 0.01 | ||||
| Epicatechin | 6.78 ± 0.12 | 0.55 ± 0.01 | 48.03 ± 2.98 | ||||
| Syringic acid | 1.93 ± 0.11 | ||||||
| p-Coumaric acid | 1.26 ± 0.81 | 40.62 ± 3.01 | 1.63 ± 0.88 | 1.70 ± 0.58 | |||
| Rutin | 0.57 ± 0.02 | 4.52 ± 0.41 | |||||
| t-Ferulic acid | 0.20 ± 0.01 | 0.23 ± 0.01 | 1.46 ± 0.13 | 0.84 ± 0.01 | 0.55 ± 0.01 | ||
| Naringin | 0.16 ± 0.01 | 4.02 ± 0.39 | 0.46 ± 0.01 | ||||
| 2,3-Dimethoxy-benzoic acid | 6.51 ± 0.59 | 7.51 ± 0.47 | 3.52 ± 0.20 | ||||
| Benzoic acid | 10.92 ± 1.21 | 5.71 ± 0.47 | |||||
| o-Coumaric acid | 1.03 ± 0.09 | 9.83 ± 0.87 | |||||
| Naringenin | 8.97 ± 0.74 | 0.90 ± 0.03 | 0.47 ± 0.01 | ||||
| Carvacrol | 0.43 ± 0.01 | ||||||
| Total | 22.97 ± 1.01 | 12.44 ± 1.03 | 6.78 ± 0.12 | 11.54 ± 0.99 | 66.58 ± 2.70 | 13.34 ± 1.12 | 71.21 ± 2.40 |
| Identified Compound | Content (µg/g ± SD, DW) | |
|---|---|---|
| 40 °C, 10 MPa | 40 °C, 30 MPa | |
| Gallic acid | 0.10 ± 0.01 | 0.10 ± 0.01 |
| Catechin | 0.05 ± 0.01 | 0.05 ± 0.01 |
| Vanillic acid | 0.18 ± 0.02 | |
| Epicatechin | 0.15 ± 0.02 | 0.15 ± 0.01 |
| Isovanillin | 1.49 ± 0.09 | 1.48 ± 0.06 |
| p-Coumaric acid | 0.17 ± 0.02 | 0.14 ± 0.01 |
| Naringin | 0.06 ± 0.01 | 0.06 ± 0.01 |
| Harpagoside | 0.10 ± 0.01 | 0.10 ± 0.01 |
| Total | 2.12 ± 0.10 | 2.26 ± 0.10 |
| Identified Compound | Content (µg/g ± SD, DW) | |||||||
|---|---|---|---|---|---|---|---|---|
| 40 °C, 10 min, water | 60 °C, 10 min, water | 80 °C, 10 min, water | 100 °C, 10 min, water | 120 °C, 10 min, water | 100 °C, 5 min, water | 100 °C, 15 min, water | 100 °C, 15 min, EtOH/H2O 50:50 | |
| Gallic acid | 36.51 ± 0.23 | 72.84 ± 0.36 | 24.57 ± 0.21 | 28.05 ± 0.19 | 20.31 ± 0.20 | 9.70 ± 0.09 | 37.97 ± 0.25 | |
| Catechin | 46.69 ± 0.33 | 238.91 ± 1.66 | 45.23 ± 0.18 | 359.80 ± 1.98 | ||||
| Chlorogenic acid | 118.34 ± 1.01 | 1203.98 ± 5.29 | 1090.00 ± 4.77 | 1766.64 ± 5.13 | 930.04 ± 3.99 | 1570.40 ± 4.33 | 1745.98 ± 5.65 | |
| 4-Hydroxy-benzoic acid | 18.38 ± 0.20 | 37.38 ± 0.66 | ||||||
| Vanillic acid | 37.56 ± 0.71 | 50.17 ± 0.98 | 9.73 ± 0.12 | 176.74 ± 1.02 | 23.92 ± 0.66 | |||
| Epicatechin | 813.21 ± 2.29 | 1675.51 ± 3.95 | 821.40 ± 3.02 | 200.62 ± 1.15 | 2462.75 ± 2.00 | 66.11 ± 0.99 | ||
| Syringic acid | 17.86 ± 0.99 | 52.22 ± 1.39 | 315.18 ± 3.00 | 747.63 ± 3.23 | 615.20 ± 4.03 | |||
| 3-Hydroxy-benzoic acid | 243.31 ± 2.21 | 57.94 ± 0.98 | 212.38 ± 1.75 | 70.62 ± 0.67 | 75.06 ± 0.60 | 166.73 ± 1.02 | 19.82 ± 0.51 | |
| Isovanillin | 223.75 ± 1.97 | 248.12 ± 1.88 | 271.11 ± 2.04 | 59.05 ± 0.77 | 68.21 ± 0.67 | 40.42 ± 0.78 | 200.37 ± 1.09 | |
| p-Coumaric acid | 15.78 ± 0.13 | 14.07 ± 0.29 | 21.65 ± 0.28 | 40.00 ± 0.32 | 23.05 ± 0.27 | 18.82 ± 0.23 | 106.99 ± 0.77 | 62.02 ± 0.19 |
| Rutin | 39.70 ± 0.23 | 375.42 ± 1.01 | 37.63 ± 0.65 | 89.45 ± 0.69 | 16.22 ± 0.09 | 196.89 ± 1.00 | 55.32 ± 0.55 | |
| Sinapinic acid | 4.96 ± 0.13 | 31.58 ± 0.60 | 5.37 ± 0.17 | 5.53 ± 0.17 | 5.26 ± 0.18 | 29.64 ± 0.60 | 46.20 ± 0.63 | 8.48 ± 0.10 |
| t-Ferulic acid | 19.89 ± 0.99 | 14.22 ± 0.50 | 27.56 ± 0.52 | 21.72 ± 0.54 | 1869.72 ± 2.01 | 140.64 ± 0.73 | ||
| Naringin | 89.63 ± 0.98 | 385.92 ± 2.12 | 179.46 ± 2.03 | 29.64 ± 0.23 | 31.31 ± 0.24 | 132.37 ± 1.00 | 376.60 ± 2.77 | 1611.91 ± 2.49 |
| 2,3-dimethoxy-benzoic acid | 520.37 ± 2.02 | 1212.75 ± 5.84 | 222.84 ± 1.95 | 507.77 ± 2.39 | ||||
| Benzoic acid | 1455.82 ± 3.39 | 4896.51 ± 5.77 | 2425.66 ± 4.23 | 2393.82 ± 4.78 | 2697.97 ± 5.00 | 3889.74 ± 4.77 | 4157.75 ± 4.67 | |
| o-Coumaric acid | 227.74 ± 1.04 | 348.86 ± 2.20 | 37.66 ± 0.45 | 23.51 ± 0.29 | 30.27 ± 0.28 | 812.41 ± 2.00 | 341.55 ± 1.17 | 163.21 ± 0.99 |
| Quercetin | 63.04 ± 0.20 | 74.71 ± 0.23 | 59.52 ± 0.20 | 68.60 ± 0.28 | 180.72 ± 0.77 | |||
| Total | 2508.85 ± 5.36 | 9084.30 ± 8.12 | 5362.13 ± 4.99 | 7009.51 ± 8.54 | 5009.41 ± 4.12 | 9731.14 ± 7.98 | 11000.12 ± 9.96 | 2732.38 ± 5.88 |
| CIELAB Parameters | Mean Value | SD |
|---|---|---|
| L* | 51.25 | 1.91 |
| a* | 1.09 | 0.36 |
| b* | 5.53 | 0.69 |
| C*ab | 5.64 | 0.72 |
| hab | 78.90 | 3.28 |
© 2018 by the authors. Licensee MDPI, Basel, Switzerland. This article is an open access article distributed under the terms and conditions of the Creative Commons Attribution (CC BY) license (http://creativecommons.org/licenses/by/4.0/).
Share and Cite
Boutaoui, N.; Zaiter, L.; Benayache, F.; Benayache, S.; Carradori, S.; Cesa, S.; Giusti, A.M.; Campestre, C.; Menghini, L.; Innosa, D.; et al. Qualitative and Quantitative Phytochemical Analysis of Different Extracts from Thymus algeriensis Aerial Parts. Molecules 2018, 23, 463. https://doi.org/10.3390/molecules23020463
Boutaoui N, Zaiter L, Benayache F, Benayache S, Carradori S, Cesa S, Giusti AM, Campestre C, Menghini L, Innosa D, et al. Qualitative and Quantitative Phytochemical Analysis of Different Extracts from Thymus algeriensis Aerial Parts. Molecules. 2018; 23(2):463. https://doi.org/10.3390/molecules23020463
Chicago/Turabian StyleBoutaoui, Nassima, Lahcene Zaiter, Fadila Benayache, Samir Benayache, Simone Carradori, Stefania Cesa, Anna Maria Giusti, Cristina Campestre, Luigi Menghini, Denise Innosa, and et al. 2018. "Qualitative and Quantitative Phytochemical Analysis of Different Extracts from Thymus algeriensis Aerial Parts" Molecules 23, no. 2: 463. https://doi.org/10.3390/molecules23020463