Quantification and Variability Analysis of Lignin Optical Properties for Colour-Dependent Industrial Applications

 ,
,
Abstract
:
1. Introduction
- Develop, propose and validate a method for the quantitative analysis of lignin colour;
- Determine and document the variability of around the colour for various lignin;
- Identify the operating parameters that have significant influence on lignin colour;
- Assess the possibility and limitations of using the colour as a process control measure in lignin recovery and purification processes;
- Demonstrate how the optical properties can be used for controlling the production processes of various quality levels of lignin powders and their derivatives;
- Provide a suitable basis for the correlation of lignin chromophores and characteristics for future development of a simple, rapid, accurate and inexpensive analytical method.
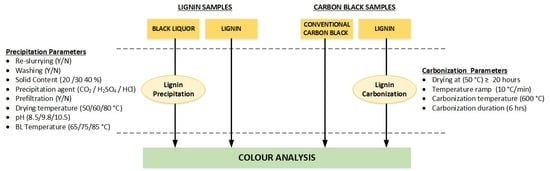
2. Experimental
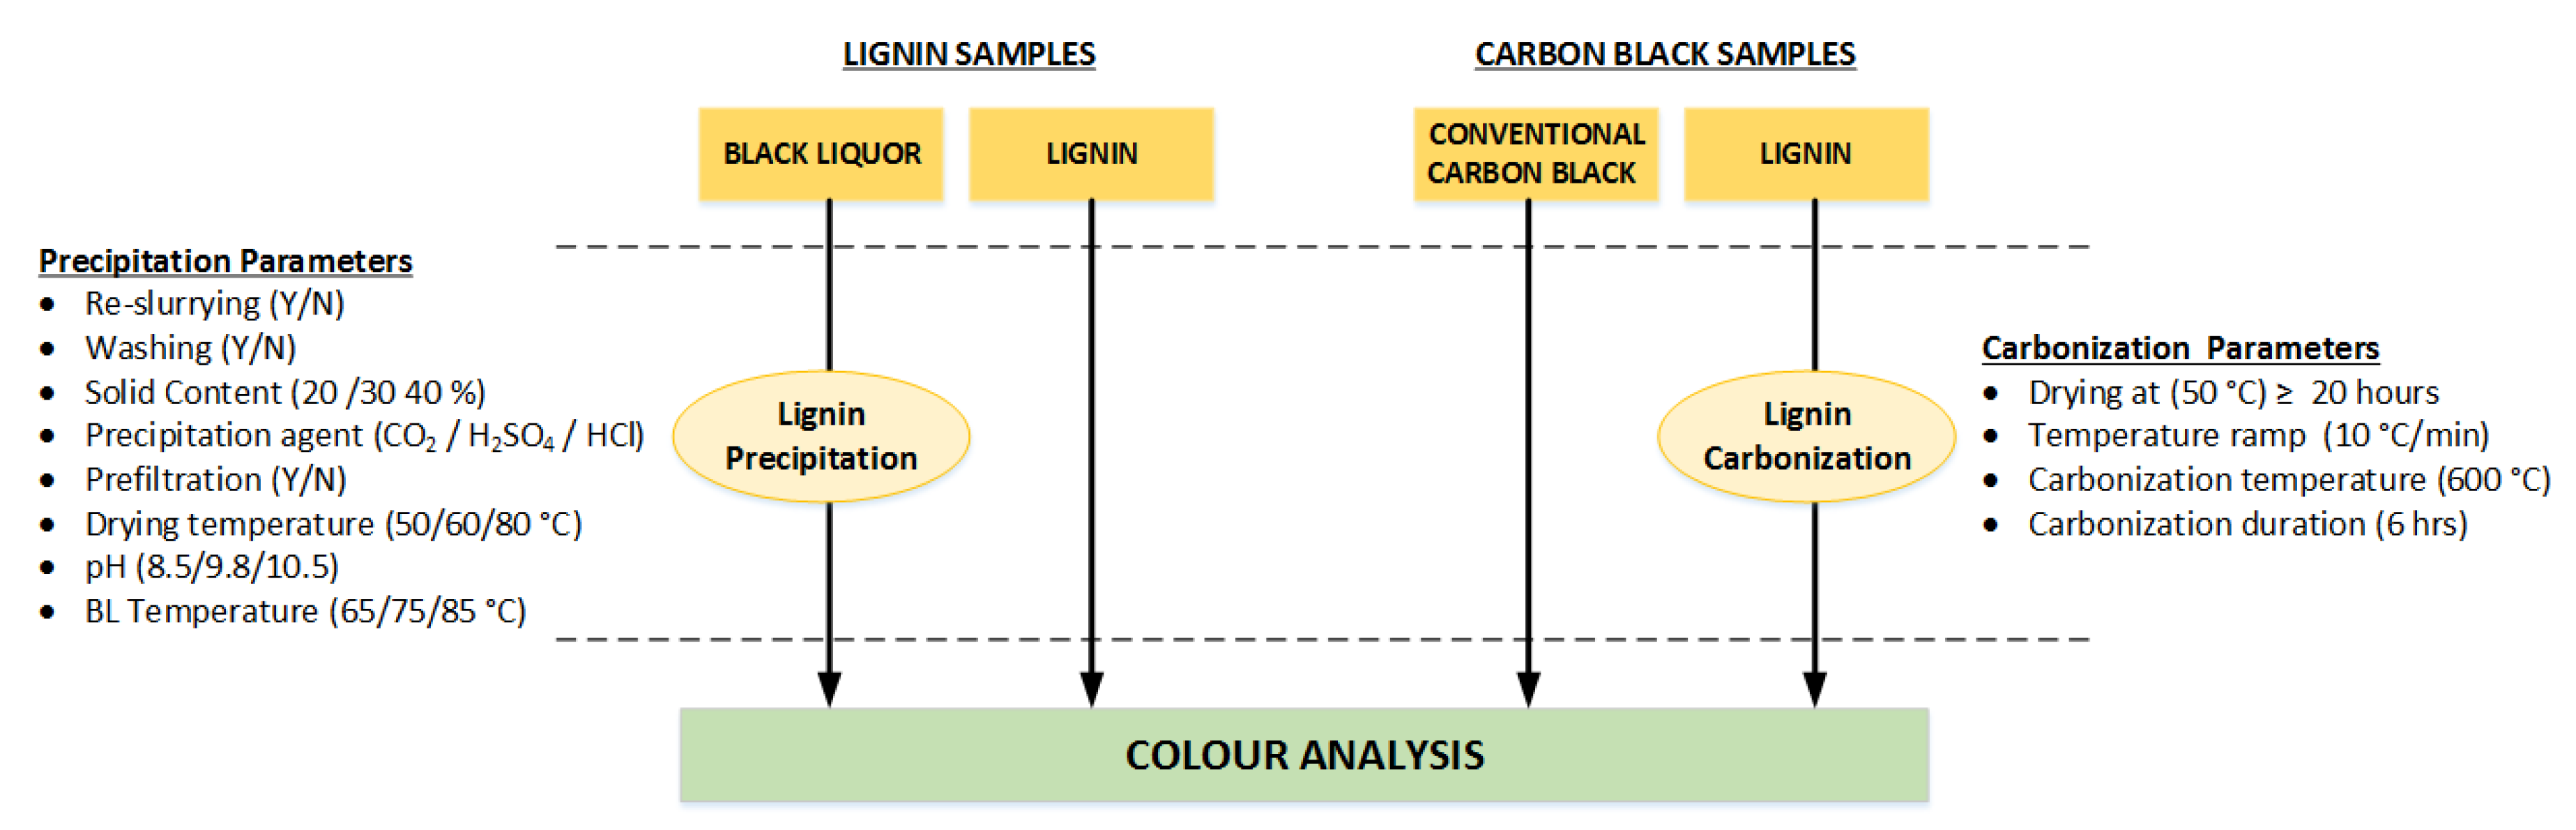
2.1. Materials
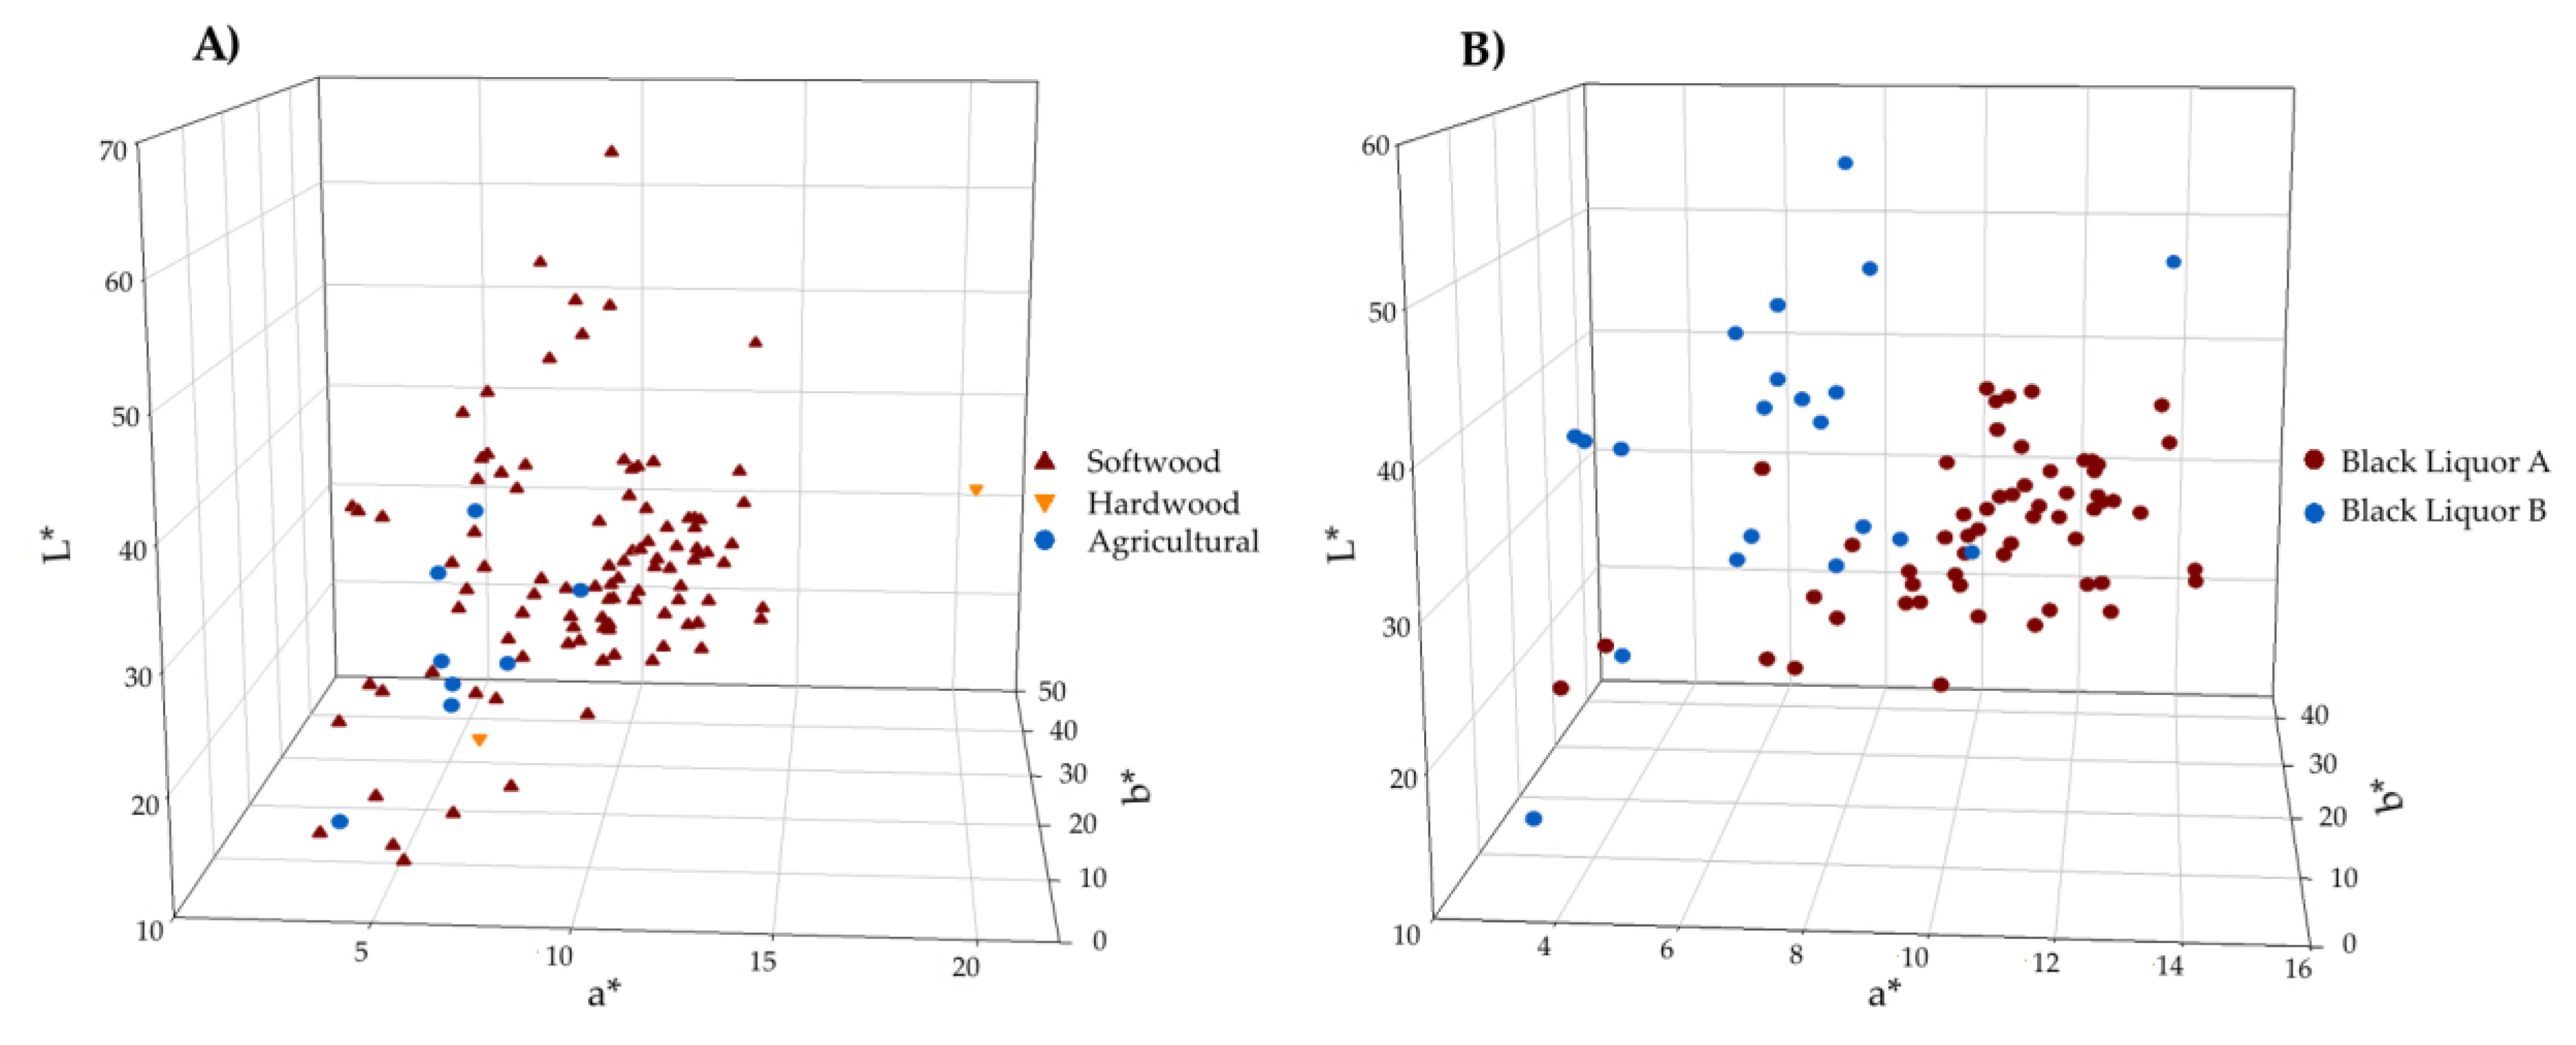
2.1.1. Black Liquors
2.1.2. Lignin Samples
2.1.3. Carbon Black Samples
2.2. Methods
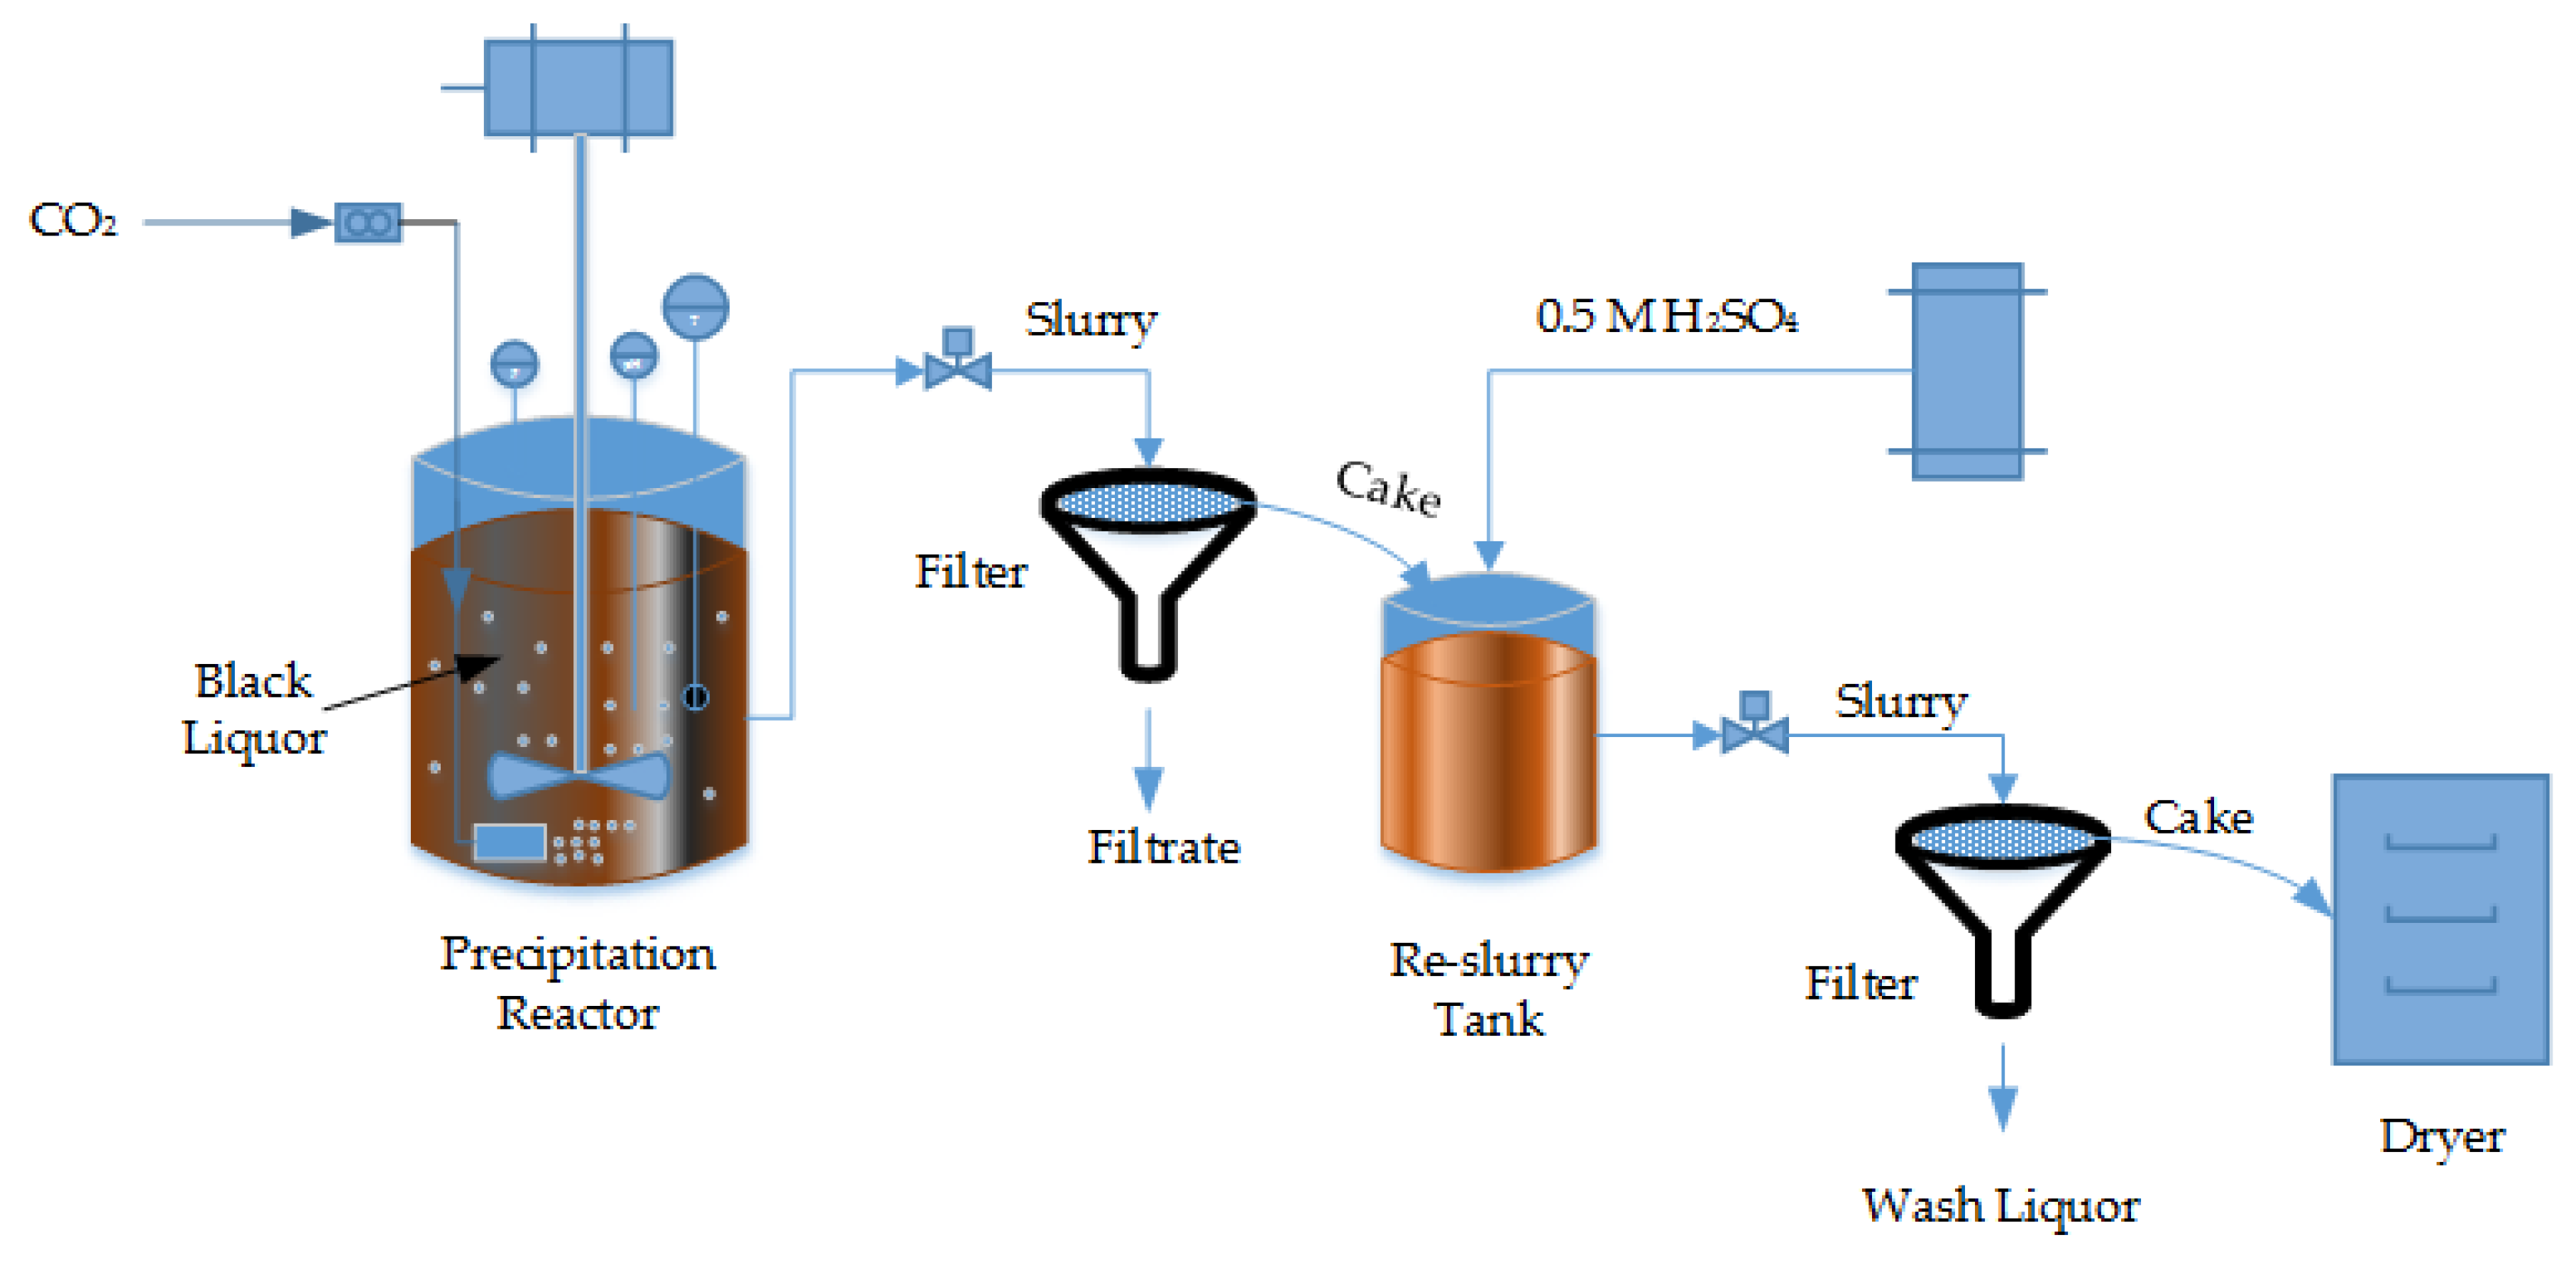
2.2.1. Experimental Setup and Procedure for Lignin Powder Production
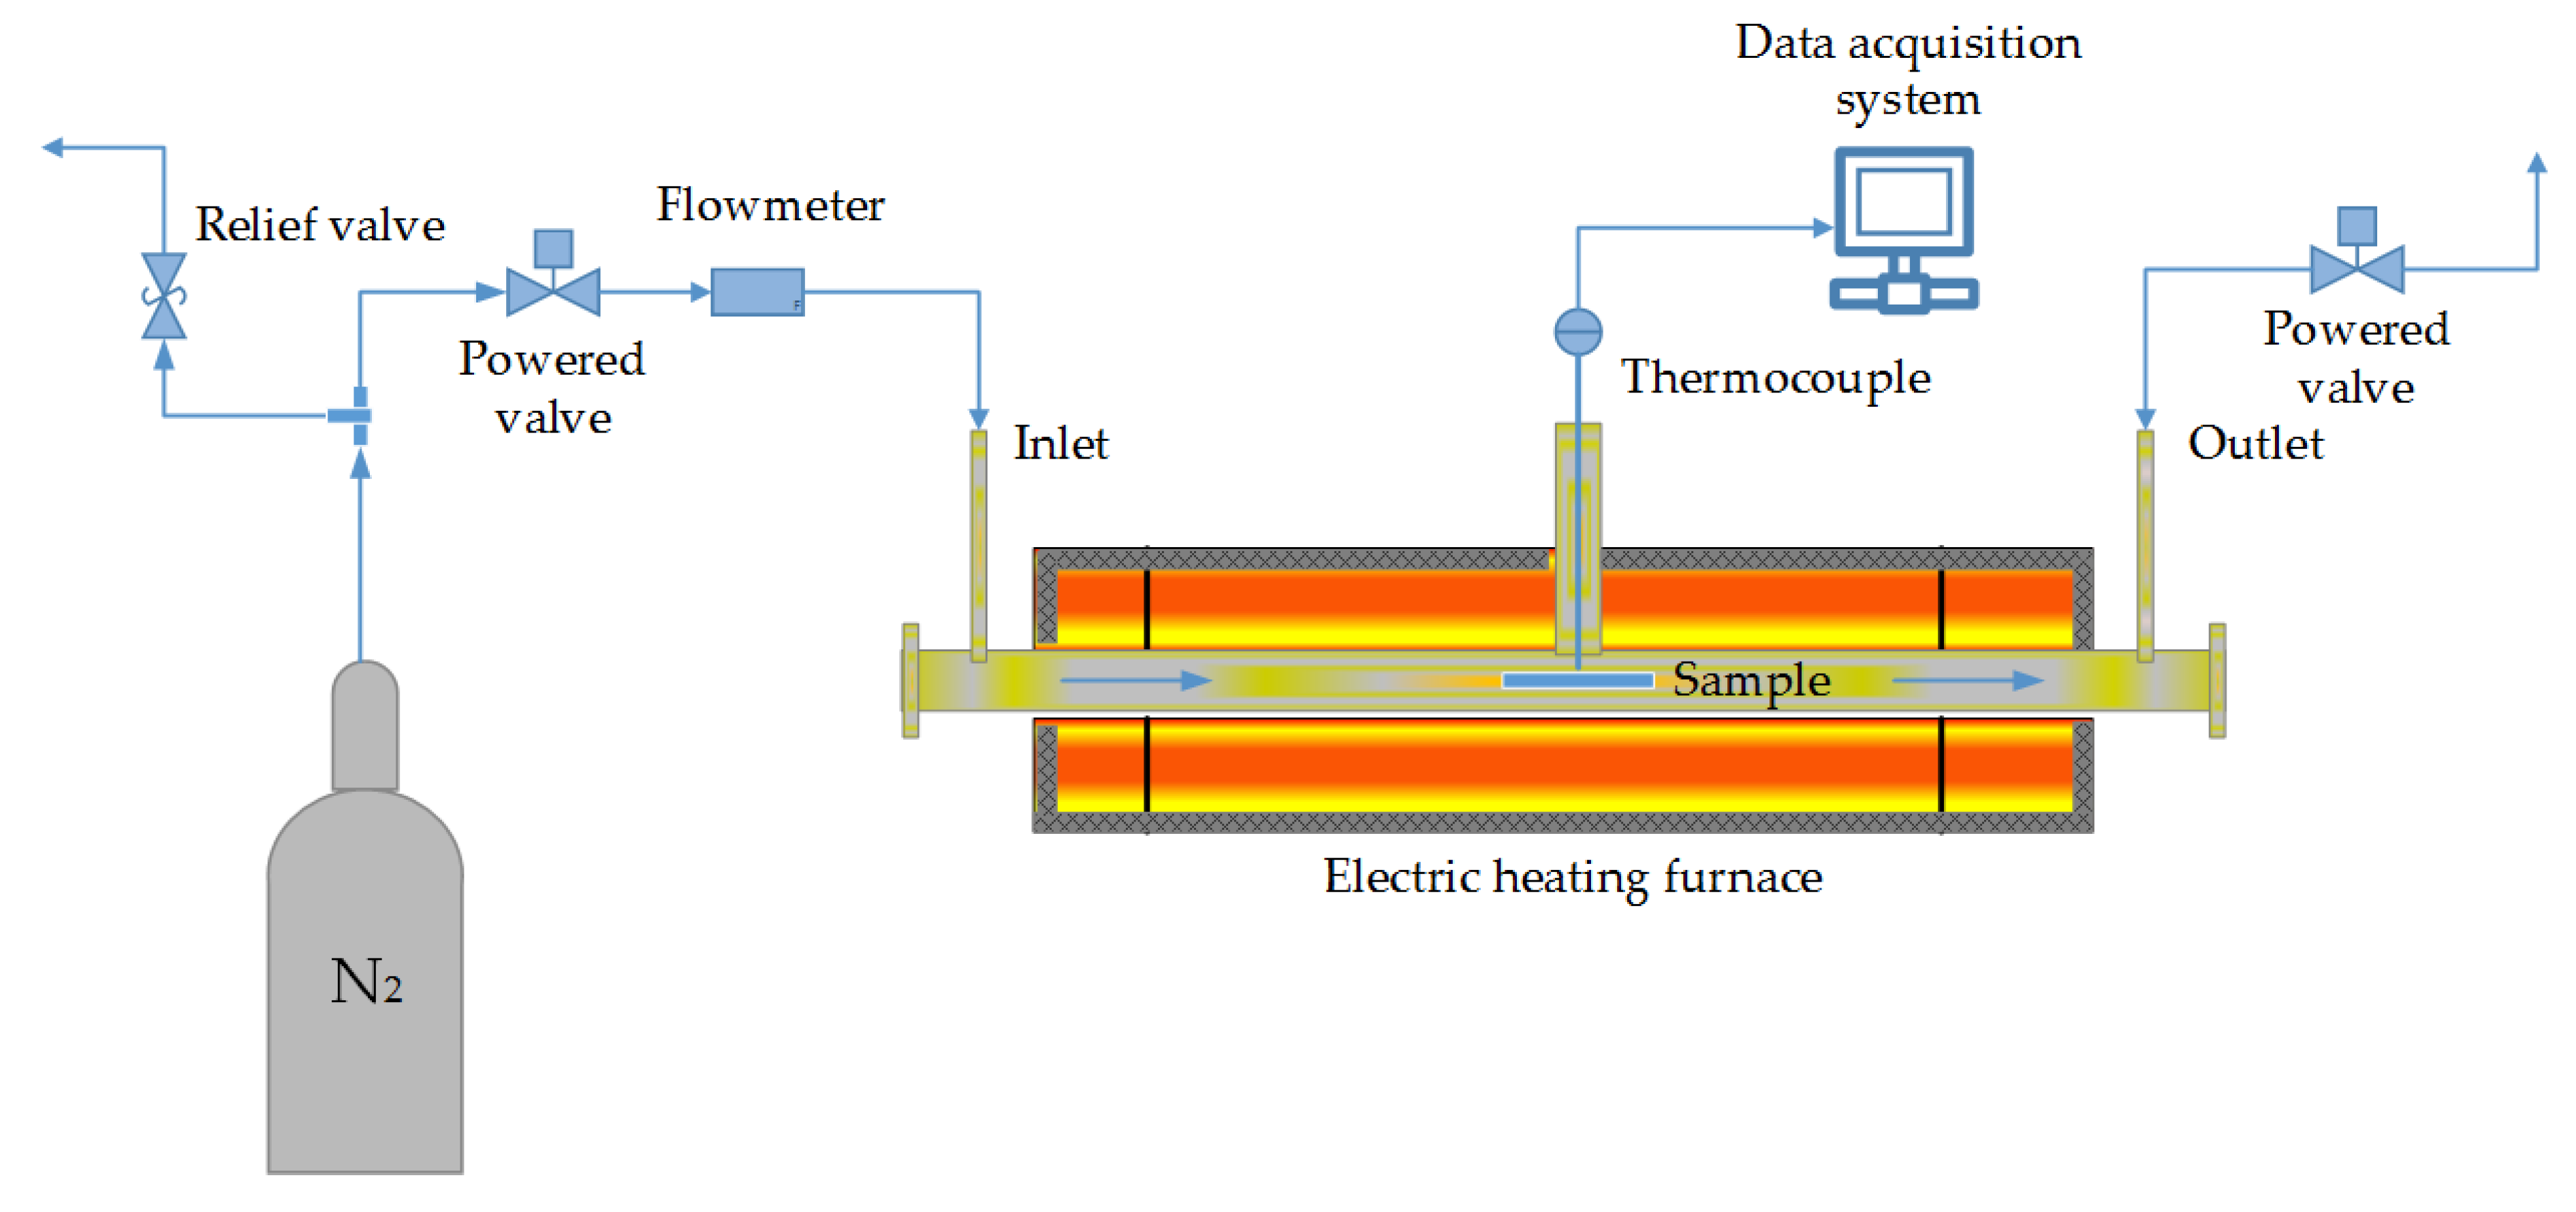
2.2.2. Experimental Setup and Procedure for Carbon Black Production
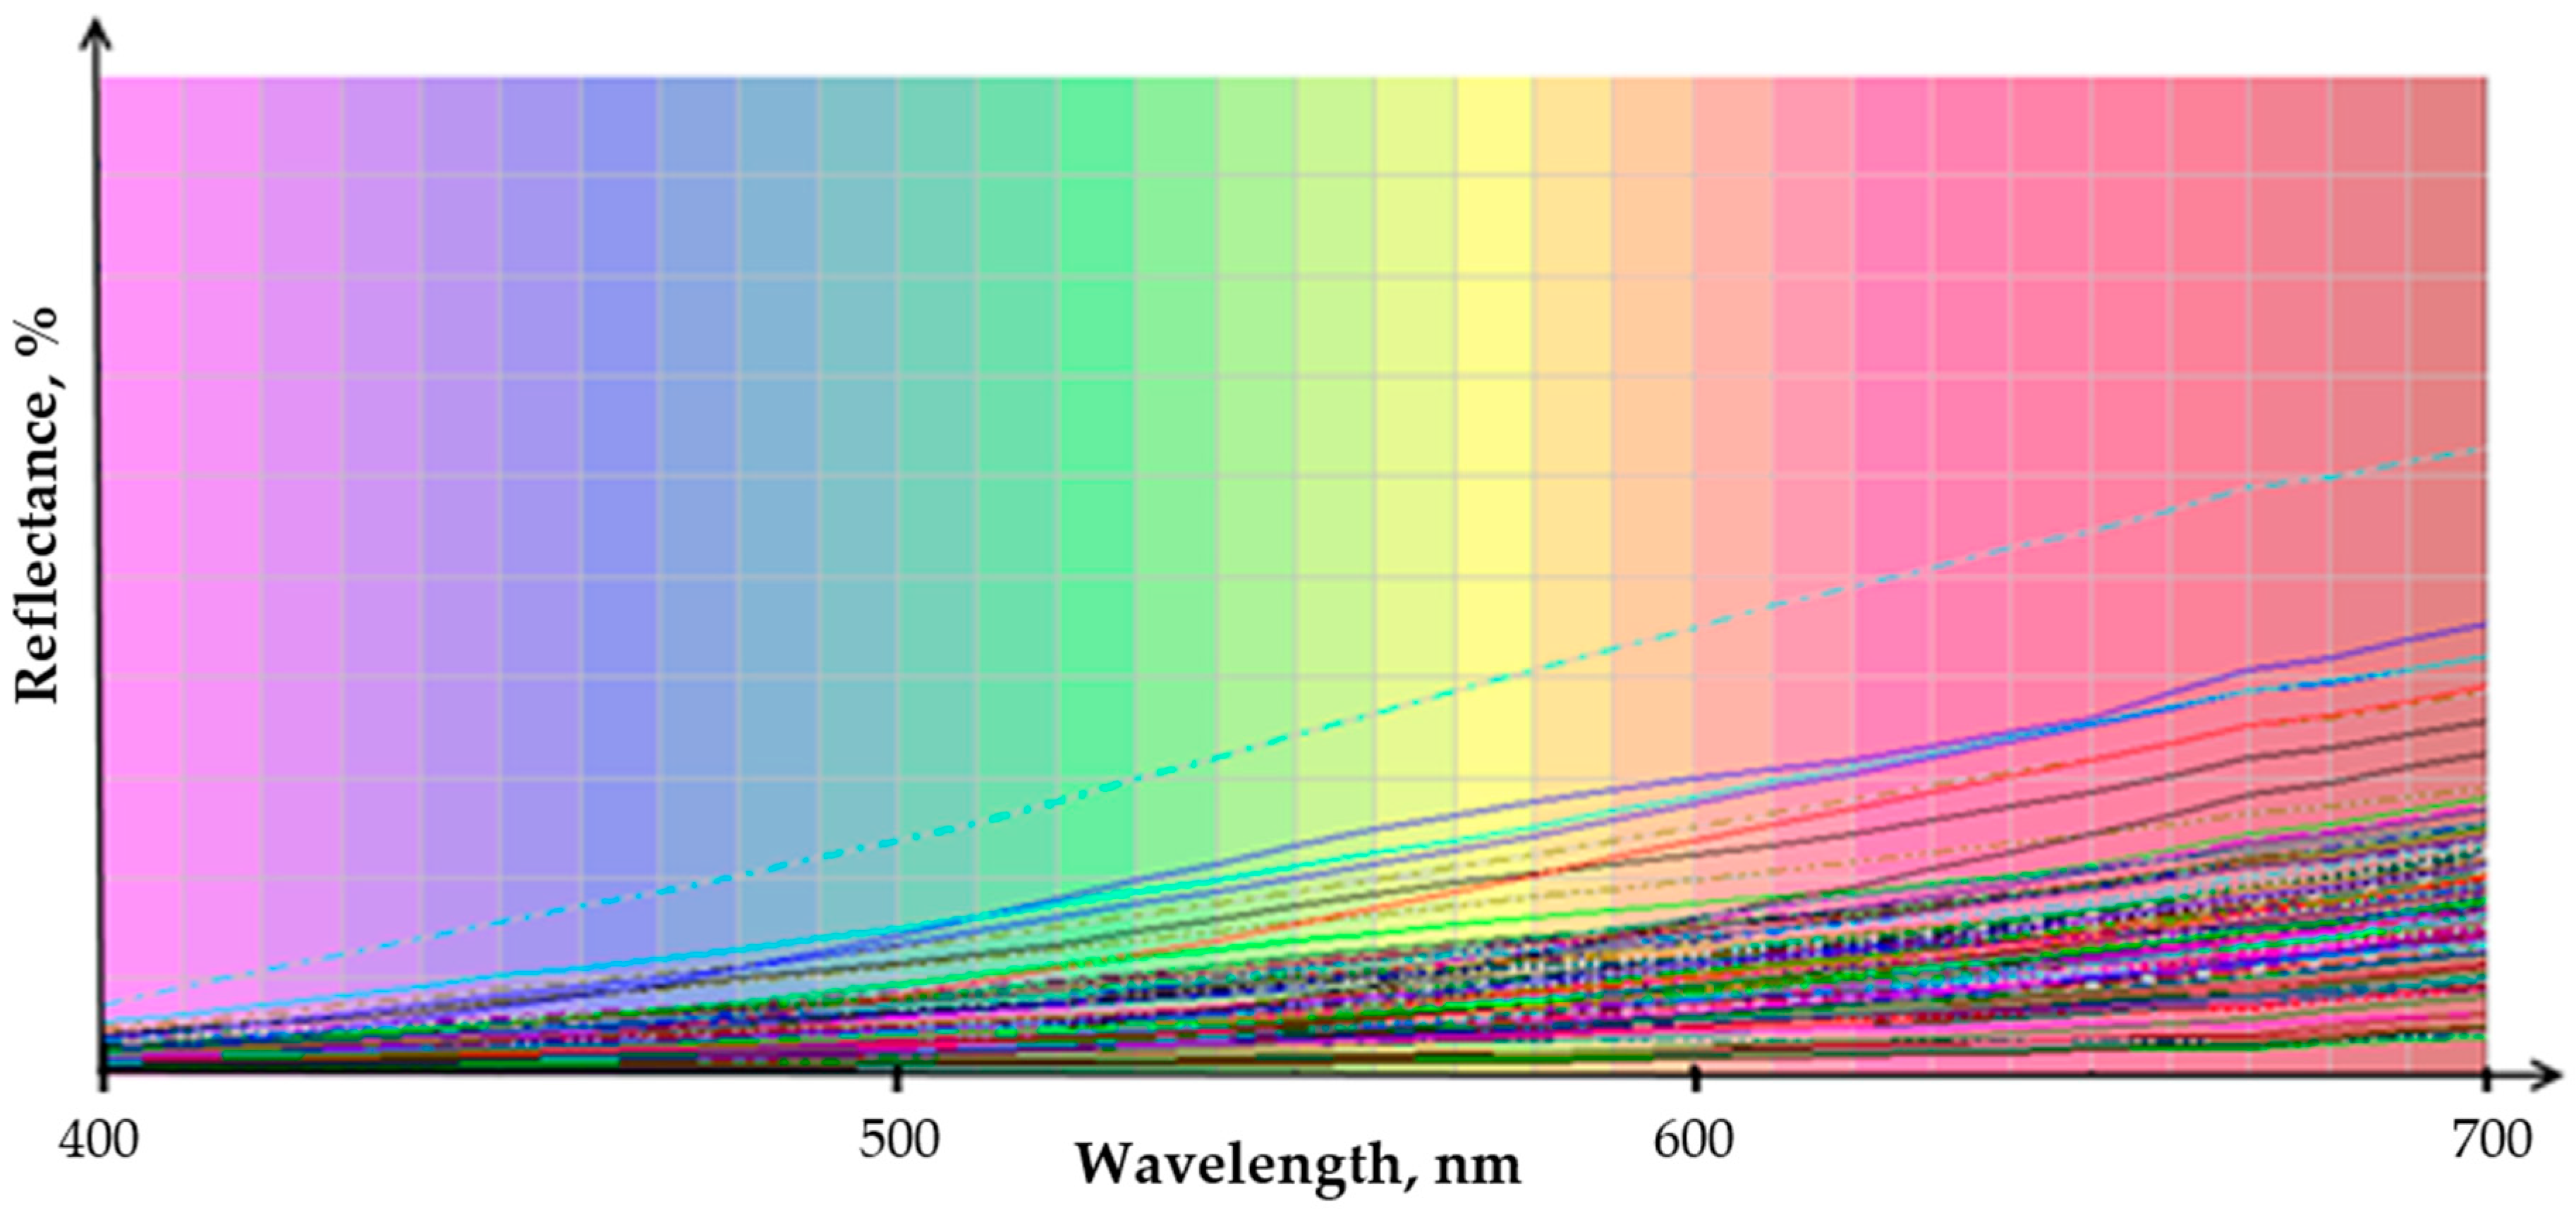
2.2.3. Colour Analysis by Spectrophotometry and Developed Protocol
2.2.4. Other Analysis
3. Results and Discussions
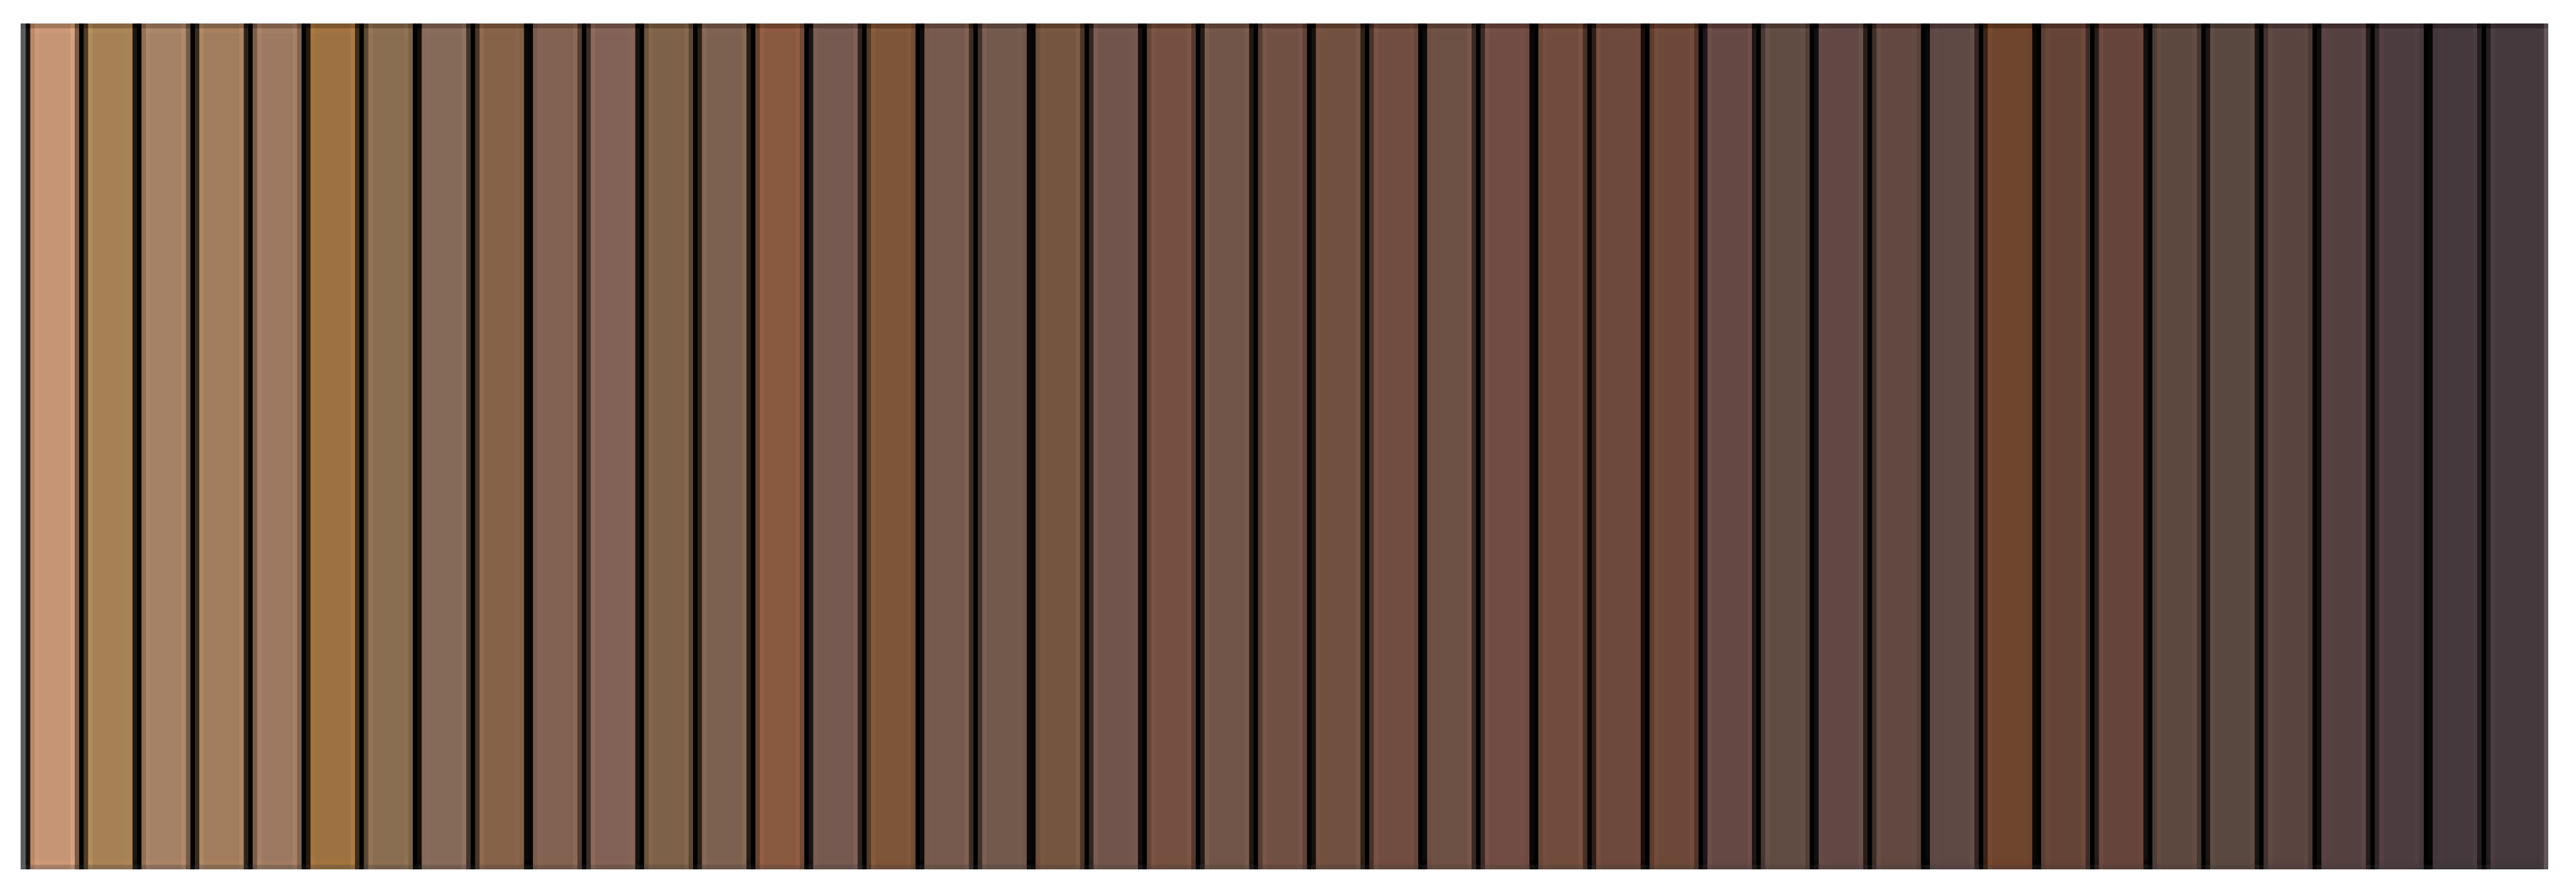
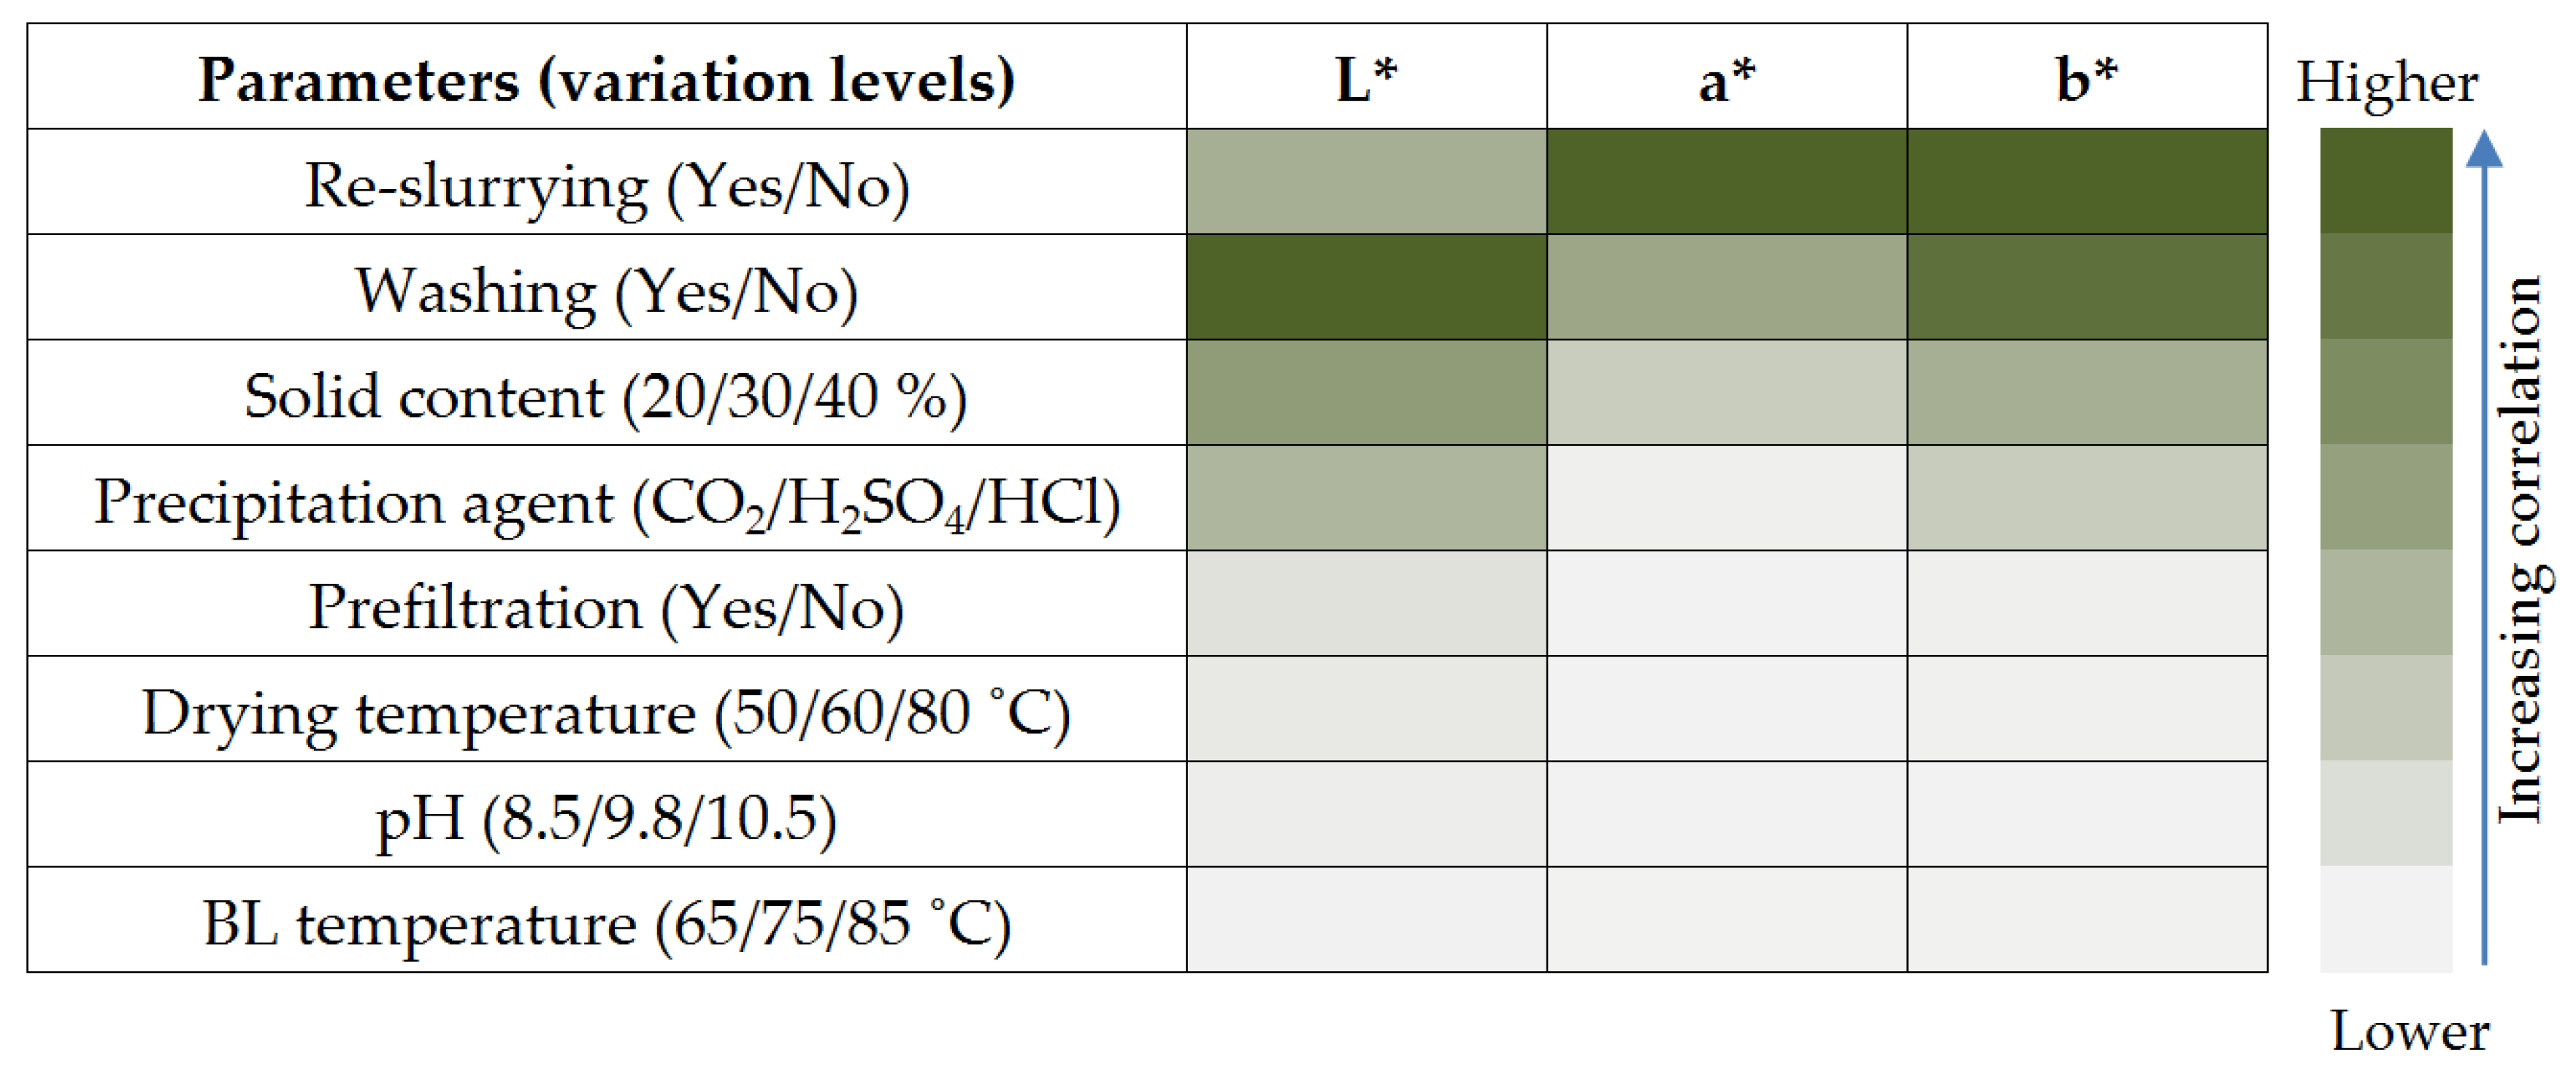
3.1. Lignin Colour Variability and Identification of Influencing Parameters
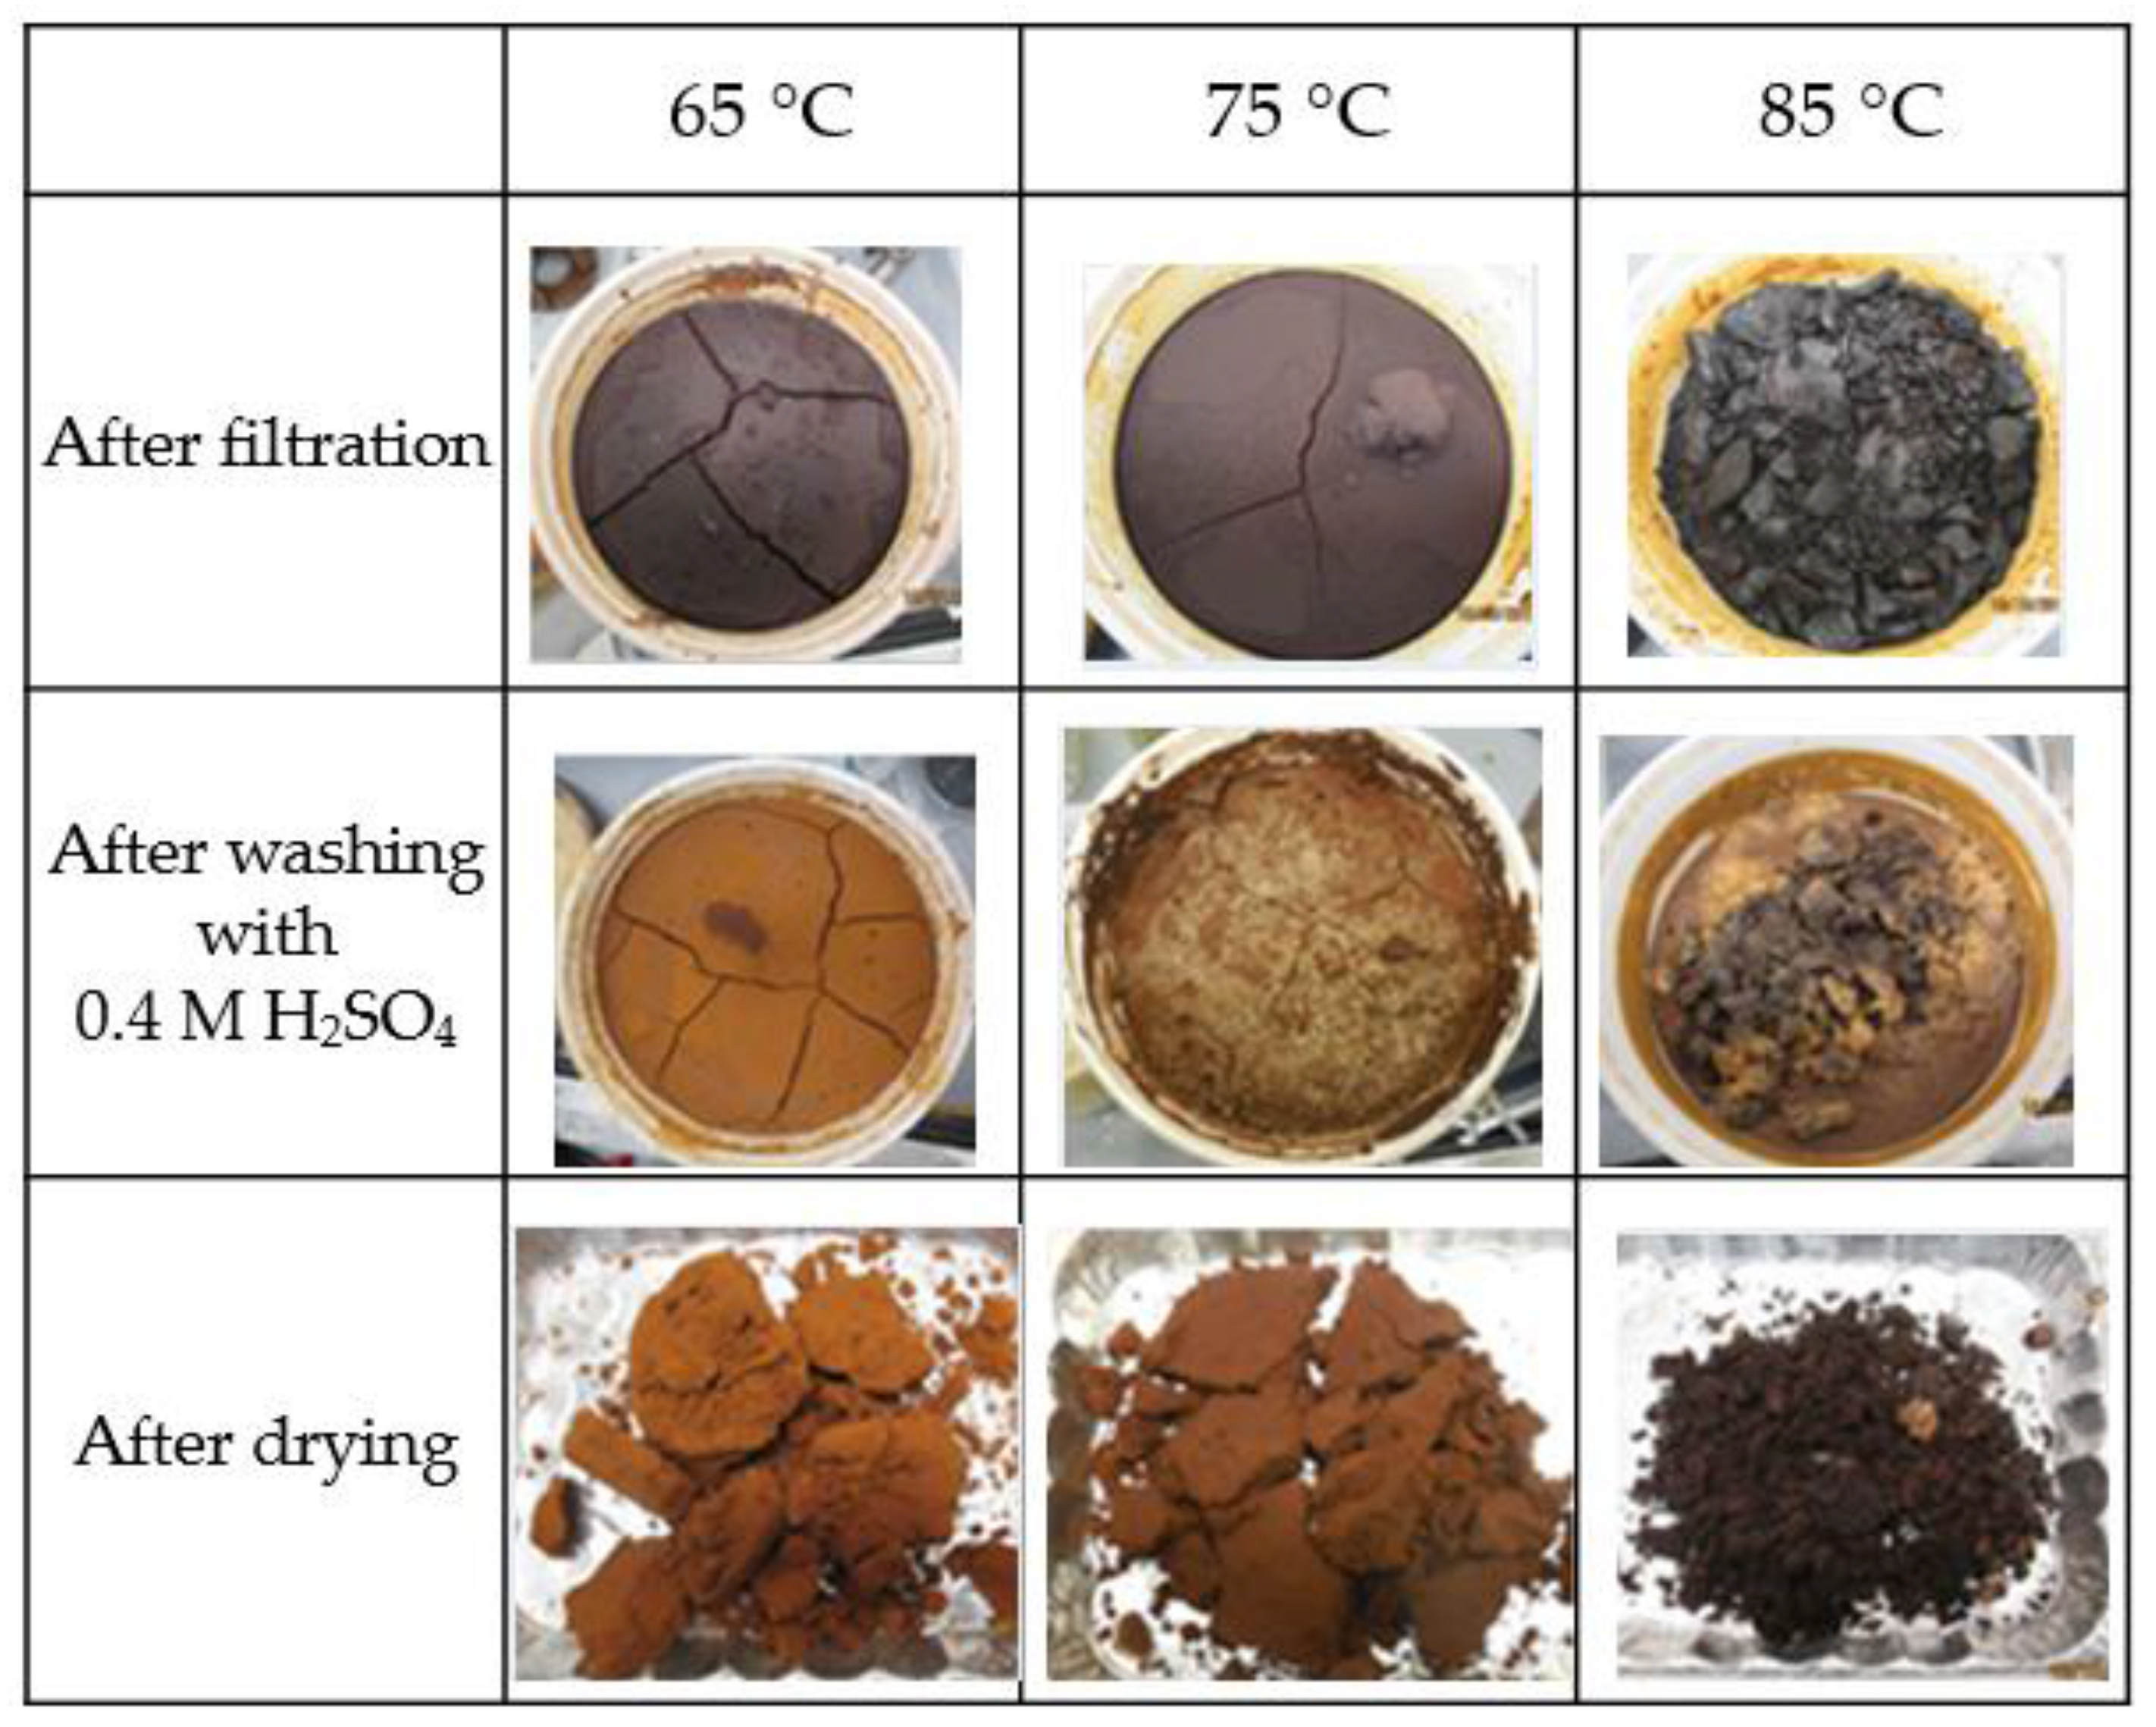
3.2. Effect of Precipitation and Drying Temperature on Lignin Colour
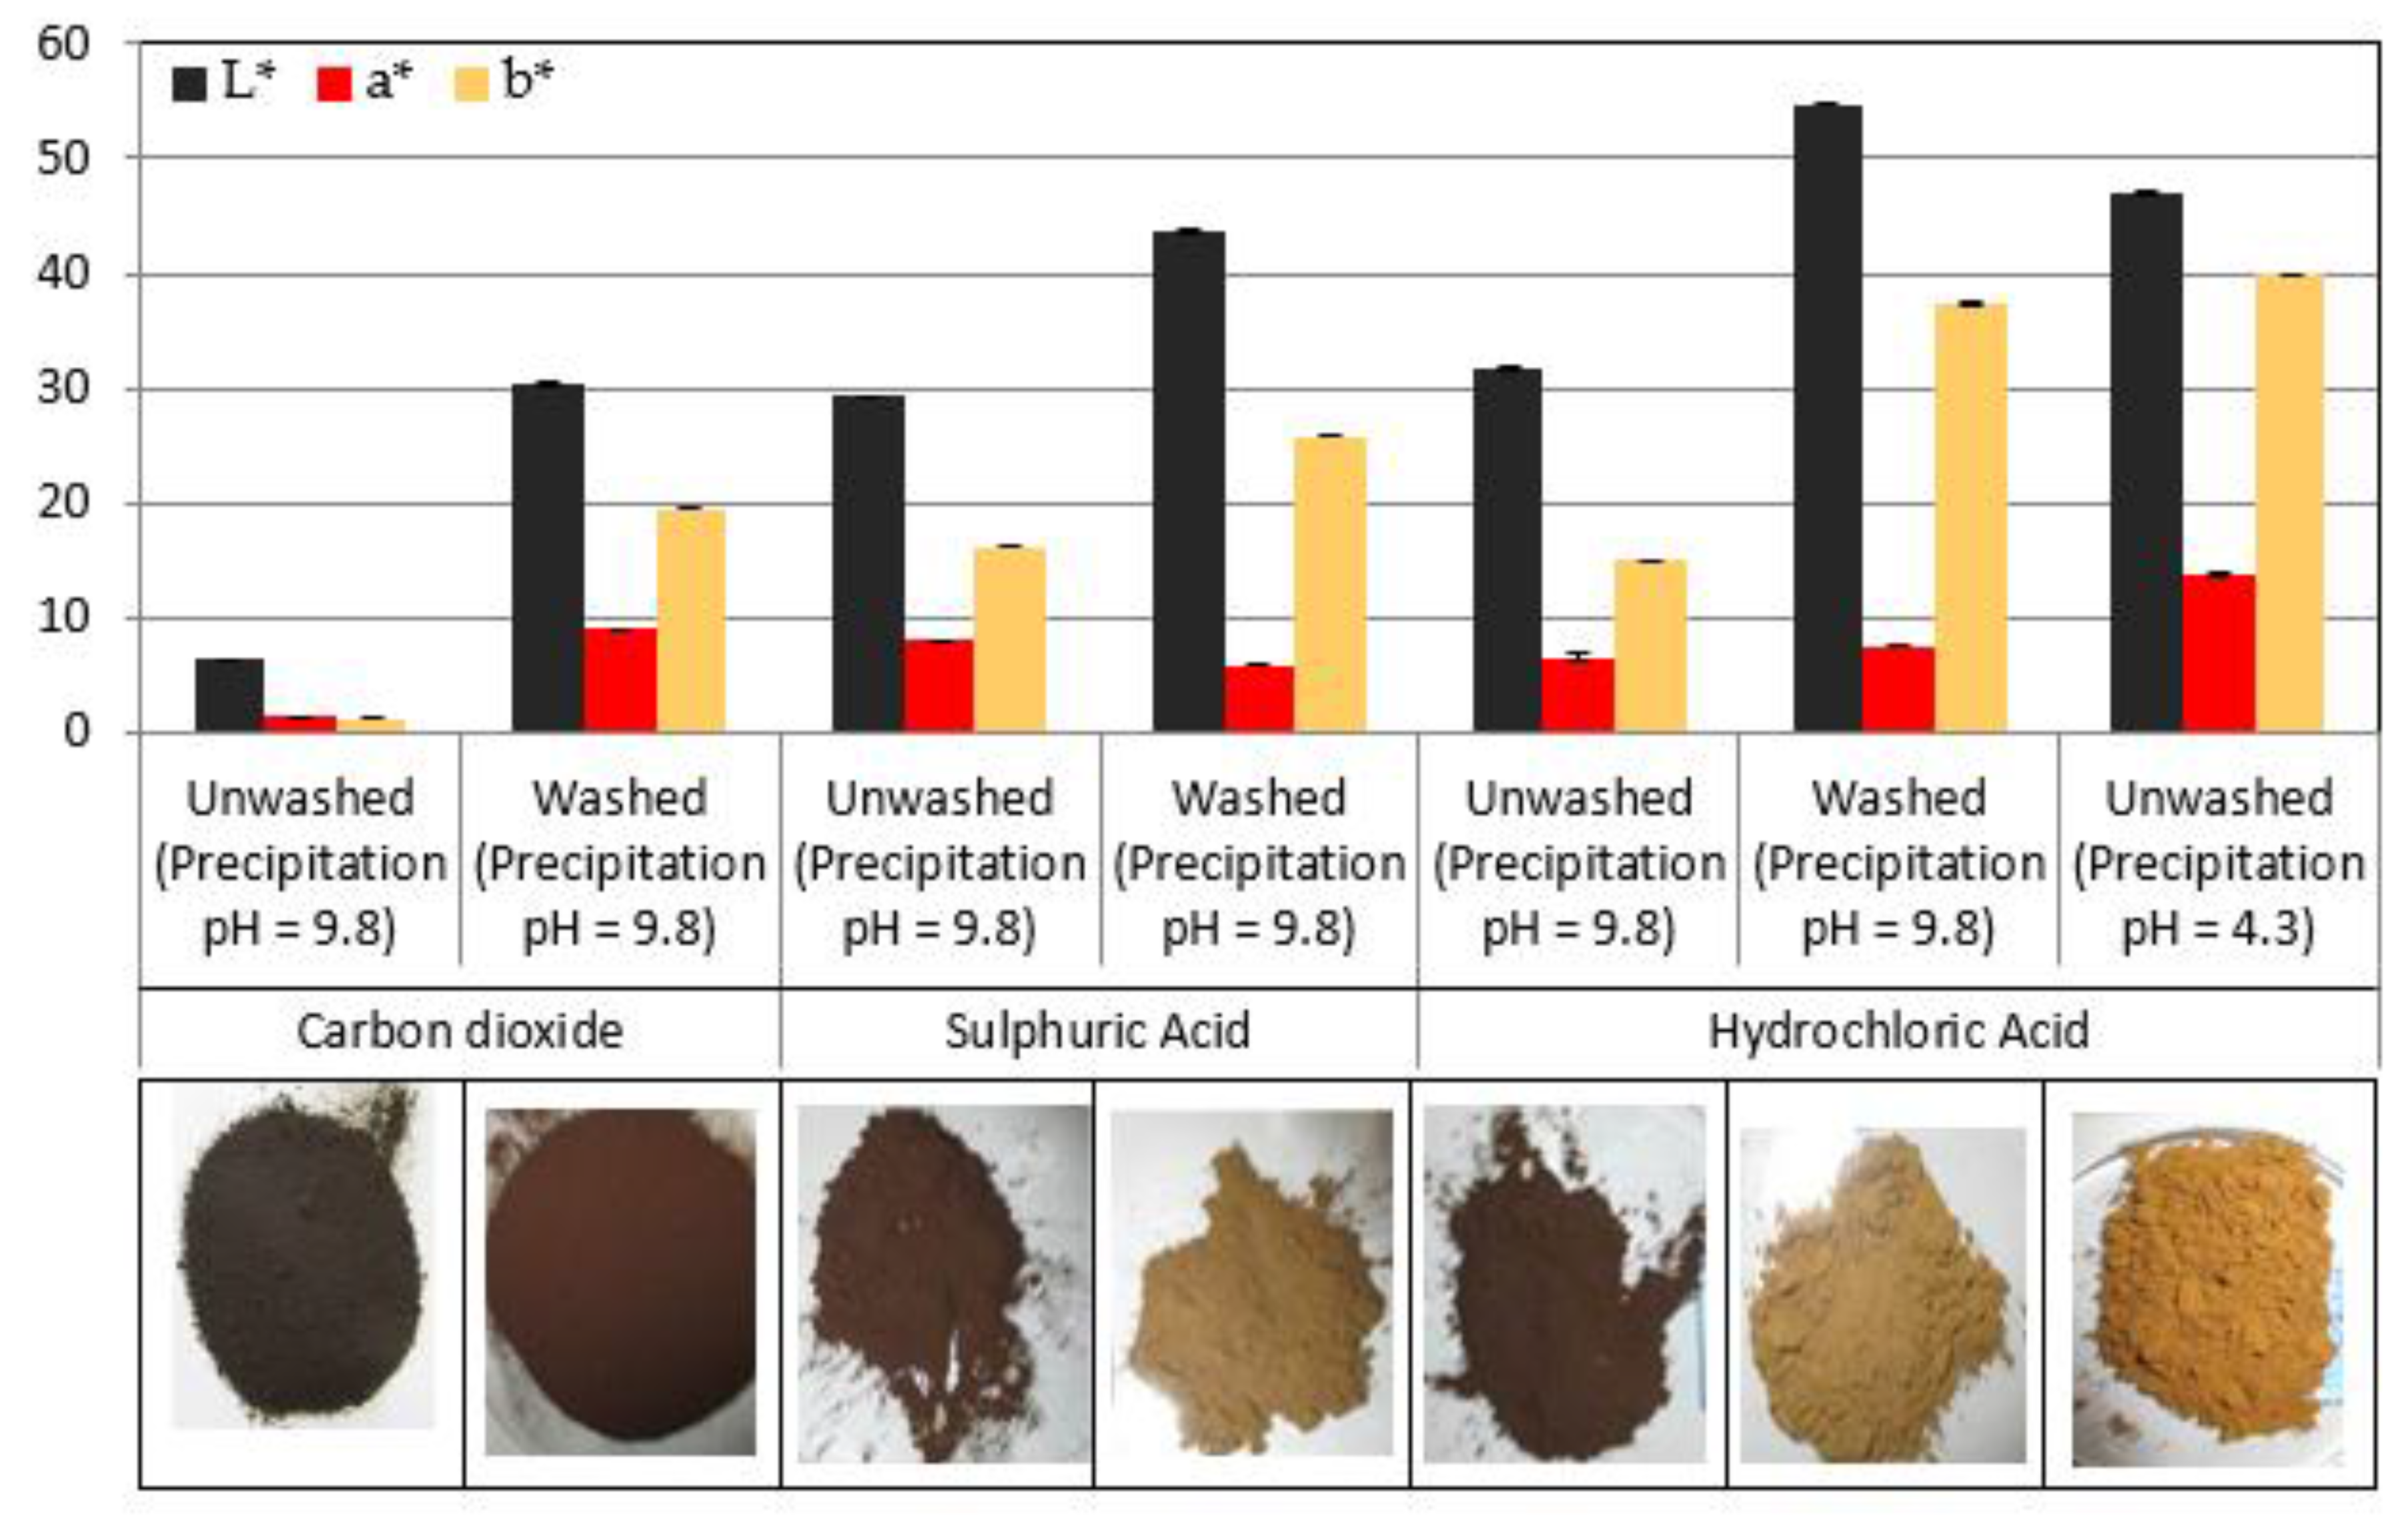
3.3. Effect of Precipitation Agent and pH on Lignin Colour
3.4. Correlation of Lignin Colour Properties with Precipitation Conditions
3.5. Carbon Black Application Case Study
4. Future Research on Lignin Colour and Knowledge Gaps to be Addressed
5. Conclusions
Acknowledgments
Author Contributions
Conflicts of Interest
Appendix A. Method for Lignin Colour Analysis
Appendix A.1. Introduction
Appendix A.2. Scope
Appendix A.3. Normative References
Appendix A.4. Terms and Definitions
Appendix A.4.1. Lignin
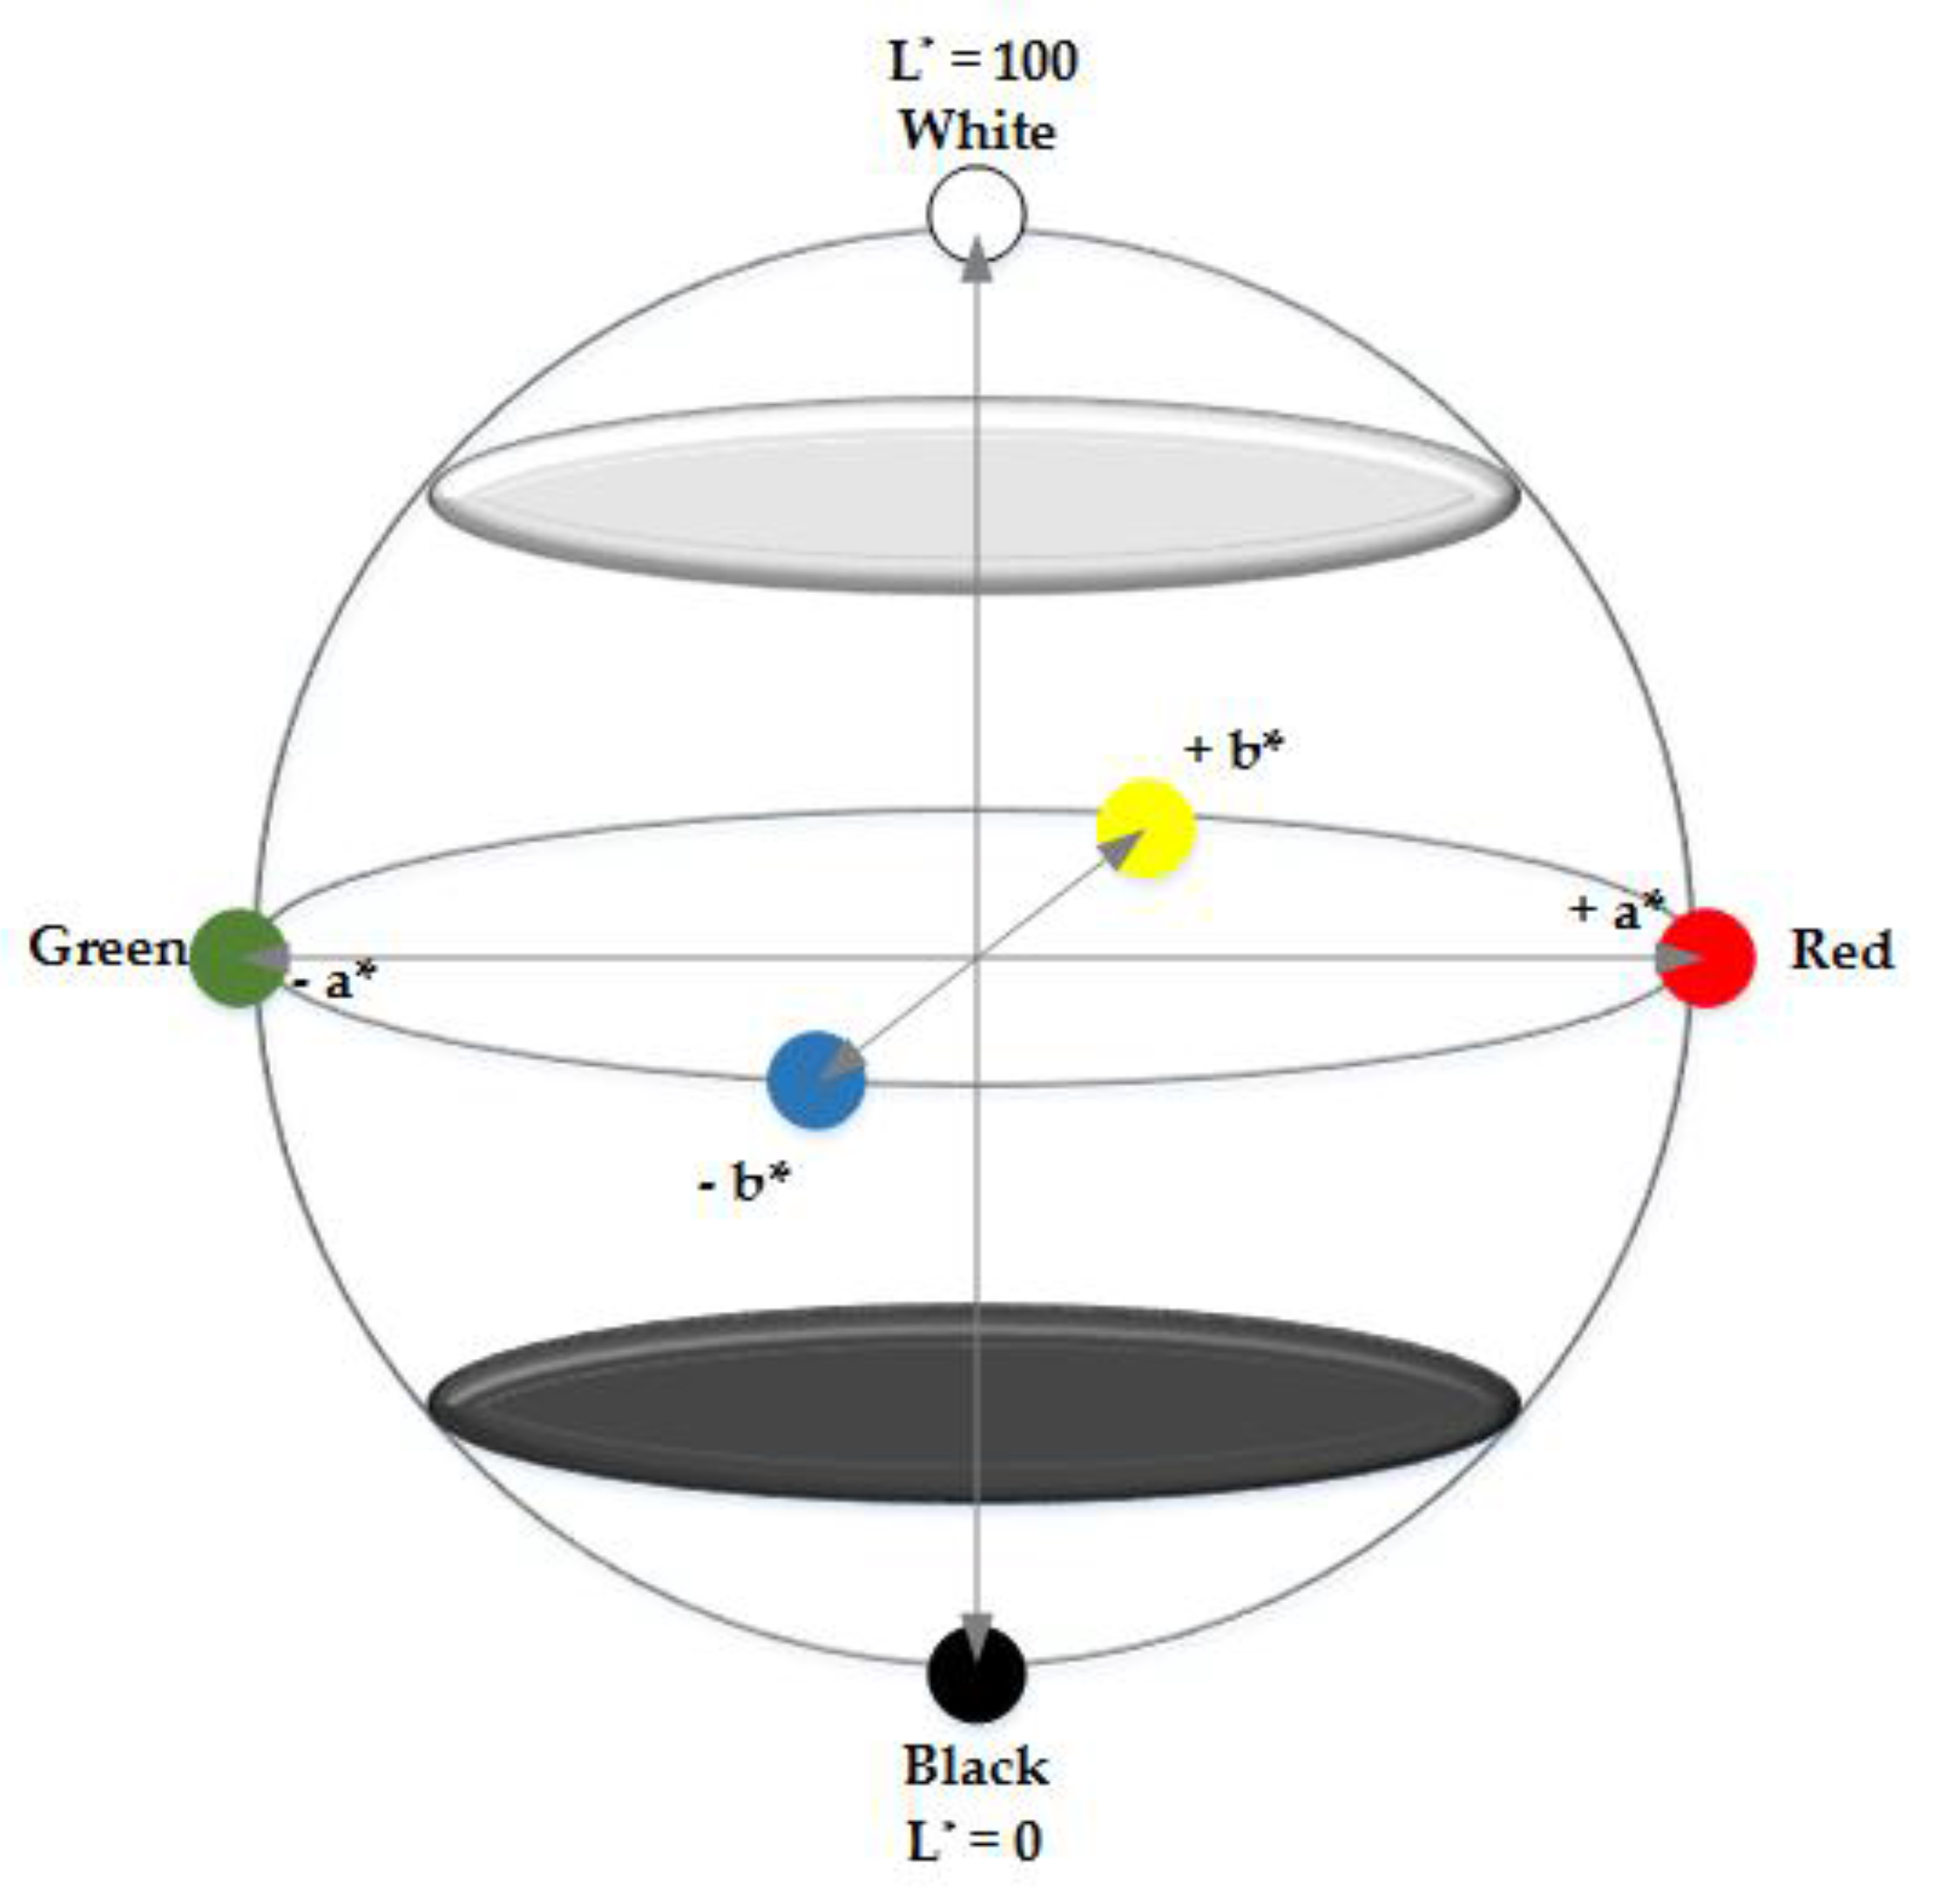
Appendix A.4.2. CIE L*a*b* Colour Space
Appendix A.4.3. Colour Difference
Appendix A.5. Principle
Appendix A.6. Equipment and Reagents
- Aluminium pans
- Measuring cylinder
- Drying oven
- Desiccator, loaded with a desiccant
- Optically clear glass cup made from fused silica with a 25 mL mark
- Spectrophotometer with a 45°/0° measurement geometry, and a 65/10 illuminant/observer.
Appendix A.7. Sampling
Appendix A.8. Procedure
- Samples are to be analysed in triplicate with the mean result and the standard deviations presented
- Weigh the aluminium pan to the nearest 1 mg
- Add sufficient dry lignin samples to cover to fill the clear glass cup up to the 25 mL mark
- Place the sample in an oven and re-dry it at 55 °C ± 5 °C for at least 2 h until a constant weight is reached or a maximum duration of 24 h
- Remove the sample from the oven and allow it to cool down to room temperature in a desiccator
- Calibrate the spectrophotometer as per the manufacturer’s instruction
- Fill the glass sample cup with the sample up to the 25 mL mark
- Select the CIE L*a*b* colour scale for all measurements
- Cover the sample with an opaque cup to prevent interference by external light sources and place on or in the measurement port
- Perform measurement in triplicate.
Appendix A.9. Calculation
Appendix A.10. Report
- Date and place of testing;
- Identification of the samples tested;
- Results expressed as the CIE L*a*b* colour coordinates for a sample as well as the range and standard deviation;
- Any variation from this procedure as described in the Natural Resources Canada colour test method and/or any circumstance that might have had an impact on the results.
Appendix A.11. Precision Repeatability

| Sample | L* | a* | b* |
|---|---|---|---|
| Softwood Kraft Lignin | 53.590 | 9.020 | 25.940 |
| Standard Deviation | 0.068 | 0.012 | 0.068 |
| Range | 0.136 | 0.023 | 0.136 |
References
- Fougere, D.; Nanda, S.; Clarke, K.; Kozinski, J.A.; Li, K. Effect of acidic pretreatment on the chemistry and distribution of lignin in aspen wood and wheat straw substrates. Biomass Bioenergy 2016, 91, 56–68. [Google Scholar] [CrossRef]
- Zeng, Y.; Zhao, S.; Yang, S.; Ding, S.-Y. Lignin plays a negative role in the biochemical process for producing lignocellulosic biofuels. Curr. Opin. Biotechnol. 2014, 27, 38–45. [Google Scholar] [CrossRef] [PubMed]
- Achyuthan, K.E.; Achyuthan, A.M.; Adams, P.D.; Dirk, S.M.; Harper, J.C.; Simmons, B.A.; Singh, A.K. Supramolecular Self-Assembled Chaos: Polyphenolic Lignin’s Barrier to Cost-Effective Lignocellulosic Biofuels. Molecules 2010, 15, 8641–8688. [Google Scholar] [CrossRef] [PubMed]
- Ciesielski, P.N.; Resch, M.G.; Hewetson, B.; Killgore, J.P.; Curtin, A.; Anderson, N.; Chiaramonti, A.N.; Hurley, D.C.; Sanders, A.; Himmel, M.E.; et al. Engineering plant cell walls: Tuning lignin monomer composition for deconstructable biofuel feedstocks or resilient biomaterials. Green Chem. 2014, 16, 2627–2635. [Google Scholar] [CrossRef]
- Rencoret, J.; del Río, J.C.; Nierop, K.G.J.; Gutiérrez, A.; Ralph, J. Rapid Py-GC/MS assessment of the structural alterations of lignins in genetically modified plants. J. Anal. Appl. Pyrolysis 2016, 121, 155–164. [Google Scholar] [CrossRef]
- Siddiqui, H.; Mahmood, N.; Yuan, Z.; Crapulli, F.; Dessbesell, L.; Rizkalla, A.; Ray, A.; Xu, C. (Charles) Sustainable Bio-Based Phenol-Formaldehyde Resoles Using Hydrolytically Depolymerized Kraft Lignin. Molecules 2017, 22, 1850. [Google Scholar] [CrossRef] [PubMed]
- Causin, V. Polymers on the crime scene: How can analytical chemistry help to exploit the information from these mute witnesses? Anal. Methods 2010, 2, 792–804. [Google Scholar] [CrossRef]
- Grand View Research Lignin Market Size, Growth: Global Industry Analysis Report, 2014–2025. Available online: https://www.grandviewresearch.com/industry-analysis/lignin-market (accessed on 18 January 2018).
- Demesa, A.G.; Laari, A.; Sillanpää, M.; Koiranen, T. Valorization of Lignin by Partial Wet Oxidation Using Sustainable Heteropoly Acid Catalysts. Molecules 2017, 22, 1625. [Google Scholar] [CrossRef] [PubMed]
- Benali, M.; Ajao, O.; Jeaidi, J.; Gilani, B.; Mansoornejad, B. Integrated Lignin-Kraft Pulp Biorefinery for the Production of Lignin and Its Derivatives: Economic Assessment and LCA-Based Environmental Footprint. In Production of Biofuels and Chemicals from Lignin; Fang, Z., Richard, L.S., Jr., Eds.; Biofuels and Biorefineries; Springer: Singapore, 2016; pp. 379–418. ISBN 978-981-10-1964-7. [Google Scholar]
- Ragauskas, A.J.; Beckham, G.T.; Biddy, M.J.; Chandra, R.; Chen, F.; Davis, M.F.; Davison, B.H.; Dixon, R.A.; Gilna, P.; Keller, M.; et al. Lignin Valorization: Improving Lignin Processing in the Biorefinery. Science 2014, 344, 1246843. [Google Scholar] [CrossRef] [PubMed]
- Holladay, J.E.; Bozell, J.J.; White, J.F.; Johnson, D. Top Value-Added Chemicals from Biomass; Pacific Northwest National Lab: Richland, WA, USA, 2007. [Google Scholar]
- Tian, X.; Fang, Z.; Smith, R.L.; Wu, Z.; Liu, M. Properties, Chemical Characteristics and Application of Lignin and Its Derivatives. In Production of Biofuels and Chemicals from Lignin; Biofuels and Biorefineries; Springer: Singapore, 2016; pp. 3–33. ISBN 978-981-10-1964-7. [Google Scholar]
- Jacobs, A.; Aldaeus, F. Lignin properties for the biorefinery, and their analytical challenges. In Proceedings of the 6th Nordic Wood Biorefinery Conference, Helsinki, Finland, 20–22 October 2015; pp. 203–204. [Google Scholar]
- Vishtal, A.G.; Kraslawski, A. Challenges in industrial applications of technical lignins. BioResources 2011, 6, 3547–3568. [Google Scholar]
- Pan, X.; Saddler, J.N. Effect of replacing polyol by organosolv and kraft lignin on the property and structure of rigid polyurethane foam. Biotechnol. Biofuels 2013, 6, 12. [Google Scholar] [CrossRef] [PubMed]
- Lin, S.Y. Process for Reduction of Lignin Color. U.S. Patent 4184845 A, 22 January 1980. [Google Scholar]
- Saritha, V.; Maruthi, Y.A.; Mukkanti, K. Biological decolourization of higher concentrations of synthetic lignin by native fungi. J. Environ. Resour. Manag. 2010, 1, 1–4. [Google Scholar]
- Smit, A.T.; van der Laan, R.R.; Huijgen, W.J.J. Production of High-Purity Light-Coloured Lignin. WO2017099592 A1, 15 June 2017. [Google Scholar]
- Zhang, H.; Bai, Y.; Yu, B.; Liu, X.; Chen, F. A practicable process for lignin color reduction: Fractionation of lignin using methanol/water as solvent. Green Chem. 2017, 19, 5152–5162. [Google Scholar] [CrossRef]
- Lachenal, D.; Chirat, C.; Benattar, N.; Hamzeh, Y.; Marlin, N.; Mateo, C.; Brochier, B. Influence of pulp colour on bleachability. Ways to improve the bleaching response of alkaline pulp. ATIP 2005, 59, 6–11. [Google Scholar]
- Lachenal, D.; Pipon, G.; Chirat, C. Final pulp bleaching by ozonation: Chemical justification and practical operating conditions. Pulp Pap.-Can. 2009, 107, 31–34. [Google Scholar]
- Voiron, S.; Kuligowski, C.; Lachenal, D. Contribution of various coloured groups in pulp to bleachability problems. Cellul. Chem. Technol. 2006, 40, 243–248. [Google Scholar]
- Dyer, T.J. Elucidating the Formation and Chemistry of Chromophores during Kraft Pulping. Ph.D. Thesis, Institute of Paper Science and Technology, Atlanta, GA, USA, 2004. [Google Scholar]
- Azadfallah, M.; Mirshokraei, S.A.; Latibari, A.J. Photodegradation of Acidolysis Lignin from BCMP. Molecules 2008, 13, 3129–3139. [Google Scholar] [CrossRef] [PubMed]
- Gu, X.-D.; Sun, M.-Y.; Zhang, L.; Fu, H.-W.; Cui, L.; Chen, R.-Z.; Zhang, D.-W.; Tian, J.-K. UV-B Induced Changes in the Secondary Metabolites of Morus alba L. Leaves. Molecules 2010, 15, 2980–2993. [Google Scholar] [CrossRef] [PubMed]
- International Organization for Standardization. Paper and Board—Determination of CIE Whiteness, D65/10 Degrees (Outdoor Daylight); International Organization for Standardization: Geneva, Switzerland, 2017. [Google Scholar]
- International Organization for Standardization. Paper, Board and Pulps—Measurement of Diffuse Blue Reflectance Factor—Part 2: Outdoor Daylight Conditions (D65 Brightness); International Organization for Standardization: Geneva, Switzerland, 2008. [Google Scholar]
- Technical Association of the Pulp and Paper Industry. Diffuse Brightness of Paper and Paperboard (D/0); Technical Association of the Pulp and Paper Industry: Peachtree Corners, GA, USA, 2003. [Google Scholar]
- Technical Association of the Pulp and Paper Industry. CIE Whiteness and Tint of Paper and Paperboard (D/0 Geometry, C/2 Illuminant/Observer); Technical Association of the Pulp and Paper Industry: Peachtree Corners, GA, USA, 2010. [Google Scholar]
- Technical Association of the Pulp and Paper Industry. CIE Whiteness and Tint of Paper and Paperboard (45/0 Geometry, C/2 Illuminant/Observer); Technical Association of the Pulp and Paper Industry: Peachtree Corners, GA, USA, 2010. [Google Scholar]
- Kannangara, M.; Marinova, M.; Fradette, L.; Paris, J. Effect of mixing hydrodynamics on the particle and filtration properties of precipitated lignin. Chem. Eng. Res. Des. 2016, 105, 94–106. [Google Scholar] [CrossRef]
- International Organization for Standardization (ISO). Colorimetry—Part 2: CIE Standard Illuminants; CIE International Commission on Illumination: Vienna, Austria, 2007. [Google Scholar]
- International Organization for Standardization (ISO). Colorimetry—Part 4: CIE 1976 L*a*b* Colour Space; CIE International Commission on Illumination: Vienna, Austria, 2008. [Google Scholar]
- Sazawa, K.; Wakimoto, T.; Hata, N.; Taguchi, S.; Tanaka, S.; Tafu, M.; Kuramitz, H. The evaluation of forest fire severity and effect on soil organic matter based on the L*, a*, b* color reading system. Anal. Methods 2013, 5, 2660–2665. [Google Scholar] [CrossRef]
- Uehara, N. Colorimetric assay of homocysteine using gold nanoparticles conjugated with thermoresponsive copolymers. Anal. Methods 2016, 8, 7185–7192. [Google Scholar] [CrossRef]
- International Organization for Standardization (ISO). Colorimetry—Part 6: CIEDE2000 Colour-Difference Formula; CIE International Commission on Illumination: Vienna, Austria, 2014. [Google Scholar]
- Sharma, G.; Wu, W.; Dalal, E.N. The CIEDE2000 color-difference formula: Implementation notes, supplementary test data, and mathematical observations. Color Res. Appl. 2005, 30, 21–30. [Google Scholar] [CrossRef]
- Yeerken, Y.; Otomaru, T.; Said, M.; Li, N.; Taniguchi, H. Applicability of the CIELAB and CIEDE2000 formulae for detection of colour changes in colour-changeable chewing gum for evaluating masticatory function. J. Clin. Diagn. Res. JCDR 2017, 11, ZC119–ZC123. [Google Scholar] [CrossRef] [PubMed]
- Niemelä, K.; Alén, R. Characterization of pulping liquors. In Analytical Methods in Wood Chemistry, Pulping, and Papermaking; Springer Series in Wood Science; Springer: Berlin/Heidelberg, Germany, 1999; pp. 193–231. ISBN 978-3-642-08317-4. [Google Scholar]
- Holmqvist, A.; Wallberg, O.; Jönsson, A.-S. Ultrafiltration of Kraft Black Liquor from Two Swedish Pulp Mills. Chem. Eng. Res. Des. 2005, 83, 994–999. [Google Scholar] [CrossRef]
- Wallberg, O.; Jönsson, A.-S.; Wimmerstedt, R. Fractionation and concentration of kraft black liquor lignin with ultrafiltration. Desalination 2003, 154, 187–199. [Google Scholar] [CrossRef]
- Radiotis, T.; Sullivan, J.; MacLeod, M.; Syed, S.; O’Hagan, T. Improved methods for measuring residual effective alkali in Kraft black liquors, Part 2: Comparison of Titration Methods. In TAPPI Engineering, Pulping and Environmental Conference Proceedings; Technical Association of the Pulp and Paper Industry: Peachtree Corners, GA, USA, 2007; pp. 21–24. [Google Scholar]
- Gellerstedt, G.; Lindfors, E.-L. Structural changes in lignin during kraft pulping. Holzforsch.-Int. J. Biol. Chem. Phys. Technol. Wood 1984, 38, 151–158. [Google Scholar] [CrossRef]
- Evstigneev, E.I. Factors affecting lignin solubility. Russ. J. Appl. Chem. 2011, 84, 1040–1045. [Google Scholar] [CrossRef]
- Zhu, W. Equilibrium of Lignin Precipitation: The Effects of PH, Temperature, Ion Strength and Wood Origins. Master’s Thesis, Chalmers University of Technology, Gothenburg, Sweden, 2013. [Google Scholar]
- Li, N.; Chen, Y.; Yu, H.; Xiong, F.; Yu, W.; Bao, M.; Wu, Z.; Huang, C.; Rao, F.; Li, J.; et al. Evaluation of optical properties and chemical structure changes in enzymatic hydrolysis lignin during heat treatment. RSC Adv. 2017, 7, 20760–20765. [Google Scholar] [CrossRef]
- Šurina, I.; Jablonskỳ, M.; Ház, A.; Sladková, A.; Briškárová, A.; Kačík, F.; Šima, J. Characterization of non-wood lignin precipitated with sulphuric acid of various concentrations. BioResources 2015, 10, 1408–1423. [Google Scholar] [CrossRef]
- Jablonskỳ, M.; Haz, A. Characterization of lignins precipitated with nitric and hydrochloric acid. Int. J. Recent Sci. Res. 2016, 7, 9177–9180. [Google Scholar]
- Santos, R.B.; Hart, P.; Jameel, H.; Chang, H. Wood Based Lignin Reactions Important to the Biorefinery and Pulp and Paper Industries. BioResources 2013, 8, 1456–1477. [Google Scholar] [CrossRef]
- Crestini, C.; Argyropoulos, D.S. Structural analysis of wheat straw lignin by quantitative 31P and 2D NMR spectroscopy. The occurrence of ester bonds and α-O-4 substructures. J. Agric. Food Chem. 1997, 45, 1212–1219. [Google Scholar] [CrossRef]
- Picard, G.; Simon, D.; Kadiri, Y.; LeBreux, J.D.; Ghozayel, F. Cellulose Nanocrystal Iridescence: A New Model. Langmuir 2012, 28, 14799–14807. [Google Scholar] [CrossRef] [PubMed]
- Bardet, R.; Belgacem, N.; Bras, J. Flexibility and color monitoring of cellulose nanocrystal iridescent solid films using anionic or neutral polymers. ACS Appl. Mater. Interfaces 2015, 7, 4010–4018. [Google Scholar] [CrossRef] [PubMed]
- Beck, S.; Bouchard, J.; Berry, R. Control of Nanocrystalline Cellulose Film Iridescence Wavelength. U.S. Patent 9394481 B2, 19 July 2016. [Google Scholar]
Sample Availability: Samples of the compounds are not available from the authors. |


| Parameters | A | B |
|---|---|---|
| Total solids (%) | 46.98 ± 0.19 | 49.00 ± 0.23 |
| UV lignin (%) | 41.94 ± 0.84 | 35.19 ± 0.92 |
| Klason Lignin (% total solids) | 39.24 ± 3.27 | 38.56 ± 3.51 |
| Acid soluble Lignin (ASL) (mg/g) | 57.01 ± 1.27 | 75.31 ± 1.69 |
| Inorganics or Ash (% total solids) | 55.33 ± 1.79 | 30.39 ± 1.86 |
| Organics or Ash (% total solids) | 44.67 ± 1.79 | 69.61 ± 1.86 |
| pH at room temperature | 13.10 ± 0.02 | 13.22 ± 0.01 |
| Dynamic viscosity (mPa.s) | 136.00 ± 2.00 | 119.00 ± 1.00 |
| TOC (g/L) | 186.53 ± 6.52 | 226.05 ± 6.97 |
| Residual Effective Alkali (g/L as Na2O) | 2.31 ± 0.01 | 23.26 ± 0.04 |
| Samples | L* | a* | b* | ΔE00 (w.r.t Carbon Black) |
|---|---|---|---|---|
| Commercial Lignin 1 (CO2) | 53.59 ± 0.07 | 9.02 ± 0.01 | 25.94 ± 0.07 | 30.09 |
| Commercial Lignin 2 (Dilute Acid) | 29.05 ± 0.15 | 11.76 ± 0.05 | 17.39 ± 0.07 | 15.98 |
| Carbonized Lignin 1 | 22.81 ± 0.02 | 0.7 ± 0.02 | 1.73 ± 0.03 | 2.91 |
| Carbonized Lignin 2 | 22.86 ± 0.19 | 0.33 ± 0.03 | 0.66 ± 0.01 | 2.27 |
| Reference Carbon Black (ASTM D5098) | 25.77 ± 0.12 | 0.20 ± 0.02 | −0.17 ± 0.03 | 0.00 |
| Commercial Carbon Black | 10.01 ± 0.10 | 0.33 ± 0.09 | 1.88 ± 0.06 | 10.85 |
© Her Majesty the Queen in Right of Canada, as represented by the Minister of Natural Resources, 2018. Licensee MDPI, Basel, Switzerland. This article is an open access article distributed under the terms and conditions of the Creative Commons Attribution (CC BY) license (http://creativecommons.org/licenses/by/4.0/).
Share and Cite
Ajao, O.; Jeaidi, J.; Benali, M.; Restrepo, A.M.; El Mehdi, N.; Boumghar, Y. Quantification and Variability Analysis of Lignin Optical Properties for Colour-Dependent Industrial Applications. Molecules 2018, 23, 377. https://doi.org/10.3390/molecules23020377
Ajao O, Jeaidi J, Benali M, Restrepo AM, El Mehdi N, Boumghar Y. Quantification and Variability Analysis of Lignin Optical Properties for Colour-Dependent Industrial Applications. Molecules. 2018; 23(2):377. https://doi.org/10.3390/molecules23020377
Chicago/Turabian StyleAjao, Olumoye, Jawad Jeaidi, Marzouk Benali, Andrea M. Restrepo, Naima El Mehdi, and Yacine Boumghar. 2018. "Quantification and Variability Analysis of Lignin Optical Properties for Colour-Dependent Industrial Applications" Molecules 23, no. 2: 377. https://doi.org/10.3390/molecules23020377