1. Introduction
Osteoarthritis (OA), the most common degenerative joint disease worldwide found in elderly individuals, is a leading cause of physical disability. Type II collagen (CII) is a principal component of the extracellular matrix (ECM) and constitutes 90–95% of the total protein content in the articular cartilage [
1]. Repeated oral administrations of CII induce oral tolerance and inhibit the development of OA. The immunologic response to orally administered antigens occurs in the gut-associated lymphoid tissue (GALT), which is composed of epithelium, lamina propria, Peyer’s patch (PP), and mesenteric lymph nodes (MLN). Orally taken native CII antigens interact with PP in the GALT, resulting in turning off the T-cell attack to CII in the cartilage. This desensitization process in PP, also known as oral tolerance, avoids the recognition of endogenous CII in the cartilage as an antigen by the immune system [
2]. The effects of oral administration of CII obtained from chicken, bovine, and sheep sources have been evaluated for the treatment of arthritis [
3]. Chicken sternal cartilage containing a high amount of collagen is recognized as a potential source of CII [
4]. Naturally derived CII from chick sternal cartilage is thought to be a potential oral alternative for OA treatment.
Although the etiology and underlying mechanisms of OA are complicated, much evidence has suggested that the progression of OA in patients is significantly associated with oxidative stress and the inflammatory factor network [
5,
6].
Recently, oxidative stress has been one of the research hotspots in the field of OA. There is increasing evidence that oxidative stress due to chronic production of endogenous reactive oxygen species (ROS) plays an important role in the physiology and pathophysiology of OA. Oxidative stress regulates intracellular signaling processes and induces chondrocyte senescence and apoptosis, which is characterized by degradation of ECM and a decrease in the synthesis of proteoglycan and CII [
7]. Moreover, increased levels of ROS can damage DNA, including mitochondrial DNA, thereby affecting cell viability and contributing to the disruption of ECM homeostasis. Increased levels of ROS may also contribute to the senescent secretory phenotype and the reduced sensitivity of chondrocytes to insulin-like growth factor I (IGF-I) [
8].
Antioxidant properties should be evaluated by a variety of methods because most natural antioxidants are multifunctional. Several assays have been frequently used to estimate antioxidant capacities in natural antioxidants, including the 2,2′-Azinobis (3-ethylbenzothiazoline-6-sulphonic acid) diammonium salt (ABTS) assay, the 2,2-diphenyl-1-picrylhydrazyl (DPPH) assay, and the ferric-reducing antioxidant power (FRAP) assay [
9]. H
2O
2 is a common ROS produced in cellular metabolism. Intracellular steady-state concentrations of H
2O
2 above 1 μM cause oxidative stress that induces growth arrest and cell death. H
2O
2 induces chondrocyte apoptosis through the regulation of phosphatidylinositol 3-kinase (PI3K)/protein kinase B (Akt) and c-Jun N-terminal kinase (JNK) signaling pathways [
5]. In experimental models used to investigate oxidative stress responses of cells, or cytoprotection by antioxidant agents, cultured cells are often exposed to H
2O
2 added as a bolus into the culture medium [
10]. Therefore, the ABTS assay, DPPH assay, FRAP assay and an assay of cellular antioxidant activity (the protective effect of collagen peptides against H
2O
2-induced cellular oxidative damage in C518 cells) were performed to evaluate the antioxidant activity of collagen peptides.
Inflammation is another promoting factor in the OA process, including chondrocyte and synovium inflammation. The group of inflammatory cytokines is the most important group of compounds participating in the pathogenesis of OA. Among the many representatives of this group, the greatest importance is attributed to IL-1β, TNF-α, and PGE2, which have been shown to modulate ECM turnover, to accelerate the degradation of cartilage and to induce chondrocyte apoptosis in the development of OA [
6,
11].
IL-1β demonstrates potent bioactivities in inhibiting ECM synthesis and promoting cartilage breakdown [
12]. The matrix metalloproteinases (MMPs) play important roles in cartilage degradation in OA, and IL-1β significantly upregulates the expression of MMPs, aggravating degradation processes in OA [
13]. Moreover, it has been suggested that IL-1β induces the expression of the TNF-α gene in chondrocytes and upregulates the surface expression of the TNF receptor (TNFR) [
14]. The effect of TNF-α in most cases coincides with the action of IL-1β, and in the case of many phenomena occurring in the course of OA there is a marked synergism between the two cytokines. This effect is the result of activation of the same group of intracellular signaling pathways, which in turn triggers similar effects that increase the inflammation and catabolism in joint tissues [
6]. PGE2 is considered to be the major contributor to inflammatory pain in arthritic conditions. IL-1β has been shown to stimulate and produce high levels of PGE2 that may induce pain and degeneration with OA [
12]. Pharmacologic inhibitors to these mediators may potentially be used as biological treatments in the future. Accordingly, the protective effect of collagen peptides against lipopolysaccharide (LPS)-induced proinflammatory mediators IL-1β, TNF-α, and PGE2 in C518 cells was investigated.
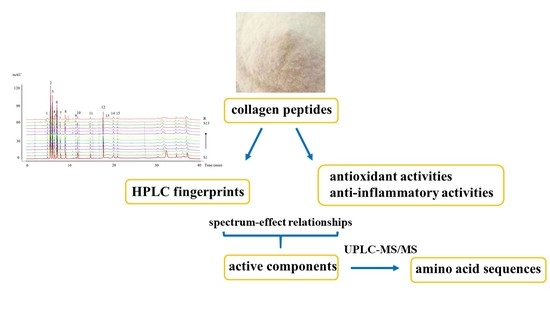
In virtue of the extreme complexity of collagen peptides, the components contributing to their effects are still unclear. Traditional methods for analysis of the active components of peptides are complex and time-consuming, and the spectrum-effect relationships of collagen peptides have not been reported. The aim of this study was to develop an efficient method for screening the active components of CII by establishing spectrum-effect relationships.
3. Materials and Methods
3.1. Materials
HPLC-grade acetonitrile was purchased from Tedia (Fairfield, OH, USA). Amino acid standards, ABTS, DPPH, 2,4,6-tripyridyl-s-triazine (TPTZ), LPS, CCK-8, rat IL-1β, PGE2, and the TNF-α ELISA kit were purchased from Sigma-Aldrich (St. Louis, MO, USA). Dulbecco’s Modified Eagle’s Medium (DMEM), fetal bovine serum (FBS), phosphate-buffered saline (PBS), and 1% penicillin/streptomycin were bought from Gibco (Carlsbad, CA, USA). The synthesized peptides (purity ≥ 95%) were obtained from Bankpeptide Biological Technology Co., Ltd. (Hefei, China). Other reagents were of analytical grade.
3.2. Preparation of Collagen Peptides
Collagen peptide was prepared according to the methods reported by Xie with some modifications [
22]. Fresh chicken sternal cartilage was removed from the periosteum and the calcified portion, cut into slices, minced into paste, and stored at −20 °C. Then, the paste was treated with 5 M guanidine hydrochloride in Tris-HCl (0.05 M, pH 7.5) at a sample/solution ratio of 1:10 (
w/
v), with gentle stirring for 24 h at 4 °C to remove proteoglycans [
29]. The precipitate was washed using Tris-HCl (0.05 M, pH 7.5) and acetic acid (0.5 M). In the enzymatic hydrolysis process of collagen peptides, the four parameters including the enzyme (papain) to substrate ratio (E/S: 0.25%, 0.50%, and 0.75%
w/
w), pH (6.0, 6.5, and 7.0), temperature (50, 55, and 60 °C) and time (4, 5, and 6 h), were investigated in single-factor experiments (
Table 9). At the end of the enzymatic hydrolysis, the solution was heated in a boiling water bath for 10 min to inactivate the enzymes. The extracts were collected by centrifugation (Avanti J-26XP, Beckman Coulter, Brea, CA, USA) at 10,000×
g for 30 min at 4 °C. The supernatant was collected and salted out overnight at 4 °C by adding 2.5 M NaCl in Tris-HCl (0.05 M, pH 7.5) at a ratio of 1:20 (
w/
v). The resulting precipitate was collected by centrifugation (Avanti J-26XP, Beckman Coulter, USA) at 10,000×
g for 20 min at 4 °C. Subsequently, the precipitate was dissolved with acetic acid (0.1 M) and allowed to reach dialysis equilibrium with NaCl (0.2 M). The dialysate was freeze-dried and referred to as “collagen peptides”.
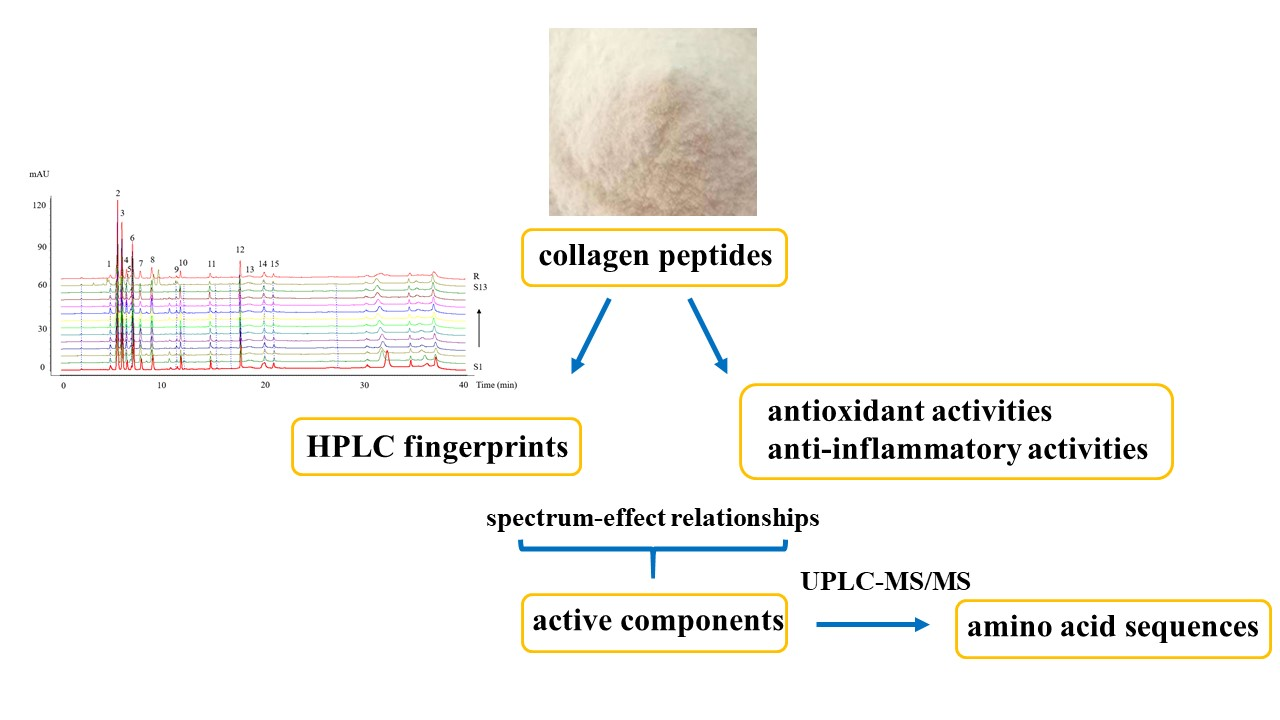
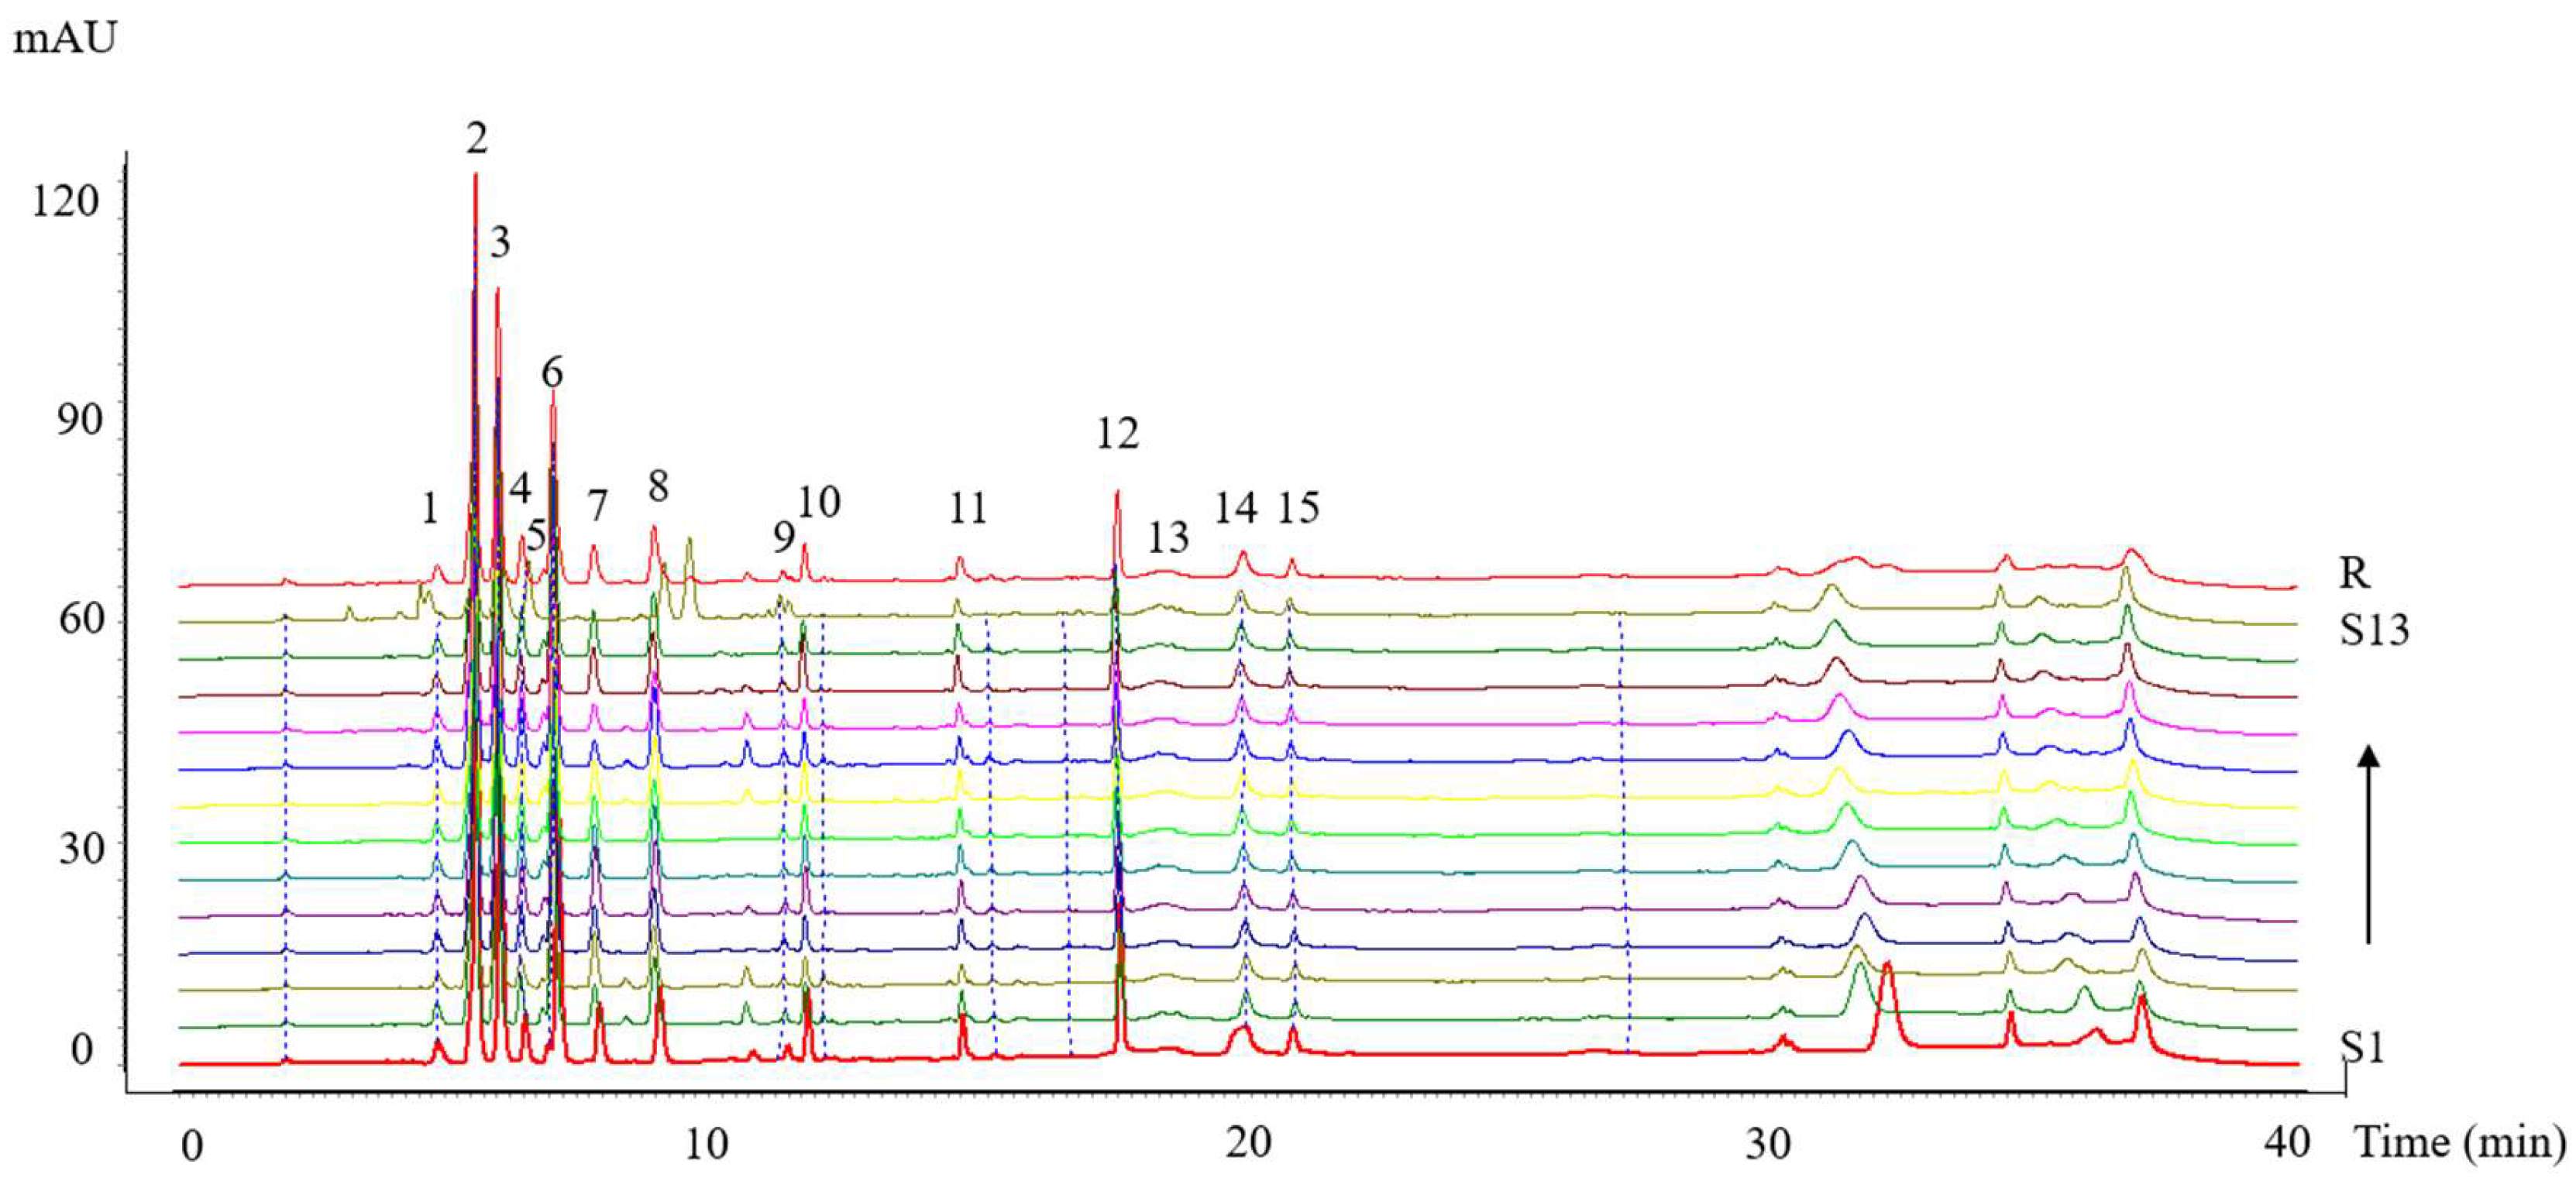
3.3. HPLC Fingerprints
3.3.1. HPLC Conditions
Chromatographic analyses of collagen peptides were performed using a Shimadzu LC-20A HPLC system (Kyoto, Japan), including a quaternary solvent delivery system, online degasser, autosampler manager, column compartment and diode-array detector (DAD), as well as LCsolution software. The HPLC operating conditions were as follows: The column was an Inertsil ODS-SP C18 column (4.6 × 250 mm, 5 μm). A binary gradient elution system, comprising buffer (A) 0.05% TFA/acetonitrile and buffer (B) 0.1% TFA/water, was applied as follows: Initial, 98% B; 30 min, 40% B; 30.01 min, 98% B; 40 min, 98% B. The detection wavelength was set at 214 nm, the flow rate was 0.8 mL/min, the column temperature was maintained at 40 °C, the sample temperature was ambient, and the injection volume was 10 μL.
3.3.2. Preparation of the Sample Solution
Collagen peptides were dissolved in deionized water at a concentration of 10 mg/mL and then filtered through a 0.22 μm micropore film to yield the sample solution.
3.3.3. Analysis of HPLC Fingerprints
Validation of Methodology
The chromatographic fingerprinting methodology was validated to assess its precision, repeatability, and stability. Precision was evaluated by the analysis of six injections of the same testing sample consecutively. Repeatability was examined by determination of six different samples prepared from the same collagen peptide sample. Stability was examined by analysis of the sample solution at 0, 2, 4, 6, 8, 12, and 24 h. The methodology validation showed that the relative standard deviation (RSD) for precision was in the range of 1.28–1.75%, whereas that of reproducibility was less than 1.18% and that of storage stability was 1.46–1.83%. All results indicated that the HPLC fingerprint analysis method was valid and satisfactory.
Similarity Analysis
The HPLC fingerprints were matched automatically using the Similarity Evaluation System for Chromatographic Fingerprint of Traditional Chinese Medicine software developed by the Chinese Pharmacopoeia Committee (Version 2012) (Beijing, China). The reference fingerprint was generated using the median method [
30], after which the similarity values between the reference fingerprint and the entire chromatographic profiles of 13 batches of collagen peptides were calculated.
3.4. Amino Acid Composition
Amino acid composition of collagen peptides was determined according to the method of Sun with a slight modification [
31]. A high-performance liquid chromatography equipped with a PICO.TAG column (Waters, Milford, MA, USA) was used. The amino acid composition of collagen peptides was determined after hydrolysis at 150 °C for 1 h with 6 M hydrochloric acid prior to derivatization with phenyl isothiocyanate. A binary gradient elution system, comprising (A) 0.1 M ammonium acetate (the pH was adjusted to 6.5 with acetic acid)/acetonitrile (93:7 ratio) and (B) 80% acetonitrile/water, was applied as follows: Initial, 0% B; 15 min, 15% B; 18 min, 24% B; 25 min, 40% B; 30 min, 40% B; 30.01 min, 100% B; 40 min, 100% B. The amino acid standards included
l-alanine (Ala),
l-arginine (Arg),
l-aspartic acid (Asp),
l-glutamic acid (Glu),
l-glycine (Gly),
l-histidine (His), hydroxylysine (HyL), hydroxyproline (HyP),
l-isoleucine (Ile),
l-leucine (Leu),
l-lysine (Lys),
l-methionine (Met),
l-phenylalanine (Phe),
l-proline (Pro),
l-serine (Ser),
l-threonine (Thr),
l-tyrosine (Tyr), and
l-valine (Val).
3.5. Molecular Weight Distribution
Molecular weight distribution of collagen peptides was determined by gel permeation chromatography on a Superdex Peptide HR 10/300 GL (10 × 300 mm, Amersham Biosciences Co., Piscataway, NJ, USA) with UV detection at 214 and 280 nm. The mobile phase was 5 mM phosphate buffer containing 10 mM NaCl (pH 7.4), at a flow rate of 0.5 mL/min, which corresponded to an operating pressure of 1.8 MPa. A molecular weight calibration curve was obtained from the following standards: Glycine trimer (189 Da), oxidized glutathione (612 Da), vitamin B12 (1355 Da), aprotinin (6500 Da), cytochrome C (12500 Da), and bovine serum albumin (66430 Da) (Sigma Co., St. Louis, MO, USA). UNICORN 5.0 software (Amersham Biosciences Co., Piscataway, NJ, USA) was used to analyze the chromatographic data.
3.6. Antioxidant Activity Determination
3.6.1. ABTS Assay
The ABTS assay was conducted following the method of Arnao with some modifications [
32]. The stock solutions included 7.0 mM ABTS
+ solution and 2.45 mM K
2S
8O
2 solution. The working solution was prepared by mixing the two stock solutions in equal quantities and allowing them to react for 12 h at room temperature in the dark. Before analysis, this stock solution was diluted with PBS to obtain an absorbance of 0.70 ± 0.02 at 734 nm. Next, 100 μL samples were allowed to react with 2 mL ABTS·
+ solution in the dark. After 6 min, the absorbance was recorded at 734 nm. Results were determined using the following Equation (1):
where A
sample and A
blank are the absorbance of the test sample and blank sample, respectively.
3.6.2. DPPH Assay
The DPPH assay was performed according to the method of Brand–Williams with some modifications [
33]. First, 1 mL of 0.2 mM DPPH solution was added to an equal volume of the sample solution. The mixture was vortexed for a few seconds and incubated for 30 min at room temperature, after which the absorbance of the mixture was measured at 517 nm. Results were calculated according to the following Equation (2):
where A
sample and A
blank are the absorbance of the test sample and blank sample, respectively.
3.6.3. FRAP Assay
The FRAP assay was performed according to the methods reported by Benzie with some modifications [
34]. The FRAP solution was prepared by mixing 10 volumes of acetate buffer (300 mM, pH 3.6) with 1 volume of TPTZ (10 mM dissolved in 40 mM HCl) and 1 volume of FeCl
3·6H
2O (20 mM in water). Next, 200 μL of the sample were allowed to react with 2 mL FRAP solution in the dark for 30 min at 37 °C, and the absorbance of the sample was recorded at 593 nm. Aqueous standard solutions of FeSO
4·7H
2O (100–1000 μM) were used to generate a calibration curve. The final results were expressed as millimole FeSO
4·7H
2O equivalents per gram of collagen peptides (mM FeSO
4·7H
2O/g, collagen peptides).
3.6.4. In Vitro H2O2-Induced Oxidative Damage Model
Cell Lines and Culture
C518 cells were purchased from Saiqi Biological Engineering Co., Ltd. (Shanghai, China). C518 cells were cultured and maintained in DMEM supplemented with 10% FBS, 100 U/mL penicillin, and 100 μg/mL streptomycin at 37 °C under a humidified atmosphere containing 5% CO2.
Protective Effects of Collagen Peptides against H2O2-Induced Oxidative Stress
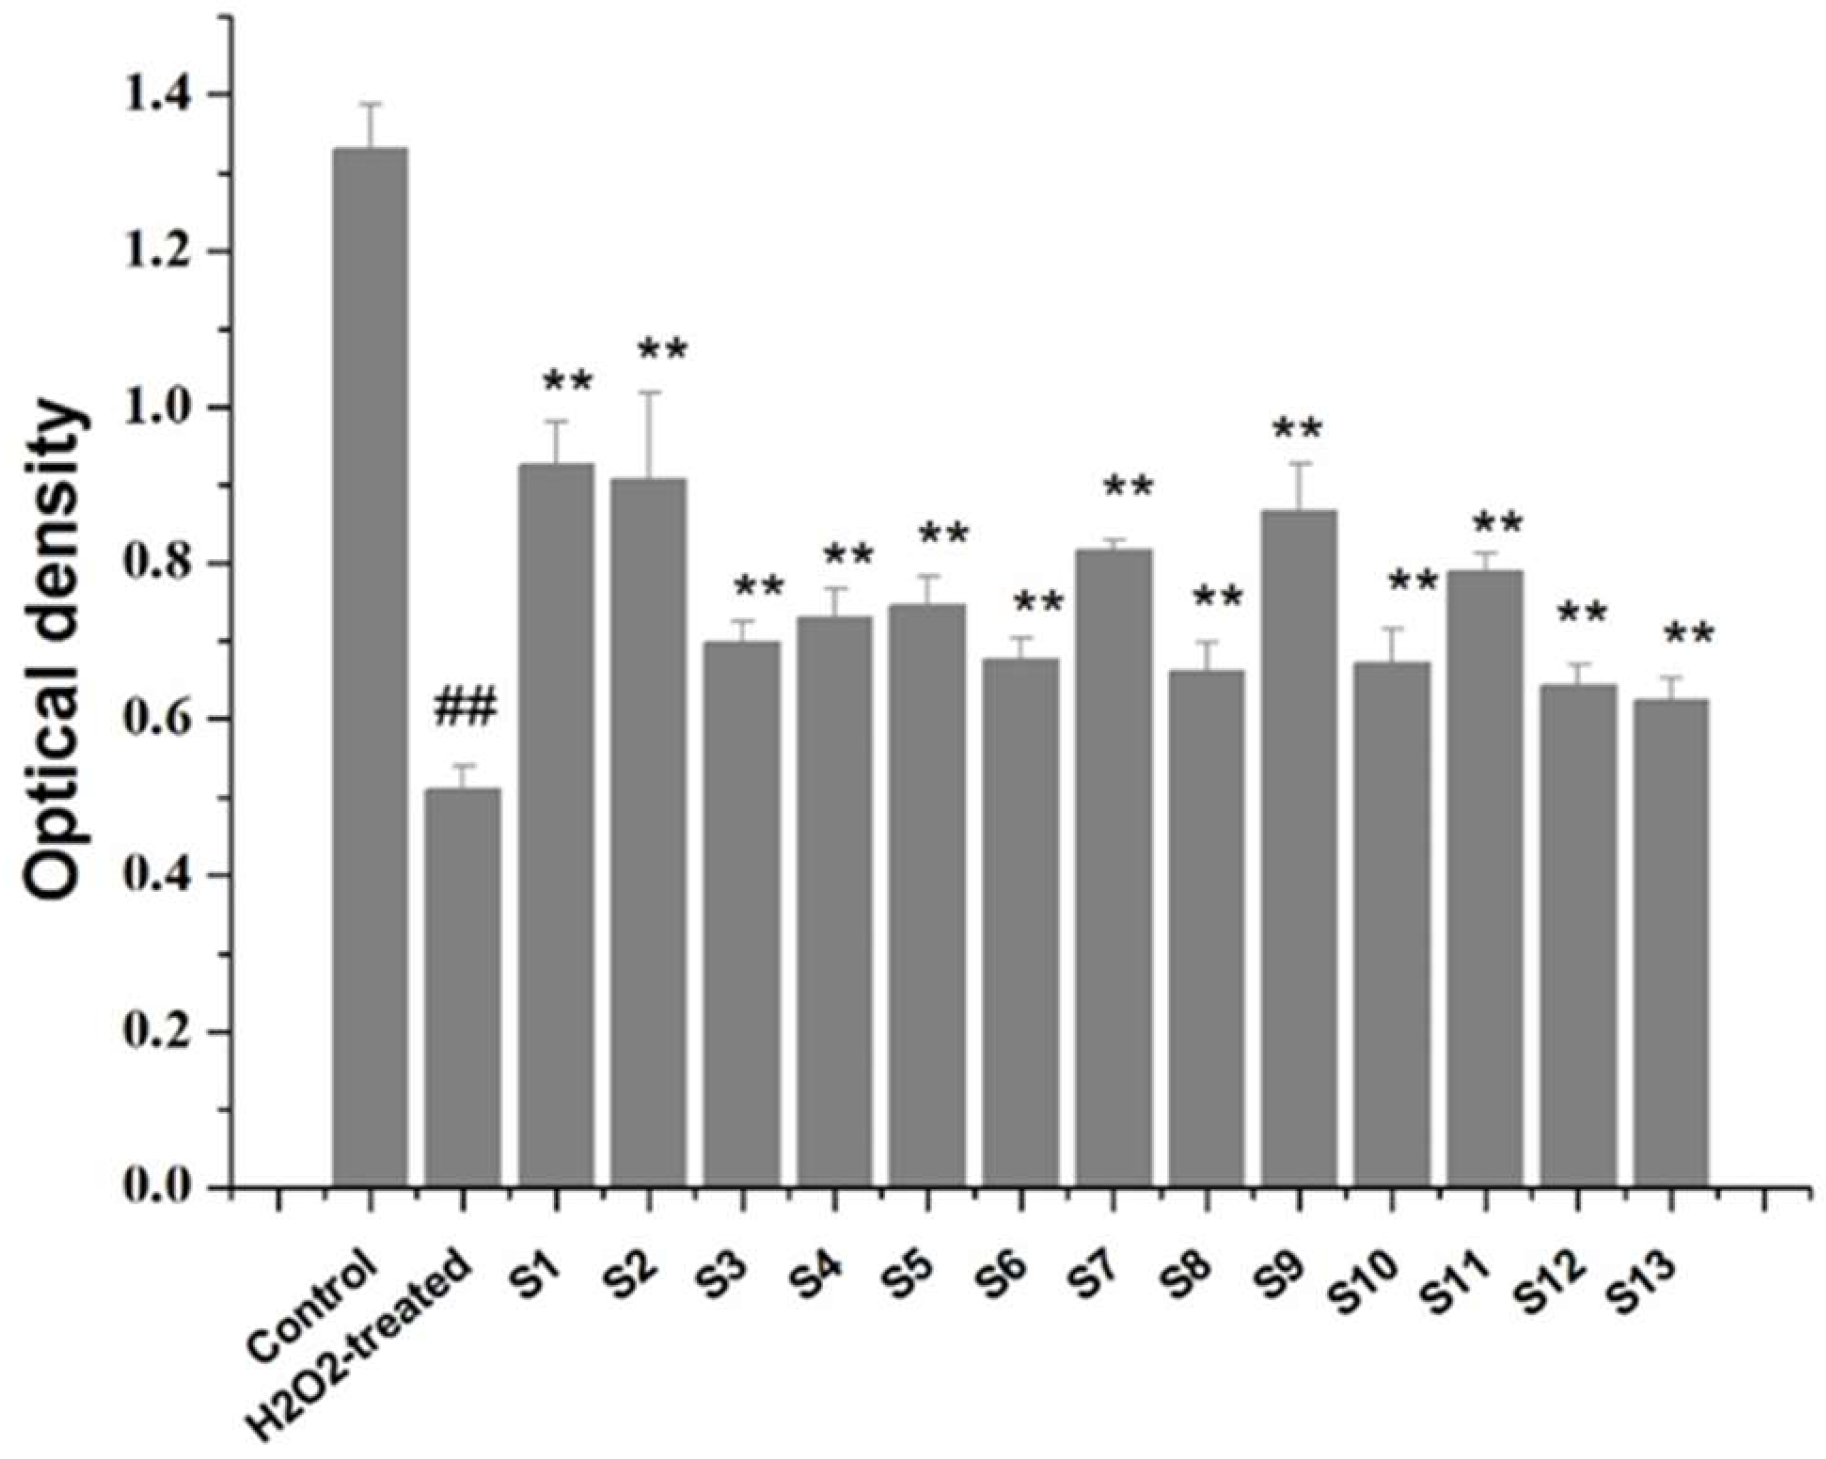
C518 cells were seeded in 96-well plates (2 × 10⁴ cells/mL, 100 µL) and incubated for 24 h. They were pretreated with various collagen peptide samples (1.0 mg/mL) and cultured for 30 min. The control was pretreated with DMEM under the same conditions. Thereafter C518 cells were exposed to H2O2 (1 mM) in the presence or absence of collagen peptides for 24 h. Finally, cell viability was determined using the CCK-8 assay.
3.7. Anti-Inflammatory Activity Determination
C518 cells were seeded in 96-well plates (2 × 10⁴ cells/mL, 100 µL) and incubated for 24 h. They were pretreated with various collagen peptide samples (2.0 mg/mL) and cultured for 1 h. The control was pretreated with DMEM under the same conditions. Thereafter C518 cells were exposed to LPS (10 μg/mL) in the presence or absence of collagen peptides for 24 h. Finally, the abundance of IL-1β, PGE2, and TNF-α in cell-free supernatants was determined using ELISA kits according to the manufacturer’s instructions.
3.8. Spectrum-Effect Relationships
The spectrum-effect relationships between HPLC fingerprints and antioxidant and anti-inflammatory effects were established by GRA. Grey system theory is an interdisciplinary scientific area that was first introduced in the early 1980s [
35], and it has been applied in decision making in an extremely wide range of multiple-attribute group decision-making problems [
36].
3.8.1. Data Preprocessing
In GRA, initial data preprocessing is performed to transform the original data sequences, with different measurement units, into comparable sequences. In this study, the mean value normalization preprocessing method was applied in the data series treatment to obtain a dimensionless matrix, because this method can easily accommodate a wide range of units among the factors used [
37].
3.8.2. Definition of Reference Sequences and Comparison Sequences
The antioxidant and anti-inflammatory activities of the collagen peptides were utilized as reference sequences, and the characteristic peak areas obtained by HPLC fingerprints were utilized as comparison sequences. The original reference sequences and comparison sequences are represented by {Xo(k)} and {Xi(k)}, i = 1, 2, …, m; k = 1, 2, …, n respectively, where m is the number of experiments and n is the total number of observations of data.
3.8.3. Grey Relational Grade Calculation
The grey relational coefficient was calculated from the deviation sequence using the following relation:
where Δ
oi(
k) is the deviation sequence of the reference sequence {
Xo(
k)} and comparability sequence {
Xi(
k)}, and ξ is the resolution coefficient, usually ξ ∈ (0,1). The resolution coefficient is typically chosen to be 0.5. A grey relational grade is the weighted average of the grey relational coefficient and is defined as follows:
3.8.4. Grey Relational Coefficient Calculation and Ranking
The grey relational grade between the reference sequence and comparison sequences was calculated. The grey relational grade was proportional to the similarity of the developing trends (i.e., the greater the grade, the more similarity) [
38].
3.9. Purification and Identification of Collagen Peptides
3.9.1. Purification of Collagen Peptides by RP-HPLC
The collagen peptide was dissolved in distilled water and loaded onto a semipreparative C18 RP-HPLC column (10.0 mm × 250 mm, 5 μm, Agilent Technologies, Santa Clara, CA, USA). The HPLC 1200 system (Agilent Technologies, USA) was equipped with a quaternary pump solvent delivery system and a diode-array detector (DAD). The sample injection volume and concentration were 250 μL and 10 mg/mL, respectively. The column was eluted by a linear gradient of acetonitrile (2–60%) containing 0.1% TFA at a flow rate of 1.0 mL/min. The UV absorbance of the eluent was monitored at 214 nm. This step was repeated several times, and the different elution fractions were pooled, concentrated, and lyophilized for sequence identification.
3.9.2. Identification of Collagen Peptides by UPLC-MS/MS Analysis
A Waters Acquity UPLC system (Waters, Milford, MA, USA) coupled with a Thermo Q Exactive mass spectrometer (Thermo Fisher Scientific, Bremen, Germany) was used for peptide separation and identification. The UPLC-MS/MS operating conditions were as follows: The column was an Eksigent C18 trap column (75 µm × 250 mm, 3 μm). A binary gradient elution system, comprising (A) 0.1% TFA/acetonitrile and (B) 0.1% TFA/water, was applied as follows: Initial, 90% B; 60 min, 40% B. The detection wavelengths were 214 and 280 nm, the flow rate was 3.0 μL/min, the freeze-dried sample was dissolved in 0.1% aqueous formic acid, and the injection volume was 1.0 μL. The mass spectrometer was fitted with an electrospray ionization (ESI) source used in the positive ion mode.
3.10. Statistical Analysis
All assays were carried out using at least three independent sets of experiments, and all results were expressed as average values with their corresponding standard deviations. One-way analysis of variance by Tukey’s test was performed using SPSS 22.0 (IBM Co., Armonk, NY, USA).


