Article

Determination of Enantiomeric Excess by Solid-Phase Extraction Using a Chiral Metal-Organic Framework as Sorbent

1
Department of Chemistry, Yunnan Normal University, Kunming 650500, China
2
College of Pharmaceutical Science, Yunnan University of Traditional Chinese Medicine, Kunming 650500, China
3
Institute of Quality Standards and Testing Technology, Yunnan Academy of Agricultural Sciences, Kunming 650224, China
*
Author to whom correspondence should be addressed.
Molecules 2018, 23(11), 2802; https://doi.org/10.3390/molecules23112802
Submission received: 17 August 2018 / Revised: 20 October 2018 / Accepted: 22 October 2018 / Published: 29 October 2018
(This article belongs to the Special Issue Solid Phase Extraction: State of the Art and Future Perspectives)

Abstract

:
Metal-organic frameworks (MOFs) have recently attracted considerable attention because of their fascinating structures and intriguing potential applications in diverse areas. In this study, we developed a novel method for determination of enantiomeric excess (ee) of (±)-1,1′-bi-2-naphthol by solid-phase extraction (SPE) using a chiral MOF, [Co(l-tyr)]n(l-tyrCo), as sorbent. After optimization of the experimental conditions, a good linear relationship between the ee and the absorbance of the eluate (R2 = 0.9984) was obtained and the standard curve was established at the concentration of 3 mmol L1. The ee values of (±)-1,1′-bi-2-naphthol samples can be rapidly calculated using the standard curve after determination of the absorbance of the eluate. The method showed good accuracy, with an average error of 2.26%, and is promising for ee analysis.

Graphical Abstract

1. Introduction

Optical purity is important in many industries, particularly in the development and production of pharmaceuticals. In general, one enantiomer of chiral drugs is safe and effective, while the other is may be ineffective or even toxic [1]. Consequently, the determination of enantiomeric excess (ee) of chiral compounds is very important. At present, chiral chromatographic methods, such as high performance liquid chromatography (HPLC) and gas chromatography (GC) using chiral stationary phases (CSPs), are most commonly used to determine ee values. However, these methods have some drawbacks, such as the high cost of chiral columns and long analysis times. Therefore, the development of simple and fast methods for ee analysis has great value. A number of techniques for rapid ee analysis have been developed, including circular dichroism [2,3], UV and colorimetric methods [4,5], fluorescence spectroscopy [6,7], mass spectrometry [8], and molecularly imprinted polymer based assays [9].
Solid-phase extraction (SPE) is a valuable sample pretreatment technique that enables concentration and purification of analytes from complex matrices. It has been widely used for its simplicity, rapidity, low cost, and compatibility with different detection techniques in both on-line and off-line modes [10,11]. The adsorbent is the core in SPE. High enrichment efficiency and selectivity of SPE are particularly dependent on the adsorbent. Thus, development of novel and efficient adsorbents for SPE is an ongoing research interest.
Metal-organic frameworks (MOFs) are an emerging class of crystalline porous materials that combine metal nodes with organic linkers through coordination bonds [12,13]. MOFs have attracted considerable attention in recent years because of their fascinating structures and outstanding properties, such as permanent nanoscale porosity, high surface area, good chemical stability, rich topology, and tunable pore size. These unique features make MOFs attractive as advanced media for separation [14,15], gas adsorption and storage [16,17], catalysis [18,19], sensing [20,21], imaging [22], and other applications. To date, a number of MOFs, such as MIL-53 [23,24], MIL-100 [23], MIL-101 [23,25,26], MOF-199 [27,28], ZIF-8 [29,30], ZIF-67 [31], ZIF-90 [32], MIL-88B [33], MAF-X8 [34], MOF-5 [35], UIO-66 [36], and UIO-67 [37], have been used as adsorbents for SPE or solid-phase microextraction (SPME) and shown much promise [14,38,39].
The chiral 3D MOF, [Co(l-tyr)]n(l-tyrCo), composed of metal dimers (CoII) linked via l-tyrosine ligand (Figure 1a) [40]. In this paper, we report the determination of ee values of (±)-1,1′-bi-2-naphthol (Figure 1b) by SPE using [Co(l-tyr)]n(l-tyrCo) as the adsorbent. The experimental results showed that the ee values of (±)-1,1′-bi-2-naphthol were linearly correlated with the absorbance of the eluates, and a standard curve could be established for ee analysis. The ee values of (±)-1,1′-bi-2-naphthol samples can be rapidly measured using the standard curve by determining the absorbance of the eluates after SPE. The method has advantages that include of good accuracy, low cost, simple operation, and suitability for batch analysis.

2. Results and Discussion

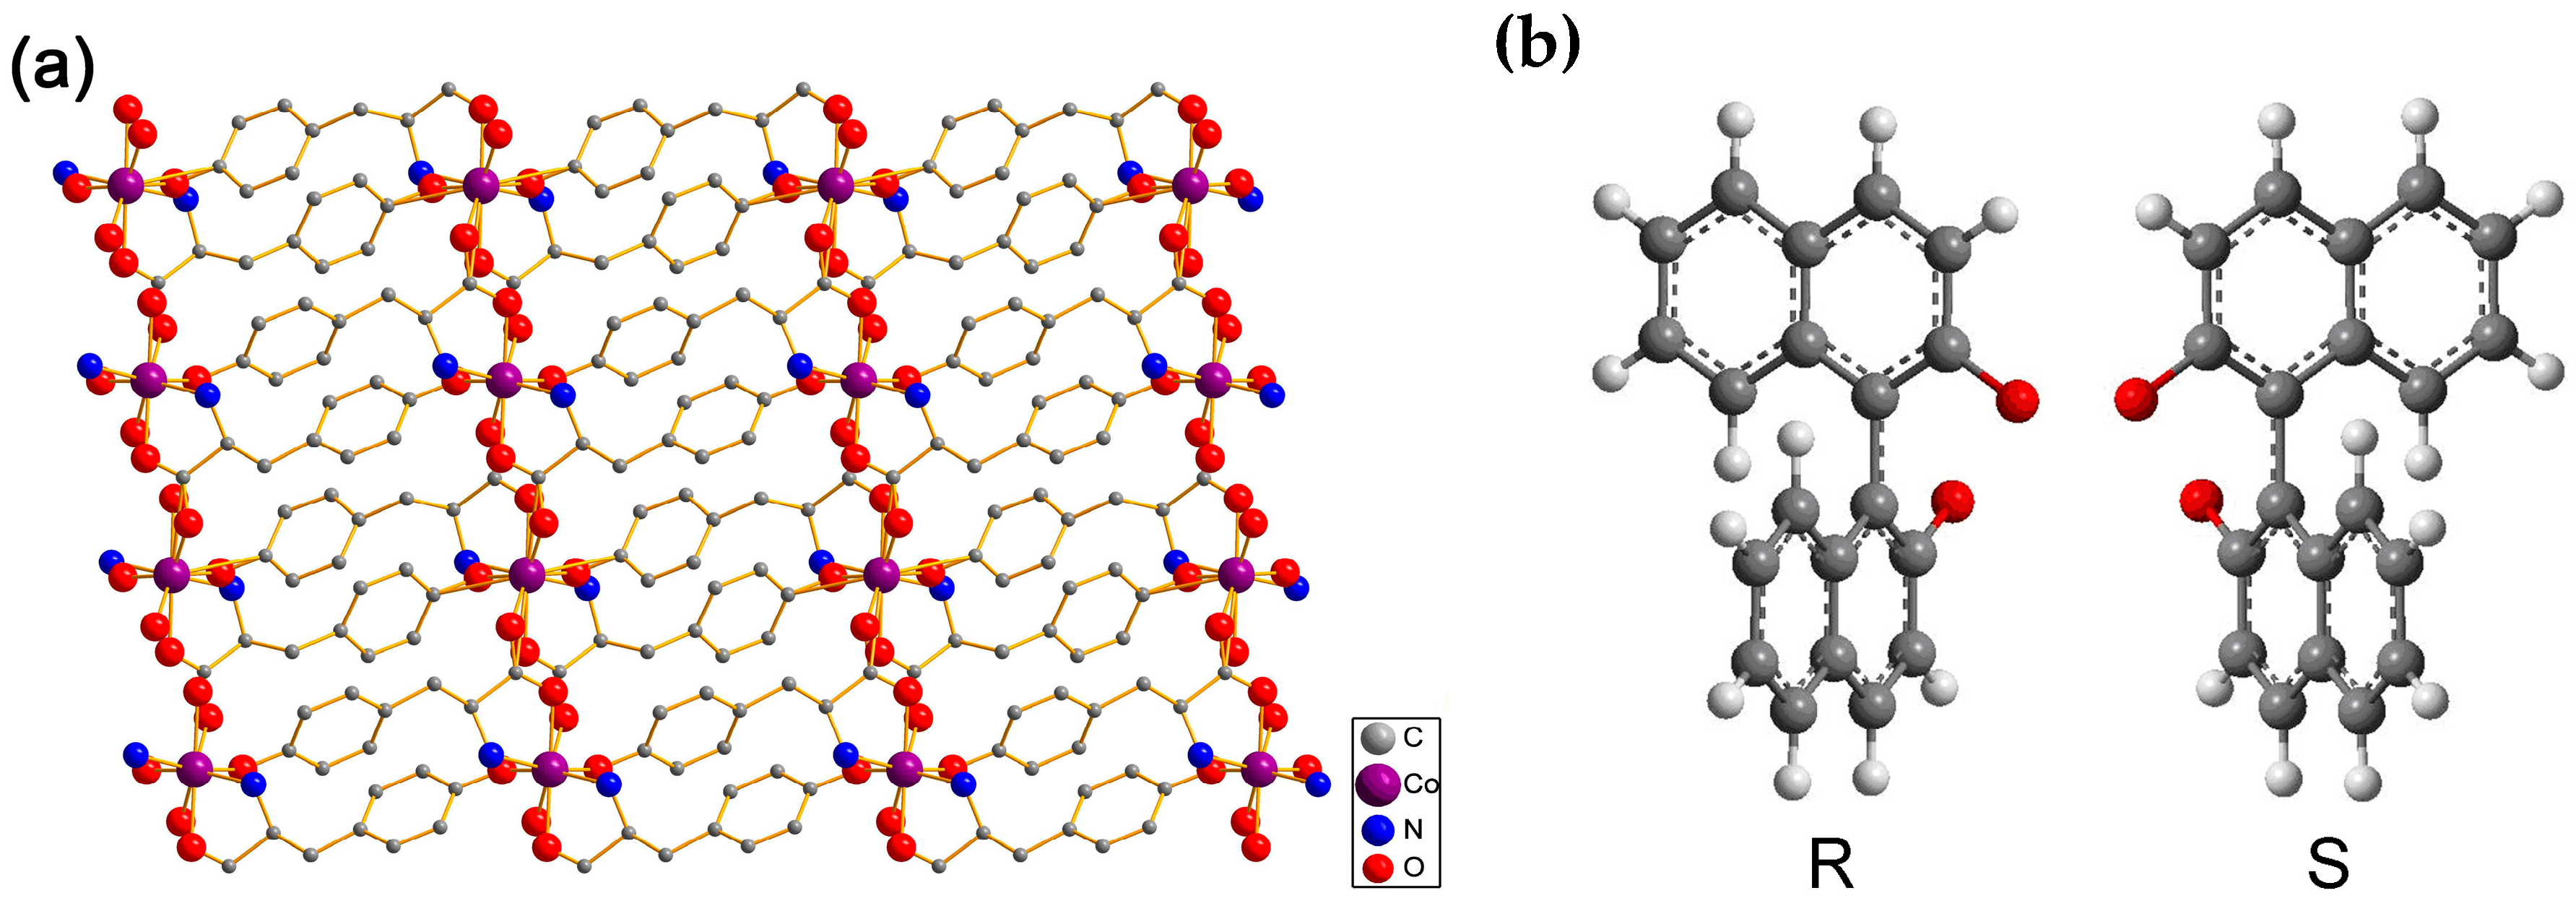
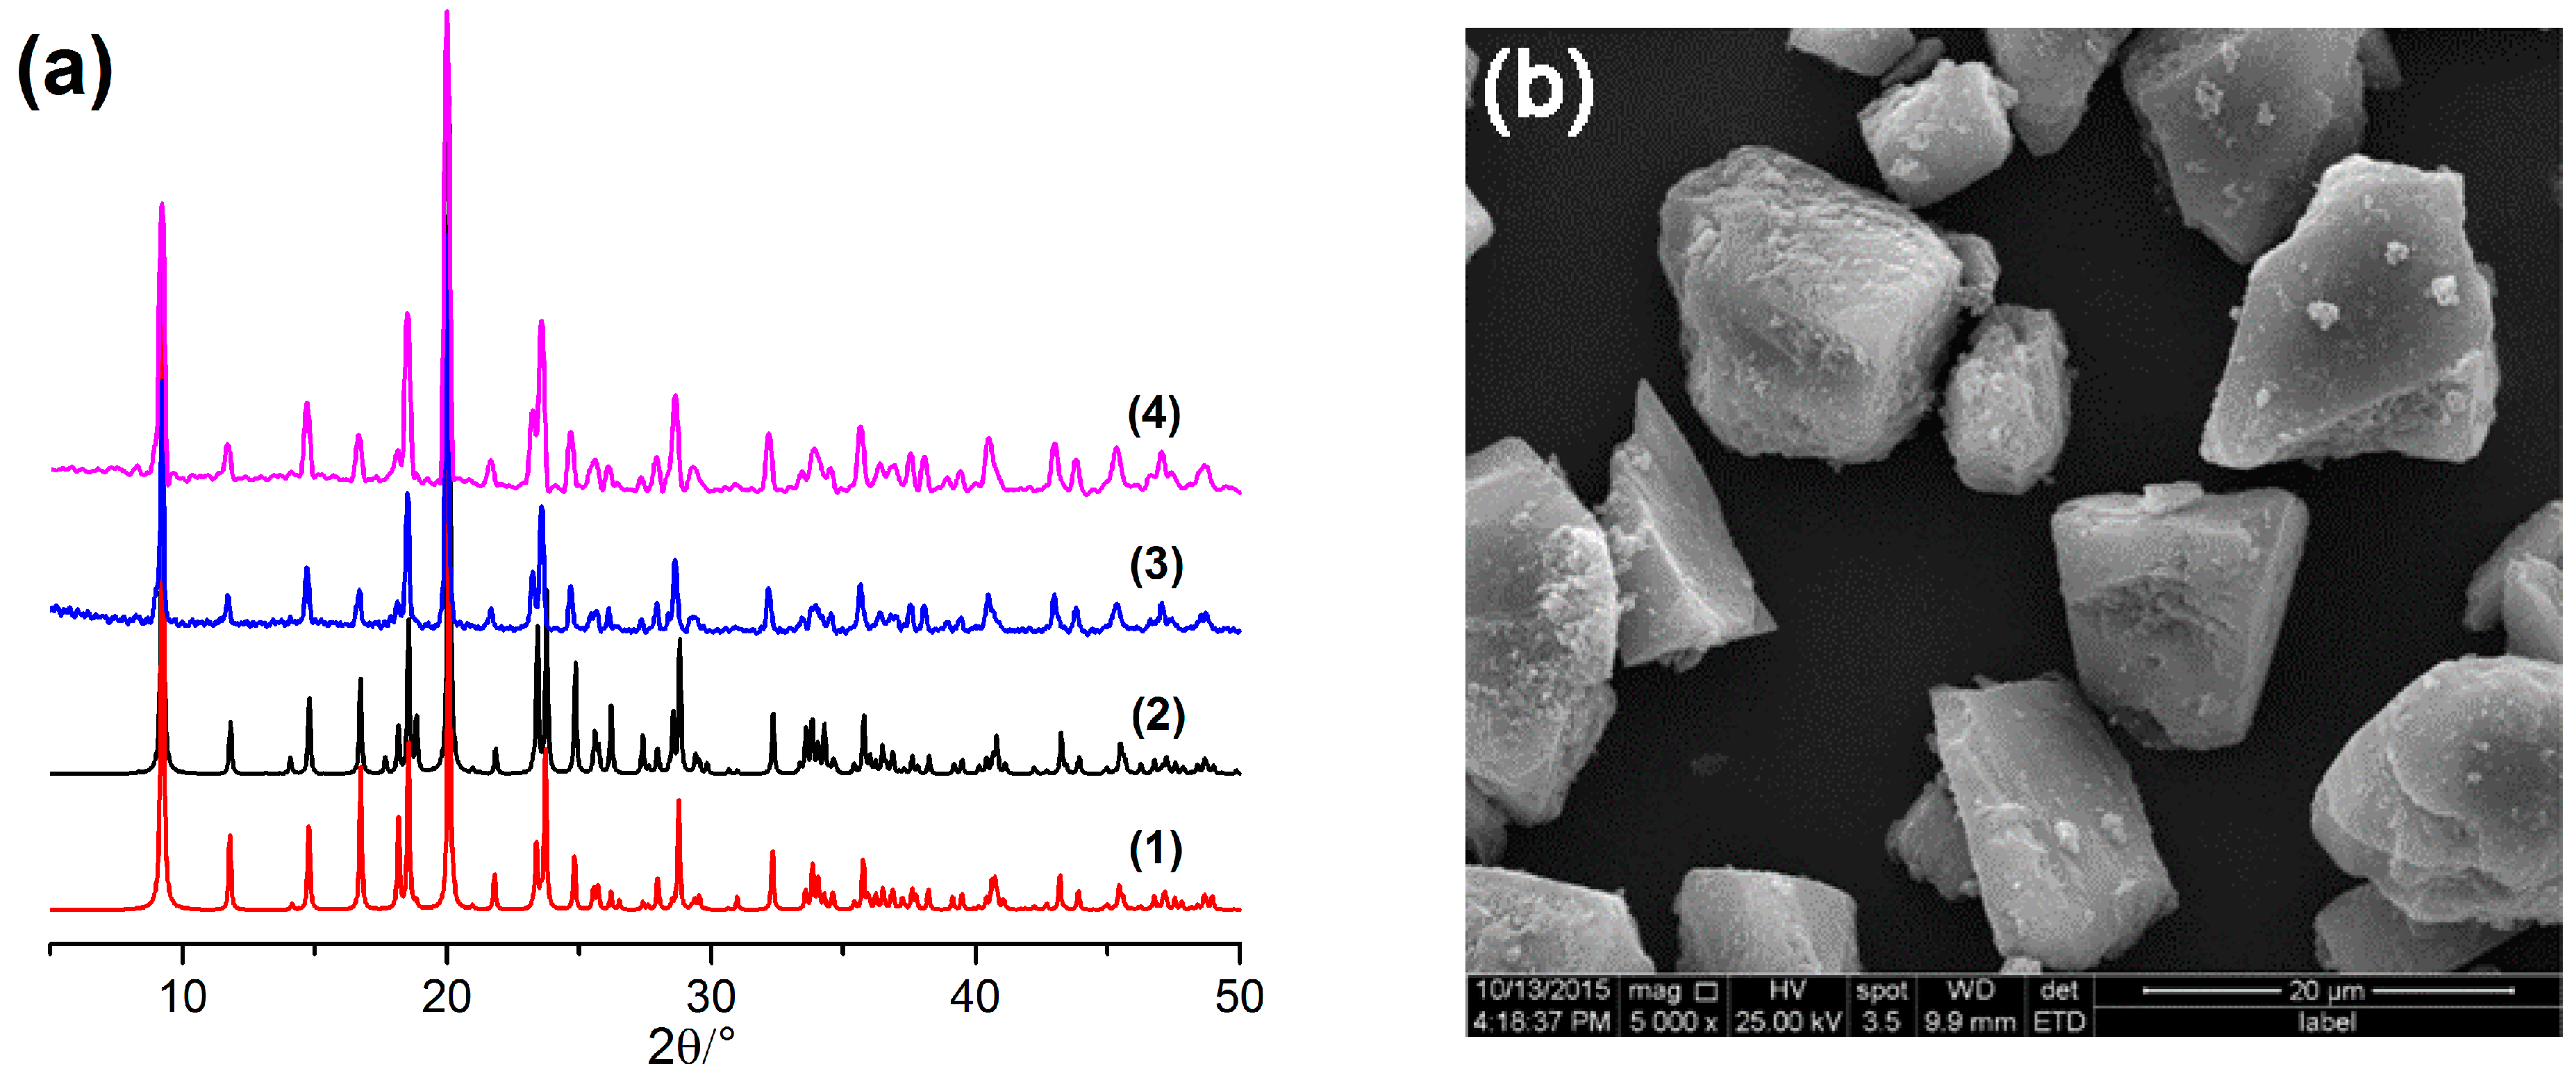
2.1. Characterization of the Synthesized [Co(l-tyr)]n(l-tyrCo)

The synthesized [Co(l-tyr)]n(l-tyrCo) was characterized by powder X-ray diffraction (PXRD). As shown in Figure 2a, the experimental PXRD pattern of the synthesized [Co(l-tyr)]n(l-tyrCo) crystals was in good agreement with that simulated from single crystal data, indicating successful synthesis. After several extraction experiments and soaking in a large volume of methanol and n-hexane/isopropanol (70/30, v/v) for 48 h, the PXRD pattern was not significantly changed, suggesting good stability of the MOF, and that it would not be dissolved during the experiments Figure 2a, (3) and (4). The scanning electron microscopy (SEM) image showed the selected crystals of [Co(l-tyr)]n(l-tyrCo) with an average size of about 10 μm (Figure 2b).

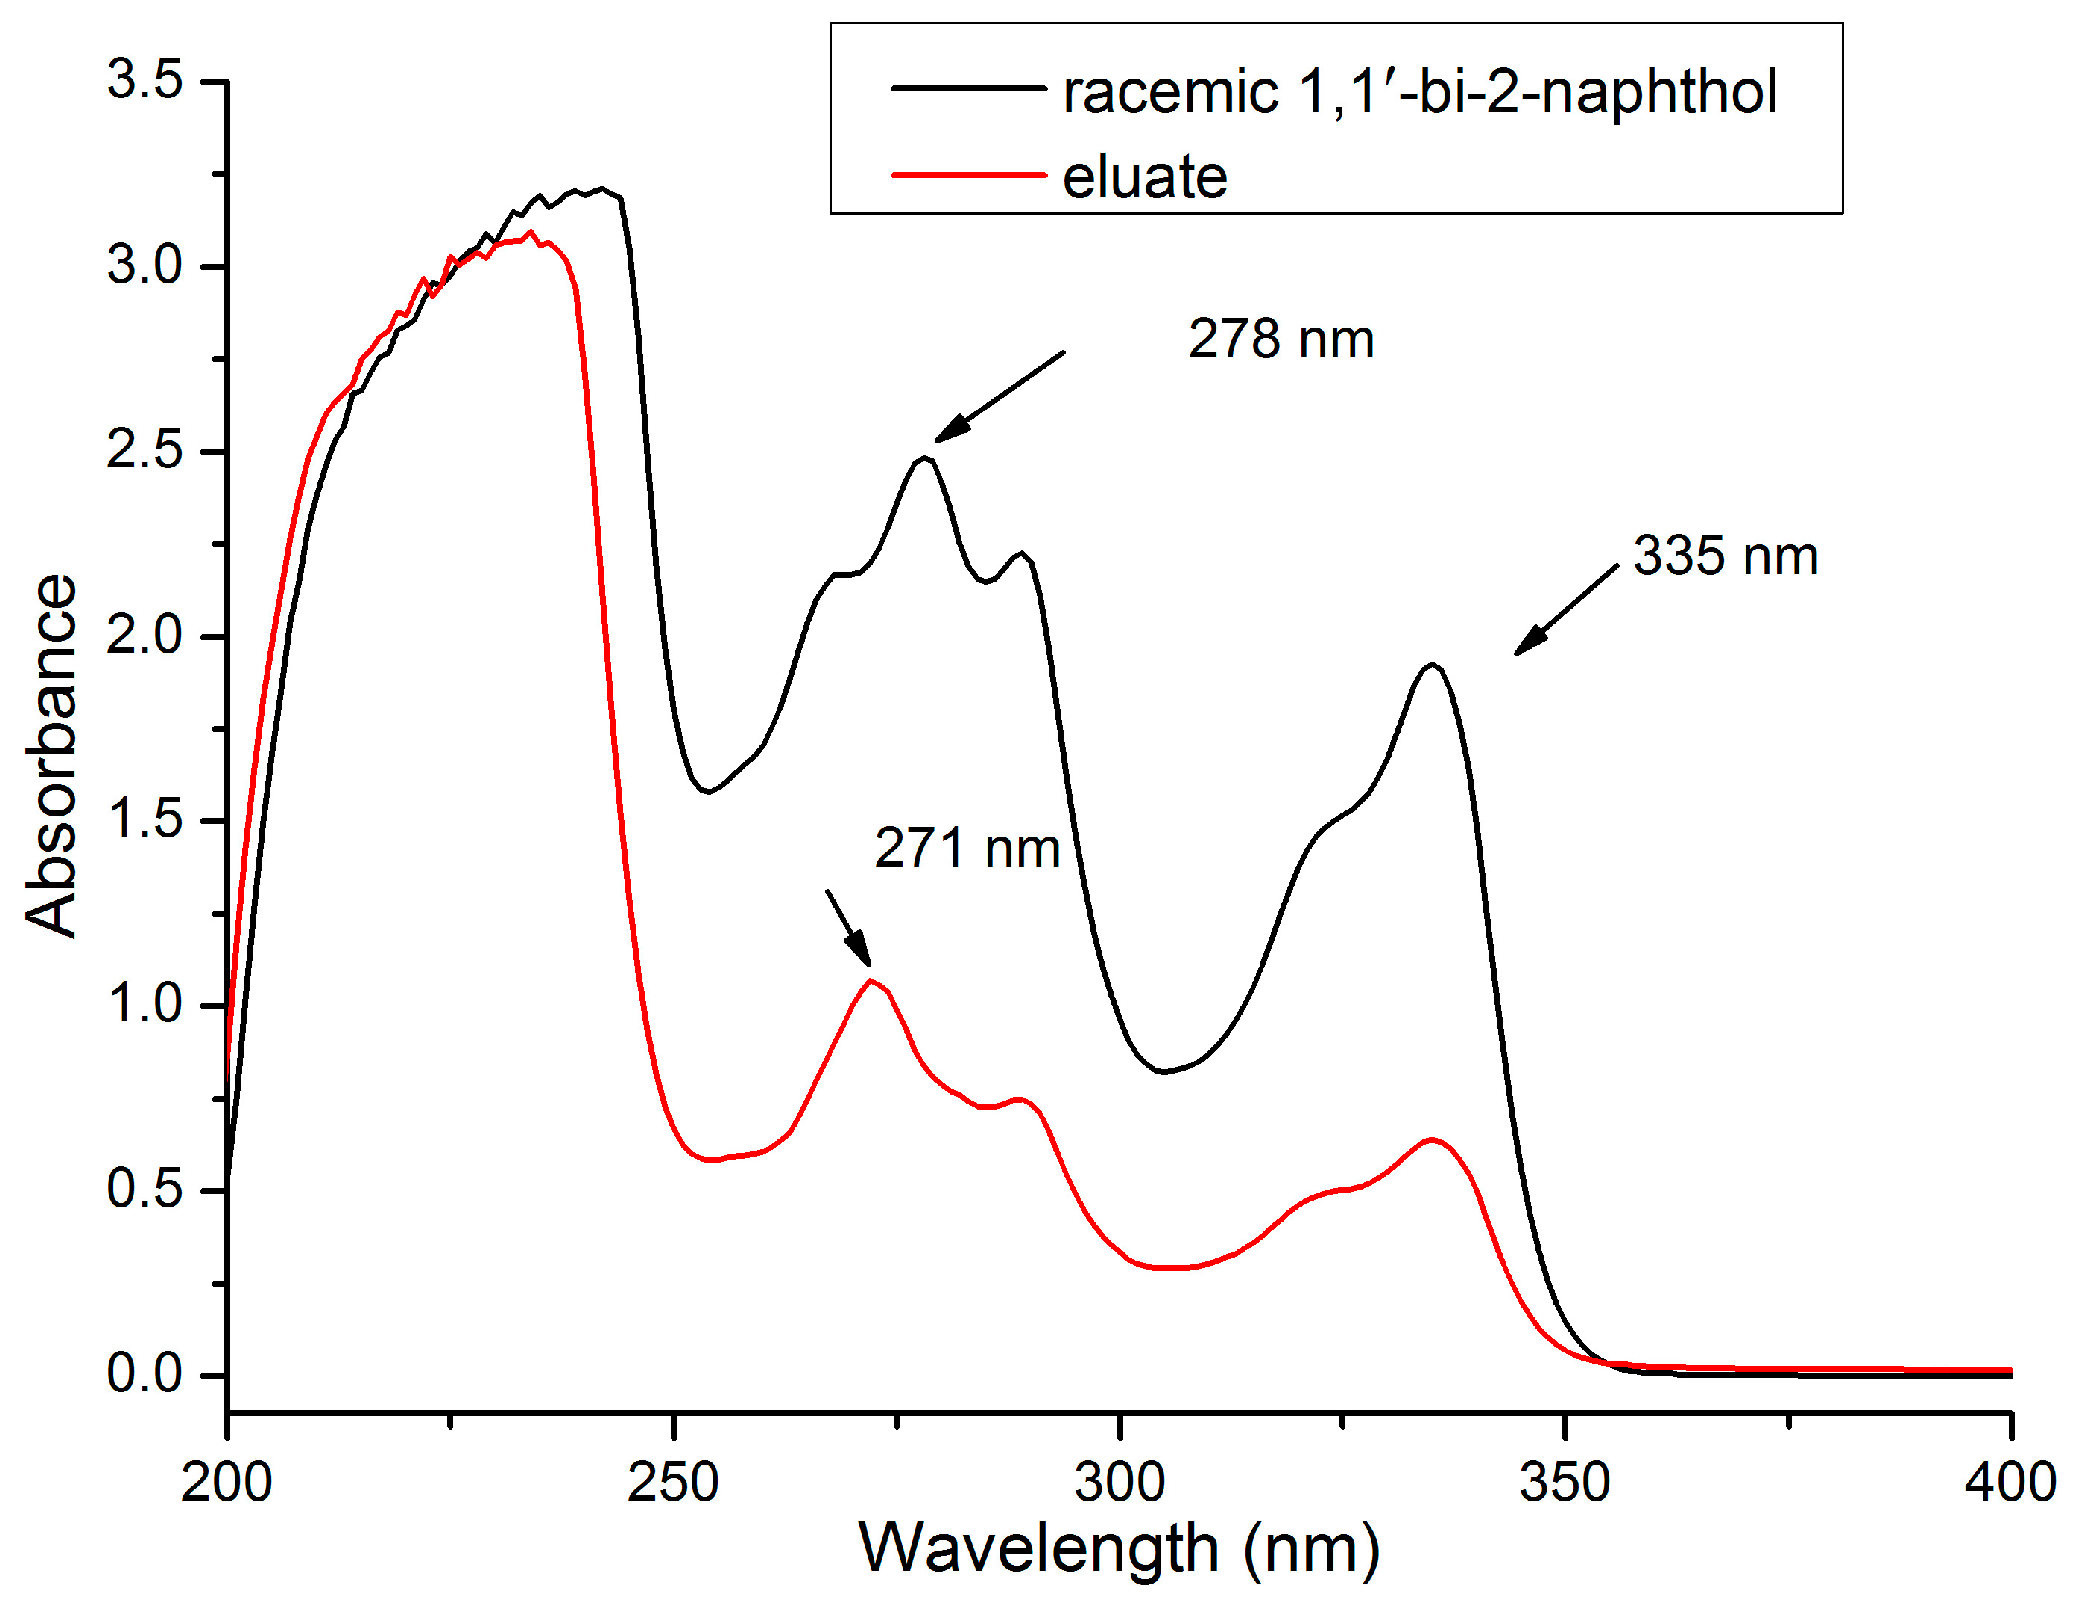
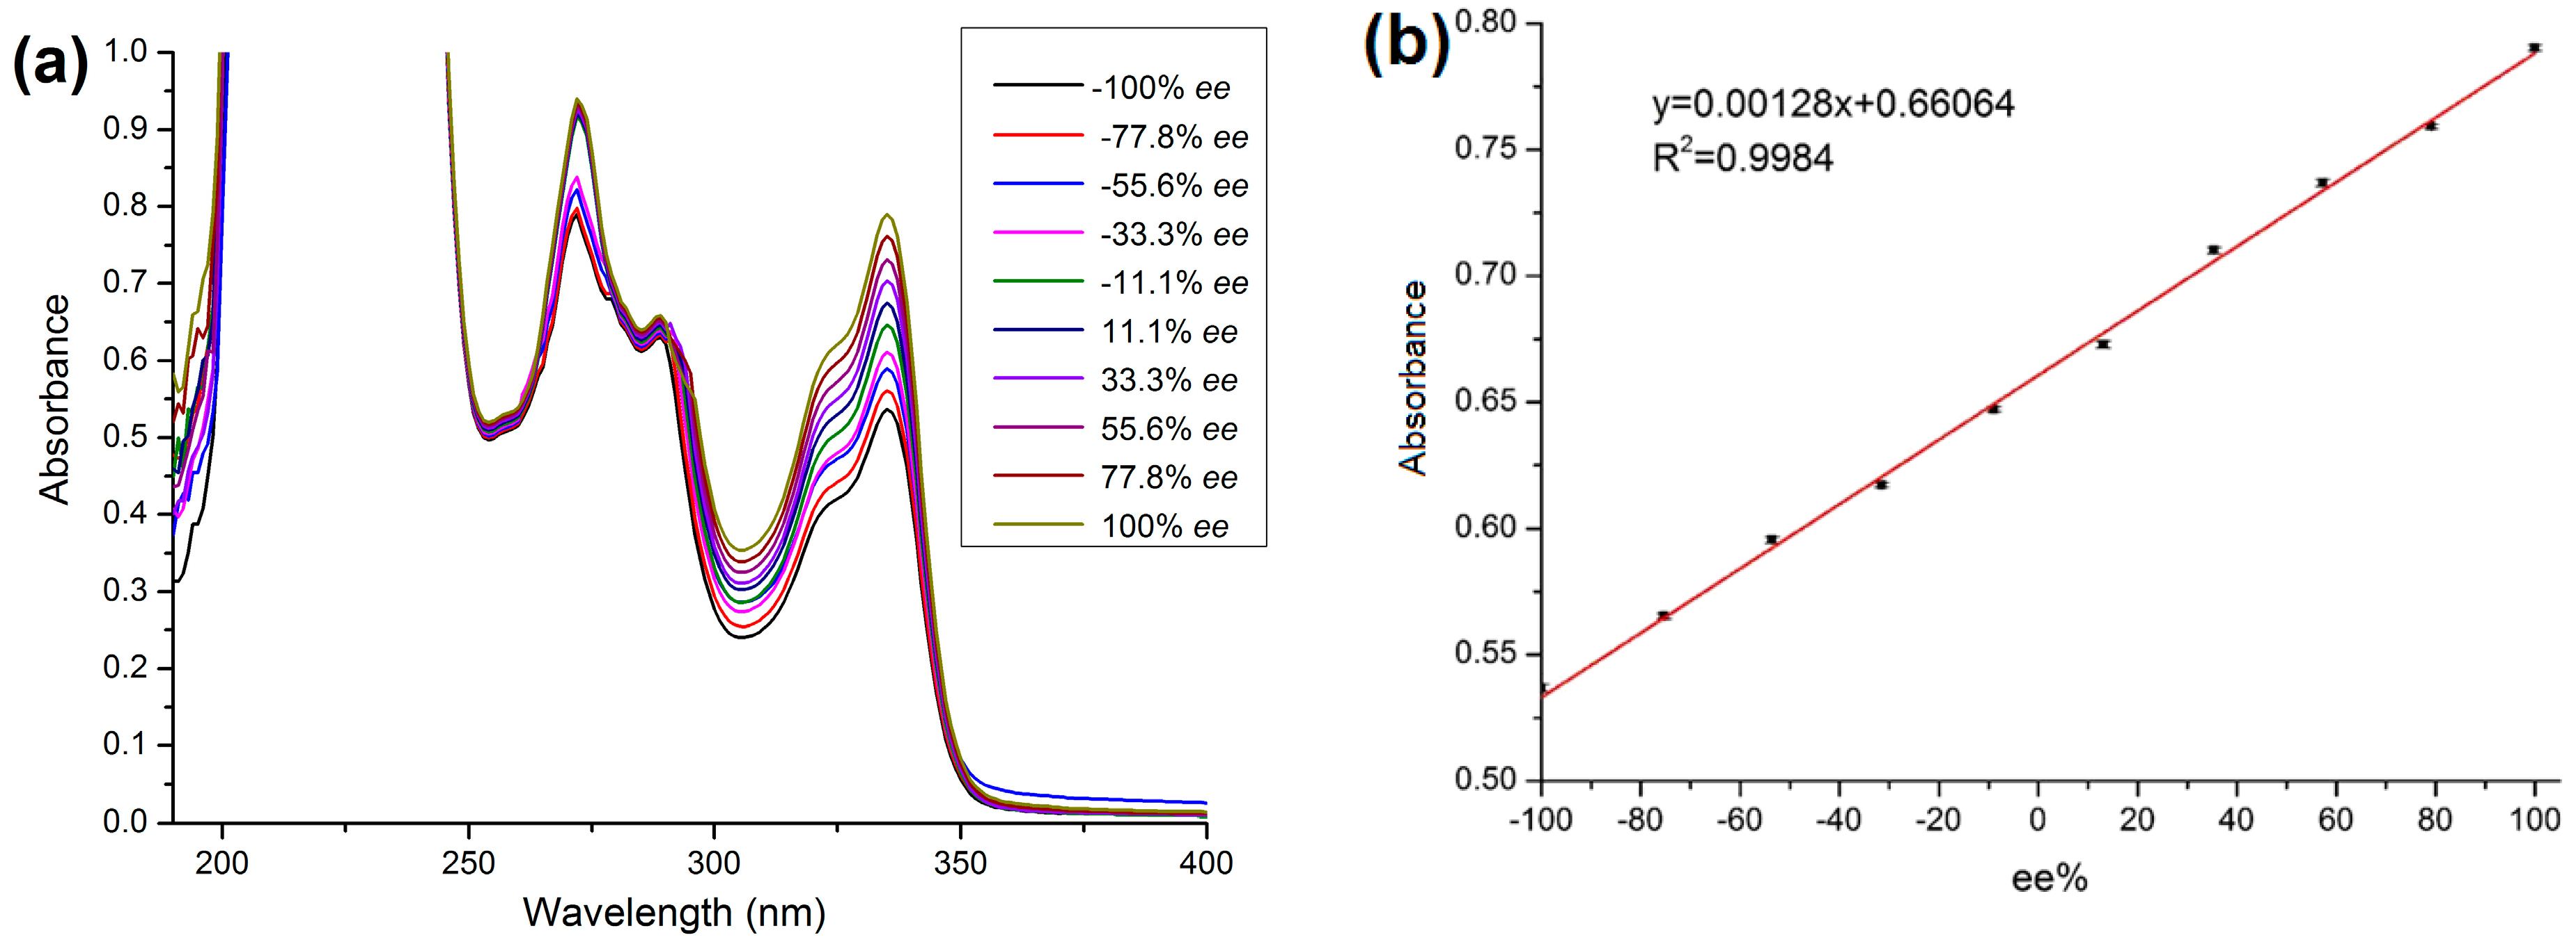
2.2. Selection of UV Wavelength for Analysis of Eluate

To obtain the highest sensitivity, the optimum UV absorption wavelength of the analyte should be determined. The UV-visible absorption spectrum of (±)-1,1′-bi-2-naphthol in methanol was measured over 200–400 nm. As can be seen in Figure 3, the solution of (±)-1,1′-bi-2-naphthol showed strong absorptions at 278 and 335 nm. In principle, both of these wavelengths could be used to determine the absorbance of the eluate. However, some impurities in the eluent absorbed at around 271 nm, which would affect the accuracy of the experimental result. In contrast, impurities in the eluent had relatively low absorption at 335 nm, so this wavelength was used in subsequent experiments.

2.3. Optimization of SPE Conditions

The sorption of (±)-1,1′-bi-2-naphthol on a SPE cartridge packed with [Co(l-tyr)]n(l-tyrCo) can be influenced by many experimental conditions, such as solvent composition, sample solution volume, analyte concentration, and the type and volume of eluent. To obtain good extraction efficiency, these parameters were optimized.

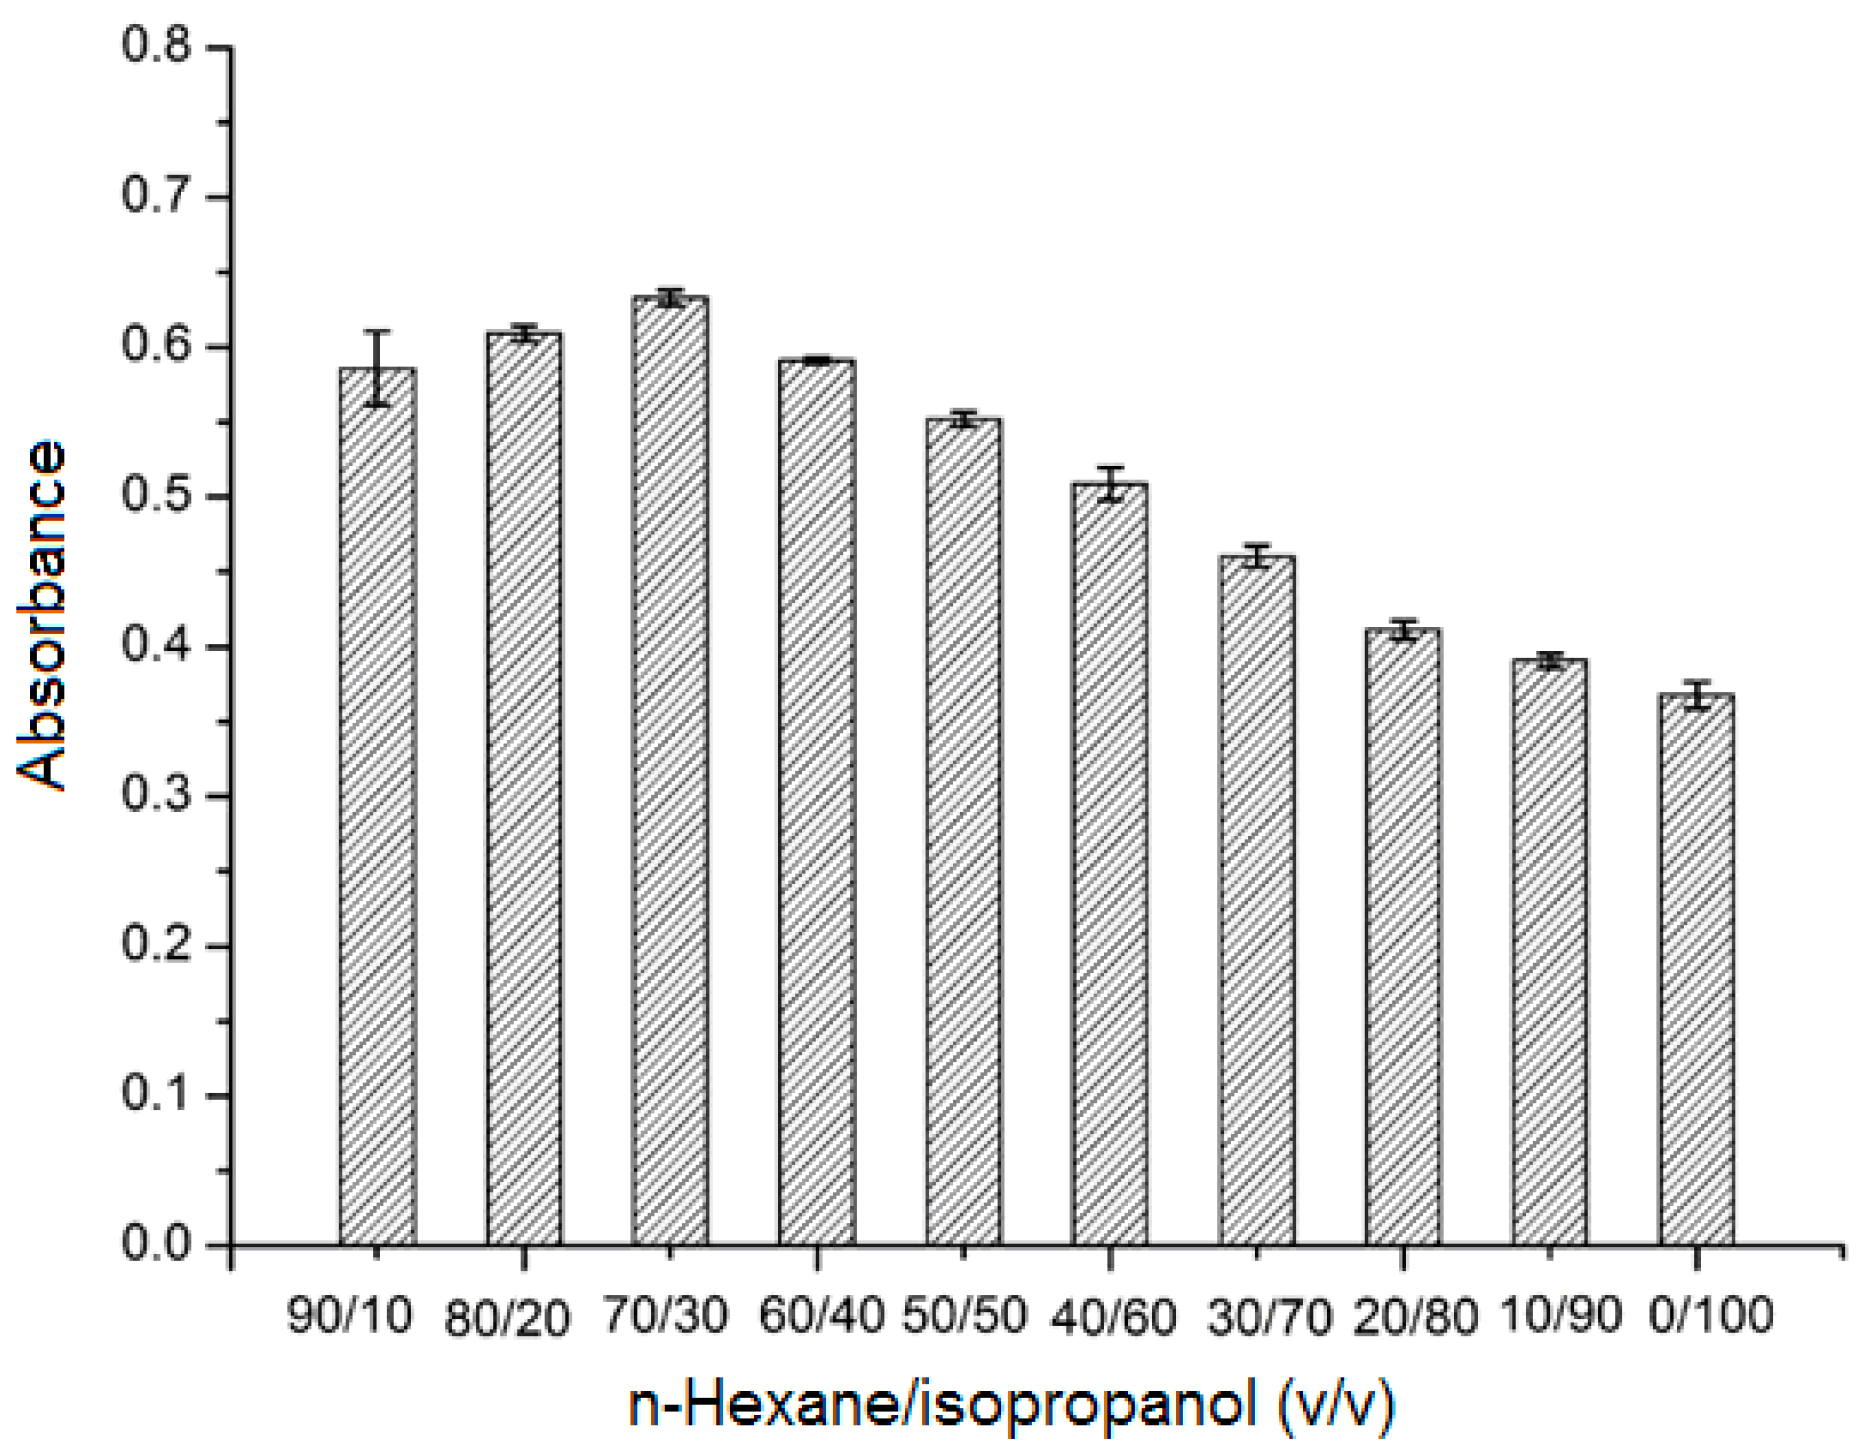
2.3.1. Effect of Sample Solvent Composition

The sample solvent composition will influence adsorption of the analyte on SPE adsorbent. In this study, (±)-1,1′-bi-2-naphthol was dissolved in mixtures of n-hexane/isopropanol mixtures at different ratios (90/10, 80/20, 70/30, 60/40, 50/50, 40/60, 30/70, 20/80, 10/90, and 0/100; v/v). As can be seen in Figure 4, the maximum absorbance of the eluate was obtained when using n-hexane/isopropanol = 70/30 (v/v) as solvent. This solvent mixture was therefore chosen for the following experiments.

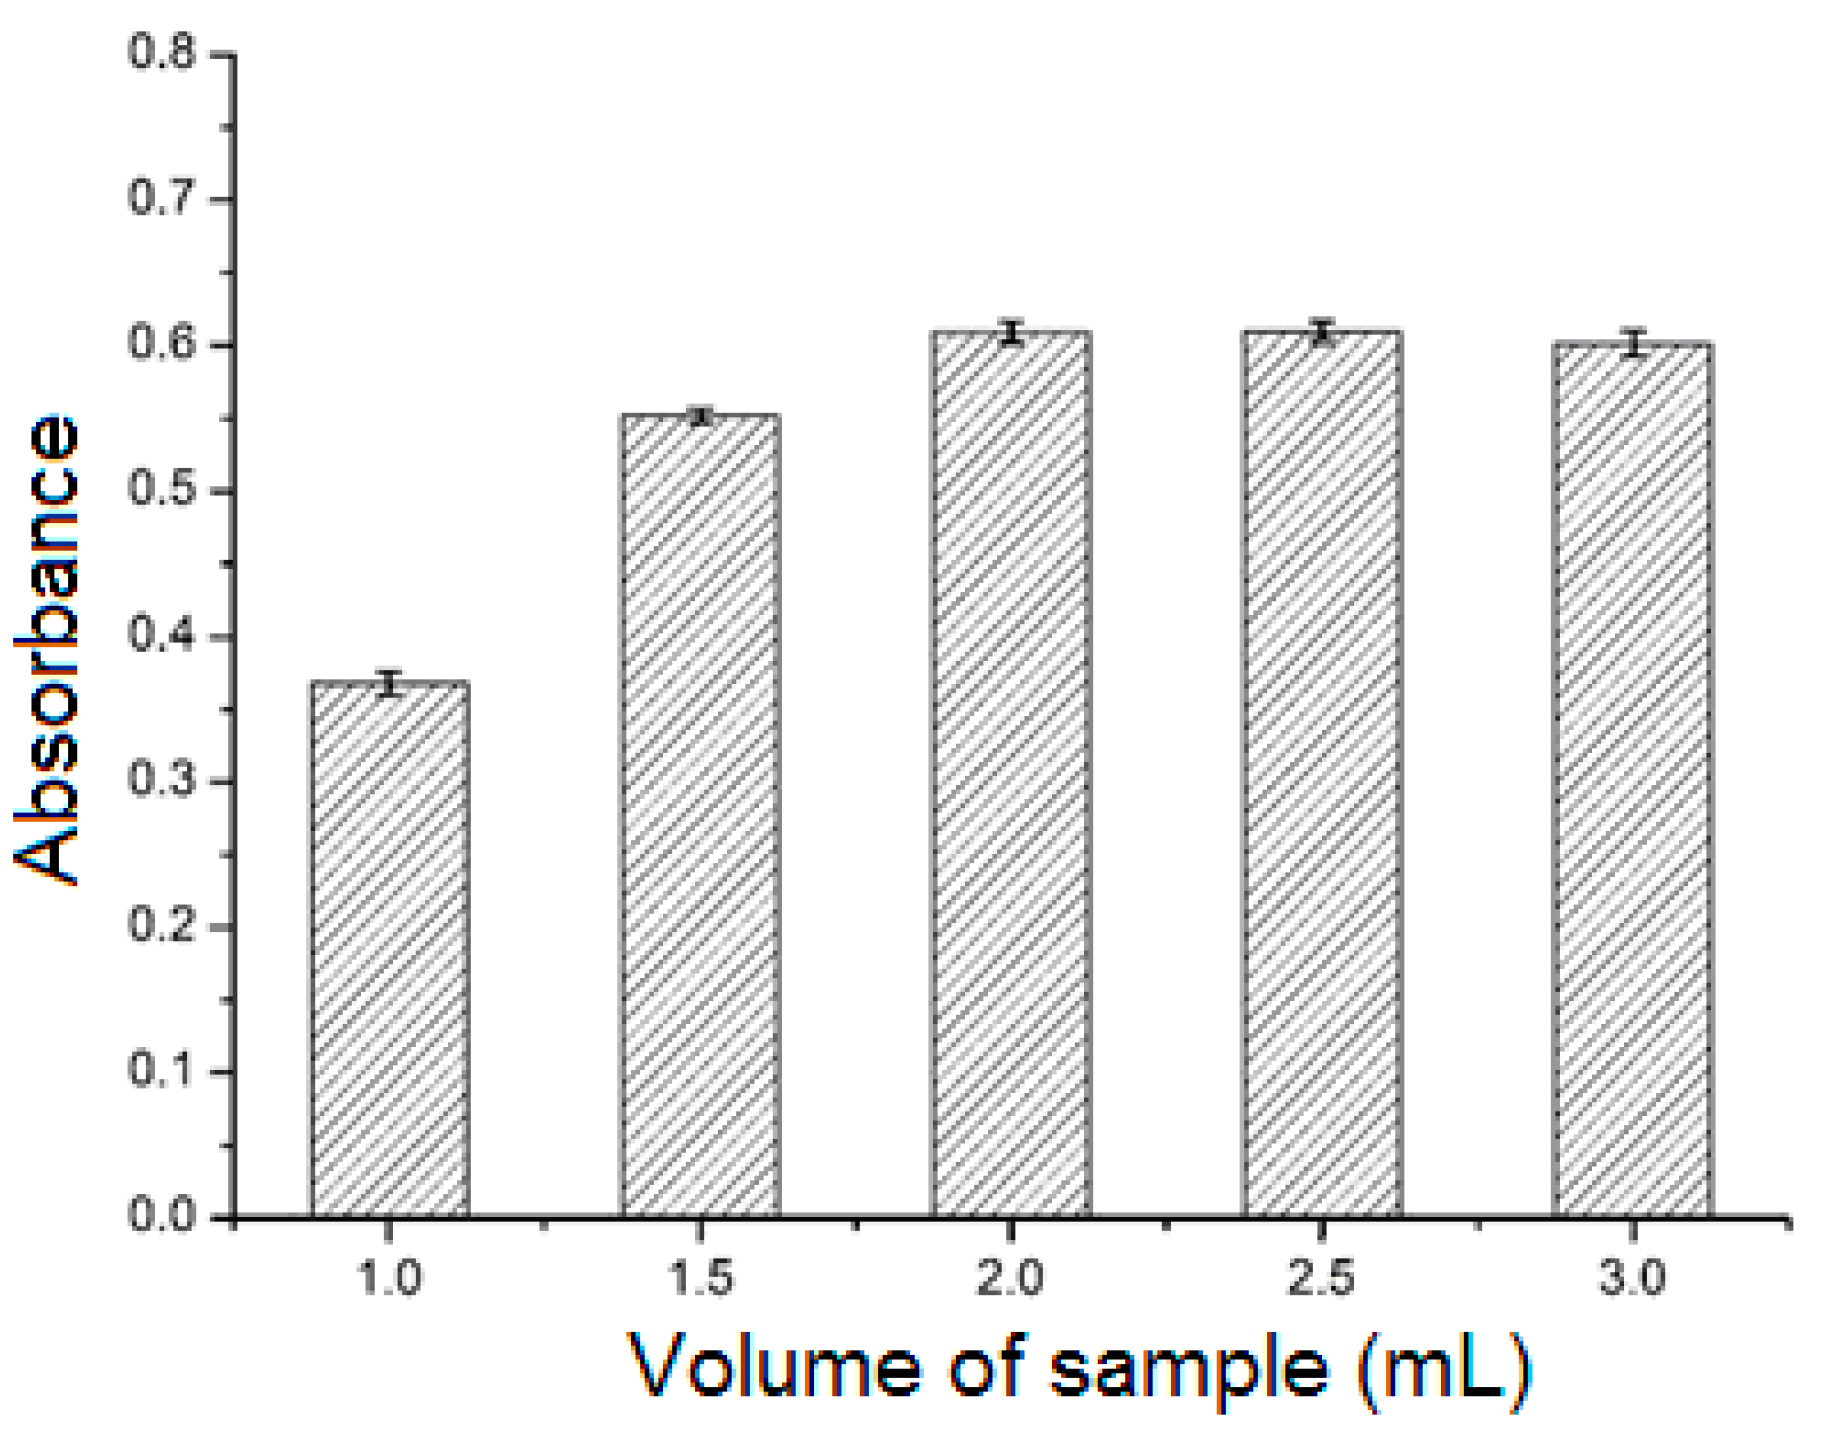
2.3.2. Effect of Sample Solution Volume

The adsorption efficiency can also be influenced by the volume of the sample solution. Volumes of sample solution (3 mmol L−1) in the range of 1.0–3.0 mL were passed through the SPE cartridge, and the adsorbed analytes were eluted with methanol (4 mL). As shown in Figure 5, the absorbance of the eluate increased as the sample solution volume was increased from 1.0 mL to 2.0 mL, but remained stable as the volume was increased to 3.0 mL. Thus, the optimum volume was 2.0 mL.

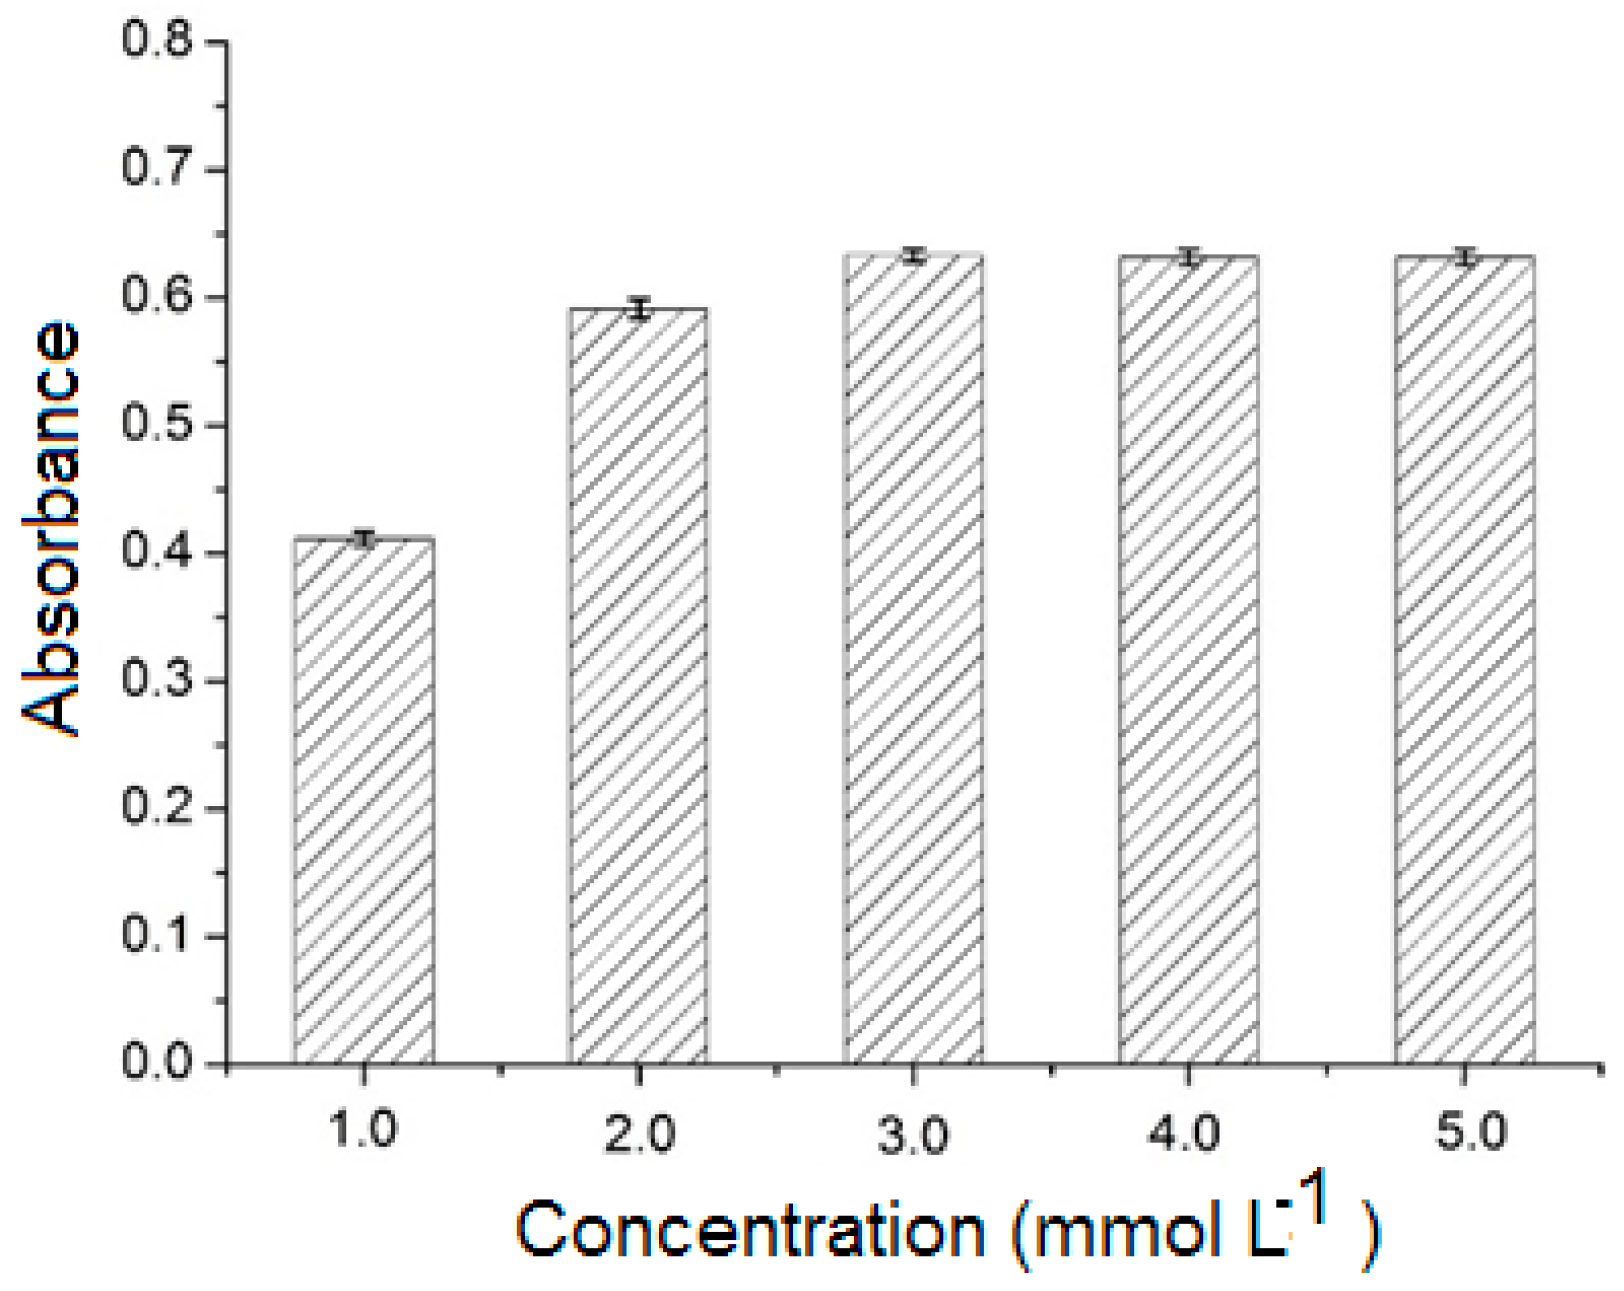
2.3.3. Effect of Analyte Concentration

Five different concentrations (1.0, 2.0, 3.0, 4.0, and 5.0 mmol L−1) of (±)-1,1′-bi-2-naphthol were investigated. As shown in Figure 6, the absorbance of the eluate increased as the analyte concentration was increased from 1.0 to 3.0 mmol L−1, with no further increase as the concentration was raised to 5.0 mmol L−1. The optimal concentration was therefore 3.0 mmol L−1.

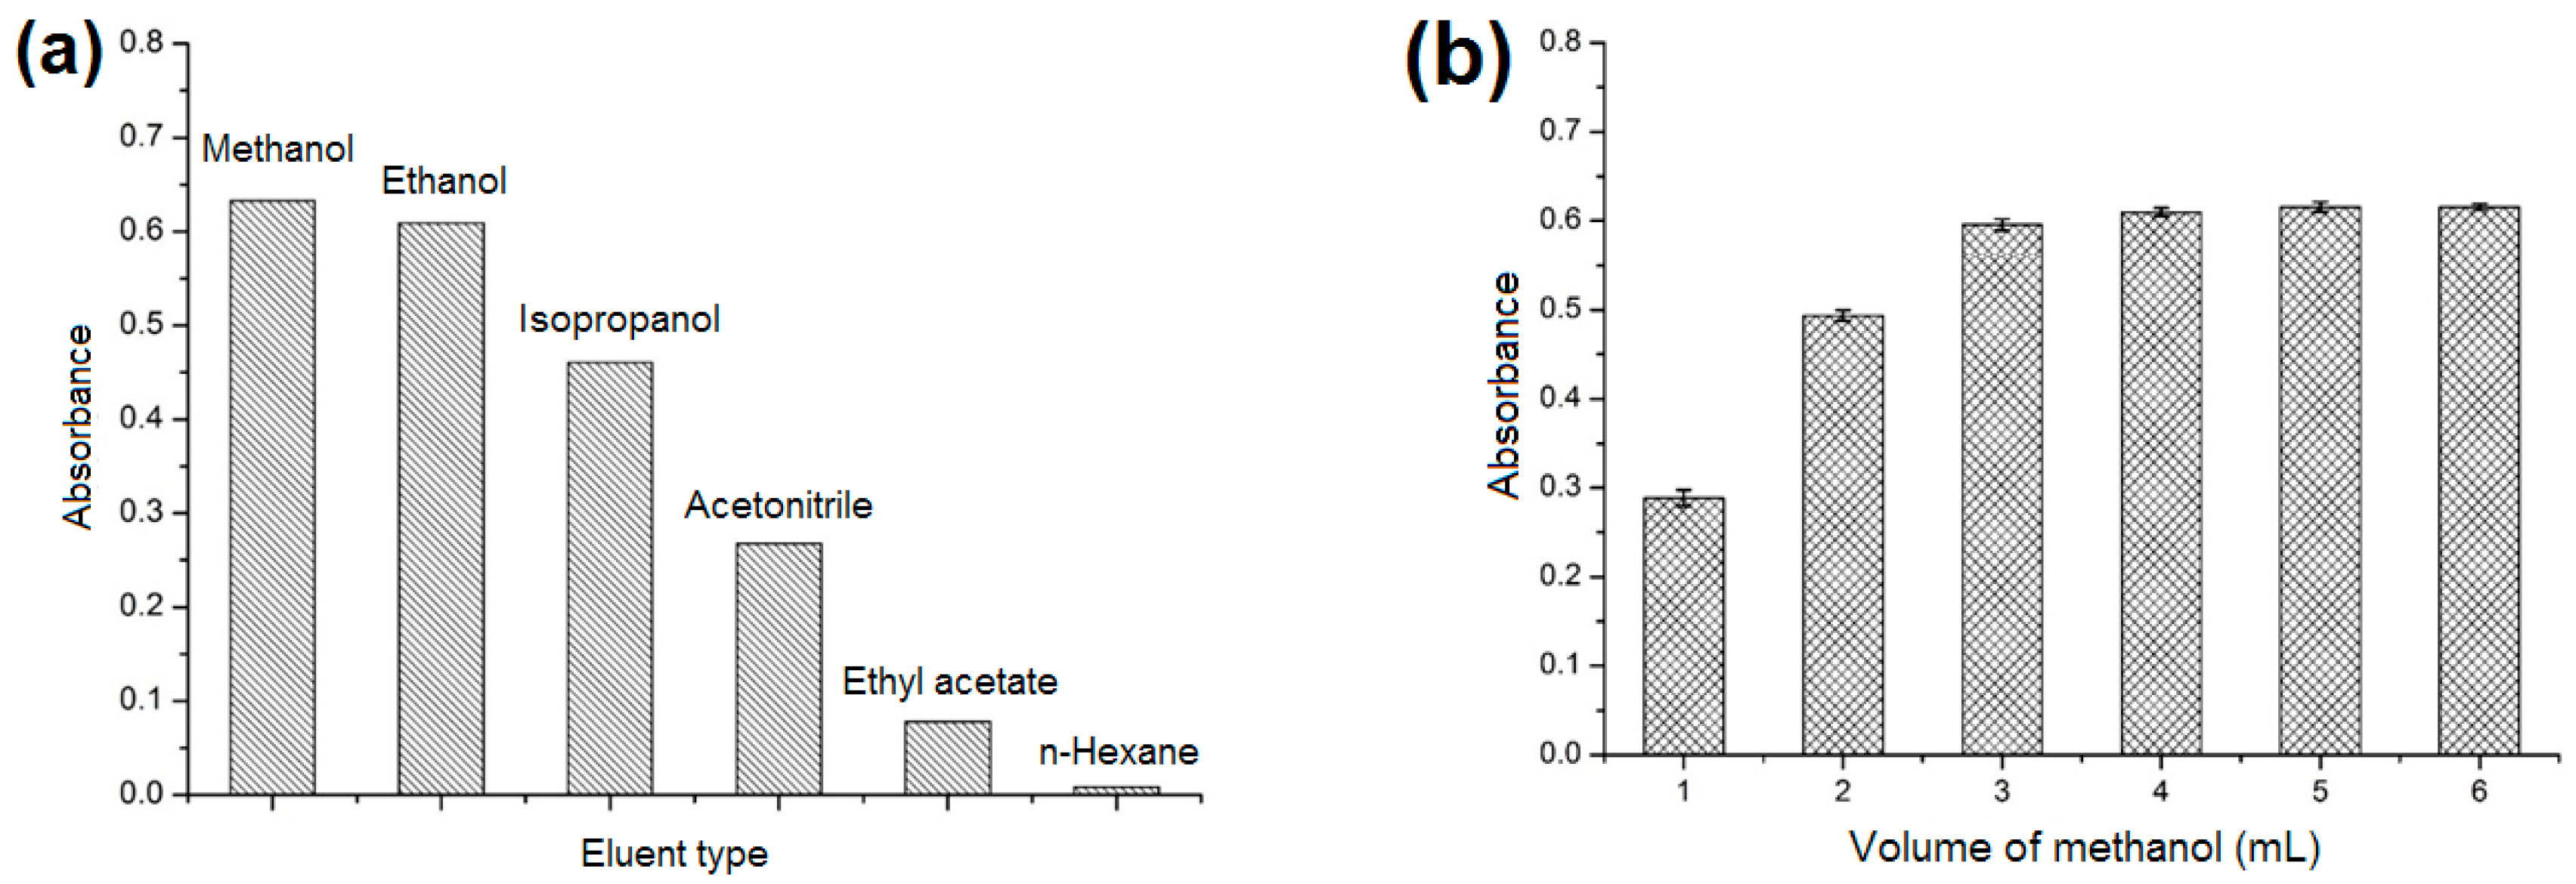
2.3.4. Effect of Type and Volume of Elution Solvent

The nature of the elution solvent plays an important role in the effective desorption of analyte from adsorbent. The influence of elution solvent on desorption was evaluated under the optimum conditions using six common organic solvents: Methanol, Ethanol, Isopropanol, Acetonitrile, Ethyl acetate, and n-Hexane. As shown in Figure 7a, the maximum absorbance of the eluate was obtained when using methanol as the desorption solvent. Therefore, methanol was adopted as the optimal desorption solvent. The volume of methanol was also optimized because the sorption analyte cannot be completely eluted by a small amount of methanol, and long volatilization time will be taken when excessive methanol is used. As presented in Figure 7b, the absorbance of the eluate increased as the volume of methanol was increased from 1 to 4 mL, and no significant changes were observed as the volume was increased further. Consequently, 4 mL of methanol was sufficient for the analytes to be completely eluted and was chosen as the optimized volume.

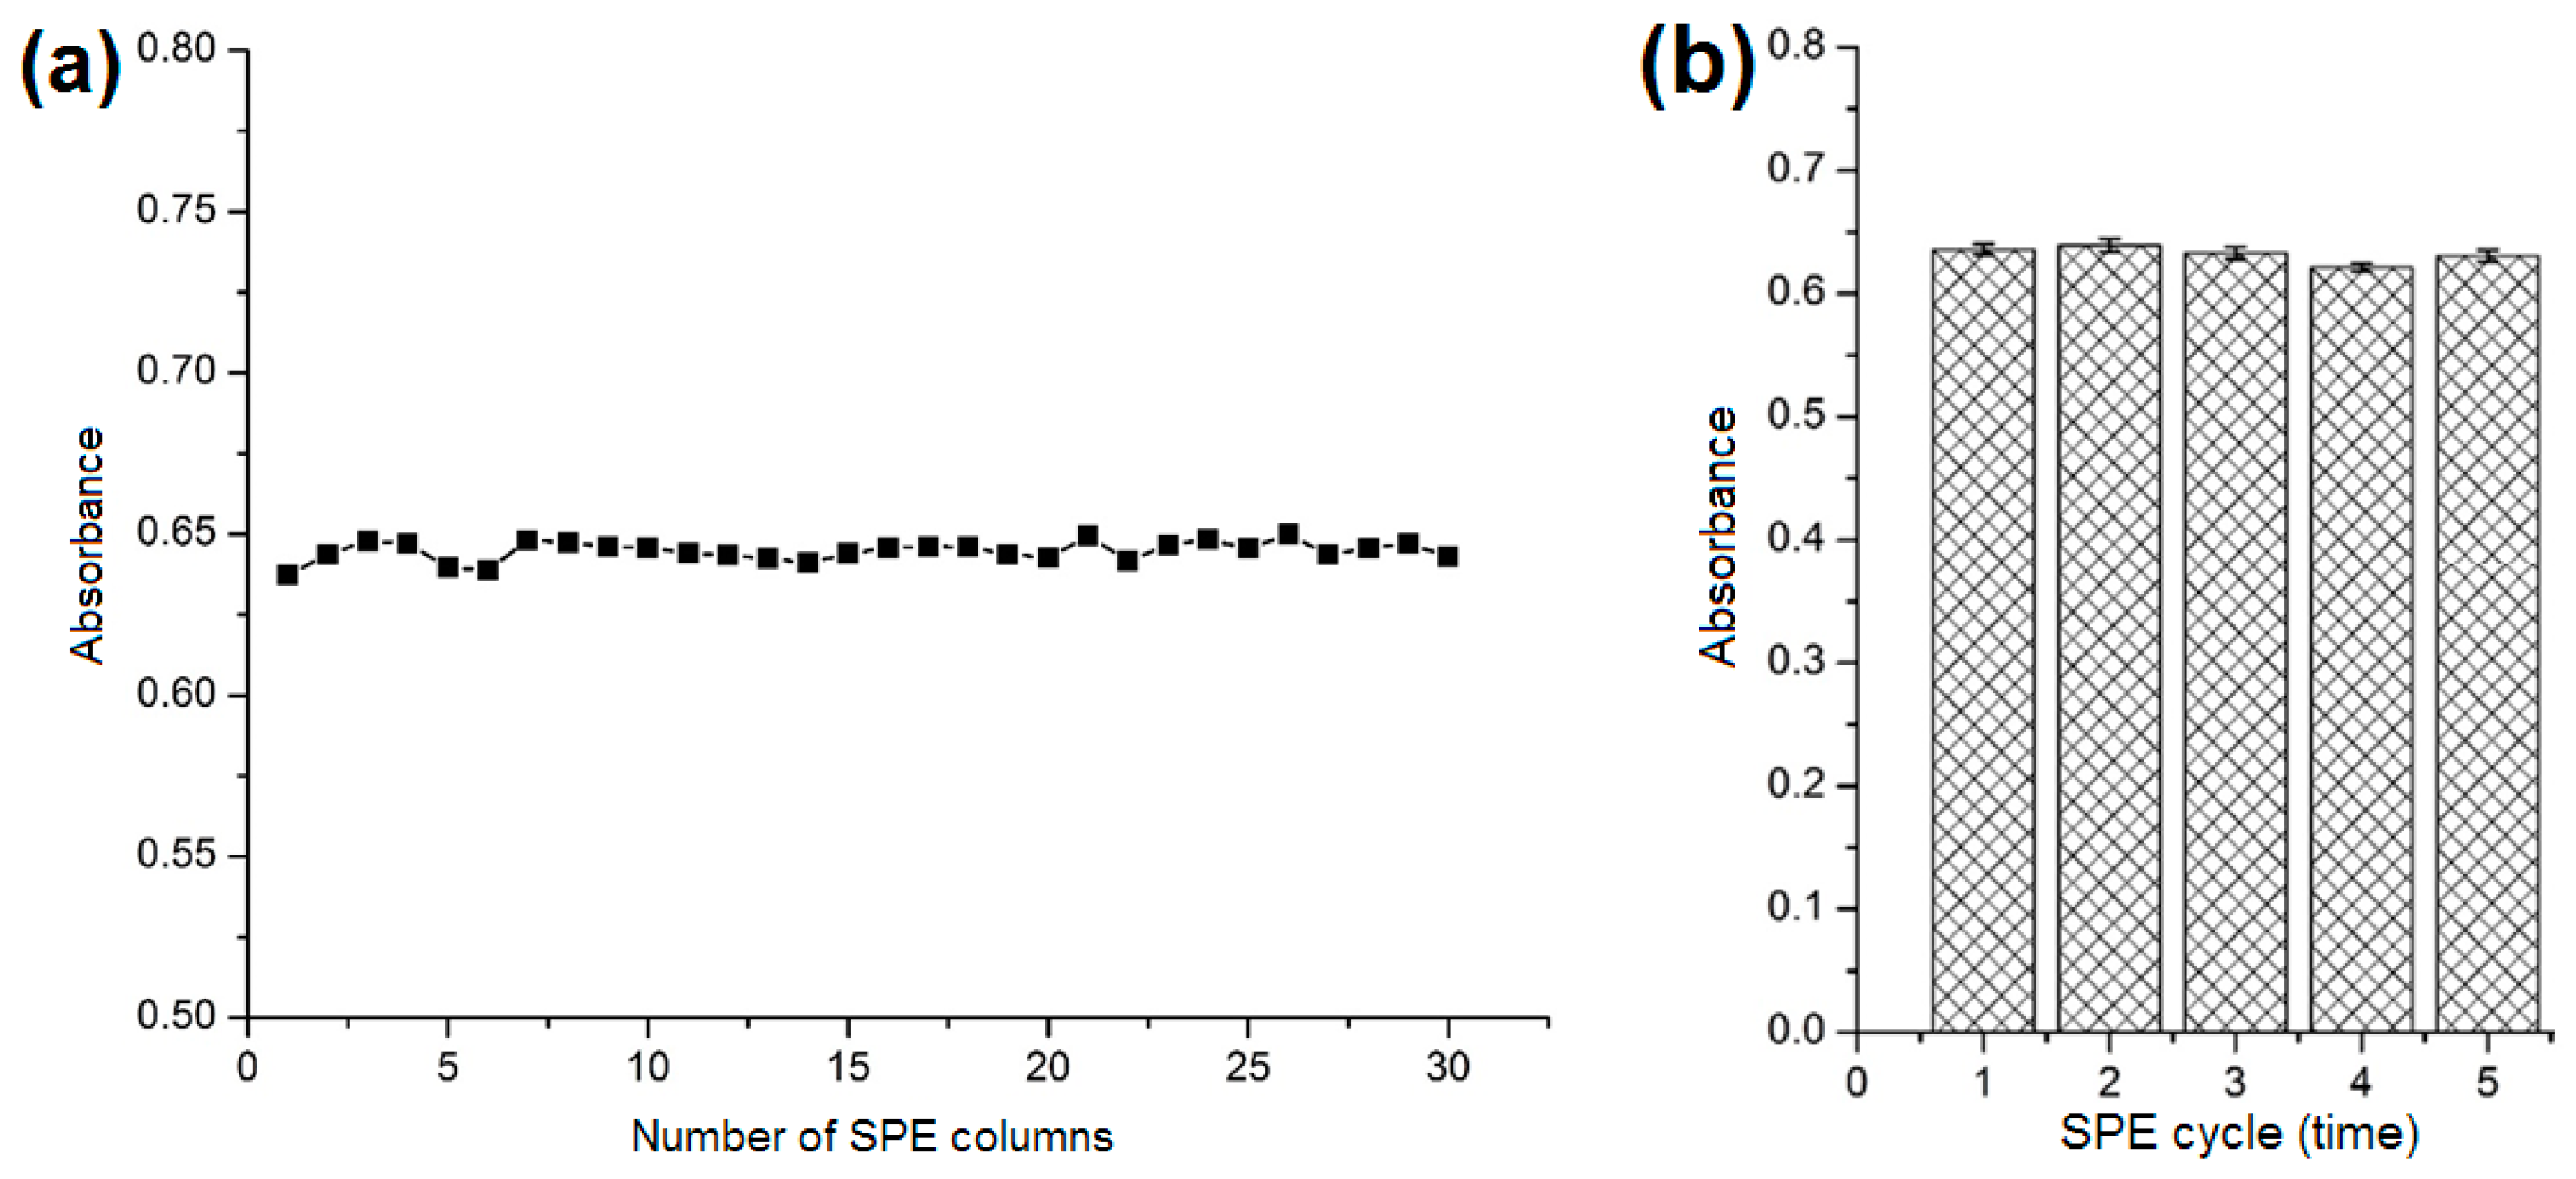
2.4. Reproducibility and Reusability of the SPE Column

To evaluate the reproducibility of the SPE column, the sample solution (3 mmol L−1, 2 mL) was added to each of 30 SPE cartridges filled with different batches of [Co(l-tyr)]n(l-tyrCo) particles. As shown in Figure 8a, the differences in the absorbance values of the eluates among the 30 columns were very small, indicating the good reproducibility of the SPE column. The reusability of the SPE column was also investigated. After each SPE experiment, the column was washed sequentially with methanol (10 mL) and n-hexane/isopropanol (70/30, v/v, 10 mL), and then reused for the next extraction cycle. As presented in Figure 8b, no obvious change in absorbance of the eluate was observed after five SPE cycles, indicating good reusability of the SPE column.

2.5. Method Validation

Solutions of (±)-1,1′-bi-2-naphthol with varying ee values (from −100% to +100%) in n-hexane/isopropanol (70:30, v/v, 3 mmol L−1) were prepared by mixing solutions of (R)-1,1′-bi-2-naphthol and (S)-1,1′-bi-2-naphthol. The solutions (2.0 mL) were passed through the SPE columns under the optimum conditions. The absorbance values of the eluates were determined by UV-visible spectrophotometry (Figure 9a), and the absorbance data at 335 nm were collected. All of the data were fitted by computer and all possible functions tried. An excellent linear relationship between ee and the absorbance of the eluate (R2 = 0.9984) was obtained at the concentration of 3 mmol L−1 (Figure 9b), which enabled the calculation of ee values for different (±)-1,1′-bi-2-naphthol samples. The selectivity of the MOF for each enantiomer was studied. The adsorption of (S)-1,1′-bi-2-naphthol by the MOF was greater than that of (R)-1,1′-bi-2-naphthol. The absolute recoveries were 62% for (R)-1,1′-bi-2-naphthol and 98% for (S)-1,1′-bi-2-naphthol under the developed conditions.
Given that an enantiomerically pure of l-tyrosine was used as ligand in the synthesis, the synthesized [Co(l-tyr)]n(l-tyrCo) is chiral. The 2D structure of [Co(l-tyr)]n(l-tyrCo) showing cobalt oxide layers pillared with L-tyrosine linkers and produced large chiral pores (Figure 1a). The influence of the chiral microenvironment on the enantioselective adsorption is complicated. It is difficult to completely understand the mechanism of interaction between the MOF and the two enantiomers. The reason for the selective adsorption of (S)-1,1′-bi-2-naphthol may be the high degree of space matching between (S)-1,1′-bi-2-naphthol and the chiral structures of the crystal resulting in different forces.
To verify the accuracy of the methodology, solutions of (±)-1,1′-bi-2-naphthol at a variety of ee values were determined by this method. The absorbances of the eluates were determined and the ee values were calculated using the standard curve (Table 1). Compared with the actual ee values measured by chiral HPLC, this method had an average error of 2.26%. This method can therefore be used for evaluation of the ee of (±)-1,1′-bi-2-naphthol with good accuracy.

3. Materials and Methods

3.1. Reagents and Materials

All chemicals and reagents used in this study were at least of analytical grade. (R)-1,1′-Bi-2-naphthol and (S)-1,1′-bi-2-naphthol were purchased from Sigma-Aldrich (St. Louis, MO, USA). Co(CH3COO)2∙4H2O, l-tyrosine, and NaOH were purchased from Adamas-beta (Shanghai, China), and were used for the synthesis of MOF, [Co(l-tyr)]n(l-tyrCo). HPLC grade methanol, ethanol, isopropanol, acetonitrile, ethyl acetate, and n-hexane were obtained from TEDIA (Fairfield, OH, USA). Ultrapure water (18.2 Ω cm) was produced with an ELGA LabWater water purification system (High Wycombe, UK). The empty SPE cartridges (0.2000 g, 3 mL, polypropylene) with frits (20 μm porosity) were purchased from SEPAX Technologies Inc. (Suzhou, China).

3.2. Instrumentations

Powder X-ray diffraction (PXRD) patterns were recorded on a D/max-3B diffractometer (Tokyo, Japan) using Cu Kα radiation. Scanning electron microscopy (SEM) images were recorded on a FEI Quanta FEG 650 scanning electron microscope (Hillsboro, OR, USA). The absorbance of eluate was determined on a TU-1901 UV/Vis spectrophotometer (Beijing Purkinje General Instrument Co., Ltd., Beijing, China). Commercial ChiralPak OD-H (250 mm × 4.6 mm, Daicel, Shanghai, China) and a Shimadzu HPLC system (Tokyo, Japan) consisting of an LC-15C HPLC pump and SPD-15C UV/Vis detector were used for the actual ee analyses.

3.3. Synthesis of [Co(l-tyr)]n(l-tyrCo)

[Co(l-tyr)]n(l-tyrCo) was synthesized according to the method of Rocha et al. [40]. Typically, Co(CH3COO)2∙4H2O and l-tyrosine in a molar ratio of 1:2 were mixed with ultrapure water (20 mL) in a Teflon-lined bomb and stirred with a magnetic bar. The pH of the mixture was adjusted to 9~10 by adding aqueous solution of NaOH (1 mol L−1). The bomb was sealed and heated at 130 °C for 3 days. After cooling to room temperature, the mixture was filtered and the purple crystals were washed thoroughly with distilled water and ethanol. Finally, the solid was dried at 100 °C.

3.4. Preparation of SPE Columns

The synthesized crystals of [Co(l-tyr)]n(l-tyrCo) were large and heterogeneous, which made them unsuitable for direct use as adsorbent in the preparation of SPE columns. The crystals were therefore milled and a suitable particle size was selected by preparing an ethanol suspension. Subsequently, each SPE cartridge was packed with the selected crystal particles (0.2000 g) using polypropylene frits at each end of the cartridge to keep the packing in place. The outlet tip of the cartridge was connected to a vacuum pump, and methanol was continuously added at the inlet end.

3.5. SPE Procedures

Before the extraction experiment, the crystals of the [Co(l-tyr)]n(l-tyrCo) packed cartridge were preconditioned by washing with methanol (5 mL) and activated with sample solvent (5 mL). A known volume of the sample was passed through the activated cartridge by gravity action. To remove residual sample on the surface of the crystals, additional sample solvent (5 mL) was added after the sample solution had completely passed through. Subsequently, the cartridge was eluted with methanol (4 mL). The eluate was volatilized, diluted with methanol to a final volume of 4 Ml, and the absorbance was determined by UV-visible spectrophotometry.

3.6. Calculation of ee Value

The ee value of the sample was calculated using the following formula:
e e % = S R S + R   ×   100 %  
(R, S: Concentration/peak area, respectively).
Logically, ee values of +100% and −100% represent enantiomerically pure of (S)-1,1′-bi-2-naphthol and (R)-1,1′-bi-2-naphthol, respectively, and an ee value of 0% indicates racemate.

4. Conclusions

In this work, we reported a novel and simple method for the determination of ee value by SPE using a chiral MOF as sorbent. After adsorption and desorption, a standard curve was established that demonstrated a good linear relationship between ee and absorbance of the eluate. The ee value of (±)-1,1′-bi-2-naphthol can be rapidly calculated after SPE using the standard curve.

Author Contributions

J.-H.Z. performed the experiments and wrote the manuscript; B.T. and S.-M.X. synthesized the chiral MOF; B.-J.W. characterized the MOF; M.Z. (Min Zi) analyzed the data; M.Z. (Mei Zhang) and X.-L.C. analyzed the data and helped revise the manuscript; L.-M.Y. designed and supervised the research work.

Funding

This research was supported by the National Natural Science Foundation of China (No. 21565032, No. 21705142, No. 21675141 and No. 21665030).

Conflicts of Interest

The authors declare no conflict of interest.

References

  1. Maier, N.; Franco, P.; Lindner, W. Separation of enantiomers: Needs, challenges, perspectives. J. Chromatogr. A 2001, 906, 3–33. [Google Scholar] [CrossRef]
  2. Jo, H.H.; Lin, C.Y.; Anslyn, E.V. Rapid optical methods for enantiomeric excess analysis: From enantioselective indicator displacement assays to exciton-coupled circular dichroism. Acc. Chem. Res. 2014, 47, 2212–2221. [Google Scholar] [CrossRef] [PubMed]
  3. Dragna, J.M.; Gade, A.M.; Tran, L.; Lynch, V.M.; Anslyn, E.V. Chiral amine enantiomeric excess determination using self-assembled octahedral Fe(II)-imine complexes. Chirality 2015, 27, 294–298. [Google Scholar] [CrossRef] [PubMed]
  4. Folmer-Andersen, J.F.; Lynch, V.M.; Anslyn, E.V. Colorimetric enantiodiscrimination of α-amino acids in protic media. J. Am. Chem. Soc. 2005, 127, 7986–7987. [Google Scholar] [CrossRef] [PubMed]
  5. Mei, X.; Wolf, C. Determination of enantiomeric excess and concentration of unprotected amino acids, amines, amino alcohols, and carboxylic acids by competitive binding assays with a chiral scandium complex. J. Am. Chem. Soc. 2006, 128, 13326–13327. [Google Scholar] [CrossRef] [PubMed]
  6. Korbel, G.A.; Lalic, G.; Shair, M.D. Reaction microarrays: A method for rapidly determining the enantiomeric excess of thousands of samples. J. Am. Chem. Soc. 2001, 123, 361–362. [Google Scholar] [CrossRef] [PubMed]
  7. Li, P. Fluorescence of organic molecules in chiral recognition. Chem. Rev. 2004, 104, 1687–1716. [Google Scholar]
  8. Guo, J.; Wu, J.; Siuzdak, G.; Finn, M.G. Measurement of enantiomeric excess by kinetic resolution and mass spectrometry. Angew. Chem. Int. Ed. 1999, 38, 1755–1758. [Google Scholar] [CrossRef]
  9. Chen, Y.Z.; Shimizu, K.D. Measurement of enantiomeric excess using molecularly imprinted polymers. Org. Lett. 2002, 4, 2937–2940. [Google Scholar] [CrossRef] [PubMed]
  10. Li, Y.; Lu, P.; Cheng, J.; Zhu, X.; Guo, W.; Liu, L.; Wang, Q.; He, C.; Liu, S. Novel microporous β-cyclodextrin polymer as sorbent for solid-phase extraction of bisphenols in water samples and orange juice. Talanta 2018, 187, 207–215. [Google Scholar] [CrossRef] [PubMed]
  11. Płotka-Wasylka, J.; Szczepańska, N.; de la Guardia, M.; Namieśnik, J. Modern trends in solid phase extraction: New sorbent media. TrAC Trends Anal. Chem. 2016, 77, 23–43. [Google Scholar] [CrossRef]
  12. Yaghi, O.M.; O’Keeffe, M.; Ockwig, N.W.; Chae, H.K.; Eddaoudi, M.; Kim, J. Reticular synthesis and the design of new materials. Nature 2003, 423, 705–714. [Google Scholar] [CrossRef] [PubMed]
  13. Férey, G. Hybrid porous solids: Past, present, future. Chem. Soc. Rev. 2008, 37, 191–214. [Google Scholar] [CrossRef] [PubMed]
  14. Gu, Z.Y.; Yang, C.X.; Chang, N.; Yan, X.P. Metal-organic frameworks for analytical chemistry: From sample collection to chromatographic separation. Acc. Chem. Res. 2012, 45, 734–745. [Google Scholar] [CrossRef] [PubMed]
  15. Li, J.R.; Sculley, J.; Zhou, H.C. Metal-organic frameworks for separations. Chem. Rev. 2012, 112, 869–932. [Google Scholar] [CrossRef] [PubMed]
  16. Murray, L.J.; Dinca, M.; Long, J.R. Hydrogen storage in metal-organic frameworks. Chem. Soc. Rev. 2009, 38, 1294–1314. [Google Scholar] [CrossRef] [PubMed]
  17. Li, J.R.; Kuppler, R.J.; Zhou, H.C. Selective gas adsorption and separation in metal-organic frameworks. Chem. Soc. Rev. 2009, 38, 1477–1504. [Google Scholar] [CrossRef] [PubMed]
  18. Liu, Y.; Xuan, W.M.; Cui, Y. Engineering homochiral metal-organic frameworks for heterogeneous asymmetric catalysis and enantioselective separation. Adv. Mater. 2010, 22, 4112–4135. [Google Scholar] [CrossRef] [PubMed]
  19. Lee, J.; Farha, O.K.; Roberts, J.; Scheidt, K.A.; Nguyen, S.T.; Hupp, J.T. Metal-organic framework materials as catalysts. Chem. Soc. Rev. 2009, 38, 1450–1459. [Google Scholar] [CrossRef] [PubMed]
  20. Allendorf, M.D.; Bauer, C.A.; Bhakta, R.K.; Houk, R.J.T. Luminescent metal-organic frameworks. Chem. Soc. Rev. 2009, 38, 1330–1352. [Google Scholar] [CrossRef] [PubMed]
  21. Cui, Y.J.; Yue, Y.F.; Qian, G.D.; Chen, B.L. Luminescent functional metal-organic frameworks. Chem. Rev. 2012, 112, 1126–1162. [Google Scholar] [CrossRef] [PubMed]
  22. Della Rocca, J.; Liu, D.M.; Lin, W.B. Nanoscale metal-organic frameworks for biomedical imaging and drug delivery. Acc. Chem. Res. 2011, 44, 957–968. [Google Scholar] [CrossRef] [PubMed]
  23. Gu, Z.Y.; Chen, Y.J.; Jiang, J.Q.; Yan, X.P. Metal-organic frameworks for efficient enrichment of peptides with simultaneous exclusion of proteins from complex biological samples. Chem. Commun. 2011, 47, 4787–4789. [Google Scholar] [CrossRef] [PubMed]
  24. Chen, X.F.; Zang, H.; Wang, X.; Cheng, J.G.; Zhao, R.S.; Cheng, C.G.; Lu, X.Q. Metal-organic framework MIL-53(Al) as a solid-phase microextraction adsorbent for the determination of 16 polycyclic aromatic hydrocarbons in water samples by gas chromatography-tandem mass spectrometry. Analyst 2012, 137, 5411–5419. [Google Scholar] [CrossRef] [PubMed]
  25. Xie, L.J.; Liu, S.Q.; Han, Z.B.; Jiang, R.F.; Liu, H.; Zhu, F.; Zeng, F.; Su, C.Y.; Ouyang, G.F. Preparation and characterization of metal-organic framework MIL-101(Cr)-coated solid-phase microextraction fiber. Anal. Chim. Acta 2015, 853, 303–310. [Google Scholar] [CrossRef] [PubMed]
  26. Huo, S.H.; Yan, X.P. Facile magnetization of metal-organic framework MIL-101 for magnetic solid-phase extraction of polycyclic aromatic hydrocarbons in environmental water samples. Analyst 2012, 137, 3445–3451. [Google Scholar] [CrossRef] [PubMed]
  27. Cui, X.Y.; Gu, Z.Y.; Jiang, D.Q.; Li, Y.; Wang, H.F.; Yan, X.P. In situ hydrothermal growth of metal-organic framework 199 films on stainless steel fibers for solid-phase microextraction of gaseous benzene homologues. Anal. Chem. 2009, 81, 9771–9777. [Google Scholar] [CrossRef] [PubMed]
  28. Zhang, Z.M.; Huang, Y.C.; Ding, W.W.; Li, G.K. Multilayer interparticle linking hybrid MOF-199 for non-invasive enrichment and analysis of plant hormone ethylene. Anal. Chem. 2014, 86, 3533–3540. [Google Scholar] [CrossRef] [PubMed]
  29. Ge, D.; Lee, H.K. Water stability of zeolite imidazolate framework 8 and application to porous membrane-protected micro-solid-phase extraction of polycyclic aromatic hydrocarbons from environmental water samples. J. Chromatogr. A 2011, 1218, 8490–8495. [Google Scholar] [CrossRef] [PubMed]
  30. Chang, N.; Gu, Z.Y.; Wang, H.F.; Yan, X.P. Metal-organic framework-based tandem molecular sieves as a dual platform for selective microextraction and high-resolution gas chromatographic separation of n-alkanes in complex matrixes. Anal. Chem. 2011, 83, 7094–7101. [Google Scholar] [CrossRef] [PubMed]
  31. Zhou, Q.; Zhu, L.; Xia, X.; Tang, H. The water-resistant zeolite imidazolate framework 67 is a viable solid phase sorbent for fluoroquinolones while efficiently excluding macromolecules. Microchim. Acta 2016, 183, 1839–1846. [Google Scholar] [CrossRef]
  32. Yu, L.Q.; Yan, X.P. Covalent bonding of zeolitic imidazolate framework-90 to functionalized silica fibers for solid-phase microextraction. Chem. Commun. 2013, 49, 2142–2144. [Google Scholar] [CrossRef] [PubMed]
  33. Wu, Y.Y.; Yang, C.X.; Yan, X.P. Fabrication of metal-organic framework MIL-88B films on stainless steel fibers for solid-phase microextraction of polychlorinated biphenyls. J. Chromatogr. A 2014, 1334, 1–8. [Google Scholar] [CrossRef] [PubMed]
  34. He, C.T.; Tian, J.Y.; Liu, S.Y.; Ouyang, G.; Zhang, J.P.; Chen, X.M. A porous coordination framework for highly sensitive and selective solid-phase microextraction of non-polar volatile organic compounds. Chem. Sci. 2013, 4, 351–356. [Google Scholar] [CrossRef]
  35. Hu, Y.L.; Lian, H.X.; Zhou, L.J.; Li, G.K. In situ solvothermal growth of metal-organic framework-5 supported on porous copper foam for noninvasive sampling of plant volatile sulfides. Anal. Chem. 2015, 87, 406–412. [Google Scholar] [CrossRef] [PubMed]
  36. Gao, J.; Huang, C.; Lin, Y.; Tong, P.; Zhang, L. In situ solvothermal synthesis of metal-organic framework coated fiber for highly sensitive solid-phase microextraction of polycyclic aromatic hydrocarbons. J. Chromatogr. A 2016, 1436, 1–8. [Google Scholar] [CrossRef] [PubMed]
  37. Zang, X.; Zhang, X.; Chang, Q.; Li, S.; Wang, C.; Wang, Z. Metal-organic framework UiO-67-coated fiber for the solid-phase microextraction of nitrobenzene compounds from water. J. Sep. Sci. 2016, 39, 2770–2776. [Google Scholar] [CrossRef] [PubMed]
  38. Wang, Y.; Rui, M.; Lu, G.H. Recent applications of metal-organic frameworks in sample pretreatment. J. Sep. Sci. 2018, 41, 180–194. [Google Scholar] [CrossRef] [PubMed]
  39. Tang, B.; Zhang, J.H.; Zi, M.; Chen, X.X.; Yuan, L.M. Solid-phase extraction with metal-organic frameworks for the analysis of chiral compounds. Chirality 2016, 28, 778–783. [Google Scholar] [CrossRef] [PubMed]
  40. Zhou, B.; Silva, N.J.O.; Shi, F.N.; Palacio, F.; Mafra, L.; Rocha, J. CoII/ZnII-(L-Tyrosine) magnetic metal-organic frameworks. Eur. J. Inorg. Chem. 2012, 32, 5259–5268. [Google Scholar] [CrossRef]
Sample Availability: Samples of (±)-1,1′-bi-2-naphthol, (R)-1,1′-bi-2-naphthol and (S)-1,1′-bi-2-naphthol are available from the authors.
Figure 1. (a) 2D crystal structure of the chiral metal-organic framework (MOF), [Co(l-tyr)]n(l-tyrCo); (b) the structures of 1,1′-bi-2-naphthol enantiomers.
Molecules 23 02802 g001
Figure 2. (a) Powder X-ray diffraction (PXRD) patterns of [Co(l-tyr)]n(l-tyrCo): (1) simulated from single crystal X-ray diffraction data, (2) as-synthesized, (3) after the experiment, (4) after soaking in a large volume of methanol and n-hexane/isopropanol (70/30, v/v) for 48 h; (b) SEM image of the selected [Co(l-tyr)]n(l-tyrCo) particles.
Molecules 23 02802 g002
Figure 3. UV-visible spectra of racemic (±)-1,1′-bi-2-naphthol and eluate.
Molecules 23 02802 g003
Figure 4. Effect of solvent composition. Analyte concentration: 3.0 mmol L−1; sample volume: 2.0 mL; and elution solvent: methanol (4 mL).
Molecules 23 02802 g004
Figure 5. Effect of sample solution volume. Analyte concentration: 3.0 mmol L−1; elution solvent: methanol (4 mL).
Molecules 23 02802 g005
Figure 6. Effect of analyte concentration. Sample volume: 2.0 mL; and elution solvent: methanol (10 mL).
Molecules 23 02802 g006
Figure 7. Optimization of (a) elution solvent; (b) elution volume. Analyte concentration: 3.0 mmol L−1; sample volume: 2.0 mL.
Molecules 23 02802 g007
Figure 8. (a) Reproducibility and (b) reusability of the SPE column.
Molecules 23 02802 g008
Figure 9. (a) UV-visible spectra of the eluates after extraction of (±)-1,1′-bi-2-naphthol at various ee values; (b) standard curve showing the linearity of ee% with the absorbance of the eluates.
Molecules 23 02802 g009
Table 1. Enantiomeric excess values of (±)-1,1′-bi-2-naphthol calculated from the SPE-based assay.
SampleAbsorbanceExperimental ee (%)Actual ee (%)Absolute Error (%)Average Error (%)
10.5566−81.25−84.413.162.26
20.6022−45.67−43.342.33
30.6582−1.93−0.871.06
40.709838.4141.793.38
50.762179.2477.891.35

