Quantitative Determination of Cd in Soil Using Laser-Induced Breakdown Spectroscopy in Air and Ar Conditions


1
College of Biosystems Engineering and Food Science, Zhejiang University, 866 Yuhangtang Road, Hangzhou 310058, China
2
Key Laboratory of Spectroscopy Sensing, Ministry of Agriculture and Rural Affairs, Hangzhou 310058, China
*
Author to whom correspondence should be addressed.
Molecules 2018, 23(10), 2492; https://doi.org/10.3390/molecules23102492
Submission received: 16 August 2018
/
Revised: 26 September 2018
/
Accepted: 27 September 2018
/
Published: 28 September 2018
(This article belongs to the Special Issue Determination of Trace Heavy Metals and Metalloids in Environmental Samples)
Abstract
:Rapid detection of Cd content in soil is beneficial to the prevention of soil heavy metal pollution. In this study, we aimed at exploring the rapid quantitative detection ability of laser- induced breakdown spectroscopy (LIBS) under the conditions of air and Ar for Cd in soil, and finding a fast and accurate method for quantitative detection of heavy metal elements in soil. Spectral intensity of Cd and system performance under air and Ar conditions were analyzed and compared. The univariate model and multivariate models of partial least-squares regression (PLSR) and least-squares support vector machine (LS-SVM) of Cd under the air and Ar conditions were built, and the LS-SVM model under the Ar condition obtained the best performance. In addition, the principle of influence of Ar on LIBS detection was investigated by analyzing the three-dimensional profile of the ablation crater. The overall results indicated that LIBS combined with LS-SVM under the Ar condition could be a useful tool for the accurate quantitative detection of Cd in soil and could provide reference for environmental monitoring.
1. Introduction
Soil is the most important part of the ecosystem, and plays an important role in agricultural production and human activities [1,2]. The rational utilization of soil is beneficial to the healthy and stable development of modern society [3]. However, with the rapid development of industry and agriculture and the frequent use of agricultural chemicals, heavy metals are deposited into the soil through the atmosphere, industrial and municipal domestic sewage, industrial and mining industry solid waste, and agricultural chemicals, making the soil heavy metal pollution more and more serious. Particularly, cadmium (Cd) pollution is one of the most serious soil heavy metal pollutions in China. In recent years, many soil Cd content over standard events have been reported [4,5], which have attracted the public’s attention. Moreover, Cd is one of the most toxic heavy metals, and it is listed as the sixth most hazardous substances by the Agency for Toxic Substances and Disease Registry (ATSDR) and the first carcinogen by the International Agency for Research on Cancer (IARC) [6,7]. Thus, Cd will directly affect and endanger human health when it enters the human body through the food chain, leading many risks such as kidney disease, skeletal damage, and even cancers [8]. Therefore, it is necessary to quantitatively detect the Cd content in soil to monitor environmental quality and ensure food safety.
Currently, atomic absorption spectrometry (AAS) [9], inductively-coupled plasma optical emission spectrometry (ICP-OES) [10], and inductively-coupled plasma mass spectrometry (ICP-MS) [11] are the main methods for the detection of heavy metal in soil. However, these traditional chemical detection methods are limited by the complex detection process, which needs cumbersome sample preparation, and is time-consuming, and environmentally-unfriendly—thus cannot meet the demands of real-time detection.
Laser-induced breakdown spectroscopy (LIBS) is an atomic analysis technique developed in recent years [12]. Specifically, the plasma is firstly produced when the laser ablates the sample, then the qualitative and quantitative determination of elements can be carried out by analysing spectral signals emitted by the plasma [13]. Due to the advantages of fast analytical speed, simple sample pre-treatment, multi-element simultaneous detection, and in-situ detection capability [14], it has been widely used for element analysis in various fields, such as environmental monitoring [15], industrial analysis [16], bio-medicine [17]. However, the high detection limit of elements has always been a difficult problem to restrict the application of LIBS [18]. Therefore, LIBS signal enhancement technologies have become the focus of scholars at home and abroad, mainly including double pulse LIBS [19,20,21], nanoparticle enhanced LIBS [22,23], spatial-confinement LIBS [24,25], resonance-enhanced LIBS [26,27], and so on. Besides, the signal enhancement technique based on argon (Ar) is also one of the most promising techniques for signal enhancement. Chen et al. [28] used Ar as the protective gas to quantitatively detect Mn, Si, and Cr in liquid steel. It was found that Ar could prevent the surface oxidation of molten steel, and enhance the plasma signal while reducing the detection limit of elements. Kim et al. [29] applied LIBS to detect a thin Cu (In, Ga) Se2 (CIGS) absorber layer under the conditions of open air and Ar jet flow (25 L min−1), and the elements of Cu, In, Ga, and Se were analysed. The results showed that Ar had a great influence on the signal of Se I 196.090 nm, of which the spectral intensity was increased by about three times and the value of RSD decreased by 0.01 (from 0.045 to 0.035). Sarkar used [30] Ar at a flow rate of 6 L min−1 to explore the signal enhancement effect of LIBS on uranium (U) in the vitrified simulated high level barium borosilicate waste glass matrix. The results showed that the spectral intensity of U in Ar was about five times higher than that in air. In summary, above studies showed that LIBS detection in Ar could enhance spectral signal, and had great potential for the rapid and accurate detection of elements. To the best of our knowledge, the LIBS technique has been applied to the determination of Cd in water [31], agricultural products [32,33], fertilizers [34], and soils [35]. Besides, the quantitative detection of Cd in soil using the LIBS signal enhancement technique, based on argon (Ar), has also been reported [36], but the influence principle of Ar jet flow has not been investigated.
In this paper, we used the simulated Cd-containing soils as samples to explore the quantitatively detection ability of LIBS for Cd in soil under the conditions of air and Ar, and the enhancement effect of Ar on LIBS signal was further analysed. The specific objectives of this research were to: (1) compare the spectral intensity and system performance under different gas conditions; (2) to build univariate and multivariate quantitative analysis models of Cd in soil under different gas conditions; and (3) to further compare the performance of models to explore the principle of LIBS signal enhancement of Ar.
2. Materials and Methods
2.1. Soil Samples
In this experiment, Cd-containing soil samples were prepared by adding the heavy metal element into the certified reference material (CRM) of soil (GBW07455), which was provided by National Institute of Metrology, P.R. China. Referring to the national soil heavy metal pollution grade standard of China, CdCl2 powder of 99% purity purchased from Aladdin Reagent Shanghai Pure Biochemistry Technology Co. Ltd. (Shanghai, China), was used to prepare different concentrations of CdCl2 solution (0.02 mol·L−1, 0.04 mol·L−1, 0.06 mol·L−1, 0.08 mol·L−1, 0.10 mol·L−1, 0.12 mol·L−1, 0.14 mol·L−1, 0.16 mol·L−1, 0.18 mol·L−1, and 0.20 mol·L−1) and distilled water was used as the solvent. Specifically, 10 g CRM soil powders were firstly added to the CdCl2 solution of different concentrations, and they were mixed evenly by a grinder (JXFSTPRP-48, JX, Shanghai, China). Then, the mixture was dried in the oven at 60 °C for 6 h. After the above steps, Cd-containing soil samples with 10 content gradients were prepared. The content of Cd in the soil samples were 0.22 mg·g−1, 0.45 mg·g−1, 0.67 mg·g−1, 0.90 mg·g−1, 1.12 mg·g−1, 1.35 mg·g−1, 1.57 mg·g−1, 1.80 mg·g−1, 2.02 mg·g−1, and 2.25 mg·g−1, respectively. Finally, 0.5 g dried powders from soil samples of each content were weighed, and pressed into tablets with 12 mm in diameter and 2 mm in thickness, using 10-MPa force for 60 s (FY-24, SCJS, Tianjin, China). Five pellets were prepared for each content. Thus, 50 soil tablets were used for LIBS experiments under the conditions of air and Ar, respectively.
2.2. Spectral Acquisition
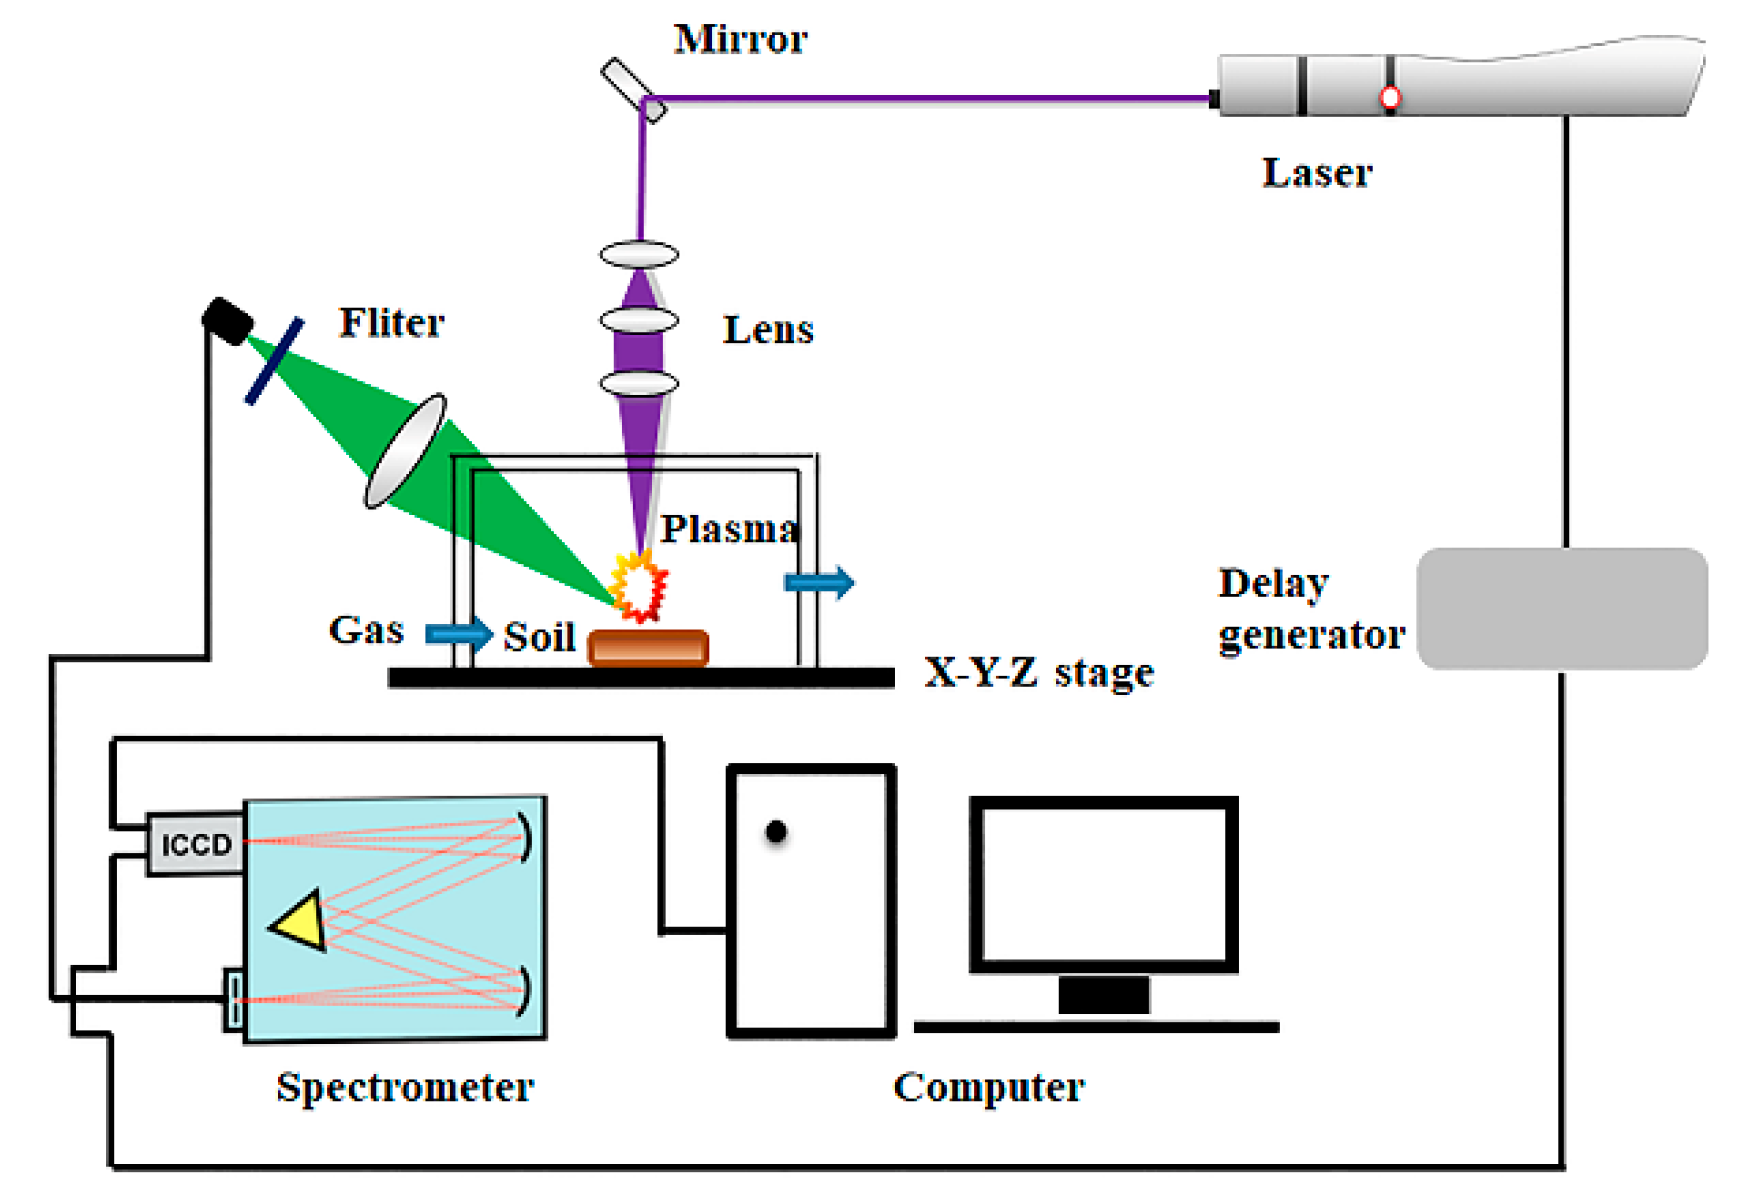
A self-built LIBS system used in this experiment is shown in Figure 1. A Q-switched Nd: YAG pulsed laser (Vlite-200, Beamtech Optronics, Beijing, China) was used for ablating samples to generate plasma, with the maximal energy of 200 mJ @ 532 nm, pulse duration of 8 ns and repetition frequency of 1 to 10 Hz. An Echelle spectrograph (SR-500i-A-R, Andor Technology, Belfast, UK) was applied for dispersion of spectral emission lines. An intensified charge-coupled device (ICCD) camera (iStar DH340T, Andor Technology, Belfast, UK) was utilized to detect spectral signal. A digital delay generator (DG645, Stanford Research Systems, San Jose, CA, USA) was used to control the delay time between the laser and the ICCD camera. Lens, mirrors, and other accessories were used to connect the whole optical path. The sample chamber made of quartz glass was used to create an Ar environment. In addition, an Hg: Ar lamp (HG-1, Ocean optics, Winter Park, FL, USA) and a Deuterium Halogen light source (DH-2000-BAL-CAL, Ocean optics, Winter Park, FL, USA) were used to calibrate wavelength and intensity, respectively. Before the experiment, experimental parameters were optimized using the response surface methodology (RSM). As a result, under the condition of Ar, parameters of laser energy, delay time, gate width, and flow rate were optimized at 120 mJ, 4.5 µs, 10 µs, and 6 L·min−1, respectively. Parameters under the condition of air were optimized at 120 mJ, 1.827 µs, 10 µs. The experiment was conducted in open air, so flow rate was not considered. After setting parameters, sample tablets were placed on the X-Y-Z stage, and the laser beam was adjusted to focus 2 mm below the sample surface to acquire LIBS spectra. In order to eliminate shot-to-shot fluctuation and obtain reliable datasets, the spectra of 16 spots with 5 times accumulation were collected, and the average of 80 spectra was recorded as the LIBS spectrum for each pellet. The experiment under the open air was done first, and then high purity Ar was passed into the sample chamber through the gas transmission tube to conduct the experiment under the condition of Ar. Instead of vacuuming, we directly passed a steady flow of Ar into the sample chamber for half an hour before the experiment to ensure an Ar atmosphere in the sample chamber. Besides, a steady flow of Ar was continuously passed into the sample chamber during the experiment under the condition of Ar.
2.3. Data Analysis
2.3.1. Data Preprocessing
Due to the matrix effect of the sample and the fluctuation of experimental parameters, noise and abnormal spectra might exist in the raw spectra of samples, which might influence the accuracy of data analysis. Thus, spectral pre-processing methods including wavelet transform (WT) and outlier rejection were used to eliminate the influence. WT is a widely used denoising method, which can effectively reduce the noise generated in the experiment [37]. The spectra are decomposed into low-frequency signals and high-frequency signals by WT, and wavelet functions with different decomposition levels will be further analyzed [38]. The optimal wavelet functions and decomposition levels for noise reduction can be selected when the maximal signal-to-noise ratio (SNR) or the minimal root mean square error (RMSE) are obtained. Detailed information can be found in the literature [37]. Daubechies 5 with decomposition scale 3 was optimized in this study. Outlier rejection is a commonly used spectral data processing method, and it has been proved that removing outlier could improve the precision and repeatability of spectral detection [39]. In this work, a self-developed outlier rejection routine was used to remove abnormal spectra based on median absolute deviation (MAD) [40]. In order to meet our demands, the peak intensity of emission Cd 266.5 nm was applied as the variable to identify outliers, as it was relatively stable among the three analysed Cd spectral lines. Specifically, the median and MAD of peak intensity of Cd 266.5 were calculated. Then the spectrum would be regarded as an outlier to be eliminated when the difference between the intensity and median of Cd 266.5 nm was beyond 2.5 times MAD. The routine would loop until there was no outlier or the number of remaining spectra was less than 75% of the original spectra [41].
2.3.2. Quantitative Analysis Methods
Univariate analysis is the most basic elemental quantitative analysis method in LIBS. Under certain conditions, the LIBS spectral intensity is proportional to the content of elements in the sample, as seen in the following equation:
where I means the intensity of the spectral line, and C means the concentration of elements to be analysed. The d means the function related to the element content, and the value of b can be 1 when the concentration of the analytical element is low and there is no self-absorption. Therefore, the calibration curve of the element can be fitted according to the intensity of the LIBS spectrum and the concentration of the corresponding element. Then the unknown concentration of the sample can be further calculated by the spectral intensity and the calibration curve. In addition, several indicators are adopted to evaluate the performance of the univariate model. The coefficient of determination for calibration (R2C) and prediction (R2P) reflect the prediction accuracy of the model, and the closer the value is to 1, the stronger the prediction ability of the model is. The root mean squared error for calibration (RMSEC) and prediction (RMSEP) reflect the prediction deviation of the model, and the smaller the value is, the better the model prediction performance will be. Besides, the limit of detection (LOD) is also a key indicator of evaluation. According to the definition given by international union of pure and applied chemistry (IUPAC), LOD means the lowest concentration obtained from the minimum analytical signal that can be reasonably detected by a particular analysis step. It reflects the sensitivity of the model, and a lower LOD represents a better detection method. The value could be calculated with the following equation:
where σbackground means the standard deviation of the background intensities, and b means the slope of calibration curve.
I = αCd
LOD = (3σbackground)/b
Partial least-squares regression (PLSR) is a multivariate linear analysis method, and is commonly used for the quantitative analysis of spectra [42,43]. Particularly, this method decomposes the original data linear and mutually independent latent variables by linear transformation, and the first few latent variables containing most information of the original variables will be selected for further analysis [44,45]. In this study, we tried to establish the PLSR model of the Cd concentration in soil and its LIBS signal intensity under different gas conditions using the software of Unscrambler × 10.1. Considering that the model is prone to overfitting when the amount of samples is less than the amount of variables [46], we used full cross-validation to correct the model, and the number of latent variables corresponding to the minimal mean squared error was employed [47]. In addition, evaluation indexes of the PLSR model were the same as those of the univariate model. As for the LOD of the multivariate model, it has recently been discussed in several multivariate techniques [48,49]. Firstly, the sensitivity of the model reflects the fraction of analytical signal with the increase elemental content [50,51], and it could be defined as:
where m is the regression vector of the PLSR model, means the Euclidean norm (vector length) of the m. According to Equations (2) and (3), an approximation LOD of the PLSR model could be calculated with the following equation [18,52,53]:
Least-squares support vector machine (LS-SVM) is an optimized statistical learning method based on the standard SVM [54,55]. Due to the good generalization ability, it has been widely used in solving linear and nonlinear regression problems. In LS-SVM, nonlinear mapping is used to map the original data to a high-dimensional space, in which linear regression is then conducted by linear hyperplane to obtain a fitting function [56,57]. In this work, we employed radial basis function (RBF) as a kernel function to establish the LS-SVM model, because of its good nonlinear solving ability [58]. Optimal parameters sig2 and gam were determined based on a grid-search procedure in the range of 103–1010 when the value of RMSECV reached its minimum. The parameter sig2 represents the bandwidth of kernel function. The parameter gam represents the trade-off between the minimum model complexity and the minimum training error [59]. Detailed information of LS-SVM model can be found in these literature [60,61]. In order to avoid the overfitting of the model, full cross-validation was also carried out. In addition, evaluation indicators of the univariate model are also applicable to the LS-SVM model.
2.4. Software Tools
Design Expert (ver.8.05, CAMO AS, Oslo, Norway) was employed to design experiments and optimize experimental parameters. Andor SOLIS for Imaging (v4.26, Andor Technology, Belfast, UK) was used to collect LIBS spectra. Unscrambler × 10.1 (CAMO, Process, AS, Oslo, Norway) and MATLAB R2009a (v7.8, The MathWorks, Inc., Natick, MA, USA) was utilized to process data and establish the chemometrics model. In addition, Origin Pro 8.0 SR0 (Origin Lab Corporation, Northampton, MA, USA) was used to draw graphics.
3. Results and Discussion
3.1. Spectral Analysis
The spectra were collected over the range from 211.92–232.90 nm, and 2014 variables were contained. According to the National Institute of Standards and Technology (NIST) database, three main characteristic lines of Cd element were identified, including Cd II 214.44 nm, Cd II 226.5 nm, and Cd II 228.8 nm. Due to the consistency of spectral trends among samples with different Cd contents, we only took the sample of medium content (1.12 mg·g−1) as an example for analysis. Figure 2 shows the average LIBS spectra under the conditions of air and Ar. It was obvious that the emission intensities of Cd II 226.5 nm and Cd II 228.8 nm were relatively high, and were relatively less affected by the matrix elements. Moreover, it could be seen that the spectral intensities of Cd collected in an Ar environment was increased by about two-to-three times compared with that in air environment. Especially, the peak of Cd II 214.44 nm signal appears only in the collection condition of Ar. The results indicated that Ar was favorable to enhance the element signal of LIBS, and Cd II 226.5 nm and Cd II 228.8 nm were more suitable for further analysis.
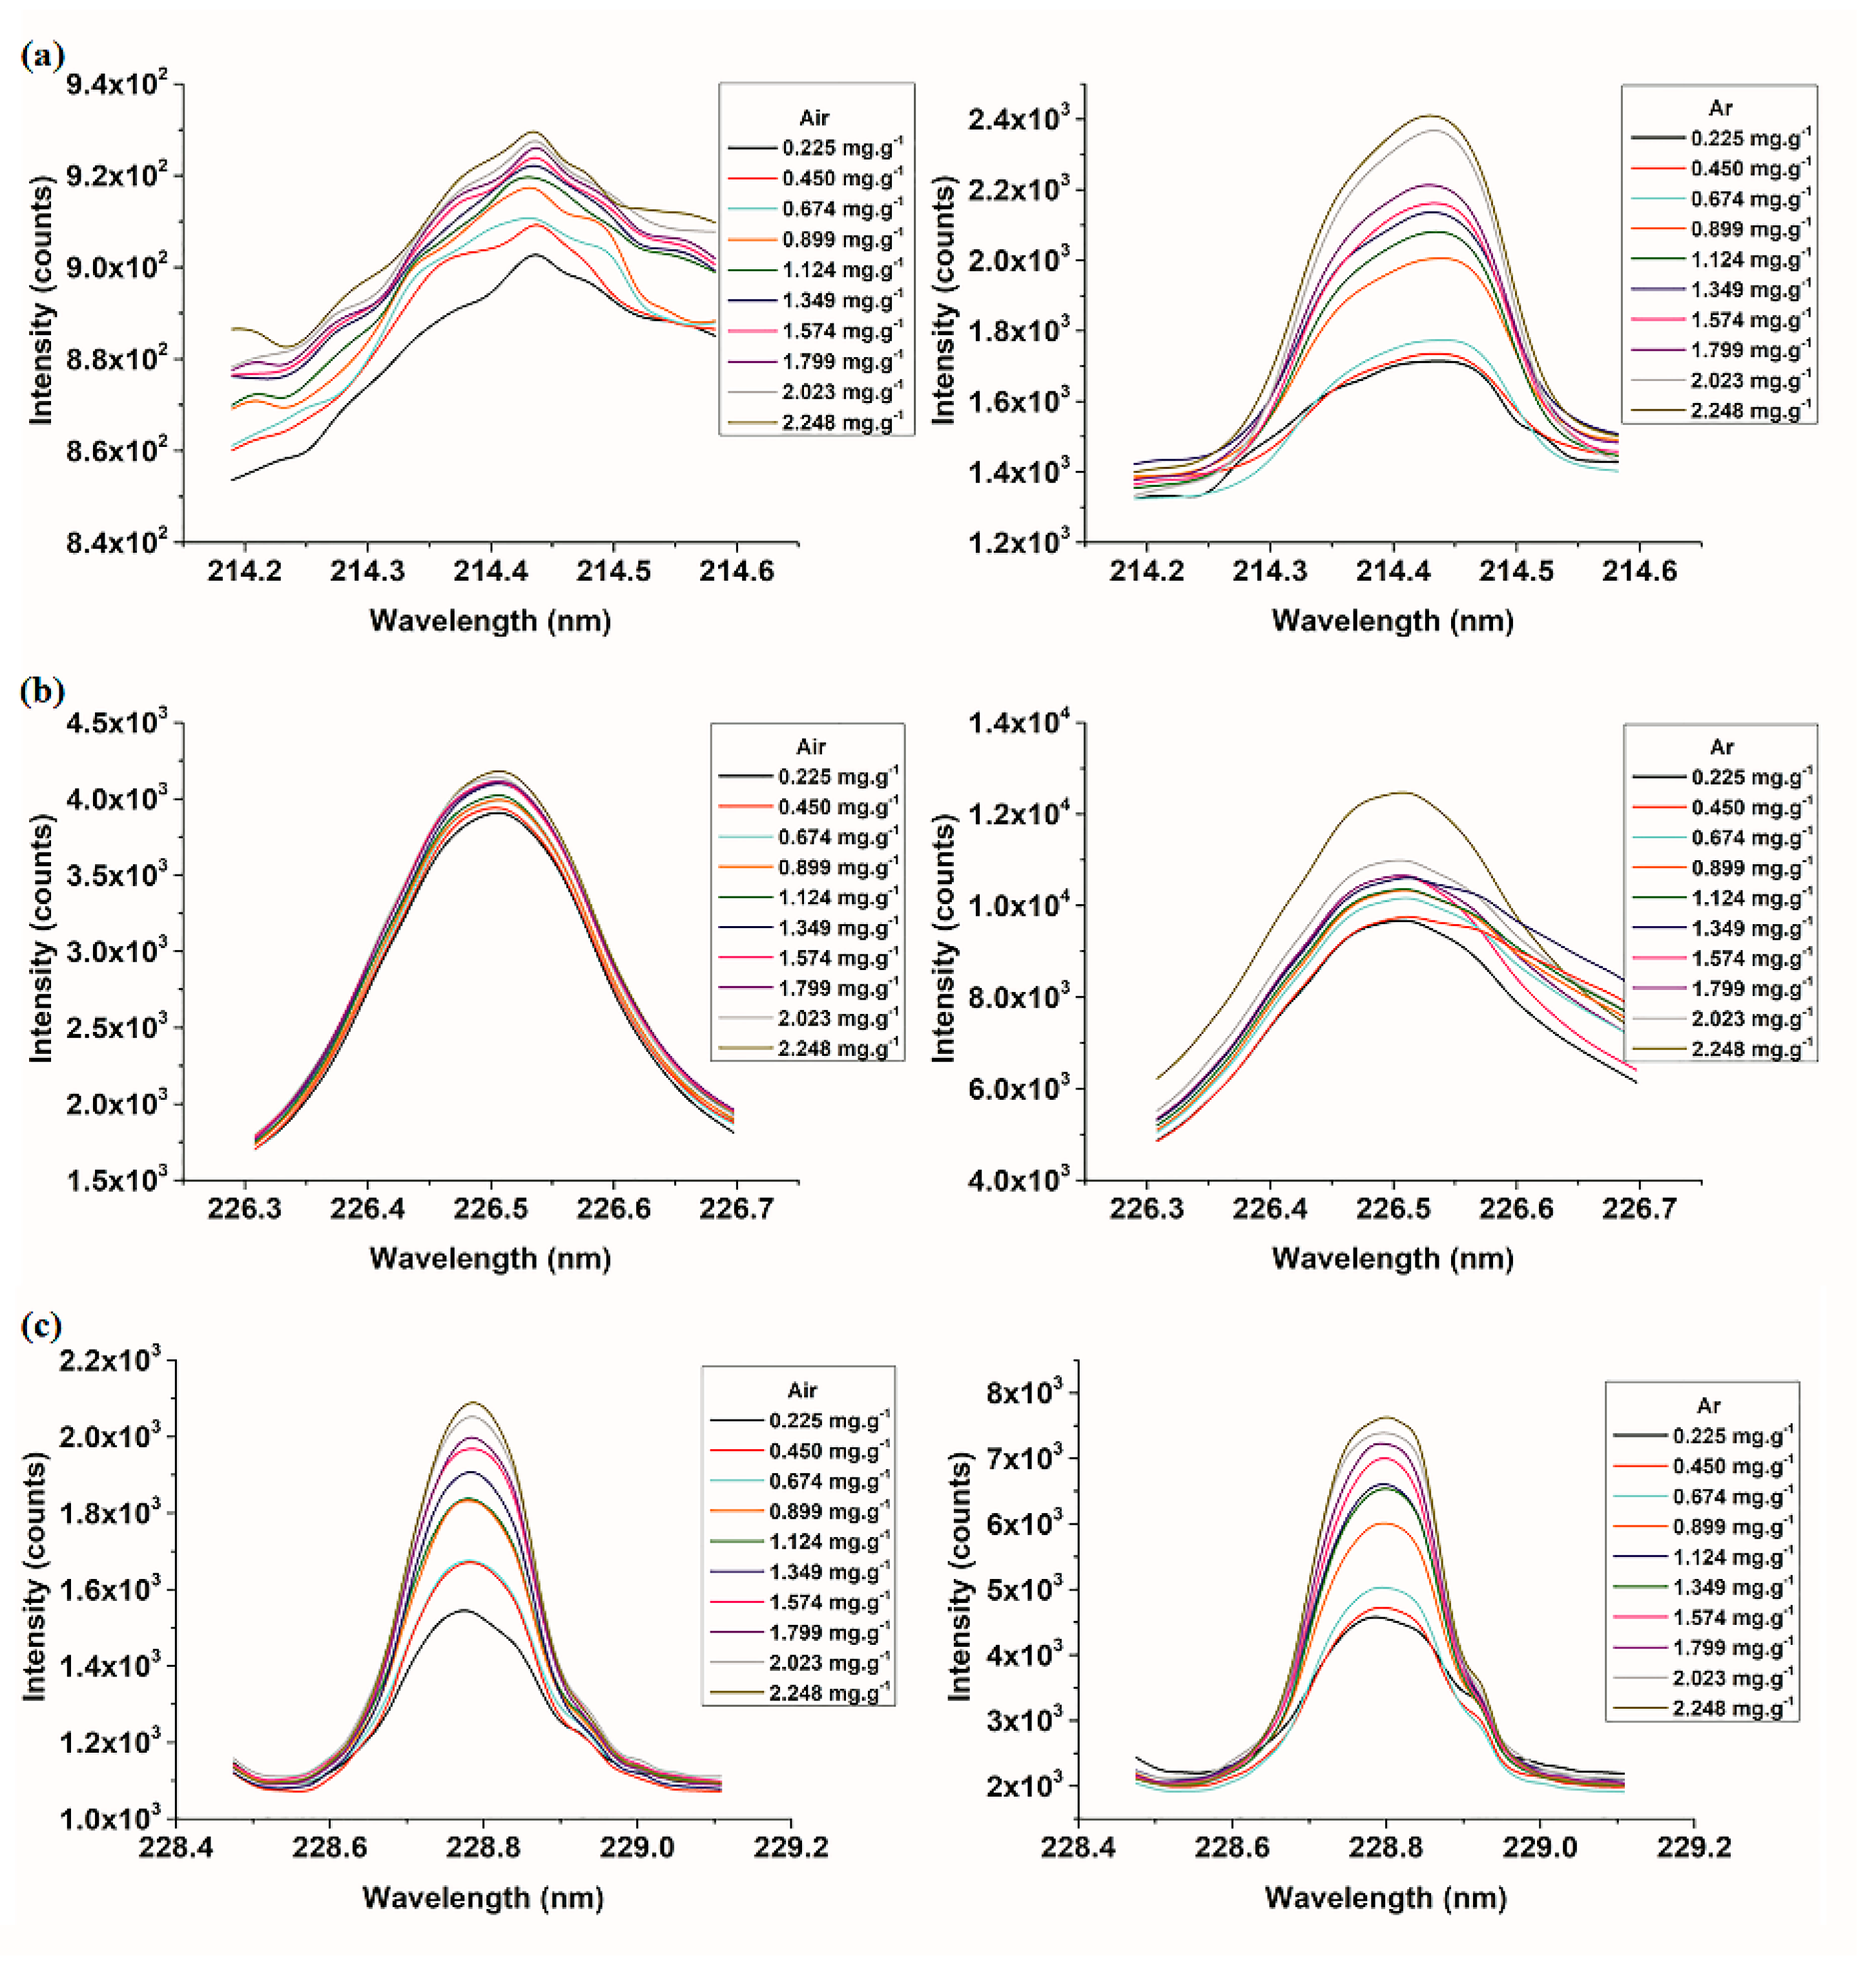
Figure 3 shows the curve of the average intensities of three Cd characteristic lines changing with Cd content at 10 content gradients. As seen in Figure 3, the spectral intensities of three Cd characteristic lines increased with the increase of Cd contents roughly, and there was no phenomenon of peak flattening or subsidence caused by self-absorption. Comparing the curve under the collection conditions of air and Ar, we could see that the spectral differences of samples with different Cd contents in Ar were more obvious. Besides, there was a slight shift in the centre position of all the three spectral lines, which might be due to the low resolution of the detector and the slight change of the detector temperature in the experiment. In addition, LIBS quantitative detection of elements would also be disturbed by system noise and an element background signal, so it was necessary to further analyse the systems performance.
3.2. System Performance Analysis
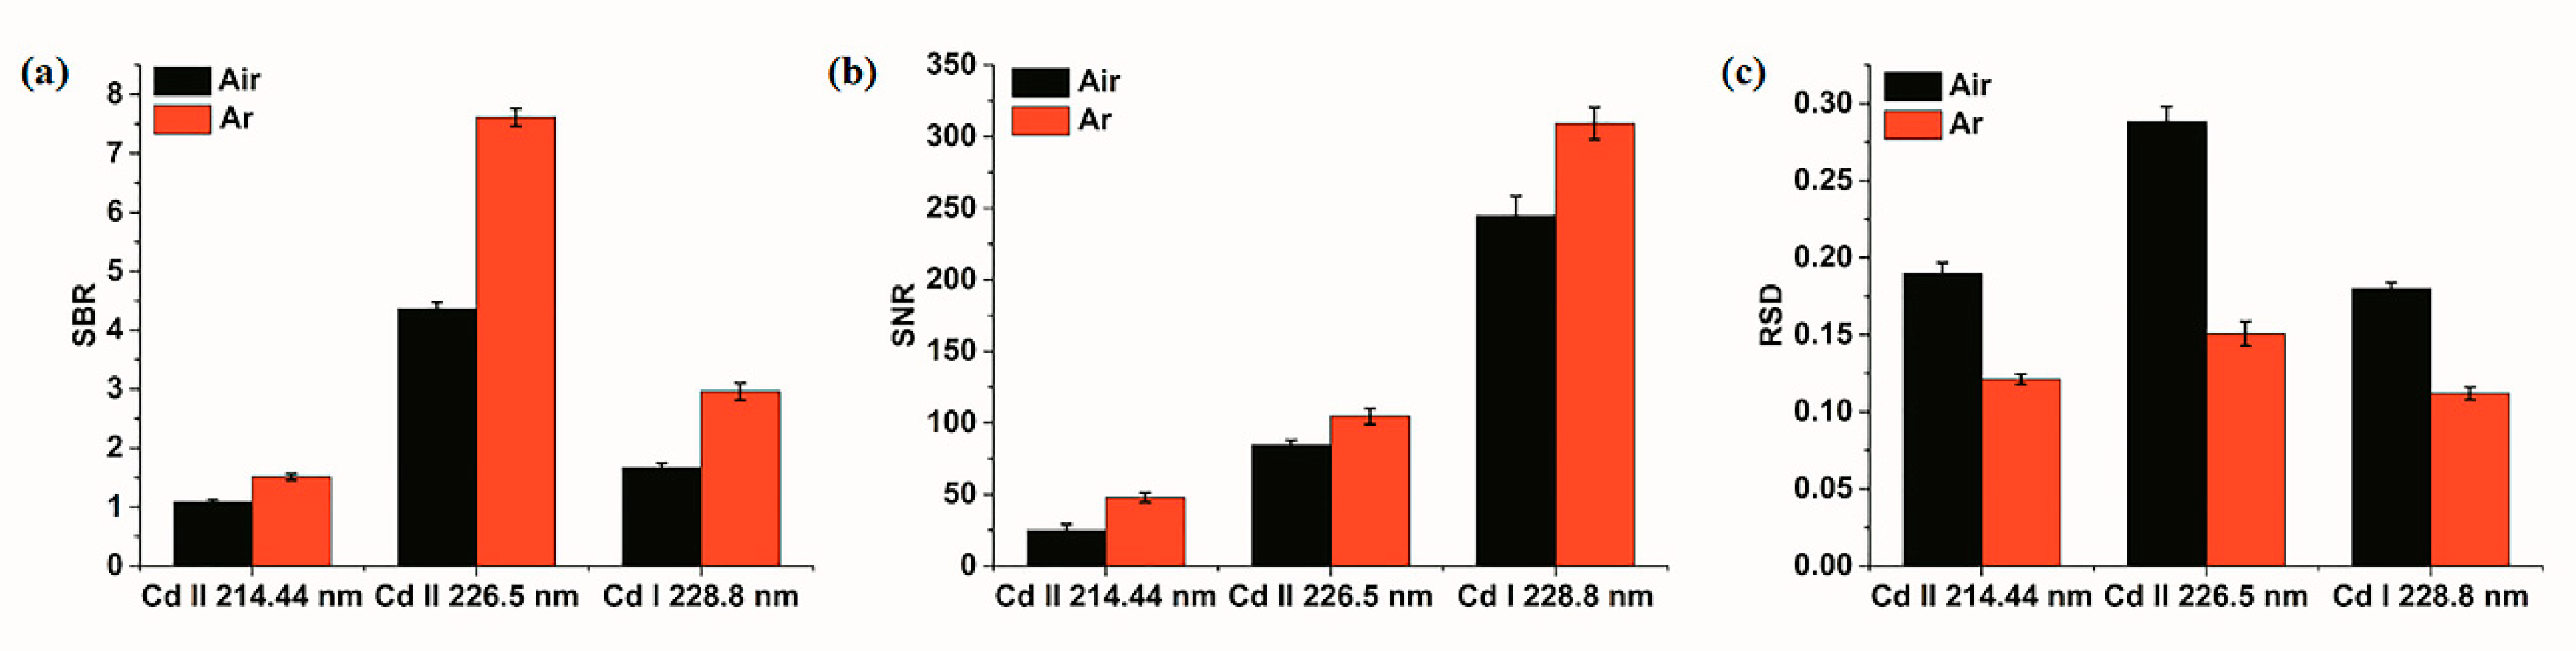
Signal-to-background ratio (SBR), signal-to-noise ratio (SNR), and the relative standard deviation (RSD) are important parameters in spectral analysis, which directly reflect the detection ability and stability of the system [62]. SBR is the ratio of net analytical signal to background signal, and SNR is the ratio of net analytical signal to noise interference. RSD is the ratio of standard deviation of signal to average intensity of signal. In detail, the signal intensity was the peak intensity of spectral lines corresponding to the element in the LIBS spectrogram. The background was the spectral line near the spectral line of the element to be analyzed, and the average peak intensity of 20 spectral lines near the spectral line of the element to be analyzed was used as the background intensity in this study. The net analytical signal, used to calculate SBR and SNR, was obtained by subtracting the background from the spectral signal. The level of noise was evaluated by the standard deviation of the background signals. In general, larger values of SNR and SBR represent better detecting ability of the instrument, while the lower value of RSD represents better stability of the system. Therefore, these three parameters were employed to compare the system performance under the conditions of air and Ar. The values of SBR, SNR, and RSD of three Cd characteristic lines for all soil samples, with different Cd contents, were calculated, and it was found that all samples had similar variation trend for these three parameters. Thus, to be consistent with spectral analysis, the sample of medium content (1.12 mg·g−1) was taken as an example for analysis. The average value of five samples with a medium content for these three parameters were calculated, and the results are presented in Figure 4.
It was seen that three Cd characteristic lines had a consistent trend. The values of SBR and SNR under the condition of Ar was higher than those in air condition, and a reverse trend was presented by the value of RSD. The results indicated that the detection ability of LIBS and the stability of detection signal under the condition of Ar were superior to those in air condition. Comparing the three spectral lines of Cd, we found that the signal of Cd II 214.44 nm was weak, while the signals of the other two lines were relatively strong, with a high value of SBR in Cd II 226.5 nm and a high value of SNR in Cd II 228.8 nm. However, the value of RSD for Cd II 226.5 nm was large. After a comprehensive comparison, Cd II 228.8 nm was regarded as the most suitable for subsequent analysis.
3.3. Quantitative Determination of Cd in Soil Samples
3.3.1. Quantitative Determination of Cd Based on Univariate Models
Before modeling, sample division was firstly conducted. Three samples of each content were assigned for calibration, and the rest was used for prediction. Thus, all soil samples were divided into a calibration set (30 for quantitative analysis under the condition of air and Ar, respectively) and a predication set (20 for quantitative analysis under the condition of air and Ar, respectively) with a ratio close to 2:1. Then, univariate models of peak intensity and Cd content for three Cd spectral lines were established by means of calibration curve. It was found that there was no obvious linear relationship between the spectral intensities of Cd II 214.44 nm and Cd II 226.5 nm and the corresponding Cd concentration in soil samples. The results were similar to the previous study of Li et al. [63,64], which might be due to the matrix effect of soil. Therefore, only Cd II 228.8 nm was selected for analysis in this work.
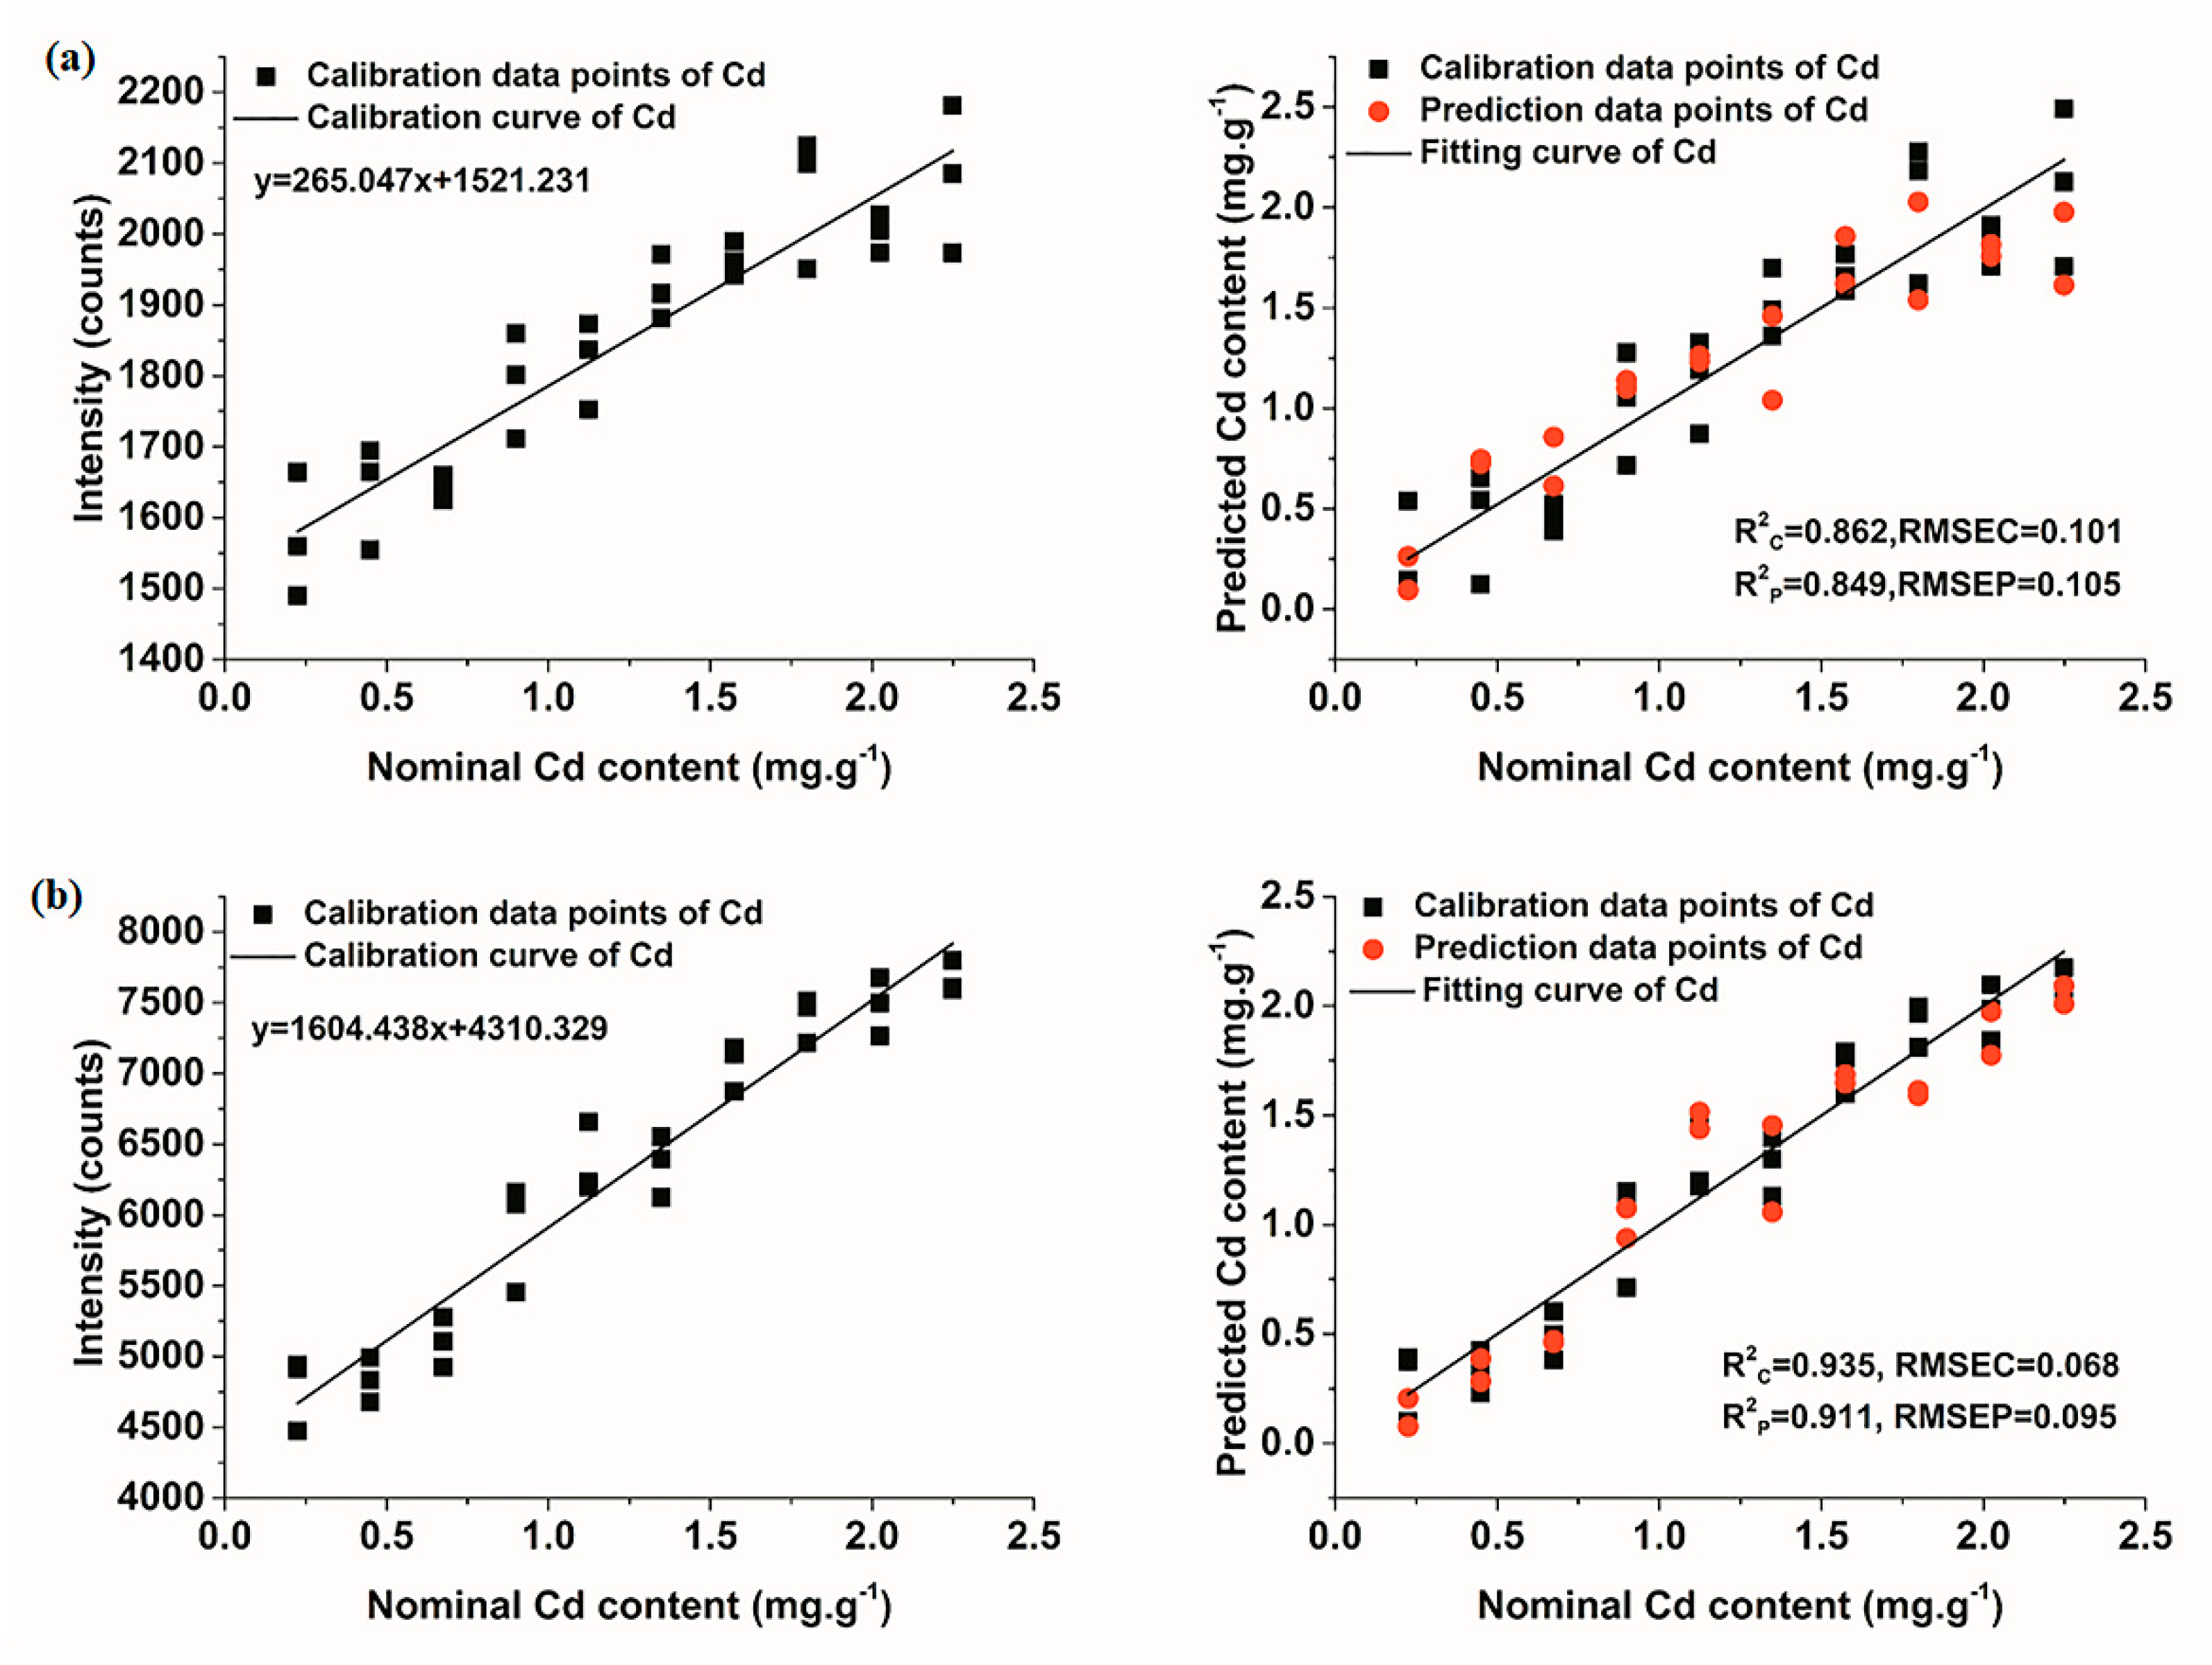
Figure 5 shows the results of univariate models of Cd II 228.8 nm. Calibration curves of Cd in Figure 5 were firstly fitted using the calibration set, and the predicted content of Cd could be obtained according to the formula of fitting curve. It was obvious that the performance of univariate model under the condition of Ar was better than that in air condition, with R2 in both calibration and prediction sets above 0.9. Besides, the values of RMSEC and RMSEP in the model under the condition of Ar were lower than those in air condition. In addition, according to Equation (2) mentioned above and the slope of calibration curve in Figure 5, the LOD of Cd could be calculated. Under the condition of air, the LOD of Cd in soil samples was 87.1 ± 2.8 ppm, while it was 40.6 ± 0.4 ppm under the condition of Ar. It was apparent that Ar environment could enhance the elemental signal, and meanwhile improve the quantitative detection ability of LIBS for Cd.
3.3.2. Quantitative Determination of Cd Based on Multivariate Models
Due to complex matrix effects of the soil and the rich spectral emission lines of elements, some important information might be lost in univariate analysis, affecting the accuracy of quantitative analysis. In contrast, the multivariate analysis method can effectively reduce the influence of matrix effects, and make full use of the spectral information to improve the accuracy and repeatability of quantitative analysis. Thus, multivariate analysis models including PLSR and LS-SVM, based on the whole collected band (211.92–232.90 nm), were built to quantitatively analyze Cd content in soil samples under the condition of air and Ar. In addition, variables with great contribution in the whole collected data set are conducive to the PLSR and SVM models. Since scores, x and y loadings, and regression coefficient reflect the contribution of the variable, variables with large value of these parameters played an important role in PLSR and SVM analysis. Furthermore, the sample partitioning method was the same as that used in univariate models.
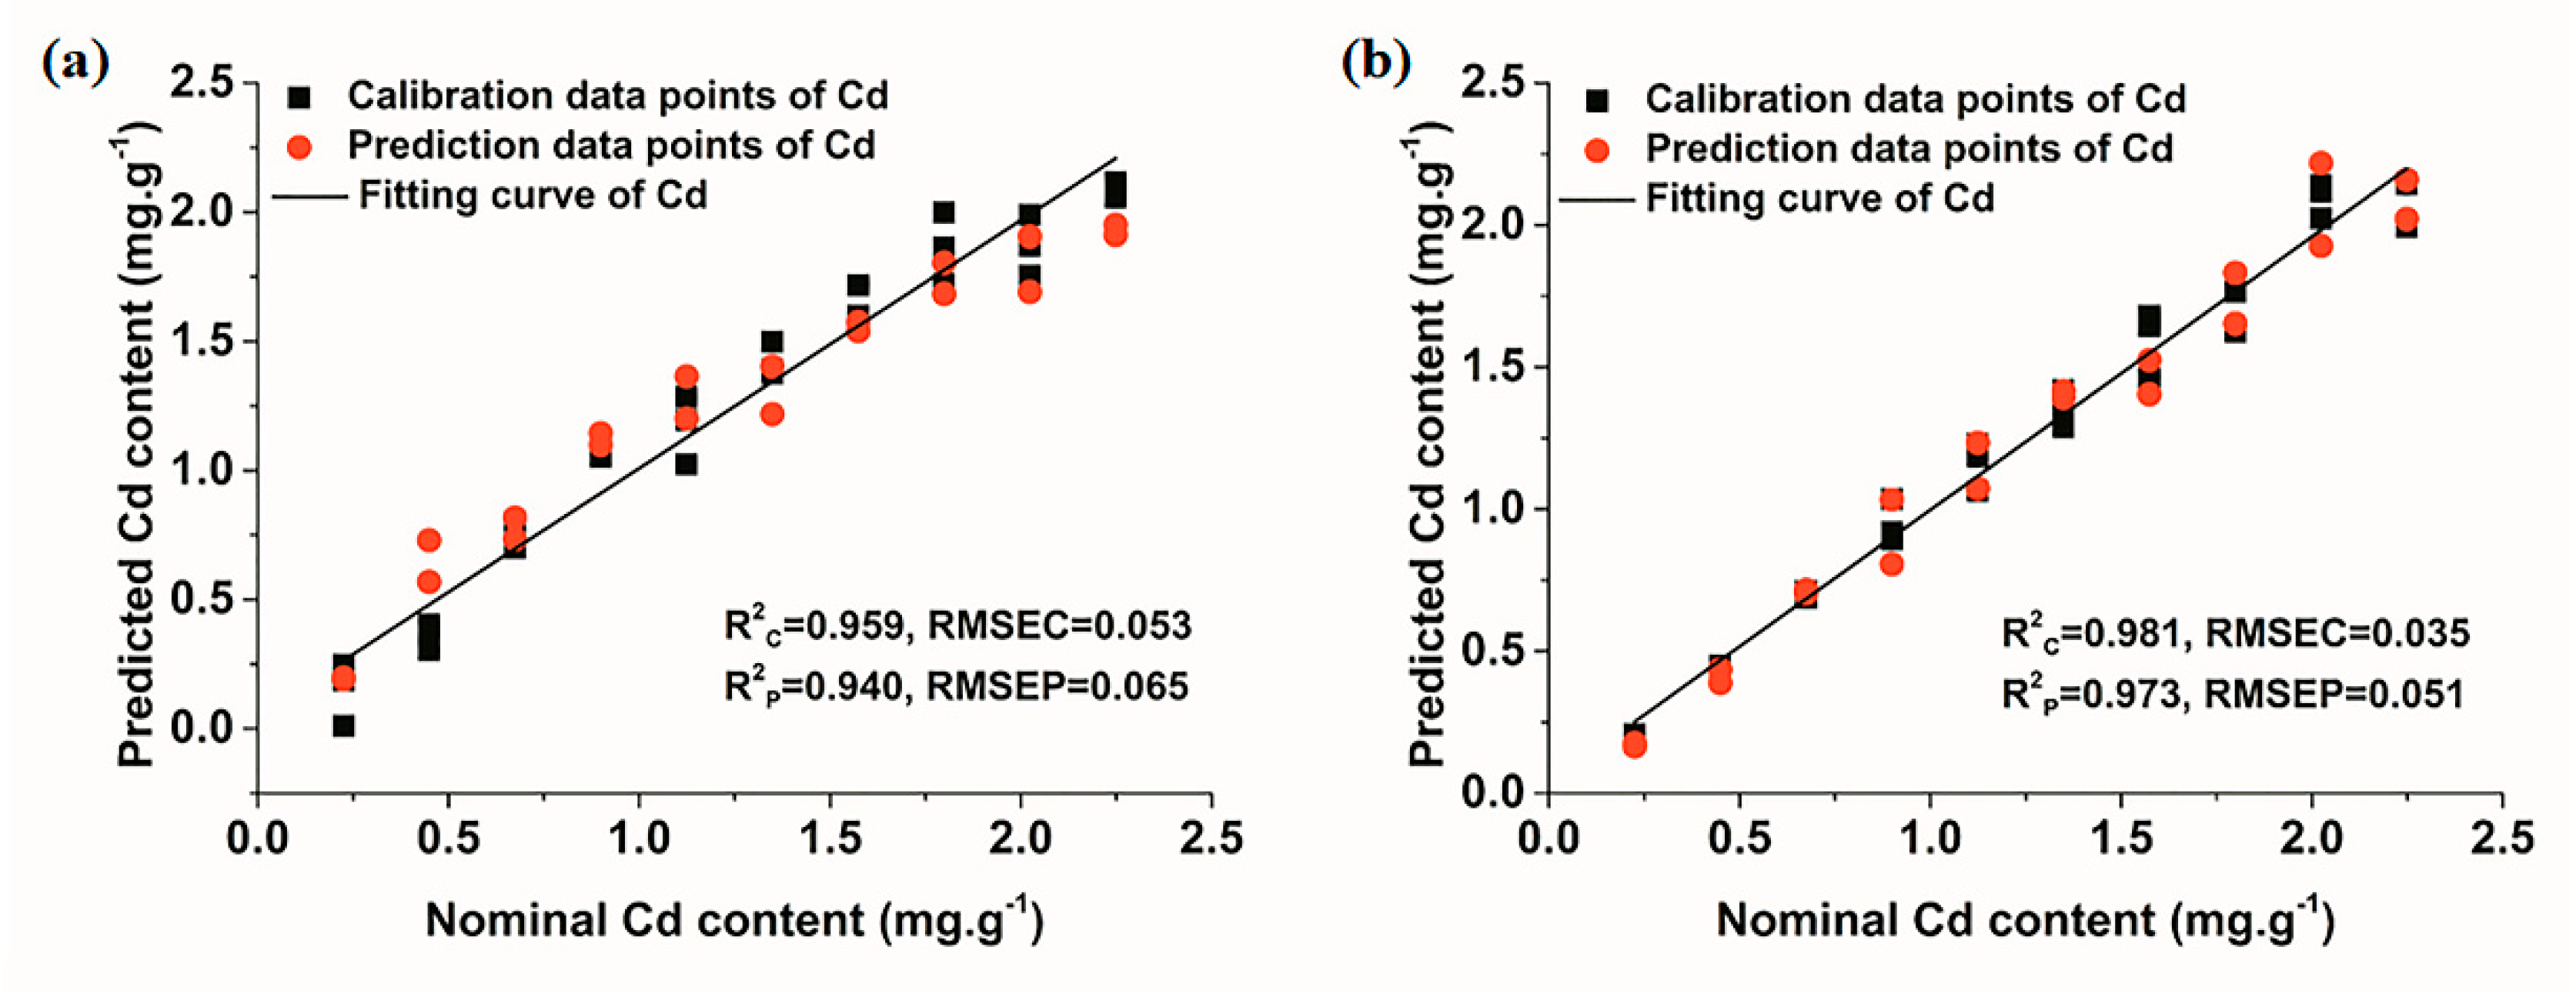
Calibration and prediction results of the PLSR model are given in Figure 6. It was observed that all data points fitted well no matter in the conditions of air or Ar, with all R2 being greater than 0.94. Furthermore, it was worth noting that the model performance under the condition of Ar was slightly better than that in air condition, with R2 in both calibration and prediction sets over 0.97. Judging from the R2 of the model, the enhancement effect of Ar on the quantitative analysis of LIBS was not significant. This might arise from the fact that the quantitative prediction of the model was already very good under the condition of air, so the model performance was more difficult to increase despite the use of Ar for signal enhancement. Besides, according to Equation (4) and the regression vector of the PLSR model that displayed directly in the software of Unscrambler × 10.1, the LOD of PLSR for Cd under the conditions of air and Ar were 14.79 ± 0.47 ppm and 7.17 ± 0.17 ppm, respectively. In terms of detection sensitivity, the enhancement effect of Ar on the quantitative analysis of LIBS was very obvious. The elemental detection sensitivity was reduced by approximately half in the condition of Ar. In general, the results demonstrated the feasibility of quantitative detection of Cd by LIBS coupled with the PLSR model in the condition of Ar.
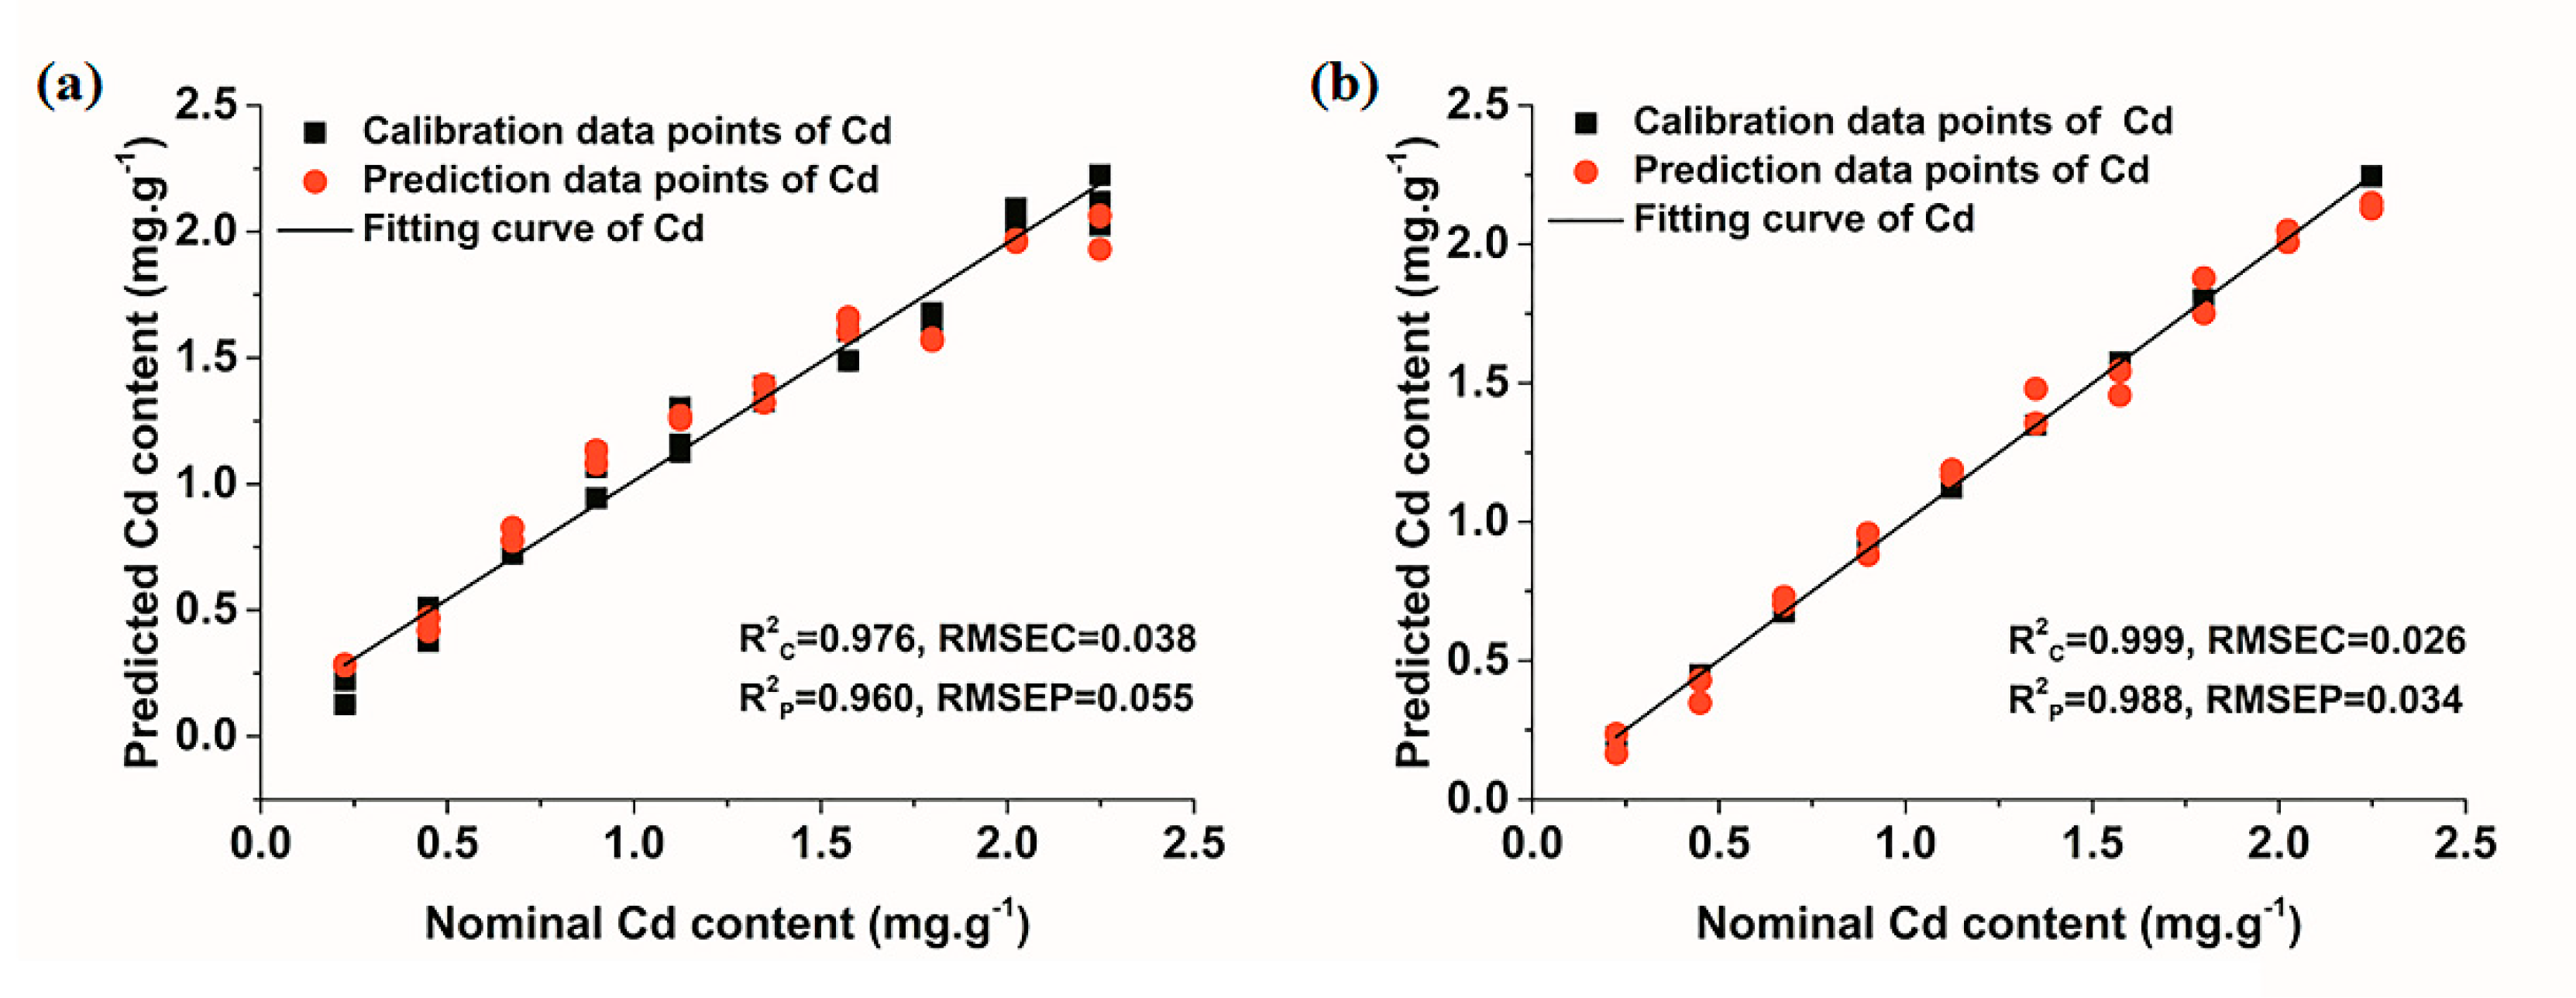
Figure 7 shows the results of LS-SVM models for the quantitative determination of Cd in soil. The good fitting result of all data points was obtained. R2 in the prediction set under both air and Ar conditions were greater than 0.96. In particular, the model performance under Ar condition was perfect, with R2 in calibration and prediction sets reaching 0.999 and 0.988, respectively. However, although the model under Ar condition performed well, it was only slightly better than that under air condition, which was similar to the results of PLSR models. As for the LOD of LS-SVM model, its calculation method remained to be further studied. On the whole, the results indicated that LIBS combined with the LS-SVM model had a reliable prediction power for quantitative analysis of Cd in soil. Moreover, signals collected in Ar condition were more suitable for the on-line detection of Cd content in soil with an improved accuracy.
3.3.3. Comparison of Univariate and Multivariate Analysis Models
In order to evaluate the reliability of the detection performance of LIBS under both air and Ar conditions, we compared the results of three models, and they are summarized in Table 1. It was obvious that R2 of LS-SVM models under both air and Ar conditions were higher than that of the PLSR models and univariate models, and the trend was the opposite for the value of RMSEC and RMSEP. The LS-SVM model based on the spectra collected in the condition of Ar obtained the best result, with a high prediction accuracy close to one. As for the sensitivity of the model, compared with univariate models, Cd detection limits of PLSR models had been improved. In addition, the improving effect of Ar on the prediction accuracy of the univariate model was better than that of the other two models, indicating that Ar was more effective when the model had a relativity poor prediction performance. Therefore, it could be concluded that both chemometrics methods and signal enhancement techniques had influence on the quantitative detection performance of LIBS. Reasonable combination of chemometrics methods and signal enhancement techniques could greatly improve the LIBS quantitative detection capability. In this case, LIBS combined with the LS-SVM model and the signal enhancement technique of Ar realized fast and accurate detection of Cd content in soil. This work offered a potential method for the detection of heavy metals, and it could further provide guidance for environmental monitoring.
3.4. The Influence Principle of Ar on LIBS Analysis
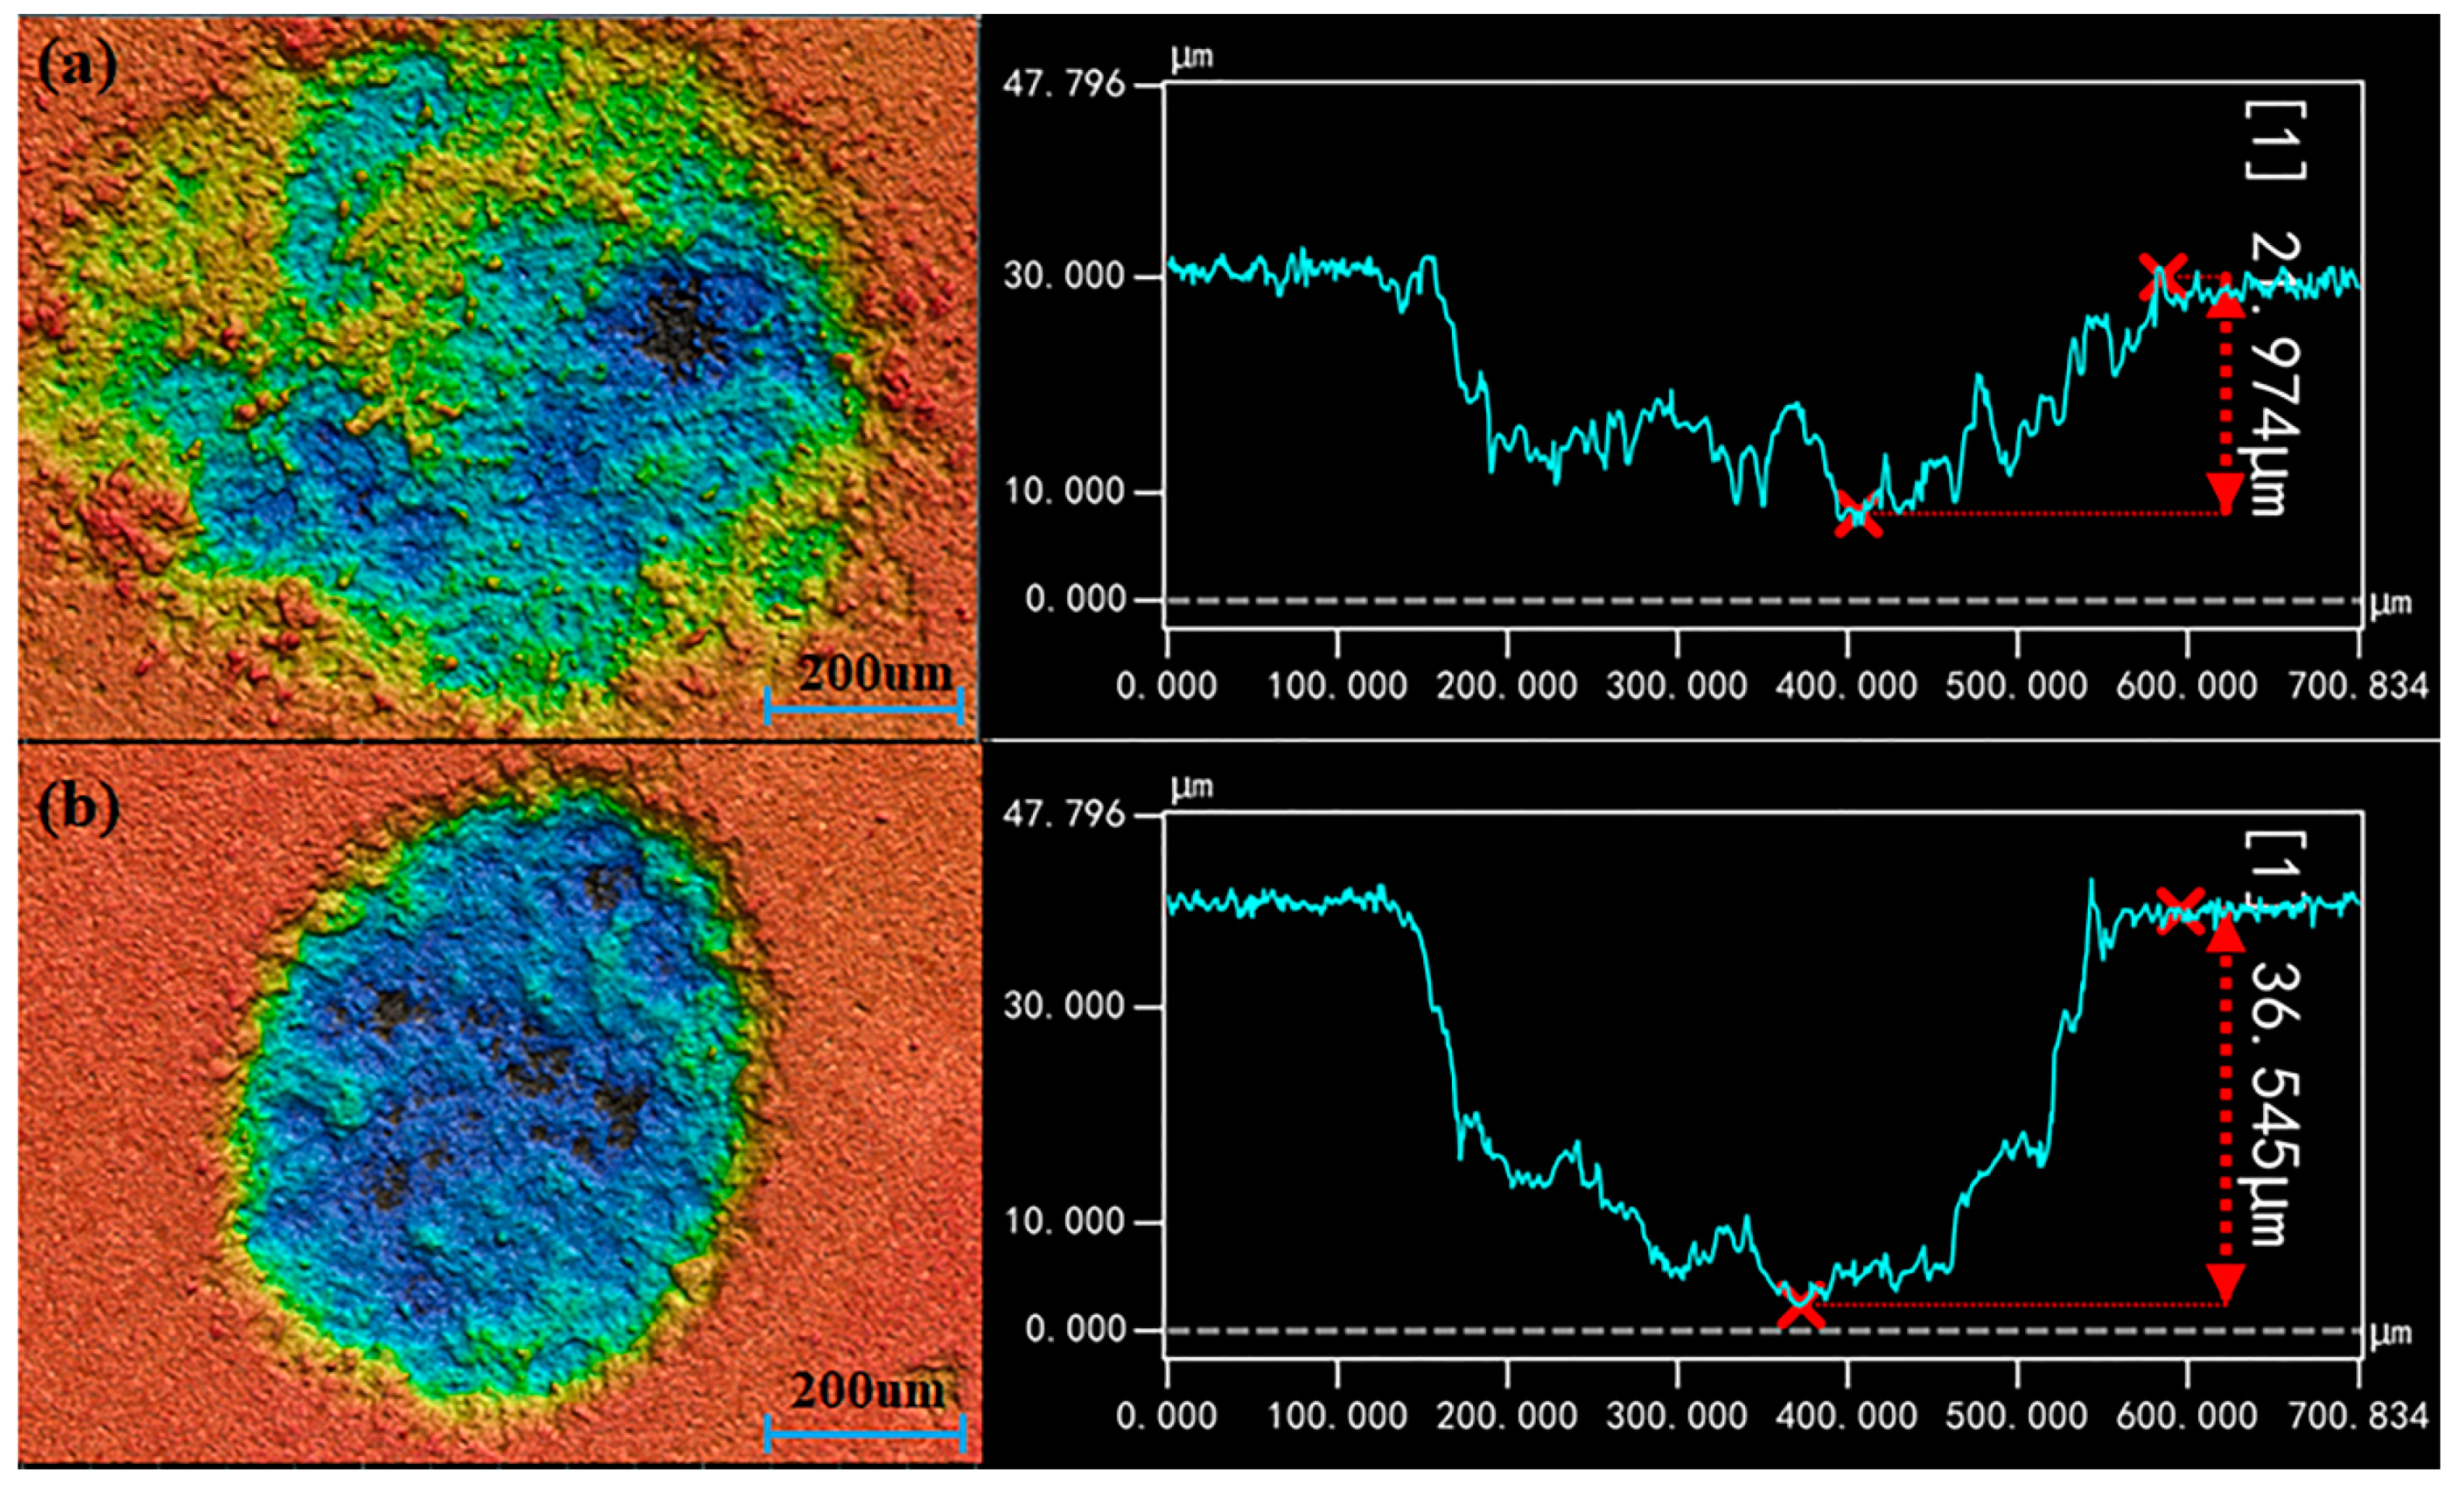
Since LIBS elemental quantitative detection is based on the plasma generated from the laser ablation of samples, shapes of ablation craters were scanned by a three-dimensional contour scanner (VK-X-1000, Keyence, Osaka, Japan) to further analyze the effect of Ar on LIBS analysis. Multiple shots for each point of each sample were performed. It was found that the morphology of the ablation craters were approximately the same under the same experimental conditions, and the trend of parameters increasing with concentration were also consistent under Ar and air conditions. In order to explore the influence of Ar and be consistent with the above analysis, one three-dimensional profiles picture of the ablation crater in the soil sample with the content of 1.12 mg·g−1 under air and Ar conditions was taken as an example for comparative analysis, respectively, and the results are shown in Figure 8. Additionally, the average profile parameters of the ablation crater are listed in Table 2. Theoretically, the energy within the focused spot of the pulsed laser satisfies the Gaussian distribution. The energy density is the largest at the ablation center and gradually decreases toward the periphery [65]. Therefore, the target removal effect at the center of the ablation crater is the most obvious, and the overall appearance is a crater that is deepest at the center and get shallower outwards [66]. It was seen from Figure 8 that the morphology of ablated craters under both air and Ar conditions showed the state described above. However, they were not regular center deep shallow craters, and they also contained a variety of laser-induced micro-morphologies. It was also observed that the surface of the ablation craters produced many convex topographies, which was mainly due to the recoil effect of the target. When the target was severely heated by the laser radiation, the material near the ablation center would be lashed, and the backlash effect of the material made the surface of the ablation crater deformed [67]. As seen in Figure 8, the ablation craters under Ar conditions were deeper and the edges were smoother and more regular than those under air condition. This result was mainly credited to the flowing gas in the Ar condition, since a gas jet with a fixed flow rate could have produced a reproducible pressure field that overrode plasma fluctuations of the sample surface [29]. Thus, it could be concluded that the flowing Ar gas have effectively removed bubbles and make the surface of ablation crater smoother. From Table 2, the average volume, and maximum depth of ablation craters under Ar condition were larger than those under air condition, while the cross-sectional area was smaller than that in air. The results proved that sample ablation quality was higher under Ar condition, and it might be credited to the thermal properties of Ar. According to the Reference [28,68,69], the ionization potential of Ar is lower than that of air, so the ionization probability of Ar is higher than that of air. Thus, Ar is more easily ionized, resulting in greater electron density to promote plasma formation. Besides, the expansion of the plasma was limited under Ar condition due to the relatively large density of Ar. Moreover, the lower thermal conductivity of Ar caused high temperature of the generated plasma, leading to an increase in ablation quality [69]. In general, these three effects combined to make the LIBS signal stronger in Ar condition, which improved the quantitative analysis performance of Cd in soil.
4. Conclusions
This research revealed that LIBS combined with chemomentrics methods in Ar condition had a perfect ability to determine Cd content in soil. Several aspects including spectral intensity, System performance, quantitative analysis models of Cd under air and Ar conditions were compared. It was proved that LIBS in Ar condition acquired a higher spectral intensity and obtained a better system performance. Besides, the results of quantitative analysis of Cd in Ar condition were better than those in air condition. Moreover, LS-SVM models were superior to the other two models. Thus, the LS-SVM model in the condition of Ar showed perfect ability in the quantitative detection of Cd in soil, with R2 in both calibration and prediction sets more than 0.98. In addition, the influence principle of Ar on LIBS detection of Cd was analysed based on the three-dimensional profile of the ablation pit. It turned out that Ar could make laser focus more concentrated and ablate more quality of samples, which improved the LIBS signal intensity and quantitative detection ability. The overall results demonstrated that LIBS combined with the chemometrics method of LS-SVM in Ar condition could be a great tool for quantitative analysis of Cd in soil. With the perfect predictive performance, it was able to provide guidance for environmental monitoring. Additionally, portable instruments based on the method could be developed for further application.
Author Contributions
X.L., F.L. and Y.H. conceived and designed the experiment; X.L. and W.H. performed the experiments; X.L., J.P., T.S. and contributed to data analysis; X.L. and F.L. analyzed the data and wrote the whole paper; all authors reviewed the manuscript.
Funding
This research was funded by National Key Research and Development Program of China (2017YFD0701002), Natural Science Foundation of China (61605173), and Key Research and Development Program of Ningxia Hui Autonomous Region (2017BY067).
Acknowledgments
The certified reference material (CRM) of soil tested in this research was provided by National Institute of Metrology, China.
Conflicts of Interest
The authors declare no conflict of interest.
References
- Liess, M.; Schmidt, J.; Glaser, B. Improving the spatial prediction of soil organic carbon stocks in a complex tropical mountain landscape by methodological specifications in machine learning approaches. PLoS ONE 2016, 11, e0153673. [Google Scholar] [CrossRef] [PubMed]
- Nie, P.; Dong, T.; He, Y.; Qu, F. Detection of soil nitrogen using near infrared sensors based on soil pretreatment and algorithms. Sensors 2017, 17, 1102. [Google Scholar] [CrossRef] [PubMed]
- Kumar, S.; Singh, R.P. Spatial distribution of soil nutrients in a watershed of Himalayan landscape using terrain attributes and geostatistical methods. Environ. Earth Sci. 2016, 75, 473. [Google Scholar] [CrossRef]
- Fu, J.; Zhou, Q.; Liu, J.; Liu, W.; Wang, T.; Zhang, Q.; Jiang, G. High levels of heavy metals in rice (Oryza sativa L.) from a typical e-waste recycling area in southeast China and its potential risk to human health. Chemosphere 2008, 71, 1269–1275. [Google Scholar] [CrossRef] [PubMed]
- Yang, Q.W.; Lan, C.Y.; Wang, H.B.; Zhuang, P.; Shu, W.S. Cadmium in soil–rice system and health risk associated with the use of untreated mining wastewater for irrigation in Lechang, China. Agric. Water Mgmt. 2006, 84, 147–152. [Google Scholar] [CrossRef]
- Santos, D.; Nunes, L.C.; Trevizan, L.C.; Godoi, Q.; Leme, F.O.; Braga, J.W.B.; Krug, F.J. Evaluation of laser induced breakdown spectroscopy for cadmium determination in soils. Spectrochim. Acta B 2009, 64, 1073–1078. [Google Scholar] [CrossRef]
- Zuckerman, J.A. IARC monographs on the evaluation of carcinogenic risks to humans. J. Clin. Pathol. 1995, 48, 691. [Google Scholar] [CrossRef]
- Johri, N.; Jacquillet, G.; Unwin, R. Heavy metal poisoning: The effects of cadmium on the kidney. Biometals 2010, 23, 783–792. [Google Scholar] [CrossRef] [PubMed]
- Basiri, S.; Moinfar, S.; Hosseini, M.R.M. Determination of as(iii) using developed dispersive liquid–liquid microextraction and flame atomic absorption spectrometry. Int. J. Environ. Anal. Chem. 2011, 91, 1453–1465. [Google Scholar] [CrossRef]
- Momen, A.A.; Zachariadis, G.A.; Anthemidis, A.N.; Stratis, J.A. Use of fractional factorial design for optimization of digestion procedures followed by multi-element determination of essential and non-essential elements in nuts using icp-oes technique. Talanta 2007, 71, 443–451. [Google Scholar] [CrossRef] [PubMed]
- Lin, J.; Liu, Y.; Yang, Y.; Hu, Z. Calibration and correction of LA-ICP-MS and LA-MC-ICP-MS analyses for element contents and isotopic ratios. Solid Earth Sci. 2016, 1, 5–27. [Google Scholar] [CrossRef]
- Yu, K.; Zhao, Y.; Liu, F.; He, Y. Laser-induced breakdown spectroscopy coupled with multivariate chemometrics for variety discrimination of soil. Sci. Rep. 2016, 6, 27574. [Google Scholar] [CrossRef] [PubMed]
- Peng, J.; Liu, F.; Zhou, F.; Song, K.; Zhang, C.; Ye, L.; He, Y. Challenging applications for multi-element analysis by laser-induced breakdown spectroscopy in agriculture: A review. TrAC Trends Anal. Chem. 2016, 85, 260–272. [Google Scholar] [CrossRef]
- Peng, J.; He, Y.; Ye, L.; Shen, T.; Liu, F.; Kong, W.; Liu, X.; Zhao, Y. Moisture influence reducing method for heavy metals detection in plant materials using laser-induced breakdown spectroscopy: A case study for chromium content detection in rice leaves. Anal. Chem. 2017, 89, 7593–7600. [Google Scholar] [CrossRef] [PubMed]
- Yu, X.; Li, Y.; Gu, X.; Bao, J.; Yang, H.; Sun, L. Laser-induced breakdown spectroscopy application in environmental monitoring of water quality: A review. Environ. Monit. Assess. 2014, 186, 8969–8980. [Google Scholar] [CrossRef] [PubMed]
- Canel, T.; Demir, P.; Kacar, E.; Genc Oztoprak, B.; Akman, E.; Gunes, M.; Demir, A. Optimization of parameters for depth resolution of galvanized steel by libs technique. Opt. Laser Technol. 2013, 54, 257–264. [Google Scholar] [CrossRef]
- Rehse, S.J.; Salimnia, H.; Miziolek, A.W. Laser-induced breakdown spectroscopy (LIBS): An overview of recent progress and future potential for biomedical applications. J. Med. Eng. Technol. 2012, 36, 77–89. [Google Scholar] [CrossRef] [PubMed]
- Allegrini, F.; Olivieri, A.C. Iupac-consistent approach to the limit of detection in partial least-squares calibration. Anal. Chem. 2014, 86, 7858–7866. [Google Scholar] [CrossRef] [PubMed]
- Nicolodelli, G.; Senesi, G.S.; Romano, R.A.; de Oliveira Perazzoli, I.L.; Milori, D.M.B.P. Signal enhancement in collinear double-pulse laser-induced breakdown spectroscopy applied to different soils. Spectrochim. Acta B 2015, 111, 23–29. [Google Scholar] [CrossRef]
- Tognoni, E.; Cristoforetti, G. Basic mechanisms of signal enhancement in ns double-pulse laser-induced breakdown spectroscopy in a gas environment. J. Anal. At. Spectrom. 2014, 29, 1318–1338. [Google Scholar] [CrossRef]
- Li, Y.; Tian, D.; Ding, Y.; Yang, G.; Wang, C.; Han, X. A review of laser-induced breakdown spectroscopy signal enhancement. Appl. Spectrosc. Rev. 2017, 53, 1–35. [Google Scholar] [CrossRef]
- Dell’Aglio, M.; Alrifai, R.; De Giacomo, A. Nanoparticle enhanced laser induced breakdown spectroscopy (nelibs), a first review. Spectrochim. Acta B 2018, 148, 105–112. [Google Scholar] [CrossRef]
- De Giacomo, A.; Dell’Aglio, M.; Gaudiuso, R.; Koral, C.; Valenza, G. Perspective on the use of nanoparticles to improve libs analytical performance: Nanoparticle enhanced laser induced breakdown spectroscopy (nelibs). J. Anal. Atom. Spectrom. 2016, 31, 1566–1573. [Google Scholar] [CrossRef]
- Popov, A.M.; Colao, F.; Fantoni, R. Spatial confinement of laser-induced plasma to enhance LIBS sensitivity for trace elements determination in soils. J. Anal. Atom. Spectrom. 2010, 25, 2491–2494. [Google Scholar] [CrossRef]
- Guo, L.; Zhang, B.; He, X.; Li, C.; Zhou, Y.; Wu, T.; Park, J.B.; Zeng, X.; Lu, Y. Optimally enhanced optical emission in laser-induced breakdown spectroscopy by combining spatial confinement and dual-pulse irradiation. Opt. Express 2012, 20, 1436–1443. [Google Scholar] [CrossRef] [PubMed] [Green Version]
- Yip, W.L.; Cheung, N.H. Analysis of aluminum alloys by resonance-enhanced laser-induced breakdown spectroscopy: How the beam profile of the ablation laser and the energy of the dye laser affect analytical performance. Spectrochim. Acta B 2009, 64, 315–322. [Google Scholar] [CrossRef]
- Goueguel, C.; Laville, S.; Vidal, F.; Sabsabi, M.; Chaker, M. Investigation of resonance-enhanced laser-induced breakdown spectroscopy for analysis of aluminium alloys. J. Anal. Atom. Spectrom. 2010, 25, 246–253. [Google Scholar] [CrossRef]
- Chen, K.; Lu, J.; Li, J. Real-time, quantitative analysis of multi-elements in liquid steel by LIBS. Spectrosc. Spectr. Anal. 2011, 31, 823–826. [Google Scholar]
- Kim, C.-K.; In, J.-H.; Lee, S.-H.; Jeong, S. Influence of ar buffer gas on the libs signal of thin cigs films. J. Anal. At. Spectrom. 2013, 28, 460–467. [Google Scholar] [CrossRef]
- Sarkar, A.; Mishra, R.K.; Kaushik, C.P.; Wattal, P.K.; Alamelu, D.; Aggarwal, S.K. Analysis of barium borosilicate glass matrix for uranium determination by using NS-IR-LIBS in air and Ar atmosphere. Radiochim. Acta 2014, 102, 805–812. [Google Scholar] [CrossRef]
- Cheri, M.S.; Tavassoli, S.H. Quantitative analysis of toxic metals lead and cadmium in water jet by laser-induced breakdown spectroscopy. Appl. Opt. 2011, 50, 1227–1233. [Google Scholar] [CrossRef] [PubMed]
- Yao, M.; Yang, H.; Huang, L.; Chen, T.; Rao, G.; Liu, M. Detection of heavy metal Cd in polluted fresh leafy vegetables by laser-induced breakdown spectroscopy. Appl. Opt. 2017, 56, 4070–4075. [Google Scholar] [CrossRef] [PubMed]
- Jiang, T.-J.; Guo, Z.; Ma, M.-J.; Fang, L.; Yang, M.; Li, S.-S.; Liu, J.-H.; Zhao, N.-J.; Huang, X.-J.; Liu, W.-Q. Electrochemical laser induced breakdown spectroscopy for enhanced detection of cd(ii) without interference in rice on layer-by-layer assembly of graphene oxides. Electrochim. Acta 2016, 216, 188–195. [Google Scholar] [CrossRef]
- Nunes, L.C.; Júnior, D.S.; Krug, F.J. Determination of Cd, Cr and Pb in phosphate fertilizers by laser-induced breakdown spectroscopy. Spectrochim. Acta B 2014, 97, 42–48. [Google Scholar] [CrossRef]
- Yu, K.; Zhao, Y.; Liu, F.; He, Y. Laser-induced breakdown spectroscopy for determining content of Pb and Cd in soil. Trans. CSAE 2016, 32, 197–203. [Google Scholar]
- Pan, A.; Liu, L.; Lin, Z. Analysis of the Cd element in soil by laser-induced breakdown spectroscopy. Appl. Laser 2012, 32, 124–127. [Google Scholar]
- Wang, J.; Wang, J.; Craig, R. Reducing carrier phase errors with EMD-wavelet for precise GPS positioning. In Proceedings of the National Technical Meeting of the Institute of Navigation NTM, San Diego, CA, USA, 22–24 January 2007; The Institute of Navigation: Manassas, VA, USA, 2017; pp. 919–928. [Google Scholar]
- Chen, P.; Tian, D.; Qiao, S.; Yang, G. An automatic peak detection method for LIBS spectrum based on continuous wavelet transform. Spectrosc. Spectr. Anal. 2014, 34, 1969–1972. [Google Scholar]
- Sobron, P.; Wang, A.; Sobron, F. Extraction of compositional and hydration information of sulfates from laser-induced plasma spectra recorded under mars atmospheric conditions—Implications for chemcam investigations on curiosity rover. Spectrochim. Acta B 2012, 68, 1–16. [Google Scholar] [CrossRef]
- Leys, C.; Ley, C.; Klein, O.; Bernard, P.; Licata, L. Detecting outliers: Do not use standard deviation around the mean, use absolute deviation around the median. J. Exp. Soc. Psychol. 2013, 49, 764–766. [Google Scholar] [CrossRef] [Green Version]
- Peng, J.; Liu, F.; Shen, T.; Ye, L.; Kong, W.; Wang, W.; Liu, X.; He, Y. Comparative study of the detection of chromium content in rice leaves by 532 nm and 1064 nm laser-induced breakdown spectroscopy. Sensors 2018, 18, 621. [Google Scholar] [CrossRef] [PubMed]
- Nie, P.; Dong, T.; He, Y.; Xiao, S. Research on the effects of drying temperature on nitrogen detection of different soil types by near infrared sensors. Sensors 2018, 18, 391. [Google Scholar] [CrossRef] [PubMed]
- He, Y.; Xiao, S.; Nie, P.; Dong, T.; Qu, F.; Lin, L. Research on the optimum water content of detecting soil nitrogen using near infrared sensor. Sensors 2017, 17, 2045. [Google Scholar] [CrossRef] [PubMed]
- Martı́n, M.E.; Hernández, O.M.; Jiménez, A.I.; Arias, J.J.; Jiménez, F. Partial least-squares method in analysis by differential pulse polarography. Simultaneous determination of amiloride and hydrochlorothiazide in pharmaceutical preparations. Anal. Chim. Acta 1999, 381, 247–256. [Google Scholar] [CrossRef]
- Sjöström, M.; Wold, S.; Lindberg, W.; Persson, J. Å.; Martens, H. A multivariate calibration problem in analytical chemistry solved by partial least-squares models in latent variables. Anal. Chim. Acta 1983, 150, 61–70. [Google Scholar] [CrossRef]
- Geladi, P.; Kowalski, B.R. An example of 2-block predictive partial least-squares regression with simulated data. Anal. Chim. Acta 1986, 185, 19–32. [Google Scholar] [CrossRef]
- Peng, J.; Liu, F.; Kong, W.; Zhang, C.; Yu, K.; He, Y. Rapid identification of varieties of walnut powder based on laser-induced breakdown spectroscopy. Trans. ASABE 2017, 60, 19–28. [Google Scholar]
- Boqué, R.; Rius, F.X. Multivariate detection limits estimators. Chemom. Intell. Lab. 1996, 32, 11–23. [Google Scholar] [CrossRef]
- Olivieri, A.C.; Faber, N.M. Standard error of prediction in parallel factor analysis of three-way data. Chemom. Intell. Lab. 2004, 70, 75–82. [Google Scholar] [CrossRef]
- Braga, J.W.; Poppi, R.J. Figures of merit for the determination of the polymorphic purity of carbamazepine by infrared spectroscopy and multivariate calibration. J. Pharm. Sci. 2004, 93, 21–24. [Google Scholar] [CrossRef] [PubMed]
- Castro, J.P.; Pereirafilho, E.R. Twelve different types of data normalization for the proposition of classification, univariate and multivariate regression models for the direct analyses of alloys by laser-induced breakdown spectroscopy (LIBS). J. Anal. Atom. Spectrom. 2016, 31, 2005–2014. [Google Scholar] [CrossRef]
- Valderrama, P.; Braga, J.W.; Poppi, R.J. Variable selection, outlier detection, and figures of merit estimation in a partial least-squares regression multivariate calibration model. A case study for the determination of quality parameters in the alcohol industry by near-infrared spectroscopy. J. Agric. Food Chem. 2007, 55, 8331–8338. [Google Scholar] [CrossRef] [PubMed]
- Braga, J.W.B.; Trevizan, L.C.; Nunes, L.C.; Rufini, I.A.; Santos, D., Jr.; Krug, F.J. Comparison of univariate and multivariate calibration for the determination of micronutrients in pellets of plant materials by laser induced breakdown spectrometry. Spectrochim. Acta B 2010, 65, 66–74. [Google Scholar] [CrossRef]
- Yin, W.; Zhang, C.; Zhu, H.; Zhao, Y.; He, Y. Application of near-infrared hyperspectral imaging to discriminate different geographical origins of Chinese wolfberries. PLoS ONE 2017, 12, e0180534. [Google Scholar] [CrossRef] [PubMed]
- Wu, D.; He, Y.; Feng, S.; Sun, D.-W. Study on infrared spectroscopy technique for fast measurement of protein content in milk powder based on ls-svm. J. Food Eng. 2008, 84, 124–131. [Google Scholar] [CrossRef]
- Devos, O.; Ruckebusch, C.; Durand, A.; Duponchel, L.; Huvenne, J.-P. Support vector machines (SVM) in near infrared (NIR) spectroscopy: Focus on parameters optimization and model interpretation. Chemom. Intell. Lab. 2009, 96, 27–33. [Google Scholar] [CrossRef]
- Li, S.X.; Zhang, Y.J.; Zeng, Q.Y.; Li, L.F.; Guo, Z.Y.; Liu, Z.M.; Xiong, H.L.; Liu, S.H. Potential of cancer screening with serum surface-enhanced Raman spectroscopy and a support vector machine. Laser Phys. Lett. 2014, 11, 065603. [Google Scholar] [CrossRef]
- Liu, F.; Nie, P.; Huang, M.; Kong, W.; He, Y. Nondestructive determination of nutritional information in oilseed rape leaves using visible/near infrared spectroscopy and multivariate calibrations. Sci. China Inf. Sci. 2011, 54, 598–608. [Google Scholar] [CrossRef]
- Liu, F.; He, Y.; Sun, G. Determination of protein content of auricularia auricula using near infrared spectroscopy combined with linear and nonlinear calibrations. J. Agric. Food Chem. 2009, 57, 4520–4527. [Google Scholar] [CrossRef] [PubMed]
- Balabin, R.M.; Lomakina, E.I. Support vector machine regression (SVR/LS-SVM)—An alternative to neural networks (ANN) for analytical chemistry? Comparison of nonlinear methods on near infrared (NIR) spectroscopy data. Analyst 2011, 136, 1703–1712. [Google Scholar] [CrossRef] [PubMed]
- Chauchard, F.; Cogdill, R.; Roussel, S.; Roger, J.M.; Bellon-Maurel, V. Application of LS-SVM to non-linear phenomena in NIR spectroscopy: Development of a robust and portable sensor for acidity prediction in grapes. Chemom. Intell. Lab. 2004, 71, 141–150. [Google Scholar] [CrossRef]
- Haider, Z.; Munajat, Y.B.; Kamarulzaman, R.; Shahami, N. Comparison of single pulse and double simultaneous pulse laser induced breakdown spectroscopy. Anal. Lett. 2014, 48, 308–317. [Google Scholar] [CrossRef]
- Li, X.; Wang, Z.; Fu, Y.; Li, Z.; Liu, J.; Ni, W. Application of a spectrum standardization method for carbon analysis in coal using laser-induced breakdown spectroscopy (LIBS). Appl. Spectrosc. 2014, 68, 955–966. [Google Scholar] [CrossRef] [PubMed]
- Li, X.; Wang, Z.; Fu, Y.; Li, Z.; Ni, W. Wavelength dependence in the analysis of carbon content in coal by nanosecond 266 nm and 1064 nm laser induced breakdown spectroscopy. Plasma Sci. Technol. 2015, 17, 621–624. [Google Scholar] [CrossRef]
- Wang, Z.Y.; Liu, J.T.; Hirak, D.M.; Weckman, D.C.; Kerr, H.W. Determining the spot size and gaussian distribution coefficient of pulsed laser beams using kapton films. J. Laser Appl. 1993, 5, 5–12. [Google Scholar] [CrossRef]
- Liu, D. Investigations of the Process of Laser Ablation on Titannium and the Properties of the Plasma. Ph.D. Thesis, Shandong Normal University, Jinan, China, June 2016. [Google Scholar]
- Lida, Y. Atomic emission characteristics of laser-induced plasmas in an argon atmosphere at reduced pressure. Appl. Spectrosc. 1989, 43, 229–234. [Google Scholar]
- Son, J.G.; Choi, S.C.; Oh, M.K.; Kang, H.; Suk, H.; Lee, Y. Application of pulsed buffer gas jets for the signal enhancement of laser-induced breakdown spectroscopy. Appl. Spectrosc. 2010, 64, 1289–1297. [Google Scholar] [CrossRef] [PubMed]
- Li, H. DP-LIBS for the Research and Implementation of Carbon Content Detection in Iron-Based Alloy. Master’s Thesis, Changchun University of Technology, Changchun, China, April 2015. [Google Scholar]
Sample Availability: Samples of the soil are not available from the authors. |
Figure 1.
Schematic diagram of LIBS system for soil samples.

Figure 2.
Average spectra of Cd-containing soil samples with medium content in the conditions of air and Argon (Ar).
Figure 2.
Average spectra of Cd-containing soil samples with medium content in the conditions of air and Argon (Ar).
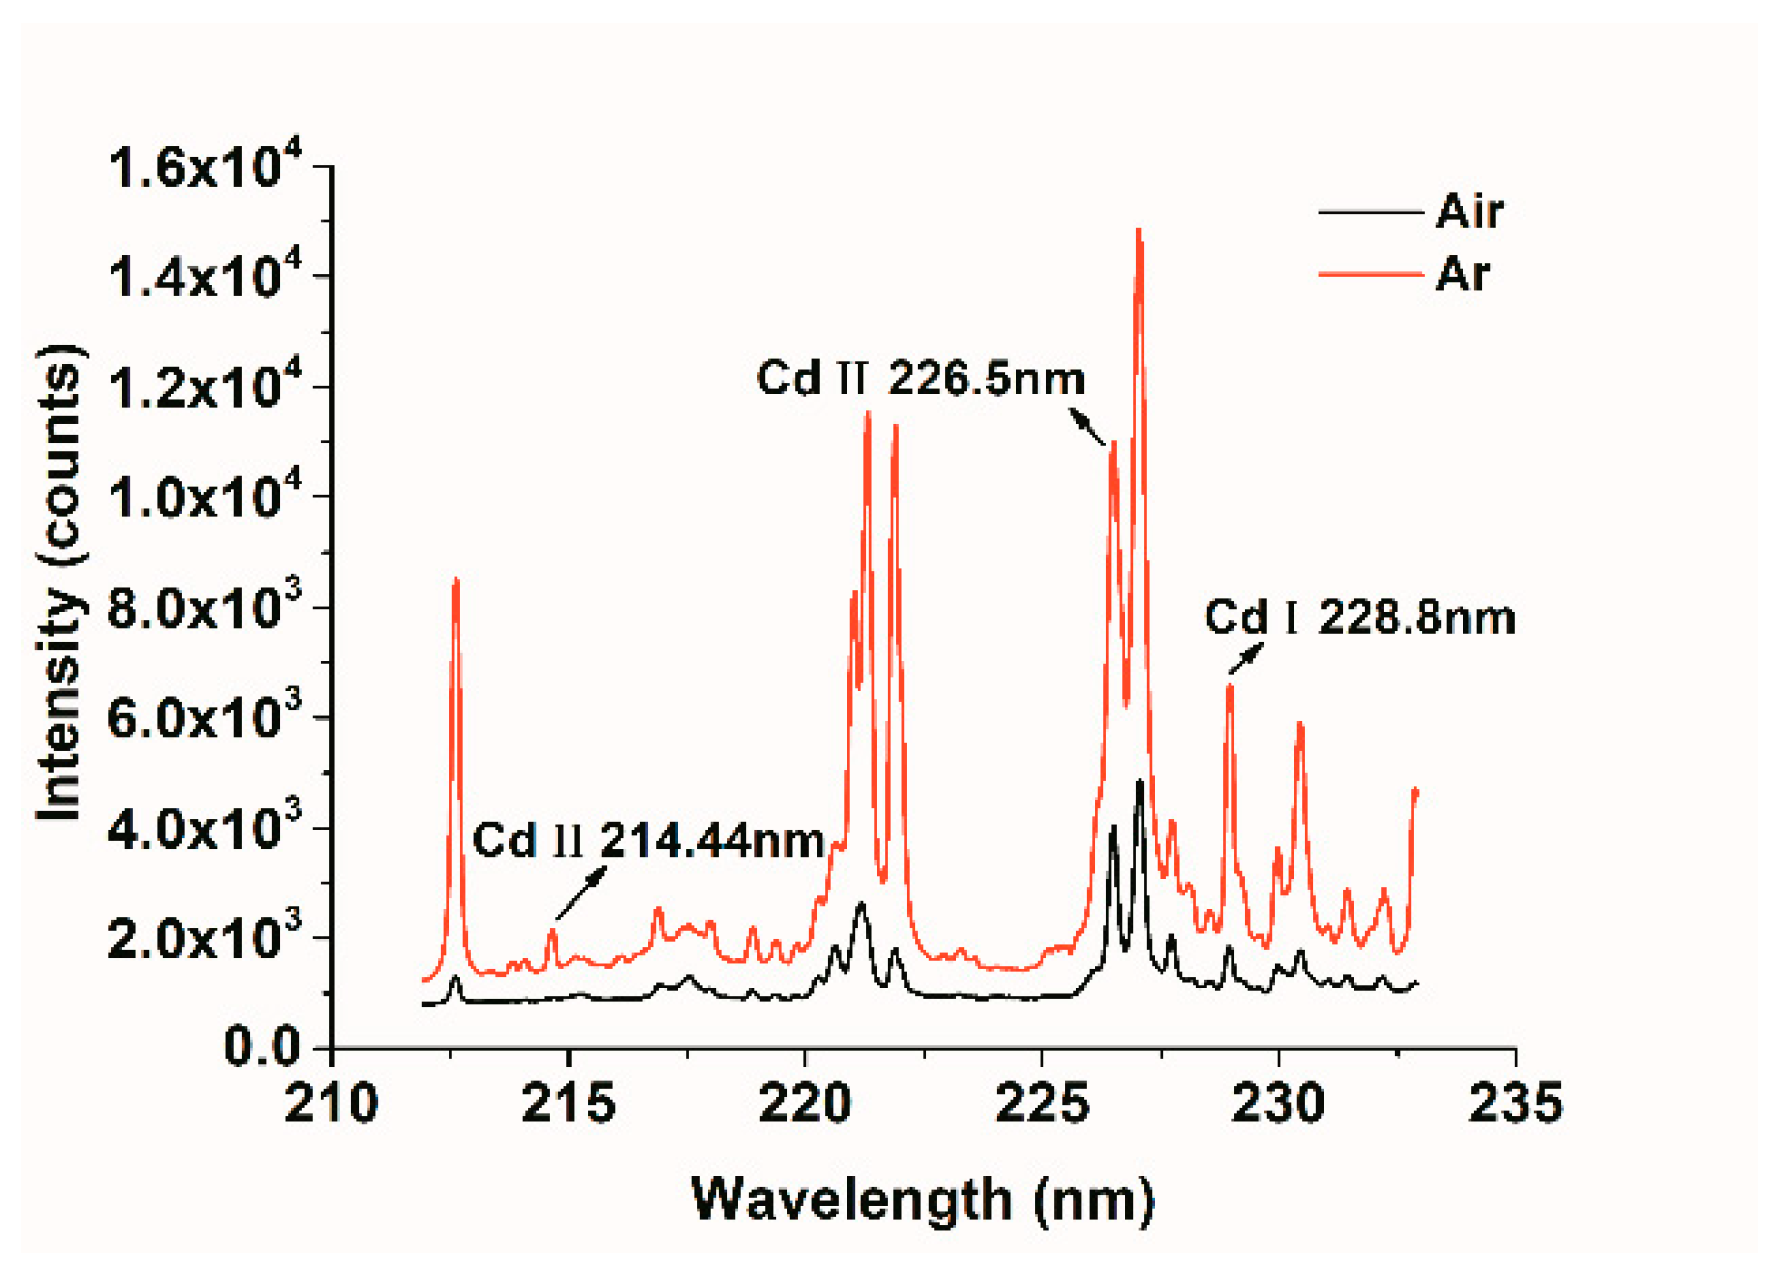
Figure 3.
The curve of spectral intensities with Cd contents under the collection conditions of air and Ar. (a) Cd II 214.44 nm in air and Ar; (b) Cd II 226.5 nm in air and Ar; and (c) Cd II 228.8 nm in air and Ar.
Figure 3.
The curve of spectral intensities with Cd contents under the collection conditions of air and Ar. (a) Cd II 214.44 nm in air and Ar; (b) Cd II 226.5 nm in air and Ar; and (c) Cd II 228.8 nm in air and Ar.

Figure 4.
Comparison of system performance under the conditions of air and Ar. (a) signal-to-background ratio (SBR); (b) signal-to-noise ratio (SNR); (c) relative standard deviation (RSD).
Figure 4.
Comparison of system performance under the conditions of air and Ar. (a) signal-to-background ratio (SBR); (b) signal-to-noise ratio (SNR); (c) relative standard deviation (RSD).

Figure 5.
Univariate calibration curves and models of Cd under different conditions (a) air; and (b) Ar.
Figure 5.
Univariate calibration curves and models of Cd under different conditions (a) air; and (b) Ar.

Figure 6.
PLSR models of Cd under different conditions. (a) air; and (b) Ar.

Figure 7.
LS-SVM models of Cd under different conditions. (a) air; (b) Ar.

Figure 8.
Comparison of the three-dimensional profile of the ablation crater. (a) air; (b) Ar.


Table 1.
Comparison of three chemometrics models of Cd under air and Ar conditions.
| Data | Model | Parameter | R2C | RMSEC | R2P | RMSEP |
|---|---|---|---|---|---|---|
| Univariate | - | 0.862 | 0.101 | 0.849 | 0.105 | |
| Air | PLS-DA | 3 | 0.959 | 0.053 | 0.940 | 0.065 |
| LS-SVM | (4.359 × 10⁷, 2.857 × 10⁷) | 0.976 | 0.038 | 0.960 | 0.055 | |
| Univariate | - | 0.935 | 0.068 | 0.911 | 0.095 | |
| Ar | PLS-DA | 2 | 0.981 | 0.035 | 0.973 | 0.051 |
| LS-SVM | (3.922 × 10⁴, 753.284) | 0.999 | 0.026 | 0.988 | 0.034 |
Parameters of different models; the optimal number of latent variables for PLS-DA, the bandwidth of kernel function (sig2) and the trade-off between the minimum model complexity and the minimum training error (gam) for LS-SVM.
Table 2.
Comparison of the average profile parameters of ablation craters under air and Ar conditions.
Table 2.
Comparison of the average profile parameters of ablation craters under air and Ar conditions.
| Condition | Volume/μm3 | Cross-Sectional Area/μm2 | Maximum Depth/μm |
|---|---|---|---|
| Air | 2.15628 × 10⁶ ± 1 × 10 | 1.9626 × 10⁵ ± 1 × 10 | 22.0 ± 0.1 |
| Ar | 3.89284 × 10⁶ ± 2 × 10 | 1.5568 × 10⁵ ± 1 × 10 | 36.5 ± 0.2 |
© 2018 by the authors. Licensee MDPI, Basel, Switzerland. This article is an open access article distributed under the terms and conditions of the Creative Commons Attribution (CC BY) license (http://creativecommons.org/licenses/by/4.0/).
Share and Cite
MDPI and ACS Style
Liu, X.; Liu, F.; Huang, W.; Peng, J.; Shen, T.; He, Y. Quantitative Determination of Cd in Soil Using Laser-Induced Breakdown Spectroscopy in Air and Ar Conditions. Molecules 2018, 23, 2492. https://doi.org/10.3390/molecules23102492
AMA Style
Liu X, Liu F, Huang W, Peng J, Shen T, He Y. Quantitative Determination of Cd in Soil Using Laser-Induced Breakdown Spectroscopy in Air and Ar Conditions. Molecules. 2018; 23(10):2492. https://doi.org/10.3390/molecules23102492
Chicago/Turabian StyleLiu, Xiaodan, Fei Liu, Weihao Huang, Jiyu Peng, Tingting Shen, and Yong He. 2018. "Quantitative Determination of Cd in Soil Using Laser-Induced Breakdown Spectroscopy in Air and Ar Conditions" Molecules 23, no. 10: 2492. https://doi.org/10.3390/molecules23102492