Genetic Structure and Eco-Geographical Differentiation of Wild Sheep Fescue (Festuca ovina L.) in Xinjiang, Northwest China

 , ,
, ,
Abstract
:1. Introduction
2. Results
2.1. AFLP Polymorphism and Genetic Diversity
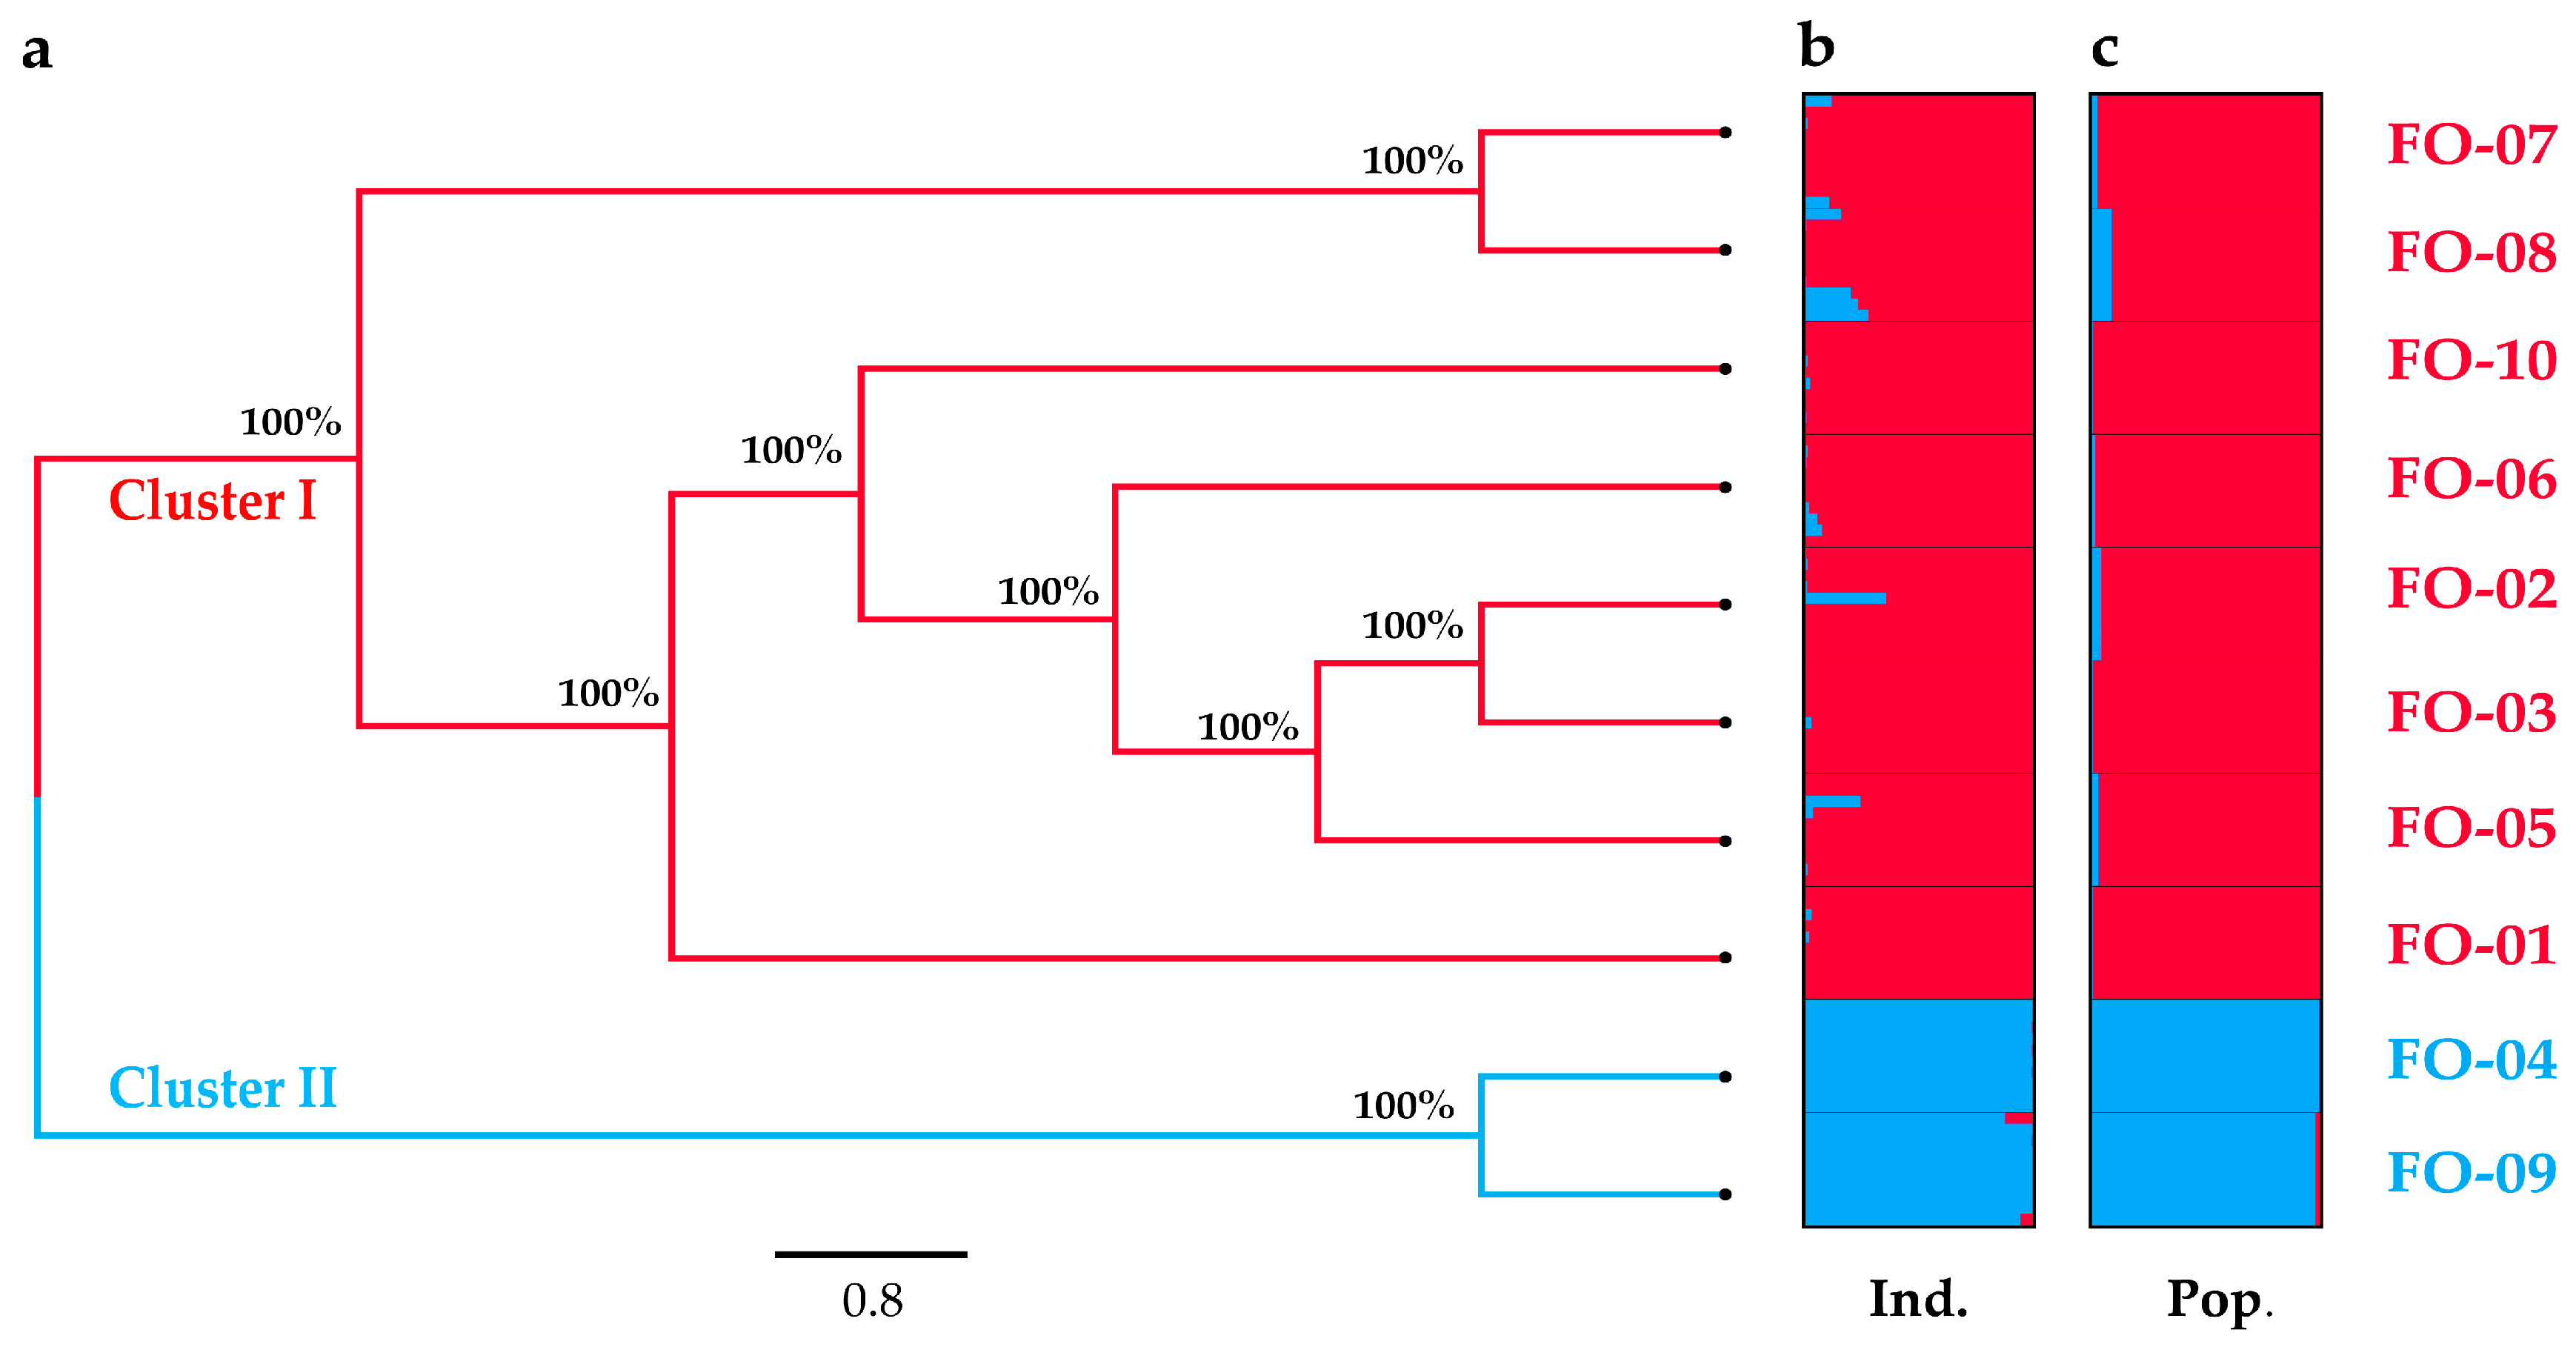
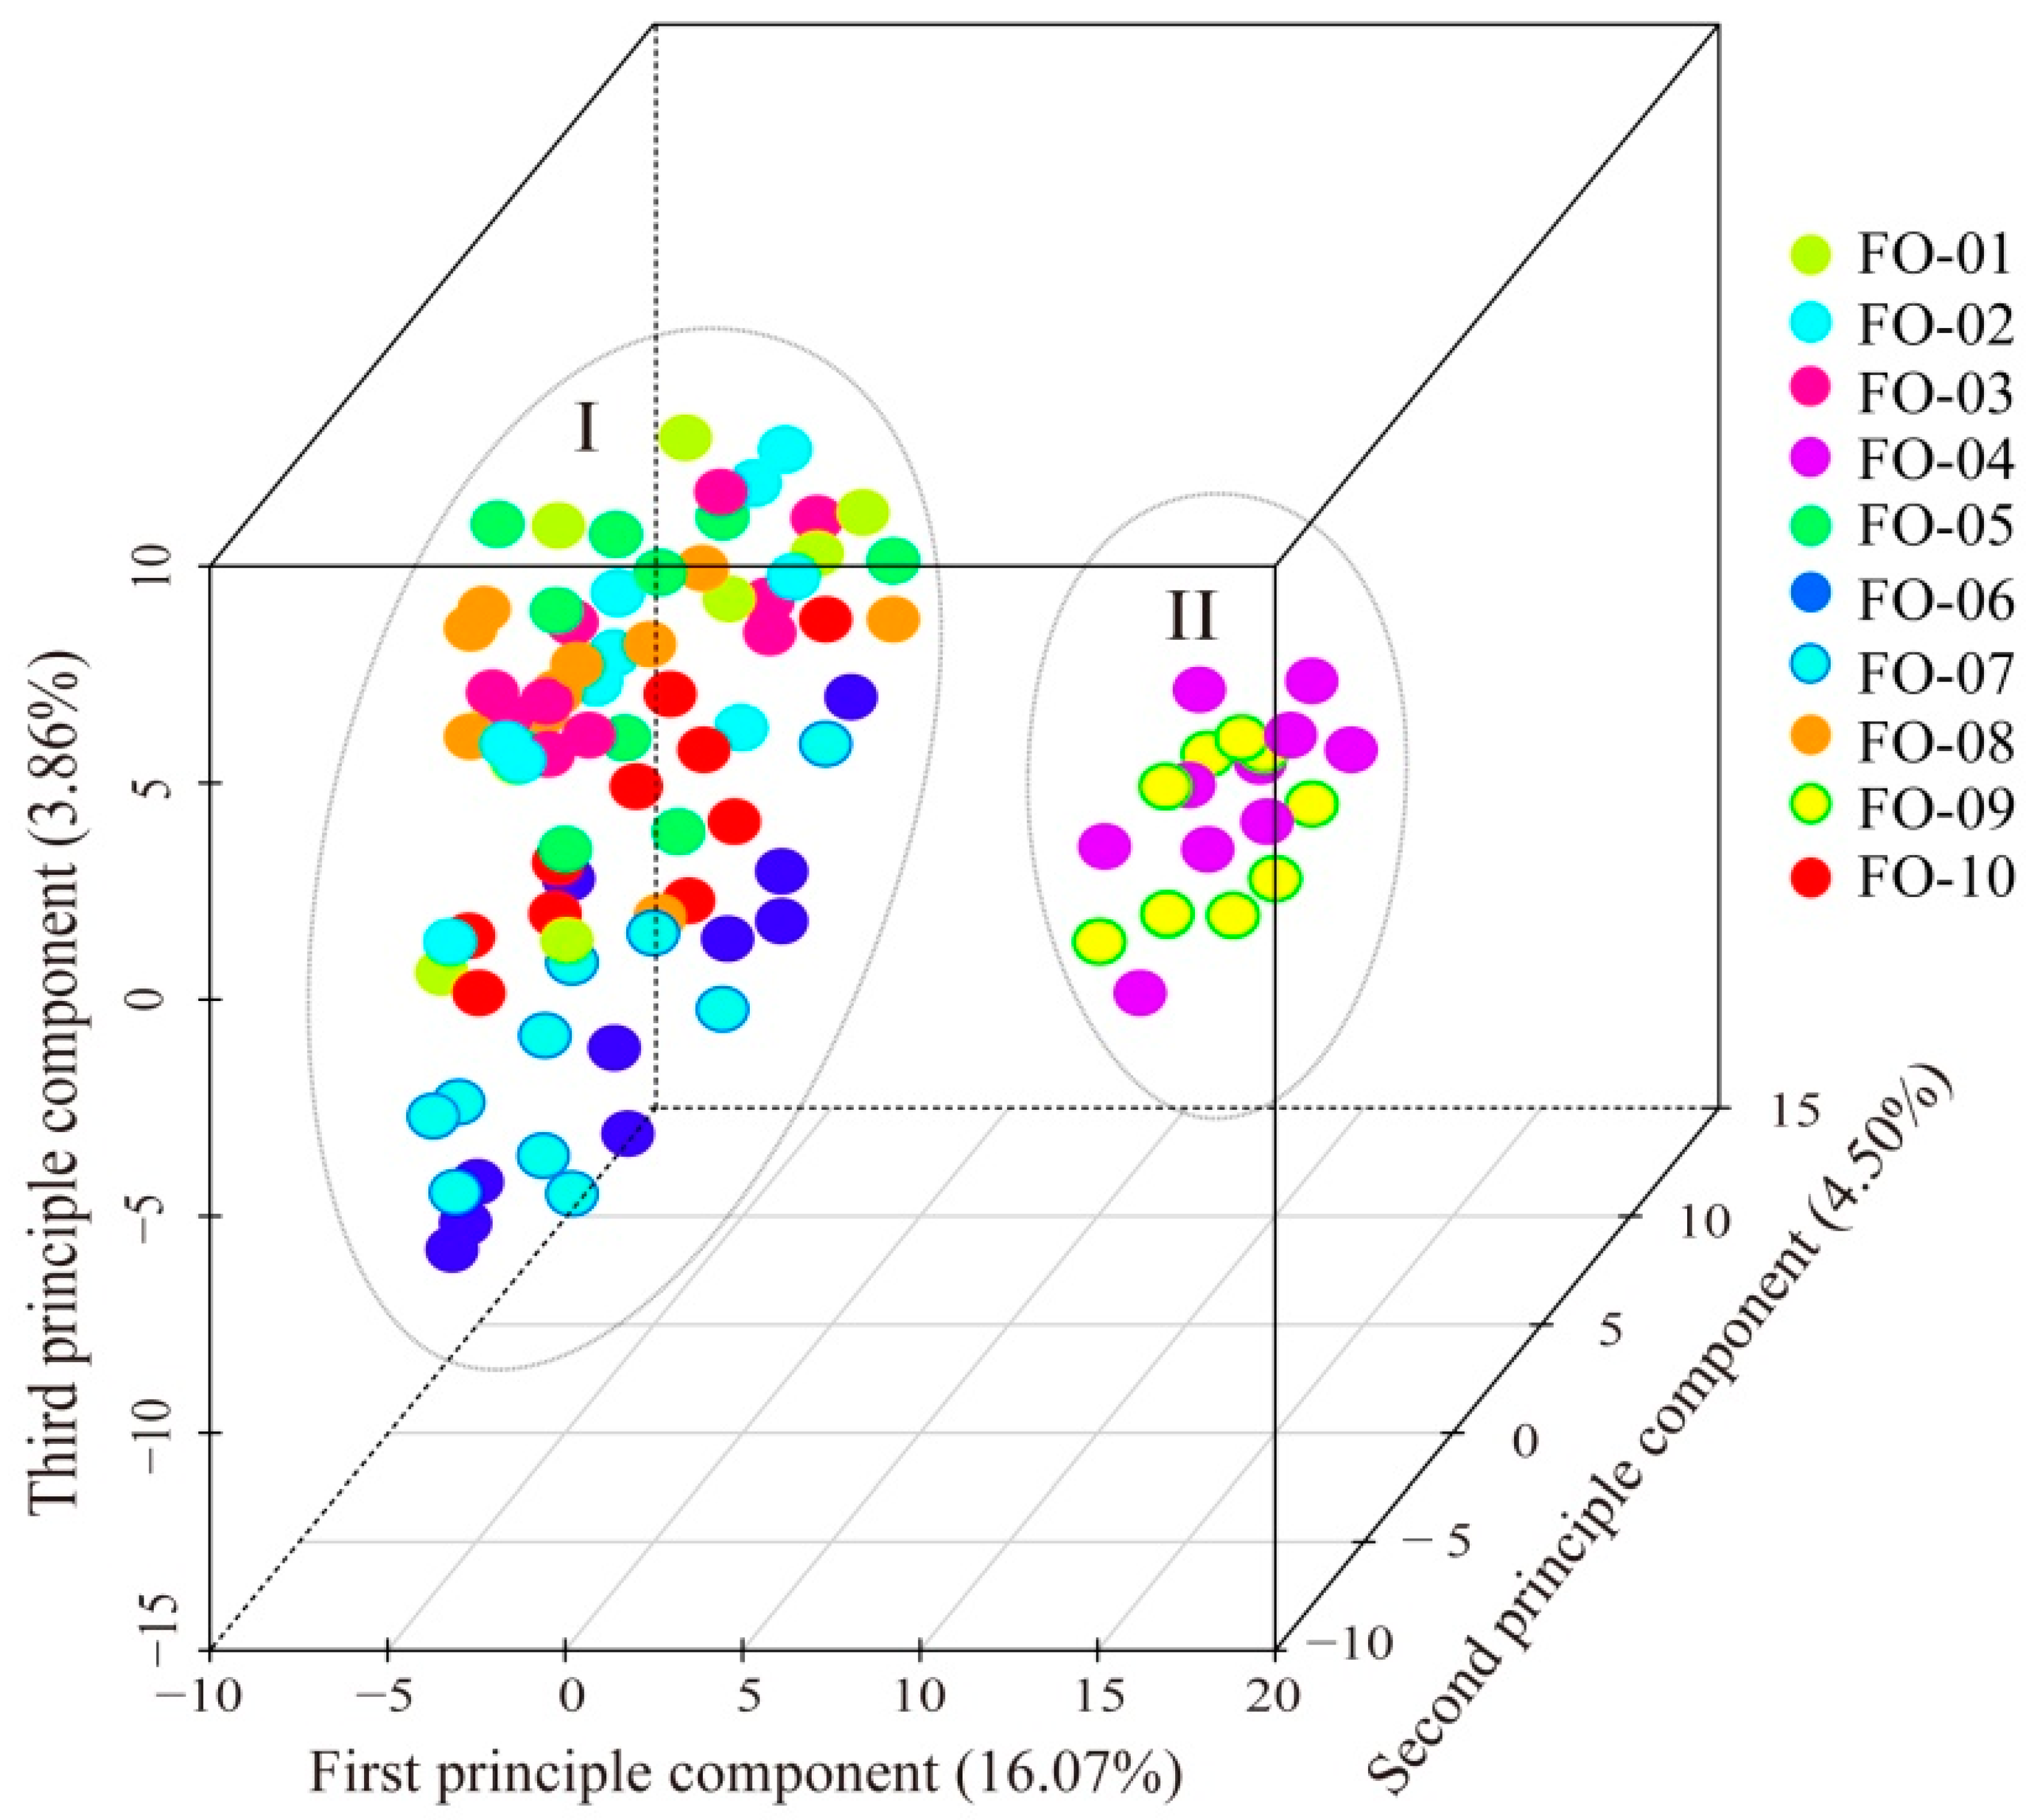
2.2. Genetic Distance and Structure
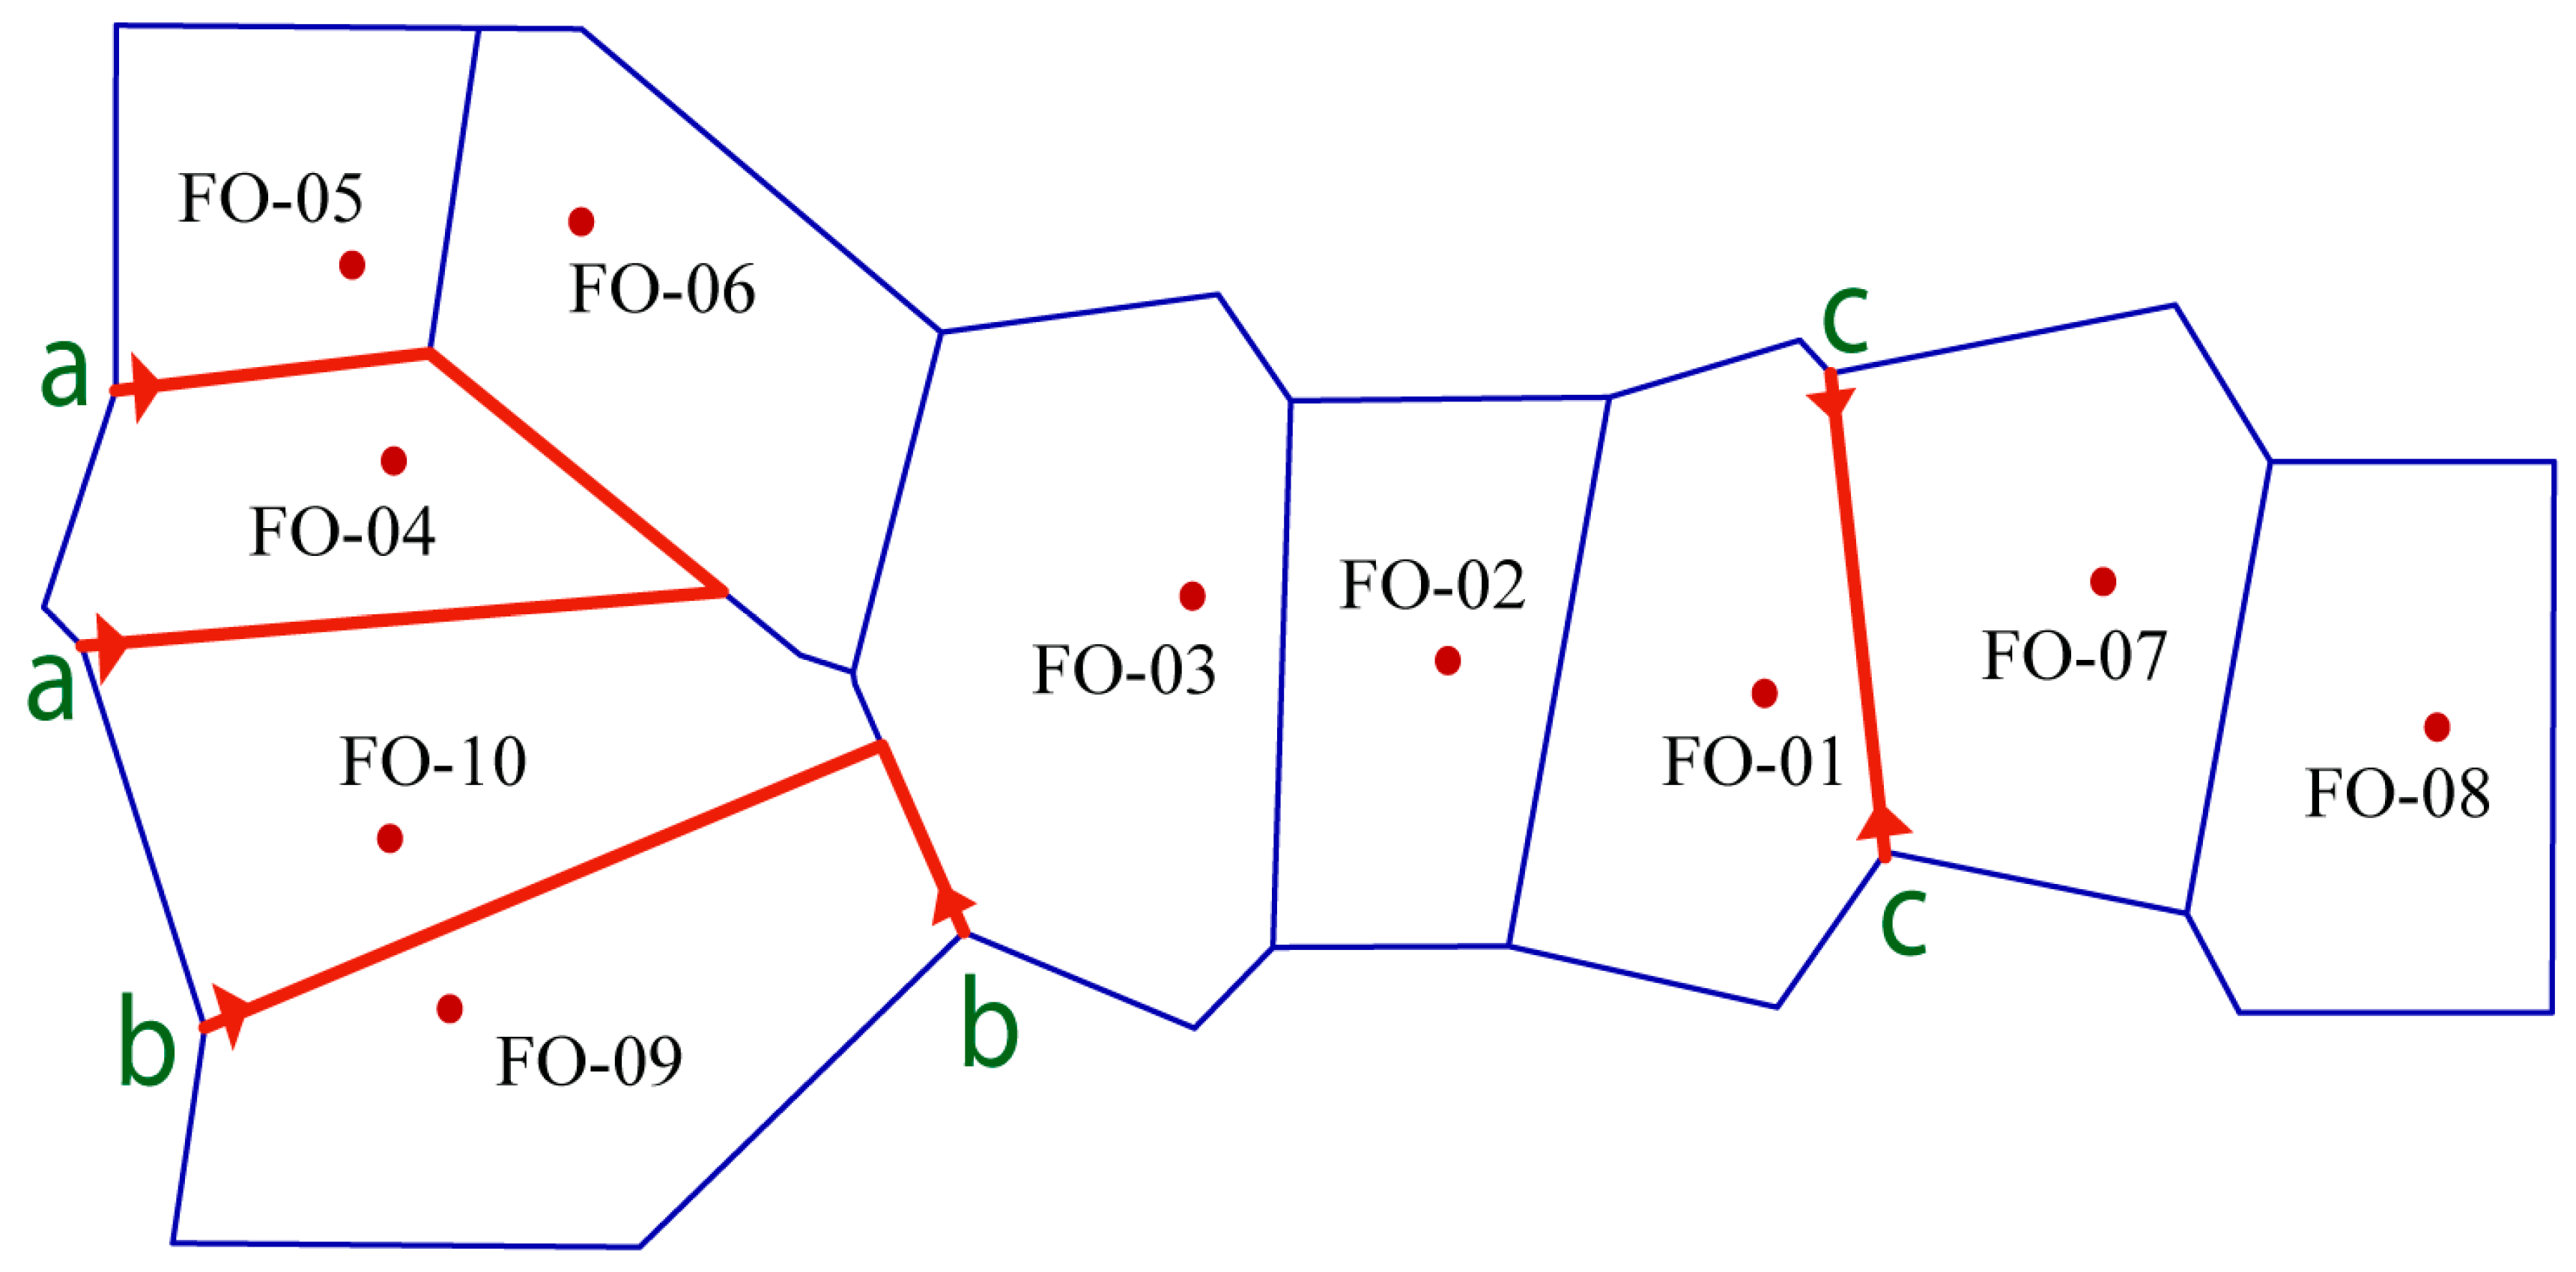
2.3. Genetic Differentiation, Gene Flow and Genetic Barrier
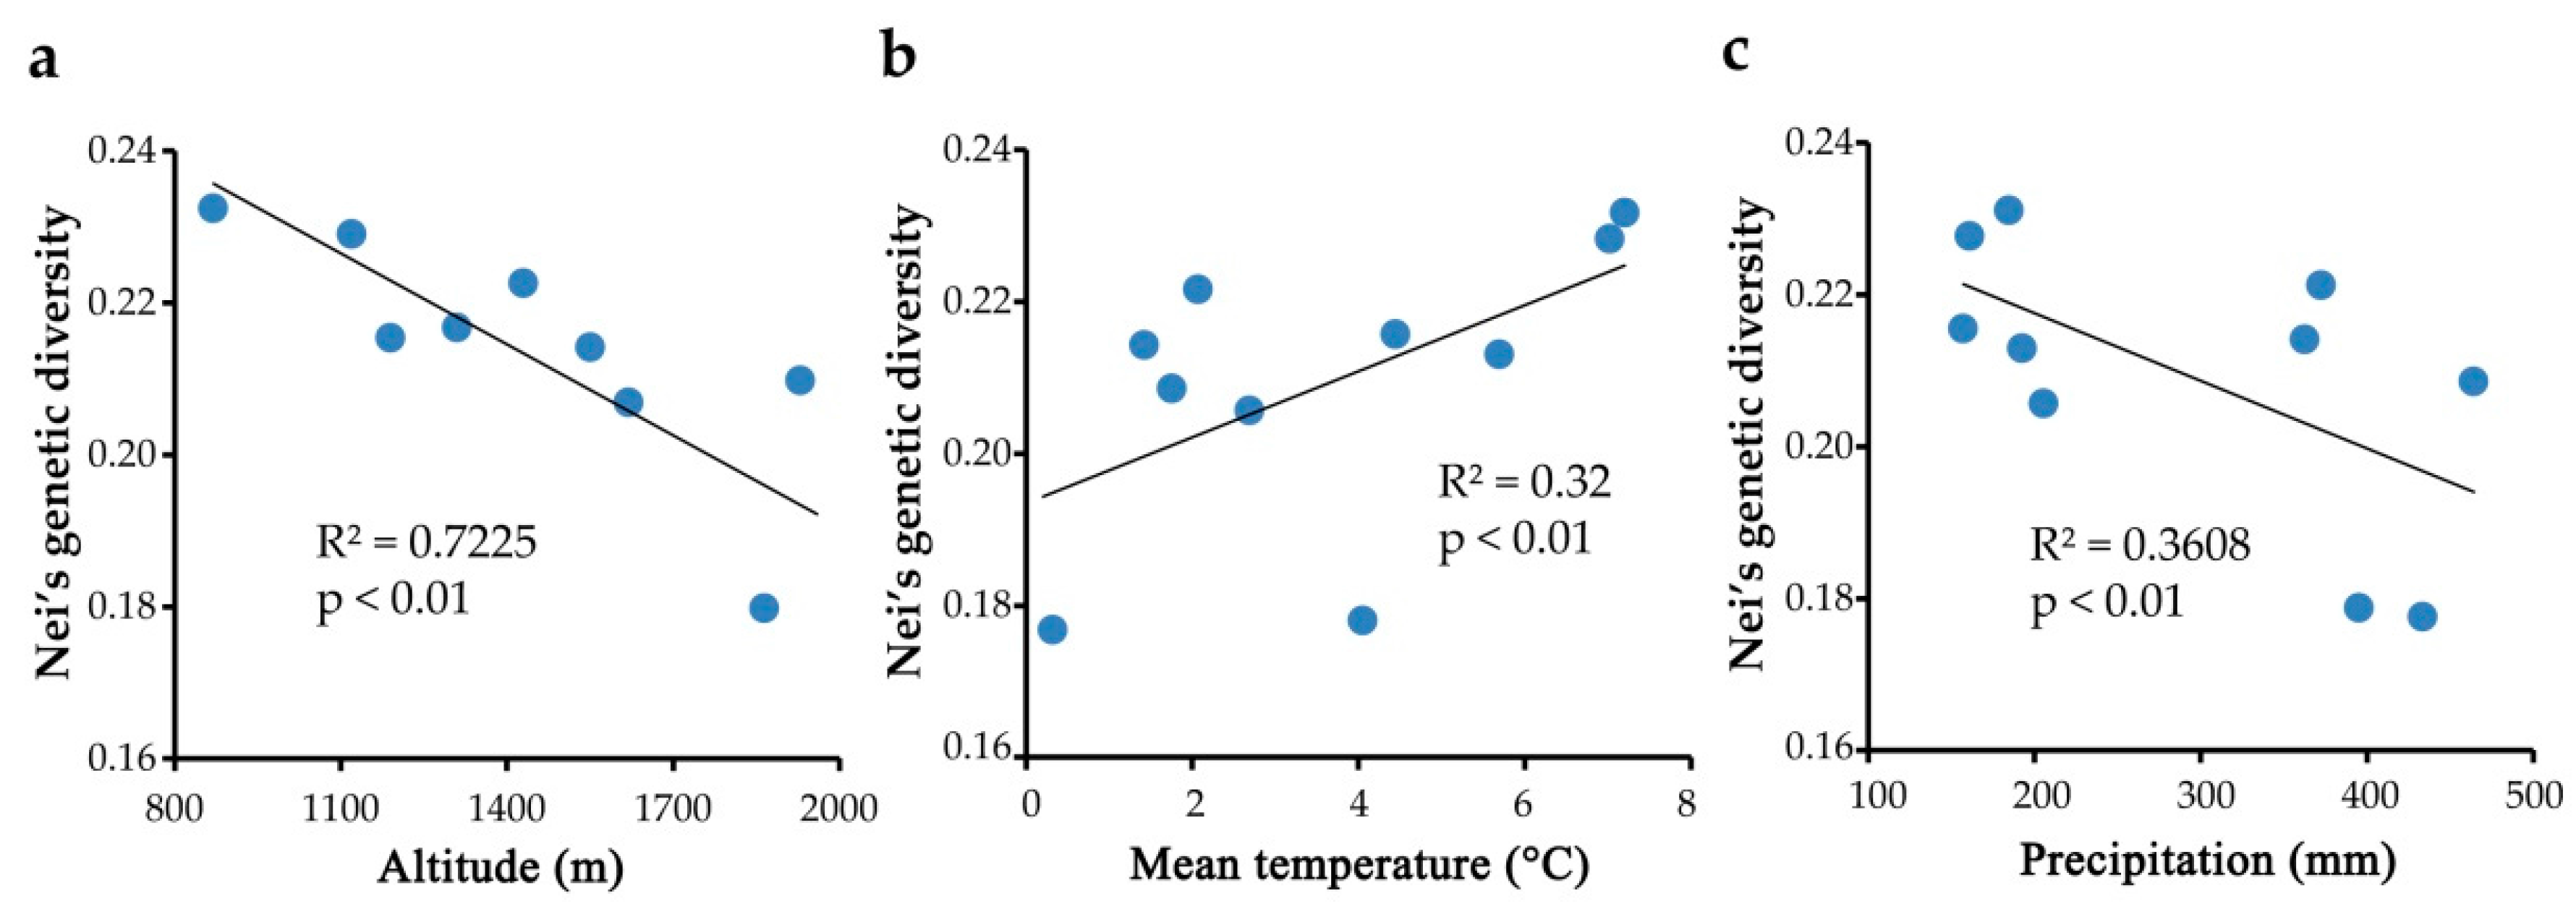
2.4. Genetic Diversity Associated with Environmental Factors
3. Discussion
3.1. Population Genetic Diversity and Its Correlation to Environment Factors
3.2. Genetic Structure and Gene Flow among Fragmented Populations under Genetic Barriers
4. Materials and Methods
4.1. Plant Materials and Genomic DNA Preparation
4.2. AFLP Procedure
4.3. Data Analysis
4.3.1. Genetic Diversity
4.3.2. Genetic Structure
4.3.3 Genetic Variation, Gene Flow and Genetic Barrier
4.3.4. Correlation Analysis
5. Conclusions
Acknowledgments
Author Contributions
Conflicts of Interest
References
- Morello, S.; Sede, S.M. Genetic admixture and lineage separation in a southern andean plant. AoB Plants 2016, 8, plw034. [Google Scholar] [CrossRef] [PubMed]
- Hughes, C.E.; Atchison, G.W. The ubiquity of alpine plant radiations: From the andes to the hengduan mountains. New Phytol. 2015, 207, 275–282. [Google Scholar] [CrossRef] [PubMed]
- Linder, H.P. Plant species radiations: Where, when, why? Philos. Trans. R. Soc. Lond. 2008, 363, 3097. [Google Scholar] [CrossRef] [PubMed]
- Oostermeijer, J.G.B.; Luijten, S.H.; Nijs, J.C.M.D. Integrating demographic and genetic approaches in plant conservation. Biol. Conserv. 2003, 113, 389–398. [Google Scholar] [CrossRef]
- Kremen, C.; Ricketts, T. Global perspectives on pollination disruptions. Conserv. Biol. 2000, 14, 1226–1228. [Google Scholar] [CrossRef]
- Saccheri, I.; Kuussaari, M.; Kankare, M.; Vikman, P.; Fortelius, W.; Hanski, I. Inbreeding and extinction in a butterfly metapopulation. Nature 1998, 392, 491–494. [Google Scholar] [CrossRef]
- Bijlsma, R. The significance if genetic erosion in the process of extinction I. Genetic differentiation in Salvia pratensis L. And scabiosa columbaria in relation to population size. Heredity 1991, 66, 181–189. [Google Scholar]
- Frankham, R. Conservation genetics. Ann. Rev. Genet. 1997, 78, 305. [Google Scholar]
- Shaffer, H.B.; Gidiş, M.; Mccartney-Melstad, E.; Neal, K.M.; Oyamaguchi, H.M.; Tellez, M.; Toffelmier, E.M. Conservation genetics and genomics of amphibians and reptiles. Annu. Rev. Anim. Biosci. 2015, 3, 113. [Google Scholar] [CrossRef] [PubMed]
- Bohrer, G.; Nathan, R.; Volis, S. Effects of long-distance dispersal for metapopulation survival and genetic structure at ecological time and spatial scales. J. Ecol. 2005, 93, 1029–1040. [Google Scholar] [CrossRef]
- Reed, D.H.; Lowe, E.H.; Briscoe, D.A.; Frankham, R. Inbreeding and extinction: Effects of rate of inbreeding. Conserv. Genet. 2003, 4, 405–410. [Google Scholar] [CrossRef]
- Gu, X.Y.; Guo, Z.H.; Ma, X.; Bai, S.Q.; Zhang, X.Q.; Zhang, C.B.; Chen, S.Y.; Peng, Y.; Yan, Y.H.; Huang, L.K. Population genetic variability and structure of Elymus breviaristatus (poaceae: Triticeae) endemic to Qinghai-Tibetan plateau inferred from ssr markers. Biochem. Syst. Ecol. 2015, 58, 247–256. [Google Scholar] [CrossRef]
- Cota, L.G.; Vieira, F.A.; Melo Júnior, A.F.; Brandão, M.M.; Santana, K.N.; Guedes, M.L.; Oliveira, D.A. Genetic diversity of Annona crassiflora (annonaceae) in northern minas gerais state. Genet. Mol. Res. GMR 2011, 10, 2172–2180. [Google Scholar] [CrossRef] [PubMed]
- Carter, T.E., Jr.; Hymowitz, T.; Nelson, R.L. Biogeography, Local Adaptation, Vavilov, and Genetic Diversity in Soybean; Biol. Resour. Migr; Springer: Berlin, Germany, 2004; pp. 47–59. [Google Scholar]
- Juan, A.; Crespo, M.B.; Cowan, R.S.; Lexer, C.; Fay, M.F. Patterns of variability and gene flow in Medicago citrina, an endangered endemic of islands in the western mediterranean, as revealed by amplified fragment length polymorphism (aflp). Mol. Ecol. 2004, 13, 2679–2690. [Google Scholar] [CrossRef] [PubMed]
- Young, A.; Boyle, T.; Brown, T. The population genetic consequences of habitat fragmentation for plants. Trends Ecol. Evol. 1996, 11, 413. [Google Scholar] [CrossRef]
- Edelaar, P.; Alonso, D.; Lagerveld, S.; Senar, J.C.; Björklund, M. Population differentiation and restricted gene flow in spanish crossbills: Not isolation-by-distance but isolation-by-ecology. J. Evol. Biol. 2012, 25, 417. [Google Scholar] [CrossRef] [PubMed]
- Müller, C.M.; Schulz, B.; Lauterbach, D.; Ristow, M.; Wissemann, V.; Gemeinholzer, B. Geropogon hybridus (L.) Sch.Bip. (Asteraceae) exhibits micro-geographic genetic divergence at ecological range limits along a steep precipitation gradient. Plant Syst. Evol. 2016, 303, 1–14. [Google Scholar] [CrossRef]
- Schuster, W.S.; Alles, D.L.; Mitton, J.B. Gene flow in limber pine: Evidence from pollination phenology and genetic differentiation along an elevational transect. Am. J. Bot. 1989, 76, 1395–1403. [Google Scholar] [CrossRef]
- Hewitt, G. The genetic legacy of the quaternary ice ages. Nature 2000, 405, 907–913. [Google Scholar] [CrossRef] [PubMed]
- Hewitt, G.M. Genetic consequences of climatic oscillations in the quaternary. Philos. Trans. R. Soc. Lond. 2004, 359, 183–195. [Google Scholar] [CrossRef] [PubMed]
- Staneik, D. The genus Festuca (Poaceae: Loliinae) in venezuela. Nord. J. Bot. 2003, 23, 191–205. [Google Scholar] [CrossRef]
- Harberd, D.J. Some observations on natural clones in Festuca ovina. New Phytol. 1962, 61, 85–100. [Google Scholar] [CrossRef]
- Weibull, P.; Ghatnekar, L.; Bengtsson, B.O. Genetic variation in commercial varieties and natural populations of sheep’s fescue, Festuca ovina L. Plant Breed. 1991, 107, 203–209. [Google Scholar] [CrossRef]
- Wilkinson, M.J.; Stace, C.A. A new taxonomic treatment of the Festuca ovina L. Aggregate (poaceae) in the british isles. Bot. J. Linn. Soc. 2010, 106, 347–397. [Google Scholar] [CrossRef]
- Mirhaji, M.; Sanadgol, A.; Jafari, A.A. Evaluation of 16 accessions of Festuca ovina L. In the nursery of homand-abesard rangeland research station. Desalination 2013, 148, 25–29. [Google Scholar]
- Liu, C.E.; Peng, X.U.; Sha-Zhou, A.N. Study on the growing rhymes of plants of grassland in northern slope of tianshan mountain. Chin. J. Grass. 2006, 28, 18–21. [Google Scholar]
- Wang, J. Study on grassland vegetation and its utilization of mid-low belt of north slopes of tianshan mountains. Anim. Husb. Feed Sci. 2009, 5, 133–142. [Google Scholar]
- Stroeven, A.P.; Hättestrand, C.; Heyman, J.; Kleman, J.; Morén, B.M. Glacial geomorphology of the tian shan. J. Maps 2013, 9, 505–512. [Google Scholar] [CrossRef]
- Li, Y.; Liu, G.; Chen, Y.; Li, Y.; Harbor, J.; Stroeven, A.P.; Caffee, M.; Zhang, M.; Li, C.; Cui, Z. Timing and extent of quaternary glaciations in the tianger range, eastern tian shan, china, investigated using 10 be surface exposure dating. Quat. Sci. Rev. 2014, 98, 7–23. [Google Scholar] [CrossRef]
- Kong, P.; Fink, D.; Na, C.; Huang, F. Late quaternary glaciation of the tianshan, central asia, using cosmogenic be surface exposure dating. Quat. Res. 2009, 72, 229–233. [Google Scholar] [CrossRef]
- Su, Z.; Zhang, M. Evolutionary response to quaternary climate aridification and oscillations in north-western china revealed by chloroplast phylogeography of the desert shrub Nitraria sphaerocarpa (Nitrariaceae). Biol. J. Linn. Soc. 2013, 109, 757–770. [Google Scholar] [CrossRef]
- Meng, H.H.; Gao, X.Y.; Huang, J.F.; Zhang, M.L. Plant phylogeography in arid northwest China: Retrospectives and perspectives. J. Syst. Evol. 2015, 53, 33–46. [Google Scholar] [CrossRef]
- Hu, T. Assessing genetic diversity of perennial ryegrass (Lolium perenne L.) from four continents by inter-simple sequence repeat (ISSR) markers. Afr. J. Biotechnol. 2011, 10, 19365–19374. [Google Scholar]
- Keyghobadi, N.; Roland, J.; Matter, S.F.; Strobeck, C. Among- and within-patch components of genetic diversity respond at different rates to habitat fragmentation: An empirical demonstration. R. Soc. Proceed. B Biol. Sci. 2005, 272, 553–560. [Google Scholar] [CrossRef] [PubMed]
- Nations, F.A.O.O. The state of the world’s plant genetic resources for food and agriculture. J. Plant Genet. Resour. 2011, 12, 3–8. [Google Scholar]
- Mueller, U.G.; Wolfenbarger, L.L. Aflp genotyping and fingerprinting. Trends Ecol. Evol. 1999, 14, 389. [Google Scholar] [CrossRef]
- Durrant, W.E.; Rowland, O.; Piedras, P.; Hammondkosack, K.E.; Jones, J.D.G. Cdna-aflp reveals a striking overlap in race-specific resistance and wound response gene expression profiles. Plant Cell 2000, 12, 963. [Google Scholar] [CrossRef] [PubMed]
- Luo, R.; Larget, B. Modeling substitution and indel processes for aflp marker evolution and phylogenetic inference. Ann. Appl. Stat. 2009, 3, 222–248. [Google Scholar] [CrossRef]
- Breyne, P.; Rombaut, D.; Van, G.A.; Van, M.M.; Gerats, T. Aflp analysis of genetic diversity within and between arabidopsis thaliana ecotypes. Mol. Gener. Genet. MGG 1999, 261, 627. [Google Scholar] [CrossRef]
- Gu, F. Genetic structure in population of reaumuria soongorica in the desert of fukang, xinjiang and its relationship with ecological factors. Acta Bot. Sin. 2003, 45, 787–794. [Google Scholar]
- Feng, L.I.; Xiong, Z.; Fengmin, L.I.; Zhu, Y. Genetic diversity and divergence between populations of Hemerocallis lilioasphodelus L. from henan and hunan province. Wuhan Univ. J. 1999, 45, 449–851. [Google Scholar]
- Sorkheh, K.; Masaeli, M.; Chaleshtori, M.H.; Adugna, A.; Ercisli, S. Aflp-based analysis of genetic diversity, population structure, and relationships with agronomic traits in rice germplasm from north region of iran and world core germplasm set. Biochem. Genet. 2016, 54, 1–17. [Google Scholar] [CrossRef] [PubMed]
- Majidi, M.M.; Mirlohi, A.F.; Sayedtabatabaei, B.E. Aflp analyses of genetic variation in iranian fescue accessions. Pak. J. Biol. Sci. 2006, 9, 1869–1876. [Google Scholar]
- Tehrani, M.S.; Díaz-Pérez, A. Genetic diversity and structure among iranian tall fescue populations based on genomic-ssr and est-ssr marker analysis. Plant Syst. Evol. 2009, 282, 57–70. [Google Scholar] [CrossRef]
- Rao, V.R.; Hodgkin, T. Genetic diversity and conservation and utilization of plant genetic resources. Plant Cell Tissue Organ Cult. 2002, 68, 1–19. [Google Scholar]
- Fjellheim, S.; Grieg, Z.; Rognli, O.A. Aflp-marker analyses of genetic structure in nordic meadow fescue (Festuca pratensis huds.)—Tracing the origin of norwegian cultivars and local populations. Dev. Plant Breed. 2004, 11, 303–308. [Google Scholar]
- Hayes, B.J.; Cogan, N.O.I.; Pembleton, L.W.; Goddard, M.E.; Wang, J.; Spangenberg, G.C.; Forster, J.W. Prospects for genomic selection in forage plant species. Plant Breed. 2013, 132, 133–143. [Google Scholar] [CrossRef]
- Stephan, W. Principles of population genetics. Q. Rev. Biol. 2007, 82, 416. [Google Scholar] [CrossRef]
- Thomson, J.D. Skewed flowering distributions and pollinator attraction. Ecology 1980, 61, 572–579. [Google Scholar] [CrossRef]
- Bingham, R.A.; Orthner, A.R. Efficient pollination of alpine plants. Nature 1998, 391, 238–239. [Google Scholar] [CrossRef]
- Han, X.Y.; Yang, Q.; Yao, J.Q. Spatiotemporal distribution characteristics of precipitation in tianshan mountain of xinjiang during the last 51 years. Res. Soil Water Conserv. 2013, 20, 139–144. [Google Scholar]
- Zhang, Q.; Singh, V.P.; Li, J.; Jiang, F.; Bai, Y. Spatio-temporal variations of precipitation extremes in xinjiang, china. J. Hydrol. 2012, 434–435, 7–18. [Google Scholar] [CrossRef]
- Roughgarden, J.; Bergman, A.; Shafir, S.; Taylor, C. Adaptive Computation in Ecology and Evolution: A Guide for Future Research; Adaptive Individuals in Evolving Populations: Boston, MA, USA, 1996; pp. 25–30. [Google Scholar]
- Ye, M.; Hou, B.; Luo, J.; Yan, W.; Liu, W.; Ding, X. Genetic diversity and conservation of the endangered herb dendrobium moniliforme based on amplified fragment length polymorphism markers. Sci. Horticult. 2015, 189, 51–58. [Google Scholar] [CrossRef]
- Gandon, S.; Nuismer, S.L. Interactions between genetic drift, gene flow, and selection mosaics drive parasite local adaptation. Am. Nat. 2009, 173, 212–224. [Google Scholar] [CrossRef] [PubMed]
- Ahloowalia, B.S. A root tip squash technique for screening chromosome number in Lolium. Euphytica 1965, 14, 170–172. [Google Scholar] [CrossRef]
- Zhang, L.; Jeon, Y.J.; Kang, S.Y.; Lee, G.J. Genetic diversity of natural and artificial populations of model grass brachypodium species evaluated by aflp markers. Horticult. Environ. Biotechnol. 2012, 53, 143–150. [Google Scholar] [CrossRef]
- Juan, A.; Fay, M.F.; Pastor, J.; Juan, R.; Fernández, I.; Crespo, M.B. Genetic structure and phylogeography in Juniperus oxycedrus subsp. Macrocarpa around the mediterranean and atlantic coasts of the iberian peninsula, based on aflp and plastid markers. Eur. J. For. Res. 2012, 131, 845–856. [Google Scholar] [CrossRef]
- Dzialuk, A.; Mazur, M.; Boratyńska, K.; Montserrat, J.M.; Romo, A.; Boratyński, A. Population genetic structure of Juniperus phoenicea (cupressaceae) in the western mediterranean basin: Gradient of diversity on a broad geographical scale. Ann. For. Sci. 2011, 68, 1341–1350. [Google Scholar] [CrossRef] [Green Version]
- Peters, M.D.; Xiang, Q.Y.; Thomas, D.T.; Stucky, J.; Whiteman, N.K. Genetic analyses of the federally endangered Echinacea laevigata using amplified fragment length polymorphisms (aflp)—Inferences in population genetic structure and mating system. Conserv. Genet. 2009, 10, 1–14. [Google Scholar] [CrossRef]
- Coreteam, R.D. R: A language and environment for statistical computing. Computing 2015, 14, 12–21. [Google Scholar]
- Ligges, U.; Martin, M. An r package for visualizing multivariate data. J. Stat. Softw. 2003, 08, 11. [Google Scholar] [CrossRef]
- Chen, Y.Y.; Li, L.; Wei, L.; Li, Z.Z. Genetic diversity and population structure of the endangered alpine quillwort isoetes hypsophila hand.-mazz. revealed by aflp markers. Plant Syst. Evol. 2010, 290, 127–139. [Google Scholar] [CrossRef]
- Falush, D.; Stephens, M.; Pritchard, J.K. Inference of population structure using multilocus genotype data: Dominant markers and null alleles. Mol. Ecol. Resour. 2007, 7, 574–578. [Google Scholar] [CrossRef] [PubMed]
- Last, L.; Widmer, F.; Fjellstad, W.; Stoyanova, S.; Kölliker, R. Genetic diversity of natural orchardgrass (Dactylis glomerata L.) populations in three regions in europe. BMC Genet. 2013, 14, 102. [Google Scholar] [CrossRef] [PubMed]
- Sui, X.Q.; Wang, K.; Zheng, S.H.; Li, L.; An, S.Z. Effects of landscape fragmentation on genetic diversity of stipa Krylovii roshev (Stipa L.) in agro-pastoral ecotone in northern china. Afr. J. Biotechnol. 2009, 8, 155–160. [Google Scholar]
- Thioulouse, J.; Dray, S. Interactive multivariate data analysis in R with the ade4 and ade4tkgui packages. J. Stat. Softw. 2007, 22, 1–14. [Google Scholar] [CrossRef]
Sample Availability: Samples of the compounds are available from the authors. |


| Primer | TNB | NPB | PPB (%) | PIC | Hj | Ho |
|---|---|---|---|---|---|---|
| E42M57 | 109 | 70 | 64.22 | 0.2132 | 0.2538 | 0.2136 |
| E42M85 | 89 | 56 | 62.92 | 0.2221 | 0.3024 | 0.3617 |
| E85M57 | 101 | 66 | 65.35 | 0.1917 | 0.2628 | 0.4406 |
| E85M85 | 103 | 68 | 66.02 | 0.2152 | 0.2464 | 0.2261 |
| E86M57 | 90 | 67 | 74.44 | 0.2095 | 0.2036 | 0.2046 |
| E86M85 | 91 | 65 | 71.43 | 0.2124 | 0.2499 | 0.4116 |
| Total | 583 | 392 | 67.24 | 0.2107 | 0.3549 | 0.4642 |
| Mean | 97.17 | 65.33 | 67.24 | 0.2107 | 0.2531 | 0.3164 |
| Population | Np | PPL (%) | Na | Ne | Hj | Ho |
|---|---|---|---|---|---|---|
| FO-01 | 272 | 69.4 | 1.6582 | 1.2982 | 0.2042 | 0.2343 |
| FO-02 | 271 | 69.1 | 1.6709 | 1.3401 | 0.2191 | 0.2469 |
| FO-03 | 282 | 71.9 | 1.6607 | 1.2920 | 0.1969 | 0.2214 |
| FO-04 | 198 | 50.5 | 1.4719 | 1.2625 | 0.1686 | 0.1966 |
| FO-05 | 274 | 69.9 | 1.6786 | 1.3227 | 0.2126 | 0.2461 |
| FO-06 | 294 | 75.0 | 1.7092 | 1.3006 | 0.2054 | 0.2327 |
| FO-07 | 271 | 69.1 | 1.6735 | 1.3425 | 0.2225 | 0.2505 |
| FO-08 | 256 | 65.3 | 1.6352 | 1.3140 | 0.2068 | 0.2336 |
| FO-09 | 202 | 51.5 | 1.5026 | 1.2585 | 0.1698 | 0.1982 |
| FO-10 | 273 | 69.6 | 1.6531 | 1.3119 | 0.1998 | 0.2264 |
| Total | 392 | 100 | 2.0000 | 1.3571 | 0.2622 | 0.2988 |
| Mean | 298.5 | 67.24 | 1.6314 | 1.3043 | 0.2006 | 0.2287 |
| GD | FO-02 | FO-03 | FO-04 | FO-05 | FO-06 | FO-07 | FO-08 | FO-09 | FO-10 |
|---|---|---|---|---|---|---|---|---|---|
| FO-01 | 0.0823 | ||||||||
| FO-02 | 0.0853 | 0.0804 | |||||||
| FO-03 | 0.1504 | 0.1418 | 0.1504 | ||||||
| FO-04 | 0.0866 | 0.0802 | 0.0890 | 0.1432 | |||||
| FO-05 | 0.088 | 0.0833 | 0.0811 | 0.1477 | 0.0814 | ||||
| FO-06 | 0.0867 | 0.0869 | 0.0921 | 0.1486 | 0.0919 | 0.0942 | |||
| FO-07 | 0.0934 | 0.0957 | 0.0978 | 0.1473 | 0.0952 | 0.0999 | 0.0889 | ||
| FO-08 | 0.1486 | 0.1393 | 0.1499 | 0.0911 | 0.1441 | 0.1462 | 0.1483 | 0.1495 | |
| FO-09 | 0.0897 | 0.0829 | 0.0836 | 0.1508 | 0.0824 | 0.0839 | 0.0962 | 0.0986 | 0.1498 |
| Group | Source of Variation | D.f. | Sum of Squares | Variance Components | Percentage of Variation | F-Statistic | p-Value |
|---|---|---|---|---|---|---|---|
| Two clusters | Among clusters | 2 | 2334.77 | 11.98 | 11.54 | Fct = 0.1154 | <0.01 |
| Among pops. within clusters | 7 | 2143.16 | 9.74 | 10.54 | Fsc = 0.1054 | <0.01 | |
| Within populations | 89 | 4477.93 | 46.53 | 77.92 | Fst = 0.2208 | <0.01 | |
| Total | 98 | 5647.54 | 58.68 | ||||
| All pops. | Among populations | 9 | 1169.60 | 12.15 | 20.71% | Fst = 0.2071 | <0.01 |
| Within populations | 89 | 4477.93 | 46.53 | 79.29% | |||
| Total | 98 | 5647.54 | 58.68 |
| Variable | Pearson Coefficient | Altitude | Annual Mean Temperature | Annual Precipitation | Longitude | Latitude |
|---|---|---|---|---|---|---|
| Hj | r | −0.8500 | 0.5657 | −0.6007 | 0.5291 | 0.2953 |
| p | 0.0024 | 0.0096 | 0.0017 | 0.0024 | 0.0235 | |
| Ho | r | −0.8368 | 0.5433 | −0.5715 | 0.5056 | 0.3288 |
| p | 0.0076 | 0.0120 | 0.0089 | 0.0032 | 0.0233 | |
| PPL | r | −0.6077 | 0.2022 | −0.3919 | 0.2720 | 0.3975 |
| p | 0.0033 | 0.1310 | 0.0185 | 0.0118 | 0.0131 |
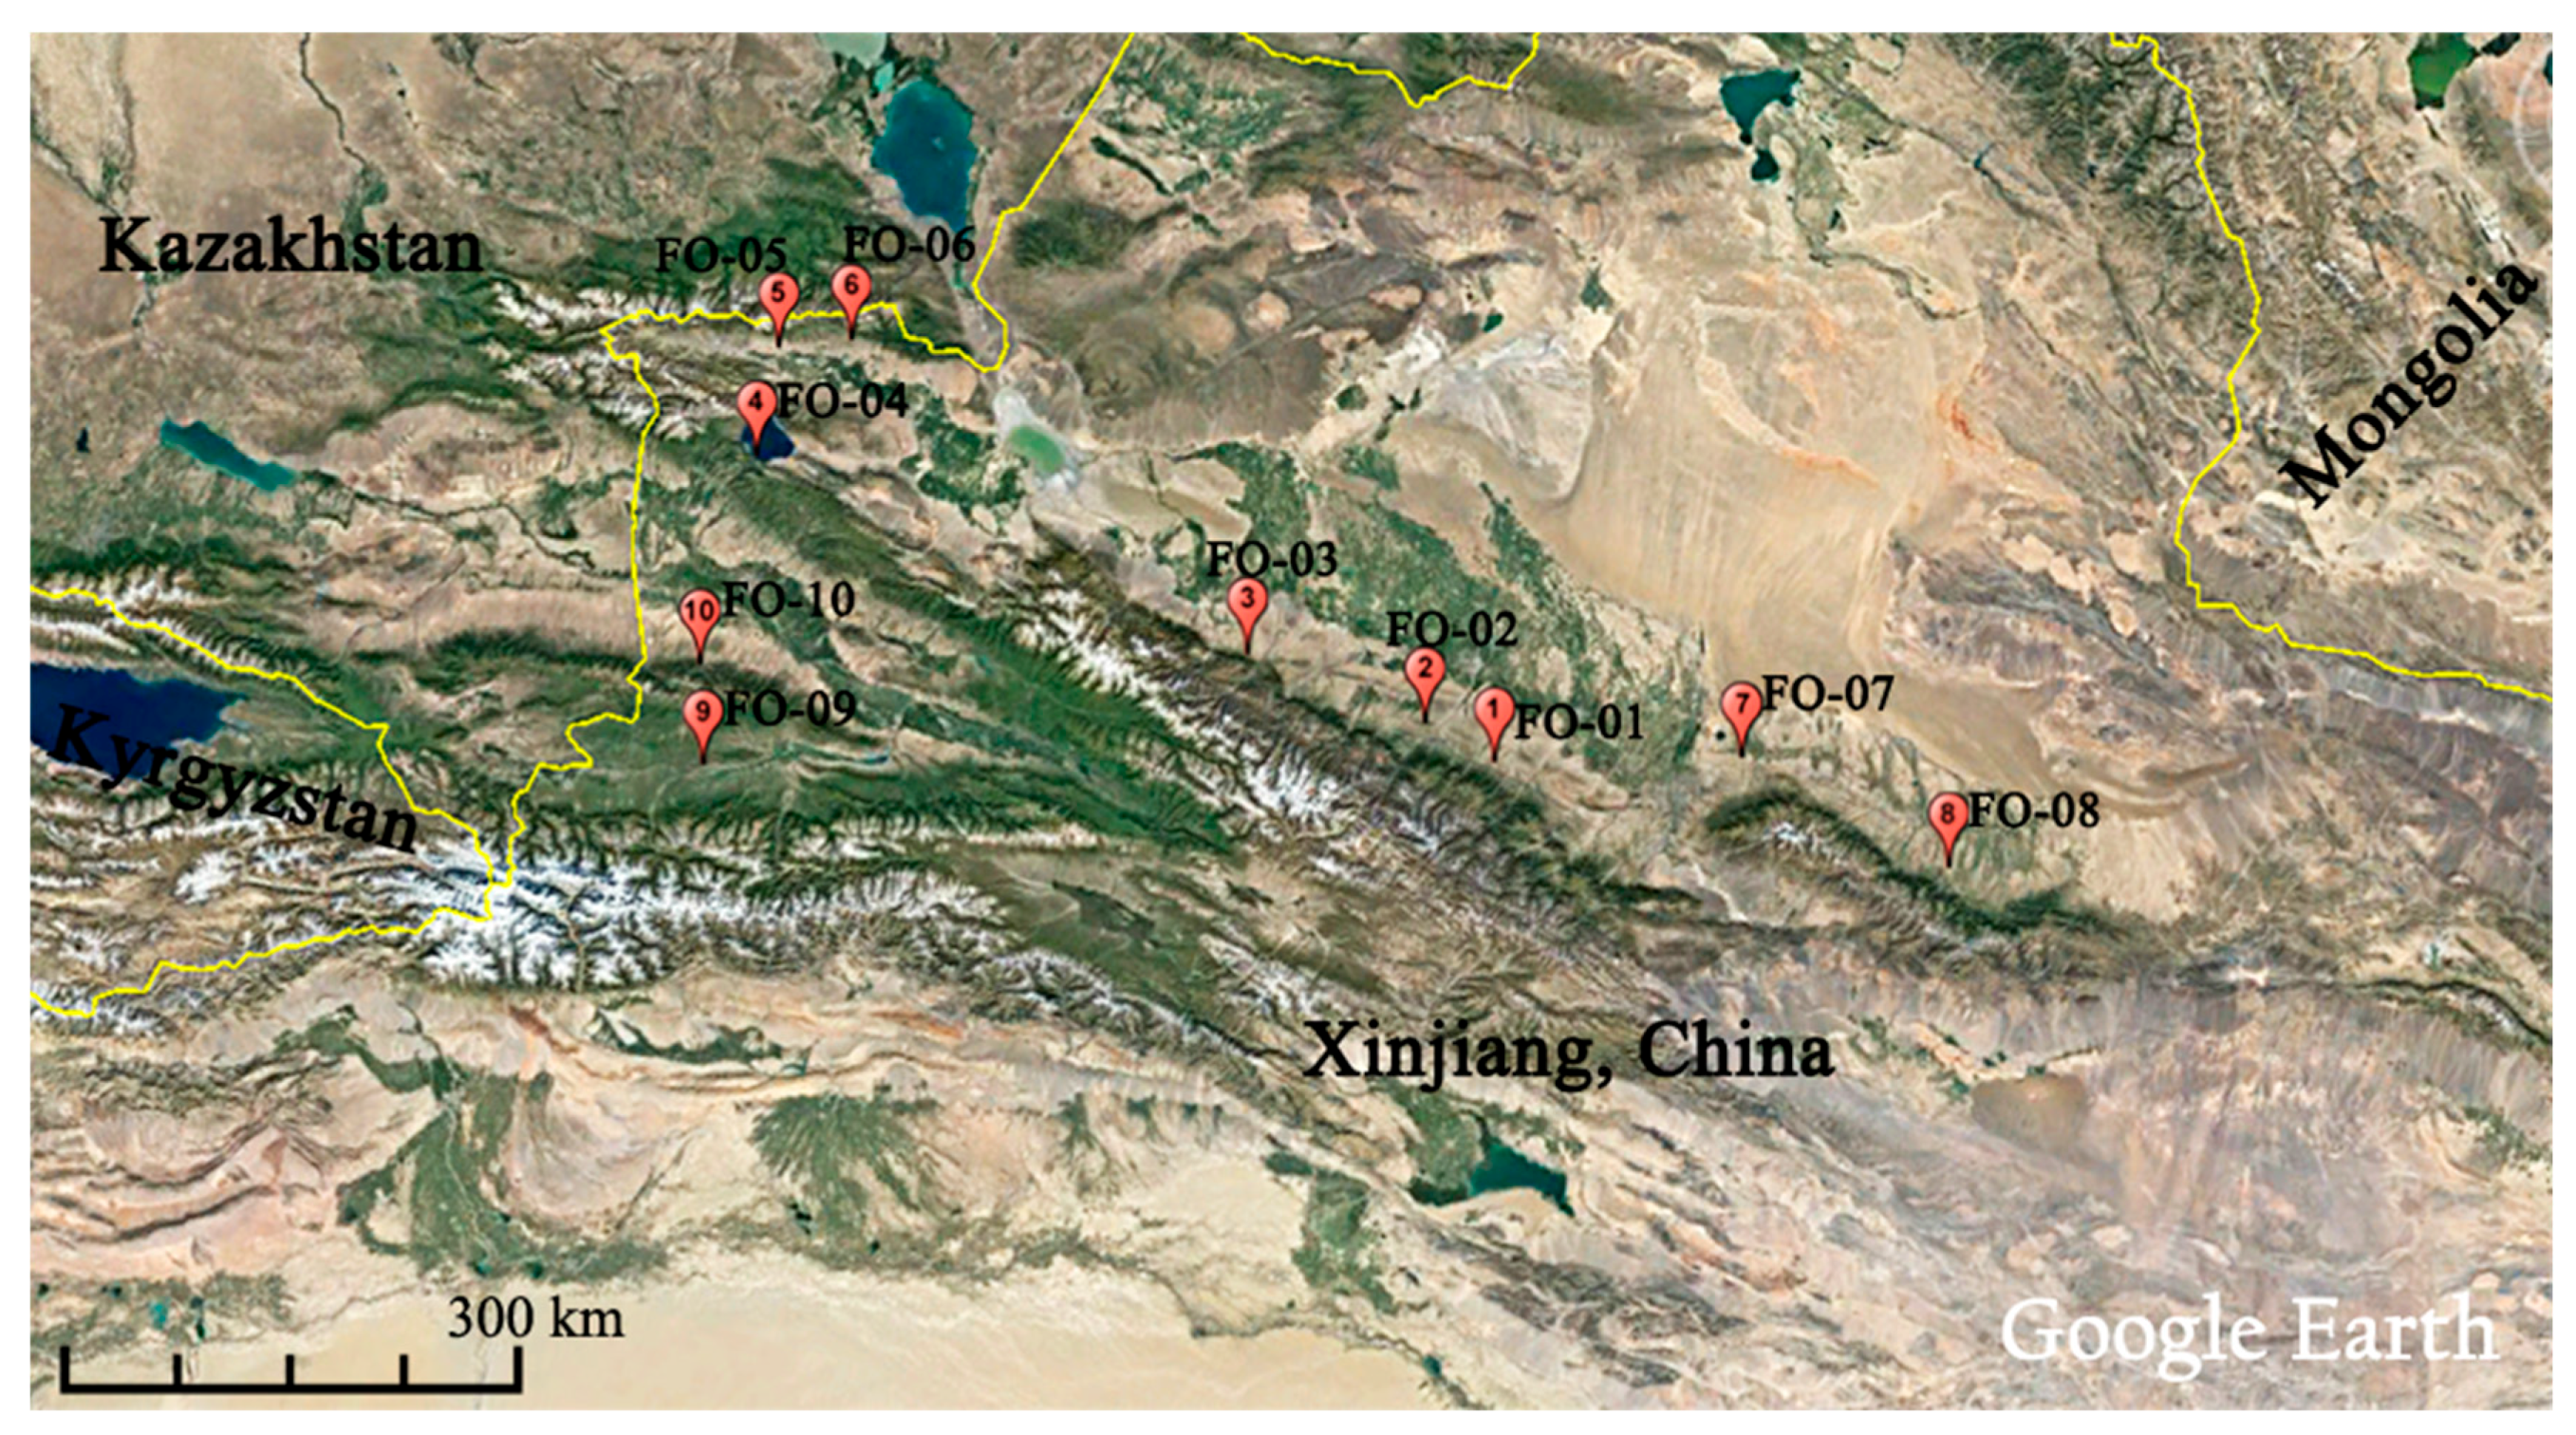
| Population | Altitude (masl) | Annual Mean Temperature (AMT, °C) | Annual Precipitation (AP, mm) | Longitude | Latitude | Grassland Type | Habitat and Dominant Herbs |
|---|---|---|---|---|---|---|---|
| FO-01 | 1550 | 5.7125 | 207 | 86°22′0″ | 43°53′1″ | Temperate desert steppe | Ungrazed slope above road, with Leymus, Koeleria and Stipa |
| FO-02 | 1120 | 7.0583 | 175 | 85°52′13″ | 44°0′23″ | Temperate desert steppe | Fenced pasture, with Artemisia and Seriphidium |
| FO-03 | 1620 | 2.6625 | 220 | 84°38′5″ | 44°9′12″ | Temperate desert steppe | Natural pasture, with Stipa, Seriphidium, Aster and Festuca |
| FO-04 | 2065 | 0.1375 | 451 | 81°8′24″ | 44°31′0″ | Temperate meadow steppe | Lakeside, with Stipa, Carex, Festuca, Taraxacum and Potentilla |
| FO-05 | 1430 | 2.0333 | 389 | 81°5′8″ | 45°3′7″ | Temperate steppe | Heavily grazed hill, with Artemisia, Potentilla and Seriphidium |
| FO-06 | 1190 | 1.3750 | 379 | 81°33′9″ | 45°10′0″ | Temperate steppe | Heavily grazed hill, with Artemisia, Potentilla and Seriphidium |
| FO-07 | 870 | 7.2417 | 199 | 87°58′17″ | 44°7′22″ | Temperate desert steppe | Non-irriaged mountain pasture, with Stipa, Seriphidium and Aster |
| FO-08 | 1310 | 4.4417 | 171 | 89°27′32″ | 43°46′0″ | Temperate desert steppe | Dry hills used for winter pastures, with Stipa, Seriphidium and Aster |
| FO-09 | 1880 | 4.0458 | 412 | 81°18′23″ | 43°1′42″ | Temperate meadow steppe | Ungrazed hillside, with Stipa, Carex, Festuca and Taraxacum |
| FO-10 | 1960 | 1.7125 | 482 | 81°7′24″ | 43°29′26″ | Temperate meadow steppe | Moderately grazed hillside, with Stipa, Carex, Taraxacum and Oxytropis |
© 2017 by the authors. Licensee MDPI, Basel, Switzerland. This article is an open access article distributed under the terms and conditions of the Creative Commons Attribution (CC BY) license (http://creativecommons.org/licenses/by/4.0/).
Share and Cite
Zhang, C.; Zhang, J.; Fan, Y.; Sun, M.; Wu, W.; Zhao, W.; Yang, X.; Huang, L.; Peng, Y.; Ma, X.; et al. Genetic Structure and Eco-Geographical Differentiation of Wild Sheep Fescue (Festuca ovina L.) in Xinjiang, Northwest China. Molecules 2017, 22, 1316. https://doi.org/10.3390/molecules22081316
Zhang C, Zhang J, Fan Y, Sun M, Wu W, Zhao W, Yang X, Huang L, Peng Y, Ma X, et al. Genetic Structure and Eco-Geographical Differentiation of Wild Sheep Fescue (Festuca ovina L.) in Xinjiang, Northwest China. Molecules. 2017; 22(8):1316. https://doi.org/10.3390/molecules22081316
Chicago/Turabian StyleZhang, Chenglin, Jianbo Zhang, Yan Fan, Ming Sun, Wendan Wu, Wenda Zhao, Xiaopeng Yang, Linkai Huang, Yan Peng, Xiao Ma, and et al. 2017. "Genetic Structure and Eco-Geographical Differentiation of Wild Sheep Fescue (Festuca ovina L.) in Xinjiang, Northwest China" Molecules 22, no. 8: 1316. https://doi.org/10.3390/molecules22081316