
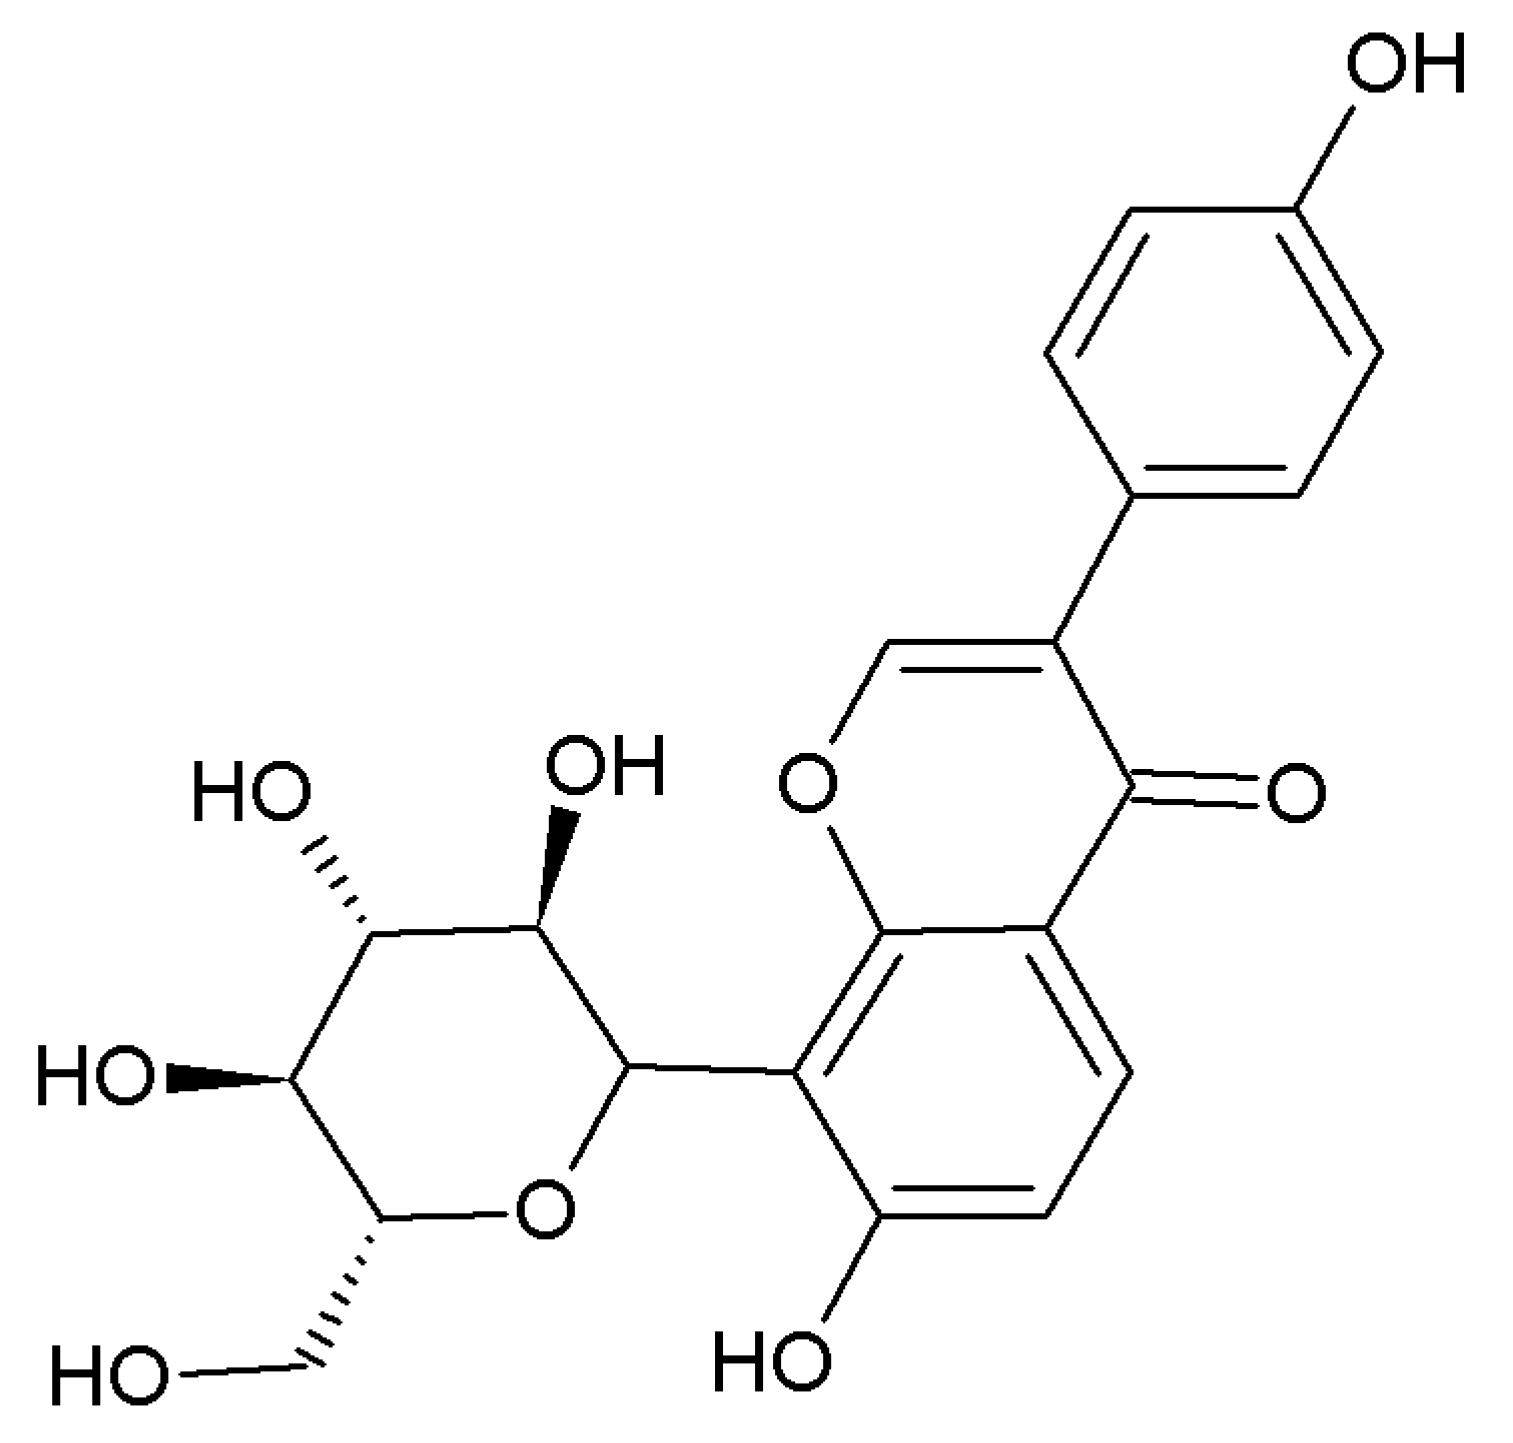
Pharmacokinetics and Tissue Distribution Kinetics of Puerarin in Rats Using Indirect Competitive ELISA

 ,
,
Abstract
:1. Introduction
2. Results and Discussion
3. Materials and Methods
3.1. Chemicals and Reagents
3.2. Instruments
3.3. Animals and Drug Administration
3.4. icELISA
3.5. Calibration Curve
3.6. Pharmacokinetics
4. Conclusions
Acknowledgments
Author Contributions
Conflicts of Interest
References
- Xu, X.; Zheng, N.; Chen, Z.; Huang, W.; Liang, T.; Kuang, H. Puerarin, isolated from Pueraria lobata (Willd.), protects against diabetic nephropathy by attenuating oxidative stress. Gene 2016, 591, 411–416. [Google Scholar] [CrossRef] [PubMed]
- Liu, B.; Tan, Y.; Wang, D.; Liu, M. Puerarin for ischaemic stroke. Cochrane Database Syst. Rev. 2016, 2, CD004955. [Google Scholar] [PubMed]
- Chen, Y.Y.; Chen, W.; Zhang, Q.; Li, H.; Zhang, Y.W.; Kang, Q.; Lan, Y.I.; Wu, Q. Puerarin and betahistine treatment of vertebrobasilar ischemia vertigo: A meta-analysis of randomized controlled trials. Exp. Ther. Med. 2016, 11, 1051–1058. [Google Scholar] [CrossRef] [PubMed]
- Zhang, H.; Zhai, Z.; Zhou, H.; Li, Y.; Li, X.; Lin, Y.; Li, W.; Shi, Y.; Zhou, M.S. Puerarin inhibits oxLDL-induced macrophage activation and foam cell formation in human THP1 macrophage. BioMed Res. Int. 2015, 2015, 403616. [Google Scholar] [CrossRef] [PubMed]
- Xu, X.; Wang, J.; Zhang, H.; Tian, G.; Liu, Y. Puerarin reduces apoptosis in rat hippocampal neurons culture in high glucose medium by modulating the p38 mitogen activated protein kinase and C-Jun N-terminal kinase signaling pathways. J. Tradit. Chin. Med. 2016, 36, 78–84. [Google Scholar] [PubMed]
- Yuan, Y.; Zhou, H.; Wu, Q.Q.; Li, F.F.; Bian, Z.Y.; Deng, W.; Zhou, M.Q.; Tang, Q.Z. Puerarin attenuates the inflammatory response and apoptosis in LPS-stimulated cardiomyocytes. Exp. Ther. Med. 2016, 11, 415–420. [Google Scholar] [CrossRef] [PubMed]
- Dang, X.; Miao, J.J.; Chen, A.Q.; Li, P.; Chen, L.; Liang, J.R.; Xie, R.M.; Zhao, Y. The antithrombotic effect of RSNK in blood-stasis model rats. J. Ethnopharmacol. 2015, 173, 266–272. [Google Scholar] [CrossRef] [PubMed]
- Yang, L.; Yao, D.; Yang, H.; Wei, Y.; Peng, Y.; Ding, Y.; Shu, L. Puerarin protects pancreatic β-cells in obese diabetic mice via activation of GLP-1R signaling. Mol. Endocrinol. 2016, 30, 361–371. [Google Scholar] [CrossRef] [PubMed]
- Cheng, Y.; Leng, W.; Zhang, J. Protective effect of puerarin against oxidative stress injury of neural cells and related mechanisms. Med. Sci. Monit. 2016, 22, 1244–1249. [Google Scholar] [CrossRef] [PubMed]
- Tian, X.; Liu, B.; Zhang, Y.; Li, H.; Wei, J.; Wang, G.; Chang, J.; Qiao, H. LC-MS/MS analysis and pharmacokinetics of sodium (±)-5-bromo-2-(α-hydroxypentyl) benzoate (BZP), an innovative potent anti-ischemic stroke agent in rats. Molecules 2016, 21, 501. [Google Scholar] [CrossRef] [PubMed]
- Xiao, Y.Y.; Ping, Q.N.; Chen, Z.P. A simple gas chromatographic method for the simultaneous determination and pharmacokinetic study of tetramethylpyrazine phosphate and borneol in mouse plasma and brain tissue after oral administration of the fufang tetramethylpyrazine phosphate tablets. J. Chromatogr. Sci. 2008, 46, 395–400. [Google Scholar] [CrossRef]
- Mifsud, J.; Sghendo, L.J. A novel chiral GC/MS method for the analysis of fluoxetine and norfluoxetine enantiomers in biological fluids. J. Pharm. Bioallied Sci. 2012, 4, 236–245. [Google Scholar] [CrossRef] [PubMed]
- Gao, C.; Li, X.; Li, Y.; Wang, L.; Xue, M. Pharmacokinetic interaction between puerarin and edaravone, and effect of borneol on the brain distribution kinetics of puerarin in rats. J. Pharm. Pharmacol. 2010, 62, 360–367. [Google Scholar] [CrossRef] [PubMed]
- Yan, B.; Xing, D.; Ding, Y.; Tao, J.; Du, L.J. HPLC method for the determination and pharmacokinetic studies on puerarin in cerebral ischemia reperfusion rat plasma after intravenous administration of puerariae radix isoflavone. J. Pharm. Biomed. Anal. 2005, 37, 297–301. [Google Scholar] [CrossRef] [PubMed]
- Qu, H.H.; Zhang, G.L.; Li, Y.F.; Sun, H.; Sun, Y.; Zhao, Y.; Wang, Q.G. Development of an enzyme-linked immunosorbent assay based on anti-puerarin monoclonal antibody and its applications. J. Chromatogr. B Anal. Technol. Biomed. Life Sci. 2014, 953–954, 120–125. [Google Scholar] [CrossRef] [PubMed]
- Qu, H.H.; Wan, F.; Shan, W.C.; Wang, X.Q.; Cheng, J.J.; Kong, H.; Zhao, Y.; Wang, Q.G. Pharmacokinetic analysis of orally administered puerarin in human saliva using an indirect competition ELISA. Anal. Methods 2015, 7, 8335–8343. [Google Scholar]
- Engler, F.A.; Balthasar, J.P. Development and validation of an enzyme-linked immunosorbent assay for the quantification of gelonin in mouse plasma. J. Immunoass. Immunochem. 2016, 37, 611–622. [Google Scholar] [CrossRef] [PubMed]
- Lowe, S.; Sher, E.; Wishart, G.; Jackson, K.; Yuen, E.; Brittain, C.; Fong, S.C.; Clarke, D.O.; Landschulz, W.H. An assessment of the central disposition of intranasally administered insulin lispro in the cerebrospinal fluid of healthy volunteers and beagle dogs. Drug Deliv. Transl. Res. 2017, 7, 11–15. [Google Scholar] [CrossRef] [PubMed]
- Oiso, S.; Morinaga, O.; Goroku, T.; Uto, T.; Shoyama, Y.; Kariyazono, H. Generation of an anti-dabigatran monoclonal antibody and its use in a highly sensitive and specific enzyme-linked immunosorbent assay for serum dabigatran. Ther. Drug Monit. 2015, 37, 594–599. [Google Scholar] [CrossRef] [PubMed]
- Qu, H.H.; Sai, J.Y.; Wang, Y.; Sun, Y.; Zhang, Y.; Li, Y.F.; Zhao, Y.; Wang, Q.G. Establishment of an enzyme-linked immunosorbent assay and application on determination of ginsenoside Re in human saliva. Planta Med. 2014, 80, 1143–1150. [Google Scholar] [CrossRef] [PubMed]
- Prasain, J.K.; Peng, N.; Moore, R.; Arabshahi, A.; Barnes, S.; Wyss, J.M. Tissue distribution of puerarin and its conjugated metabolites in rats assessed by liquid chromatography-tandem mass spectrometry. Phytomedicine 2009, 16, 65–71. [Google Scholar] [CrossRef] [PubMed]
- Luo, C.F.; Yuan, M.; Chen, M.S.; Liu, S.M.; Ji, H. Metabolites of puerarin identified by liquid chromatography tandem mass spectrometry: Similar metabolic profiles in liver and intestine of rats. J. Chromatogr. B Anal. Technol. Biomed. Life Sci. 2010, 878, 363–370. [Google Scholar] [CrossRef] [PubMed]
- Prasain, J.K.; Peng, N.; Acosta, E.; Moore, R.; Arabshahi, A.; Meezan, E.; Barnes, S.; Wyss, J.M. Pharmacokinetic study of puerarin in rat serum by liquid chromatography tandem mass spectrometry. Biomed. Chromatogr. 2007, 21, 410–414. [Google Scholar] [CrossRef] [PubMed]
- Sun, D.; Xue, A.; Wu, J.; Zhang, B.; Yu, J.; Li, Q.; Sun, C. Simultaneous determination of acetylpuerarin and puerarin in rat plasma by liquid chromatography-tandem mass spectrometry: Application to a pharmacokinetic study following intravenous and oral administration. J. Chromatogr. B Anal. Technol. Biomed. Life Sci. 2015, 995–996, 24–30. [Google Scholar] [CrossRef] [PubMed]
- Wu, Y.H.; Su, Z.R.; Chen, J.N.; Lin, J.; Lai, X.P. Evaluation on medication route of PUE by plasma concentration-time curve and histodistribution characteristics in mice. Tradit. Chin. Drug Res. Clin. Pharmacol. 2005, 16, 112–115. [Google Scholar]
- Cheng, L.; Zhang, H.Y.; Yuan, Z.M.; Li, X.T.; Wang, J. Shange lipid-lowering dispersible tablets of puerarin in rats in tissue distribution study. Pharmacol. Clin. Chin. Mater. Med. 2011, 27, 101–110. [Google Scholar]
- Li, Y.; Pan, W.S.; Chen, S.L.; Xu, H.X.; Yang, D.J.; Chan, A.S. Pharmacokinetic, tissue distribution, and excretion of puerarin and puerarin-phospholipid complex in rats. Drug Dev. Ind. Pharm. 2006, 32, 413–422. [Google Scholar] [CrossRef] [PubMed]
- Jung, H.R.; Kim, S.J.; Ham, S.H.; Cho, J.H.; Lee, Y.B.; Cho, H.Y. Simultaneous determination of puerarin and its active metabolite in human plasma by UPLC-MS/MS: Application to a pharmacokinetic study. J. Chromatogr. B Anal. Technol. Biomed. Life Sci. 2014, 971, 64–71. [Google Scholar] [CrossRef] [PubMed]
- Kong, H.; Wang, X.Q.; Wang, Q.G.; Zhao, Y.; Sun, Y.; Zhang, Y.; Xu, J.K.; Qu, H.H. Effect of puerarin on the pharmacokinetics of baicalin in Gegen Qinlian decoction in mice. Chin. J. Integr. Med. 2015. [Google Scholar] [CrossRef] [PubMed]
- Wu, S.; Xu, W.; Wang, F.R.; Yang, X.W. Study of the biotransformation of tongmai formula by human intestinal flora and its intestinal permeability across the Caco-2 cell monolayer. Molecules 2015, 20, 18704–18716. [Google Scholar] [CrossRef] [PubMed]
Sample Availability: Samples of the compounds puerarin and daidzin are available from the authors. |


| Sample | Regression Equation | R2 | Detection Range (ng/mL) |
|---|---|---|---|
| Blood | Y = −0.19 ln (X) + 1.42 | 0.98 | 3.05–780 |
| Heart | Y = −0.14 ln (X) + 1.05 | 0.97 | 3.05–780 |
| Liver | Y = −0.14 ln (X) + 1.07 | 0.98 | 3.05–780 |
| Spleen | Y = −0.14 ln (X) + 1.08 | 0.99 | 3.05–780 |
| Lung | Y = −0.14 ln (X) + 1.04 | 0.97 | 3.05–780 |
| Kidney | Y = −0.13 ln (X) + 1.01 | 0.95 | 3.05–780 |
| Hippocampus | Y = −0.25 ln (X) + 1.89 | 0.97 | 3.05–780 |
| Cerebral cortex | Y = −0.23 ln (X) + 1.90 | 0.97 | 3.05–780 |
| Striatum | Y = −0.18 ln (X) + 1.23 | 0.96 | 3.05–780 |
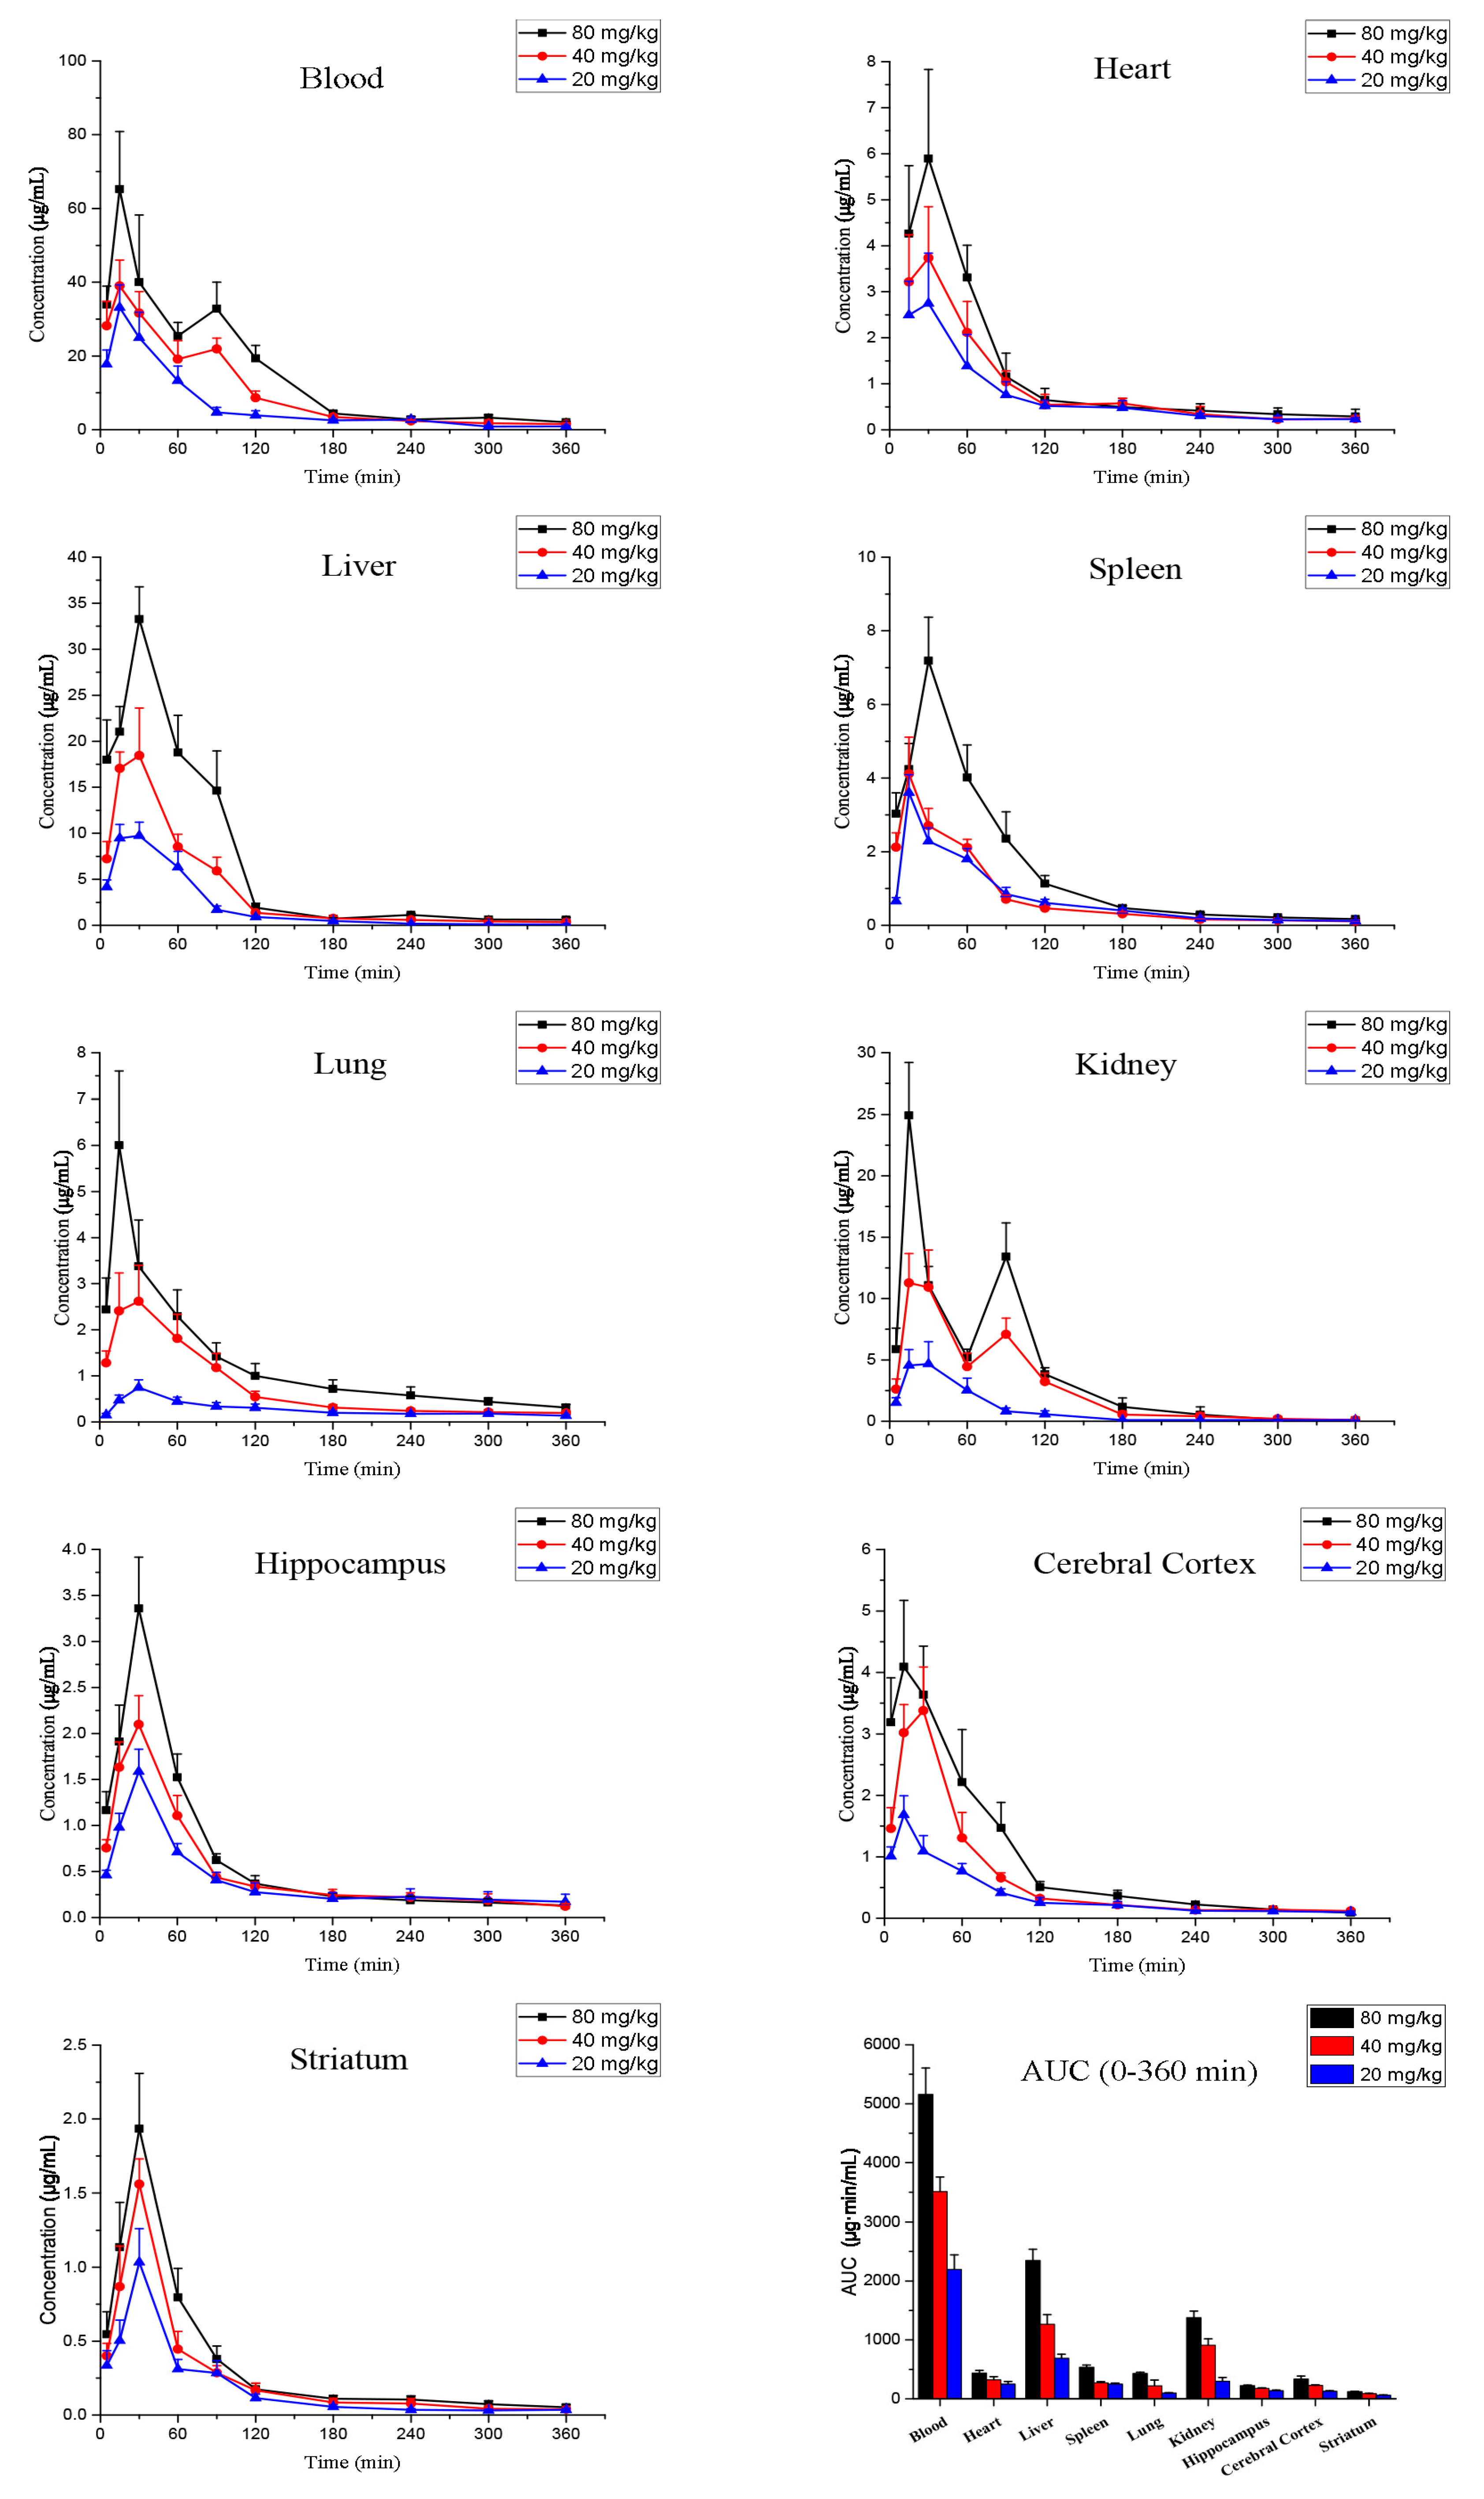
| Sample | Group (mg/kg) | AUC0–360 min (µg·min/mL) | Cmax (µg/mL) | Tmax (min) | MRT (min) |
|---|---|---|---|---|---|
| 80 | 5157.76 ± 449.93 | 67.02 ± 12.87 | 18 ± 6 | 102 ± 14 | |
| Blood | 40 | 3510.49 ± 244.72 | 40.10 ± 6.35 | 15 ± 0 | 95 ± 12 |
| 20 | 2196.95 ± 246.74 | 33.66 ± 6.14 | 18 ± 6 | 94 ± 8 | |
| 80 | 438.32 ± 44.50 | 6.33 ± 1.56 | 28 ± 6 | 116 ± 16 | |
| Heart | 40 | 323.64 ± 54.03 | 3.95 ± 0.74 | 25 ± 8 | 124 ± 11 |
| 20 | 251.77 ± 44.14 | 2.95 ± 0.97 | 28 ± 6 | 167 ± 44 | |
| 80 | 2348.13 ± 191.24 | 33.27 ± 3.51 | 30 ± 0 | 76 ± 13 | |
| Liver | 40 | 1264.43 ± 164.14 | 20.16 ± 1.85 | 28 ± 6 | 84 ± 20 |
| 20 | 688.37 ± 68.26 | 10.91 ± 0.72 | 25 ± 8 | 63 ± 2 | |
| 80 | 536.07 ± 37.46 | 7.19 ± 1.18 | 30 ± 0 | 115 ± 30 | |
| Spleen | 40 | 271.47 ± 20.66 | 4.11 ± 0.99 | 15 ± 0 | 97 ± 15 |
| 20 | 252.19 ± 14.48 | 3.61 ± 0.48 | 15 ± 0 | 112 ± 12 | |
| 80 | 430.70 ± 21.97 | 5.81 ± 1.14 | 20 ± 8 | 146 ± 23 | |
| Lung | 40 | 218.93 ± 98.66 | 3.08 ± 0.69 | 33 ± 15 | 148 ± 36 |
| 20 | 97.75 ± 5.96 | 0.74 ± 0.16 | 25 ± 7 | 82 ± 40 | |
| 80 | 1377.37 ± 111.66 | 24.93 ± 4.26 | 15 ± 0 | 73 ± 9 | |
| Kidney | 40 | 908.04 ± 109.56 | 11.63 ± 1.98 | 25 ± 8 | 75 ± 6 |
| 20 | 299.92 ± 63.01 | 5.24 ± 0.93 | 25 ± 7 | 82 ± 40 | |
| 80 | 223.47 ± 9.21 | 3.35 ± 0.55 | 30 ± 0 | 123 ± 23 | |
| Hippocampus | 40 | 175.19 ± 11.39 | 2.09 ± 0.31 | 30 ± 0 | 169 ± 38 |
| 20 | 137.86 ± 9.98 | 1.58 ± 0.24 | 27 ± 6 | 163 ± 18 | |
| 80 | 336.88 ± 48.66 | 4.48 ± 0.86 | 22 ± 8 | 84 ± 7 | |
| Cerebral cortex | 40 | 225.94 ± 9.95 | 3.56 ± 0.61 | 25 ± 8 | 116 ± 34 |
| 20 | 130.32 ± 8.46 | 1.73 ± 0.24 | 17 ± 6 | 129 ± 20 | |
| 80 | 120.64 ± 8.72 | 1.93 ± 0.37 | 30 ± 0 | 103 ± 22 | |
| Striatum | 40 | 88.09 ± 8.41 | 1.55 ± 0.17 | 30 ± 0 | 99 ± 17 |
| 20 | 61.27 ± 7.86 | 1.03 ± 0.22 | 30 ± 0 | 113 ± 43 |
| Sample | Dose (mg/kg) | Dose Route | AUC | Observation Period | Number of Data Points | Analysis Method | Literature Reference |
|---|---|---|---|---|---|---|---|
| Rat plasma | 62.5 | iv. | 13.80 ± 1.71 μg·h/mL | 0–240 min | 9 | HPLC | [13] |
| Rat plasma | 32 | iv. | 2773.2 ± 572.3 ng·min/mL | 0–240 min | 8 | HPLC | [14] |
| Rat serum | 50 | ig. | 9.17 ± 4.87 mg·h/L | 0–4 h | 8 | HPLC-MS/MS | [23] |
| Rat plasma | 15 | iv. | 6587.04 ± 1520.60 ng·h/mL | 0–8 h | 9 | LC-MS/MS | [24] |
| Rat plasma | 80 | ip. | 5157.760 ± 449.934 µg·min/mL | 0–360 min | 10 | ELISA | This paper |
| Rat plasma | 40 | ip. | 3510.49 ± 244.72 µg·min/mL | 0–360 min | 10 | ELISA | This paper |
| Rat plasma | 20 | ip. | 2196.95 ± 246.74 µg·min/mL | 0–360 min | 10 | ELISA | This paper |
| Group (mg/kg) | Tissue | Time (min) | |||||||||
|---|---|---|---|---|---|---|---|---|---|---|---|
| 5 | 15 | 30 | 60 | 90 | 120 | 180 | 240 | 300 | 360 | ||
| 80 | Blood | 33.97 ± 4.94 | 65.26 ± 15.61 | 40.00 ± 18.22 | 25.38 ± 3.70 | 32.84 ± 7.15 | 19.36 ± 3.52 | 4.41 ± 0.67 | 2.80 ± 0.81 | 3.28 ± 0.72 | 2.05 ± 0.21 |
| Heart | 1.96 ± 0.64 | 4.27 ± 1.47 | 5.89 ± 1.94 | 3.31 ± 0.70 | 1.16 ± 0.51 | 0.65 ± 0.25 | 0.49 ± 0.19 | 0.42 ± 0.15 | 0.34 ± 0.14 | 0.29 ± 0.16 | |
| Liver | 18.00 ± 4.32 | 21.04 ± 2.73 | 33.27 ± 3.51 | 18.79 ± 4.02 | 114.62 ± 4.33 | 1.93 ± 0.48 | 0.73 ± 0.11 | 1.14 ± 0.15 | 0.63 ± 0.06 | 0.62 ± 0.25 | |
| Spleen | 3.03 ± 0.57 | 4.24 ± 0.70 | 7.19 ± 1.18 | 4.02 ± 0.88 | 2.36 ± 0.73 | 1.13 ± 0.22 | 0.47 ± 0.06 | 0.30 ± 0.05 | 0.21 ± 0.02 | 0.17 ± 0.02 | |
| Lung | 2.43 ± 0.68 | 6.00 ± 1.60 | 3.38 ± 1.01 | 2.30 ± 0.57 | 1.42 ± 0.29 | 1.00 ± 0.27 | 0.71 ± 0.20 | 0.58 ± 0.18 | 0.44 ± 0.09 | 0.31 ± 0.07 | |
| Kidney | 5.87 ± 1.72 | 24.93 ± 4.27 | 11.09 ± 1.53 | 5.20 ± 0.69 | 13.42 ± 2.74 | 3.83 ± 0.54 | 1.18 ± 0.73 | 0.54 ± 0.63 | 0.14 ± 0.06 | 0.08 ± 0.03 | |
| Hippocampus | 1.17 ± 0.20 | 1.91 ± 0.40 | 3.36 ± 0.56 | 1.52 ± 0.25 | 0.62 ± 0.07 | 0.37 ± 0.09 | 0.23 ± 0.04 | 0.19 ± 0.04 | 0.16 ± 0.04 | 0.13 ± 0.02 | |
| Cerebral cortex | 3.19 ± 0.72 | 4.09 ± 1.08 | 3.64 ± 0.79 | 2.21 ± 0.86 | 1.47 ± 0.42 | 0.51 ± 0.09 | 0.36 ± 0.09 | 0.23 ± 0.03 | 0.14 ± 0.02 | 0.09 ± 0.04 | |
| Striatum | 0.55 ± 0.15 | 1.14 ± 0.30 | 1.93 ± 0.37 | 0.80 ± 0.19 | 0.38 ± 0.09 | 0.17 ± 0.04 | 0.11 ± 0.02 | 0.10 ± 0.03 | 0.07 ± 0.02 | 0.05 ± 0.02 | |
| 40 | Blood | 28.21 ± 6.57 | 38.97 ± 7.06 | 31.63 ± 5.84 | 19.15 ± 5.02 | 21.92 ± 2.93 | 8.68 ± 1.78 | 3.43 ± 0.71 | 2.35 ± 0.23 | 1.73 ± 0.87 | 1.50 ± 0.34 |
| Heart | 1.36 ± 0.27 | 3.22 ± 1.02 | 3.73 ± 1.11 | 2.11 ± 0.68 | 1.04 ± 0.24 | 0.54 ± 0.23 | 0.57 ± 0.11 | 0.34 ± 0.17 | 0.23 ± 0.04 | 0.24 ± 0.05 | |
| Liver | 7.23 ± 1.87 | 17.04 ± 1.79 | 18.46 ± 5.15 | 8.53 ± 1.36 | 5.92 ± 1.49 | 1.37 ± 0.13 | 0.75 ± 0.26 | 0.58 ± 0.12 | 0.43 ± 0.09 | 0.33 ± 0.09 | |
| Spleen | 2.12 ± 0.39 | 4.11 ± 0.99 | 2.71 ± 0.47 | 2.11 ± 0.23 | 0.71 ± 0.11 | 0.46 ± 0.05 | 0.31 ± 0.06 | 0.16 ± 0.03 | 0.14 ± 0.02 | 0.11 ± 0.02 | |
| Lung | 1.28 ± 0.26 | 2.41 ± 0.82 | 2.62 ± 0.78 | 1.81 ± 0.53 | 1.18 ± 0.31 | 0.54 ± 0.13 | 0.31 ± 0.06 | 0.24 ± 0.05 | 0.21 ± 0.05 | 0.20 ± 0.05 | |
| Kidney | 2.62 ± 0.83 | 11.28 ± 2.34 | 10.92 ± 3.02 | 4.45 ± 1.10 | 7.09 ± 1.31 | 3.22 ± 0.71 | 0.55 ± 0.27 | 0.40 ± 0.28 | 0.20 ± 0.07 | 0.11 ± 0.03 | |
| Hippocampus | 0.77 ± 0.09 | 1.63 ± 0.28 | 2.10 ± 0.31 | 1.11 ± 0.22 | 0.44 ± 0.05 | 0.34 ± 0.05 | 0.25 ± 0.06 | 0.22 ± 0.05 | 0.19 ± 0.07 | 0.12 ± 0.03 | |
| Cerebral cortex | 1.46 ± 0.34 | 3.02 ± 0.46 | 3.38 ± 0.71 | 1.31 ± 0.41 | 0.66 ± 0.09 | 0.32 ± 0.03 | 0.22 ± 0.04 | 0.13 ± 0.02 | 0.14 ± 0.04 | 0.12 ± 0.03 | |
| Striatum | 0.40 ± 0.08 | 0.87 ± 0.27 | 1.56 ± 0.17 | 0.44 ± 0.12 | 0.29 ± 0.05 | 0.17 ± 0.05 | 0.08 ± 0.03 | 0.08 ± 0.03 | 0.04 ± 0.01 | 0.04 ± 0.01 | |
| 20 | Blood | 17.79 ± 3.82 | 33.19 ± 6.07 | 24.97 ± 6.88 | 13.32 ± 3.94 | 4.69 ± 1.36 | 3.89 ± 1.23 | 2.57 ± 0.31 | 2.73 ± 0.75 | 0.87 ± 0.18 | 0.89 ± 0.13 |
| Heart | 1.05 ± 0.32 | 2.49 ± 0.74 | 2.75 ± 1.09 | 1.39 ± 0.68 | 0.76 ± 0.29 | 0.52 ± 0.12 | 0.48 ± 0.16 | 0.30 ± 0.07 | 0.23 ± 0.07 | 0.23 ± 0.04 | |
| Liver | 4.16 ± 0.76 | 9.45 ± 1.50 | 9.73 ± 1.48 | 6.32 ± 1.72 | 1.69 ± 0.42 | 0.89 ± 0.15 | 0.47 ± 0.06 | 0.19 ± 0.03 | 0.12 ± 0.02 | 0.10 ± 0.01 | |
| Spleen | 0.65 ± 0.10 | 3.61 ± 0.48 | 2.29 ± 0.36 | 1.80 ± 0.28 | 0.85 ± 0.18 | 0.61 ± 0.09 | 0.40 ± 0.07 | 0.19 ± 0.03 | 0.14 ± 0.03 | 0.12 ± 0.02 | |
| Lung | 0.15 ± 0.04 | 0.47 ± 0.12 | 0.75 ± 0.17 | 0.44 ± 0.10 | 0.33 ± 0.09 | 0.31 ± 0.08 | 0.20 ± 0.04 | 0.18 ± 0.02 | 0.18 ± 0.03 | 0.14 ± 0.01 | |
| Kidney | 1.51 ± 0.41 | 4.55 ± 1.29 | 4.67 ± 1.81 | 2.52 ± 1.00 | 0.81 ± 0.27 | 0.57 ± 0.27 | 0.10 ± 0.02 | 0.10 ± 0.01 | 0.10 ± 0.01 | 0.10 ± 0.01 | |
| Hippocampus | 0.46 ± 0.05 | 0.98 ± 0.15 | 1.59 ± 0.24 | 0.71 ± 0.09 | 0.41 ± 0.08 | 0.28 ± 0.10 | 0.20 ± 0.07 | 0.23 ± 0.09 | 0.19 ± 0.09 | 0.17 ± 0.08 | |
| Cerebral cortex | 1.01 ± 0.15 | 1.68 ± 0.31 | 1.09 ± 0.25 | 0.77 ± 0.12 | 0.41 ± 0.07 | 0.25 ± 0.08 | 0.21 ± 0.06 | 0.12 ± 0.02 | 0.12 ± 0.02 | 0.10 ± 0.02 | |
| Striatum | 0.34 ± 0.10 | 0.50 ± 0.14 | 1.03 ± 0.23 | 0.31 ± 0.06 | 0.28 ± 0.08 | 0.11 ± 0.03 | 0.05 ± 0.01 | 0.03 ± 0.01 | 0.03 ± 0.01 | 0.03 ± 0.01 | |
© 2017 by the authors. Licensee MDPI, Basel, Switzerland. This article is an open access article distributed under the terms and conditions of the Creative Commons Attribution (CC BY) license (http://creativecommons.org/licenses/by/4.0/).
Share and Cite
Kong, H.; Wang, X.; Shi, R.; Zhao, Y.; Cheng, J.; Yan, X.; Liu, X.; Wang, Y.; Zhang, M.; Wang, Q.; et al. Pharmacokinetics and Tissue Distribution Kinetics of Puerarin in Rats Using Indirect Competitive ELISA. Molecules 2017, 22, 939. https://doi.org/10.3390/molecules22060939
Kong H, Wang X, Shi R, Zhao Y, Cheng J, Yan X, Liu X, Wang Y, Zhang M, Wang Q, et al. Pharmacokinetics and Tissue Distribution Kinetics of Puerarin in Rats Using Indirect Competitive ELISA. Molecules. 2017; 22(6):939. https://doi.org/10.3390/molecules22060939
Chicago/Turabian StyleKong, Hui, Xueqian Wang, Rongfeng Shi, Yan Zhao, Jinjun Cheng, Xin Yan, Xiaoman Liu, Yongzhi Wang, Meiling Zhang, Qingguo Wang, and et al. 2017. "Pharmacokinetics and Tissue Distribution Kinetics of Puerarin in Rats Using Indirect Competitive ELISA" Molecules 22, no. 6: 939. https://doi.org/10.3390/molecules22060939