
Determination and Pharmacokinetic Study of Three Diterpenes in Rat Plasma by UHPLC-ESI-MS/MS after Oral Administration of Rosmarinus officinalis L. Extract

 ,
,
Abstract
:1. Introduction
2. Results and Discussion
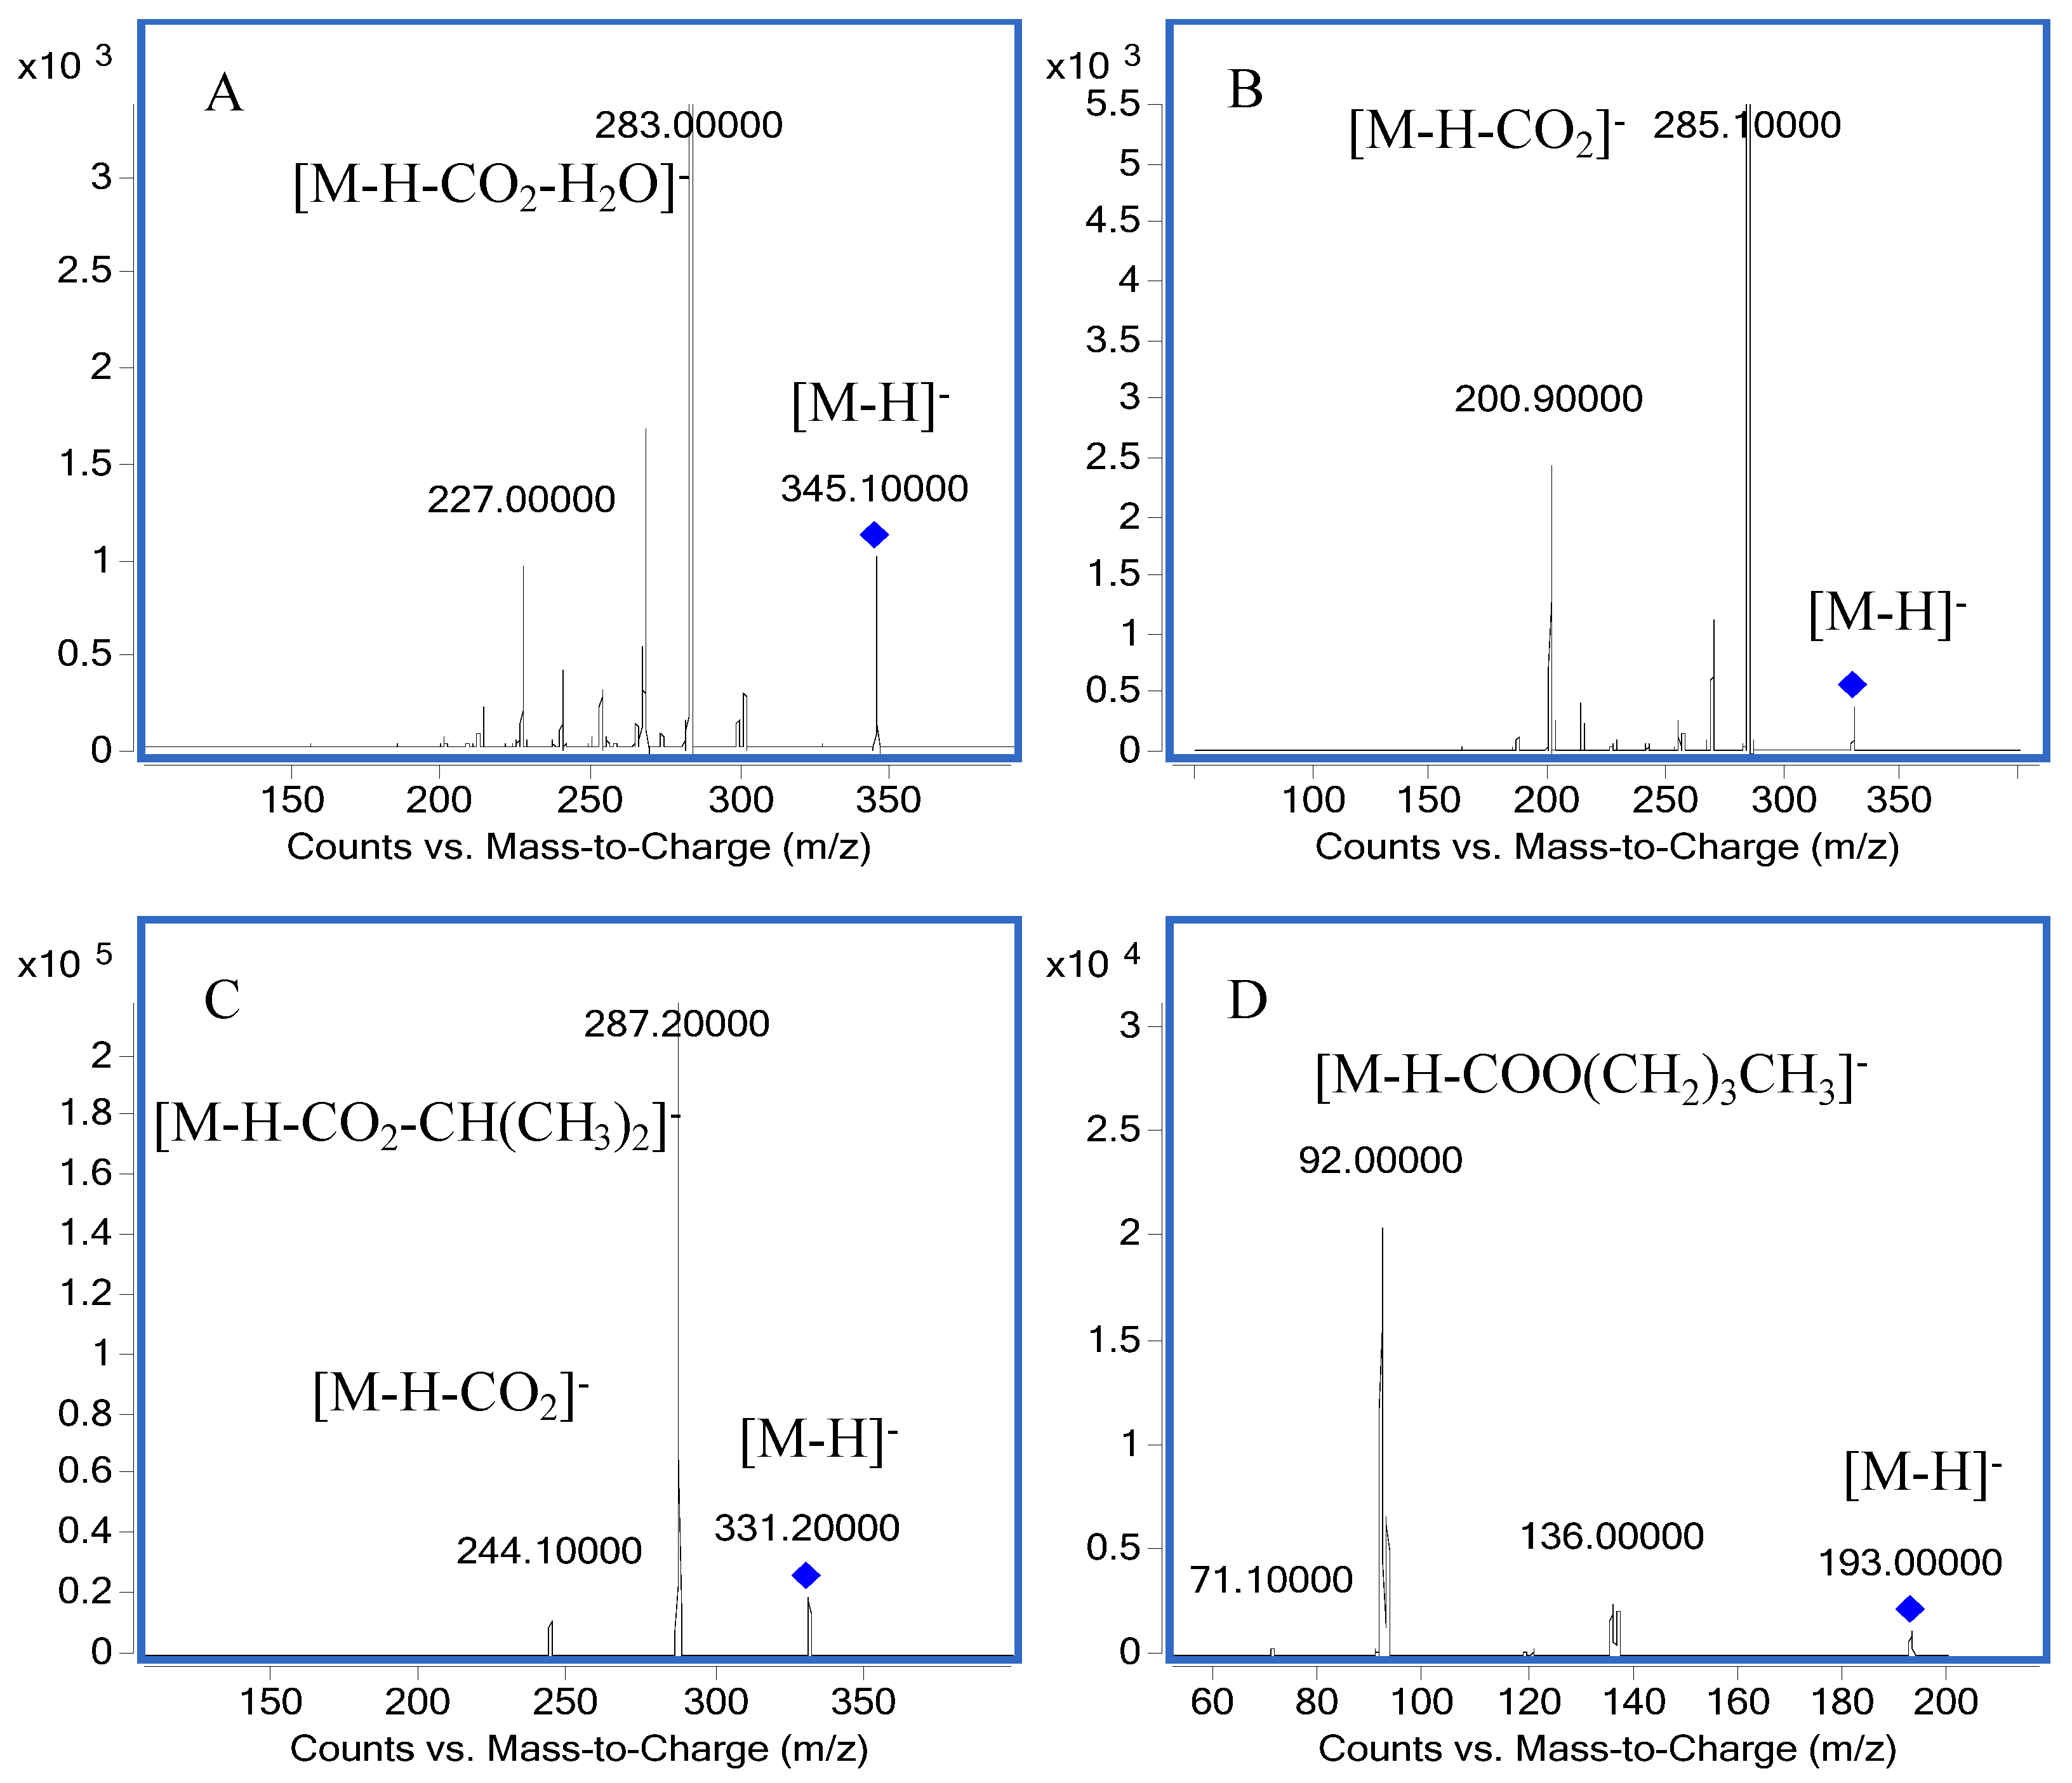
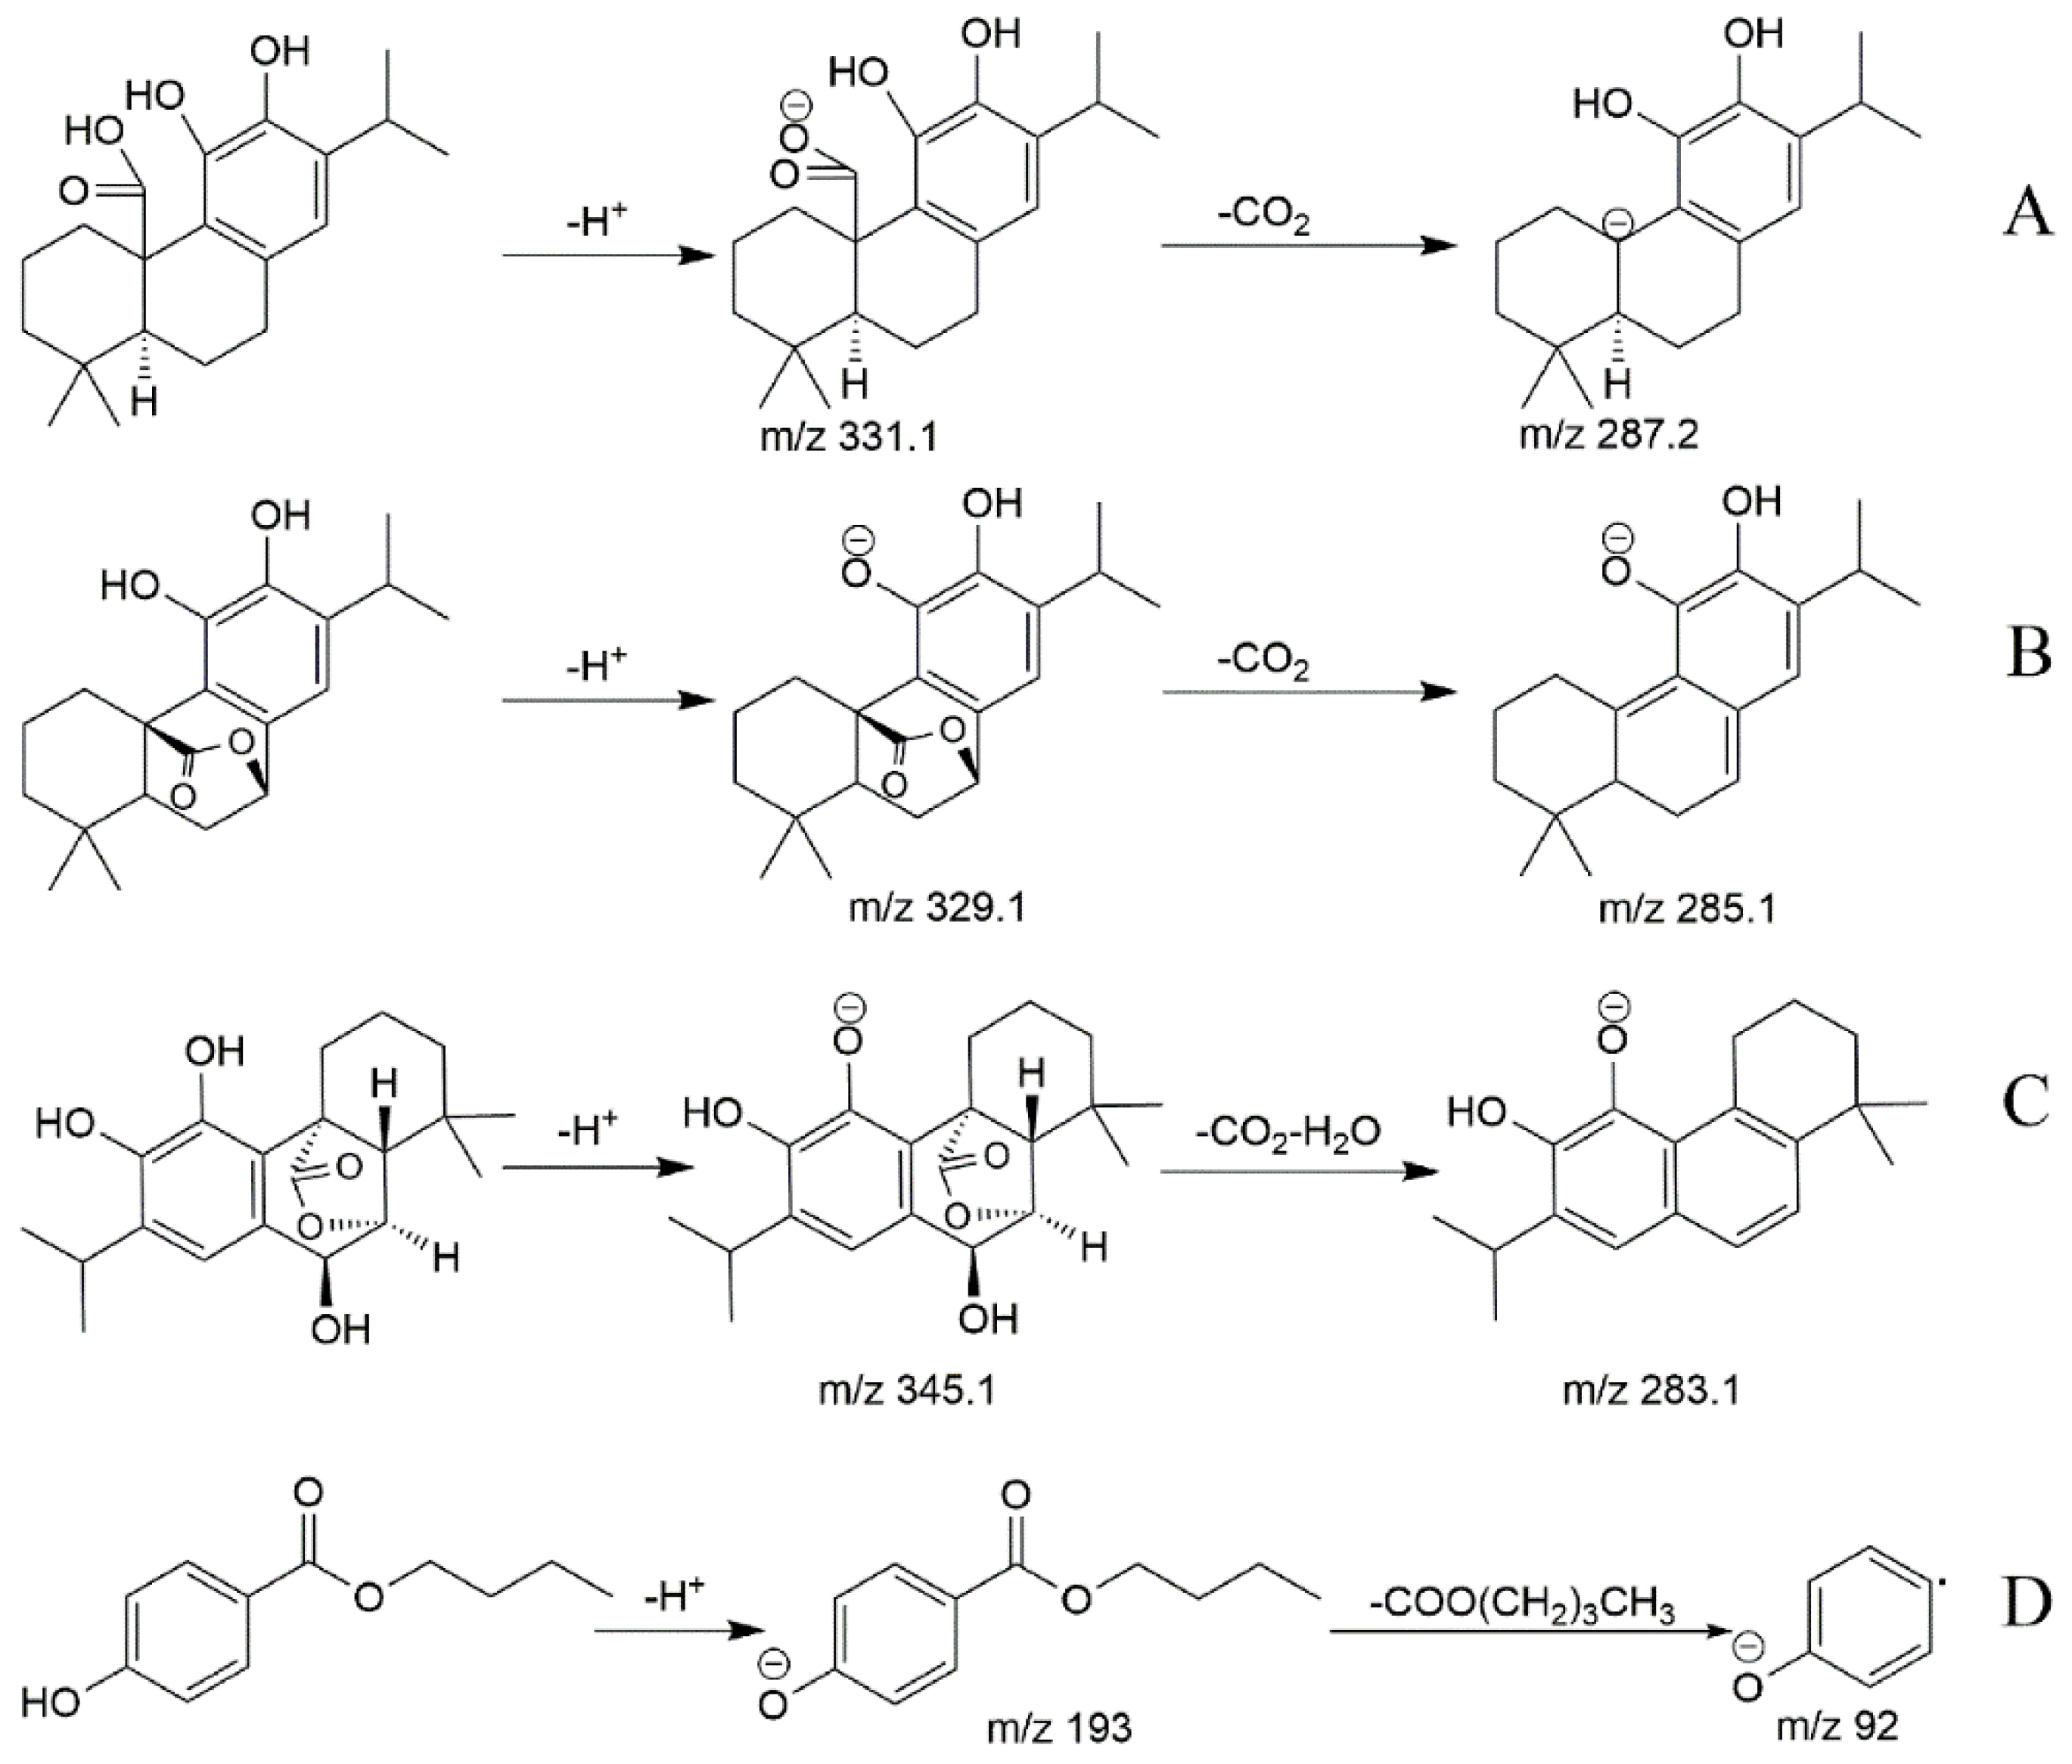
2.1. Mass Spectra
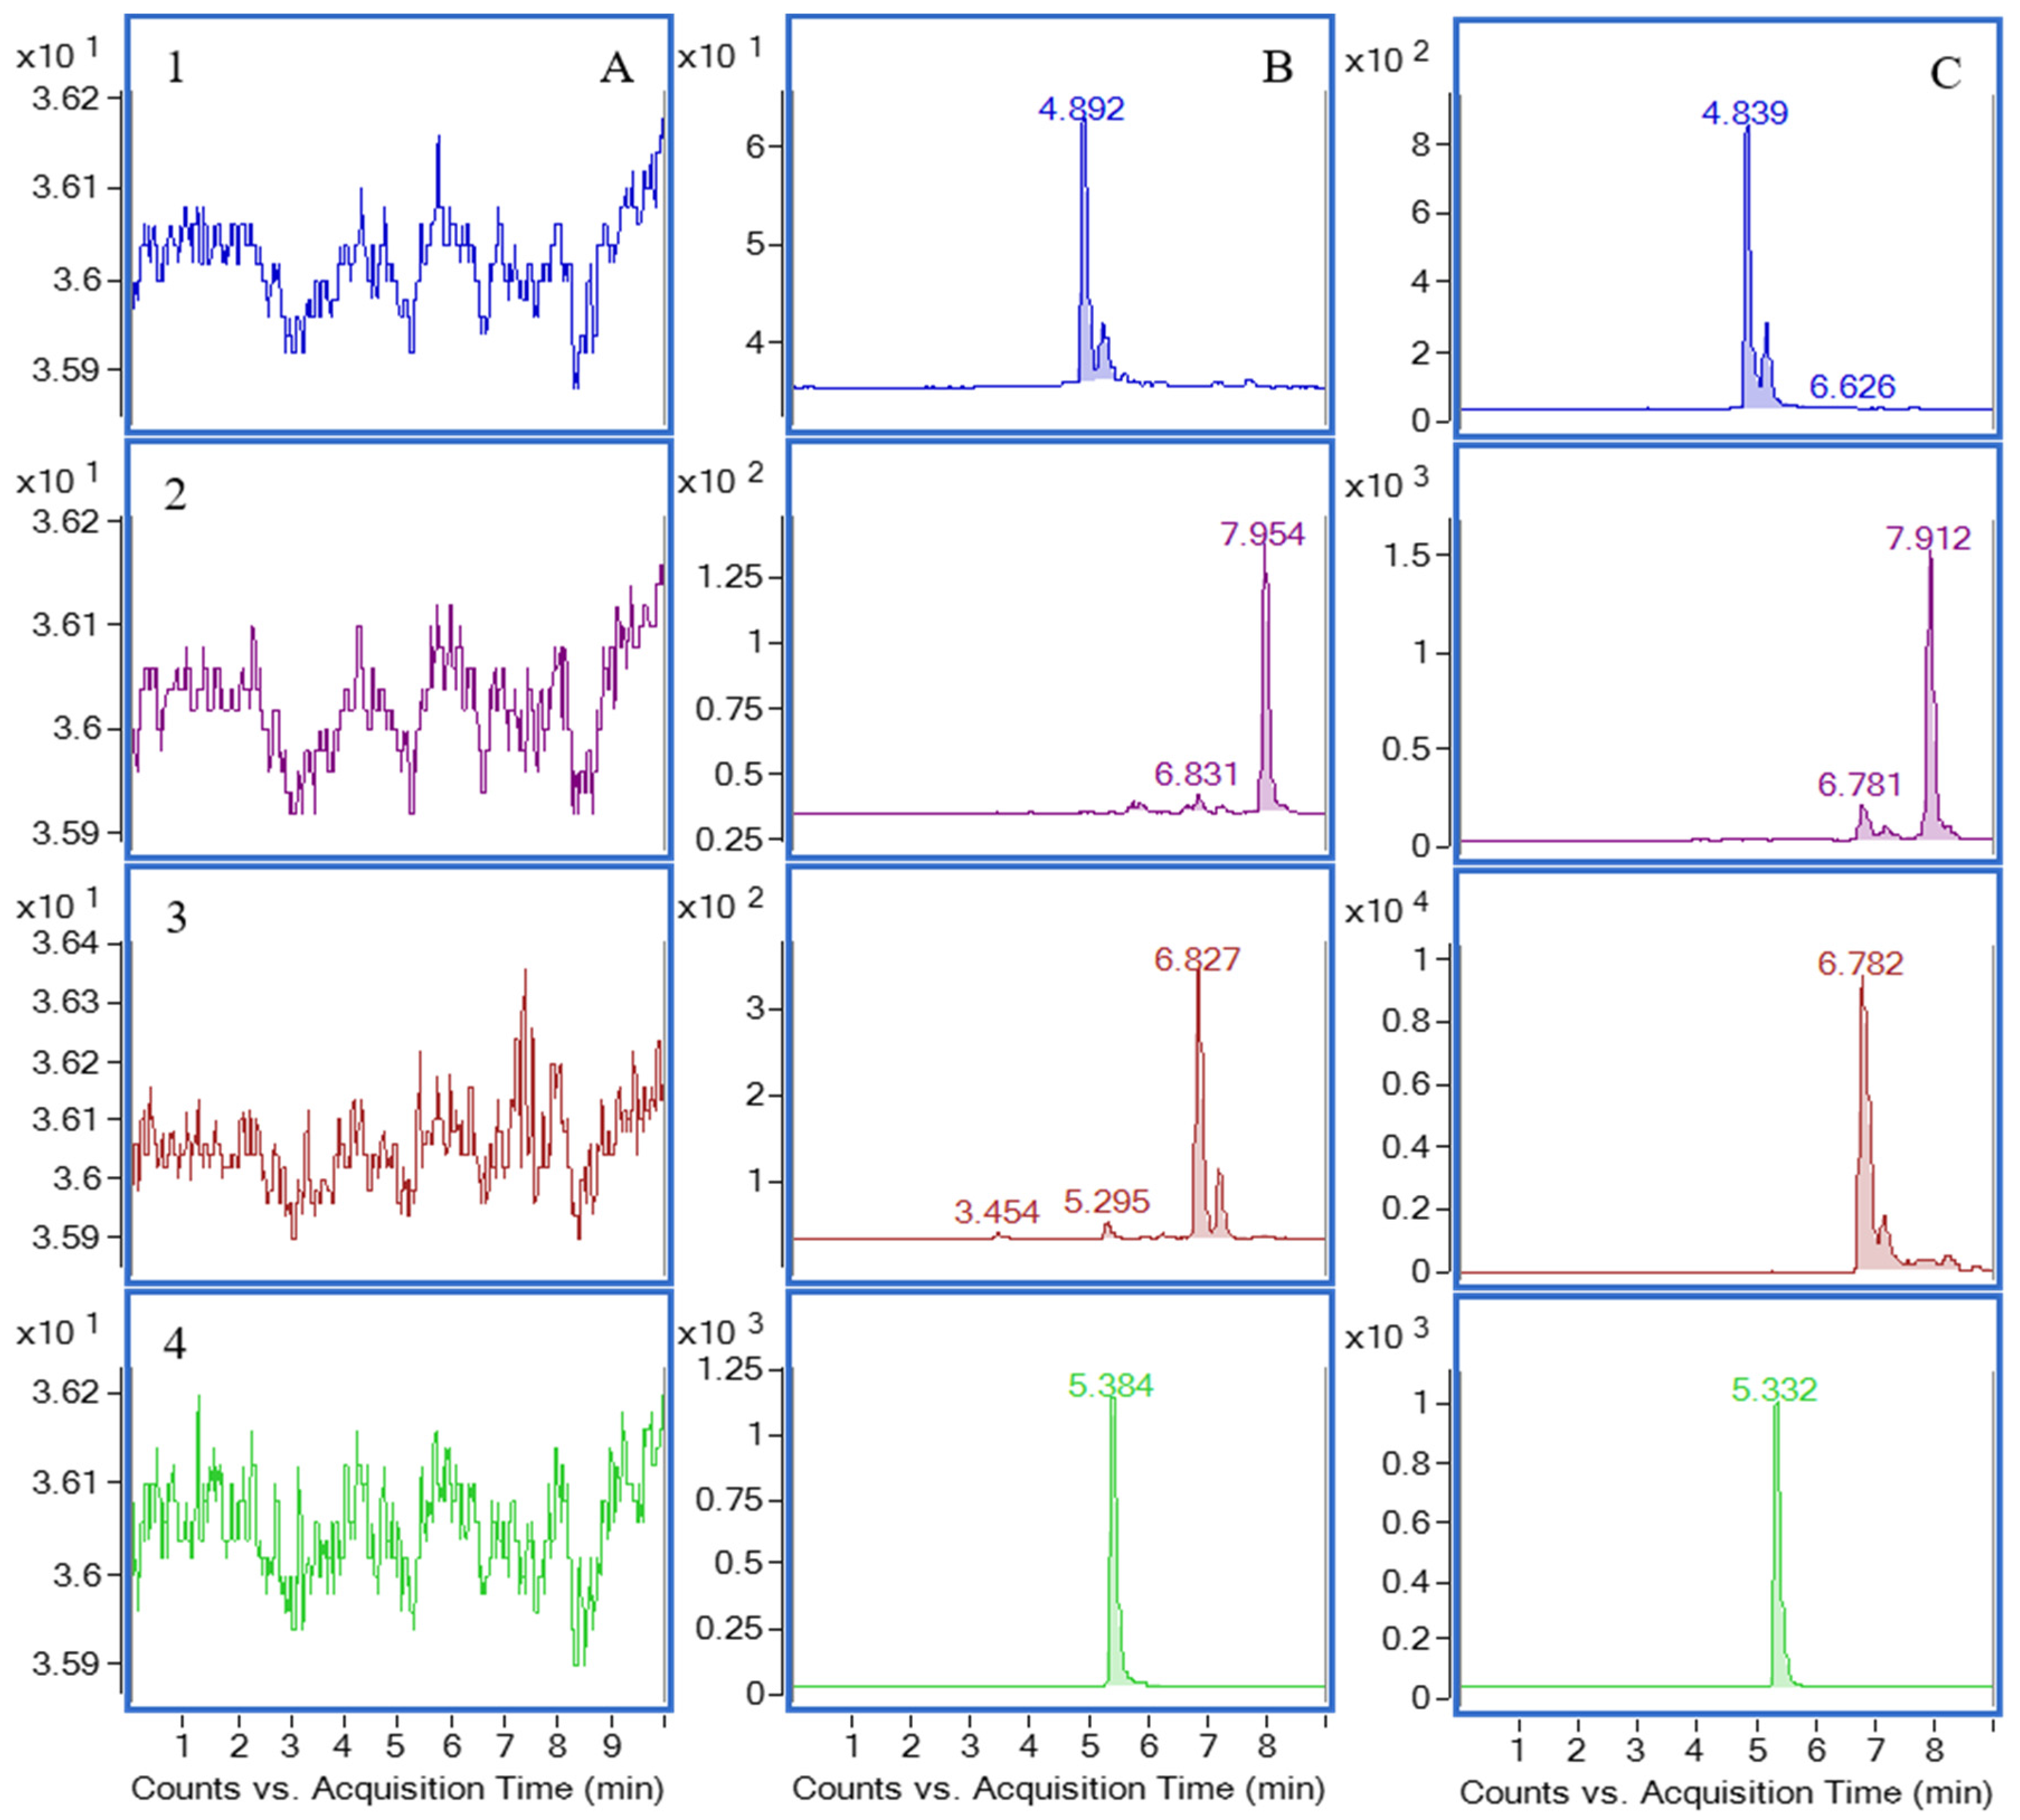
2.2. Chromatography
2.3. Selection of Extraction Method
2.4. Method Validation
2.4.1. Selectivity
2.4.2. Linearity and Lower Limit of Quantification
2.4.3. Accuracy and Precision
2.4.4. Stability
2.4.5. Matrix Effect and Recovery
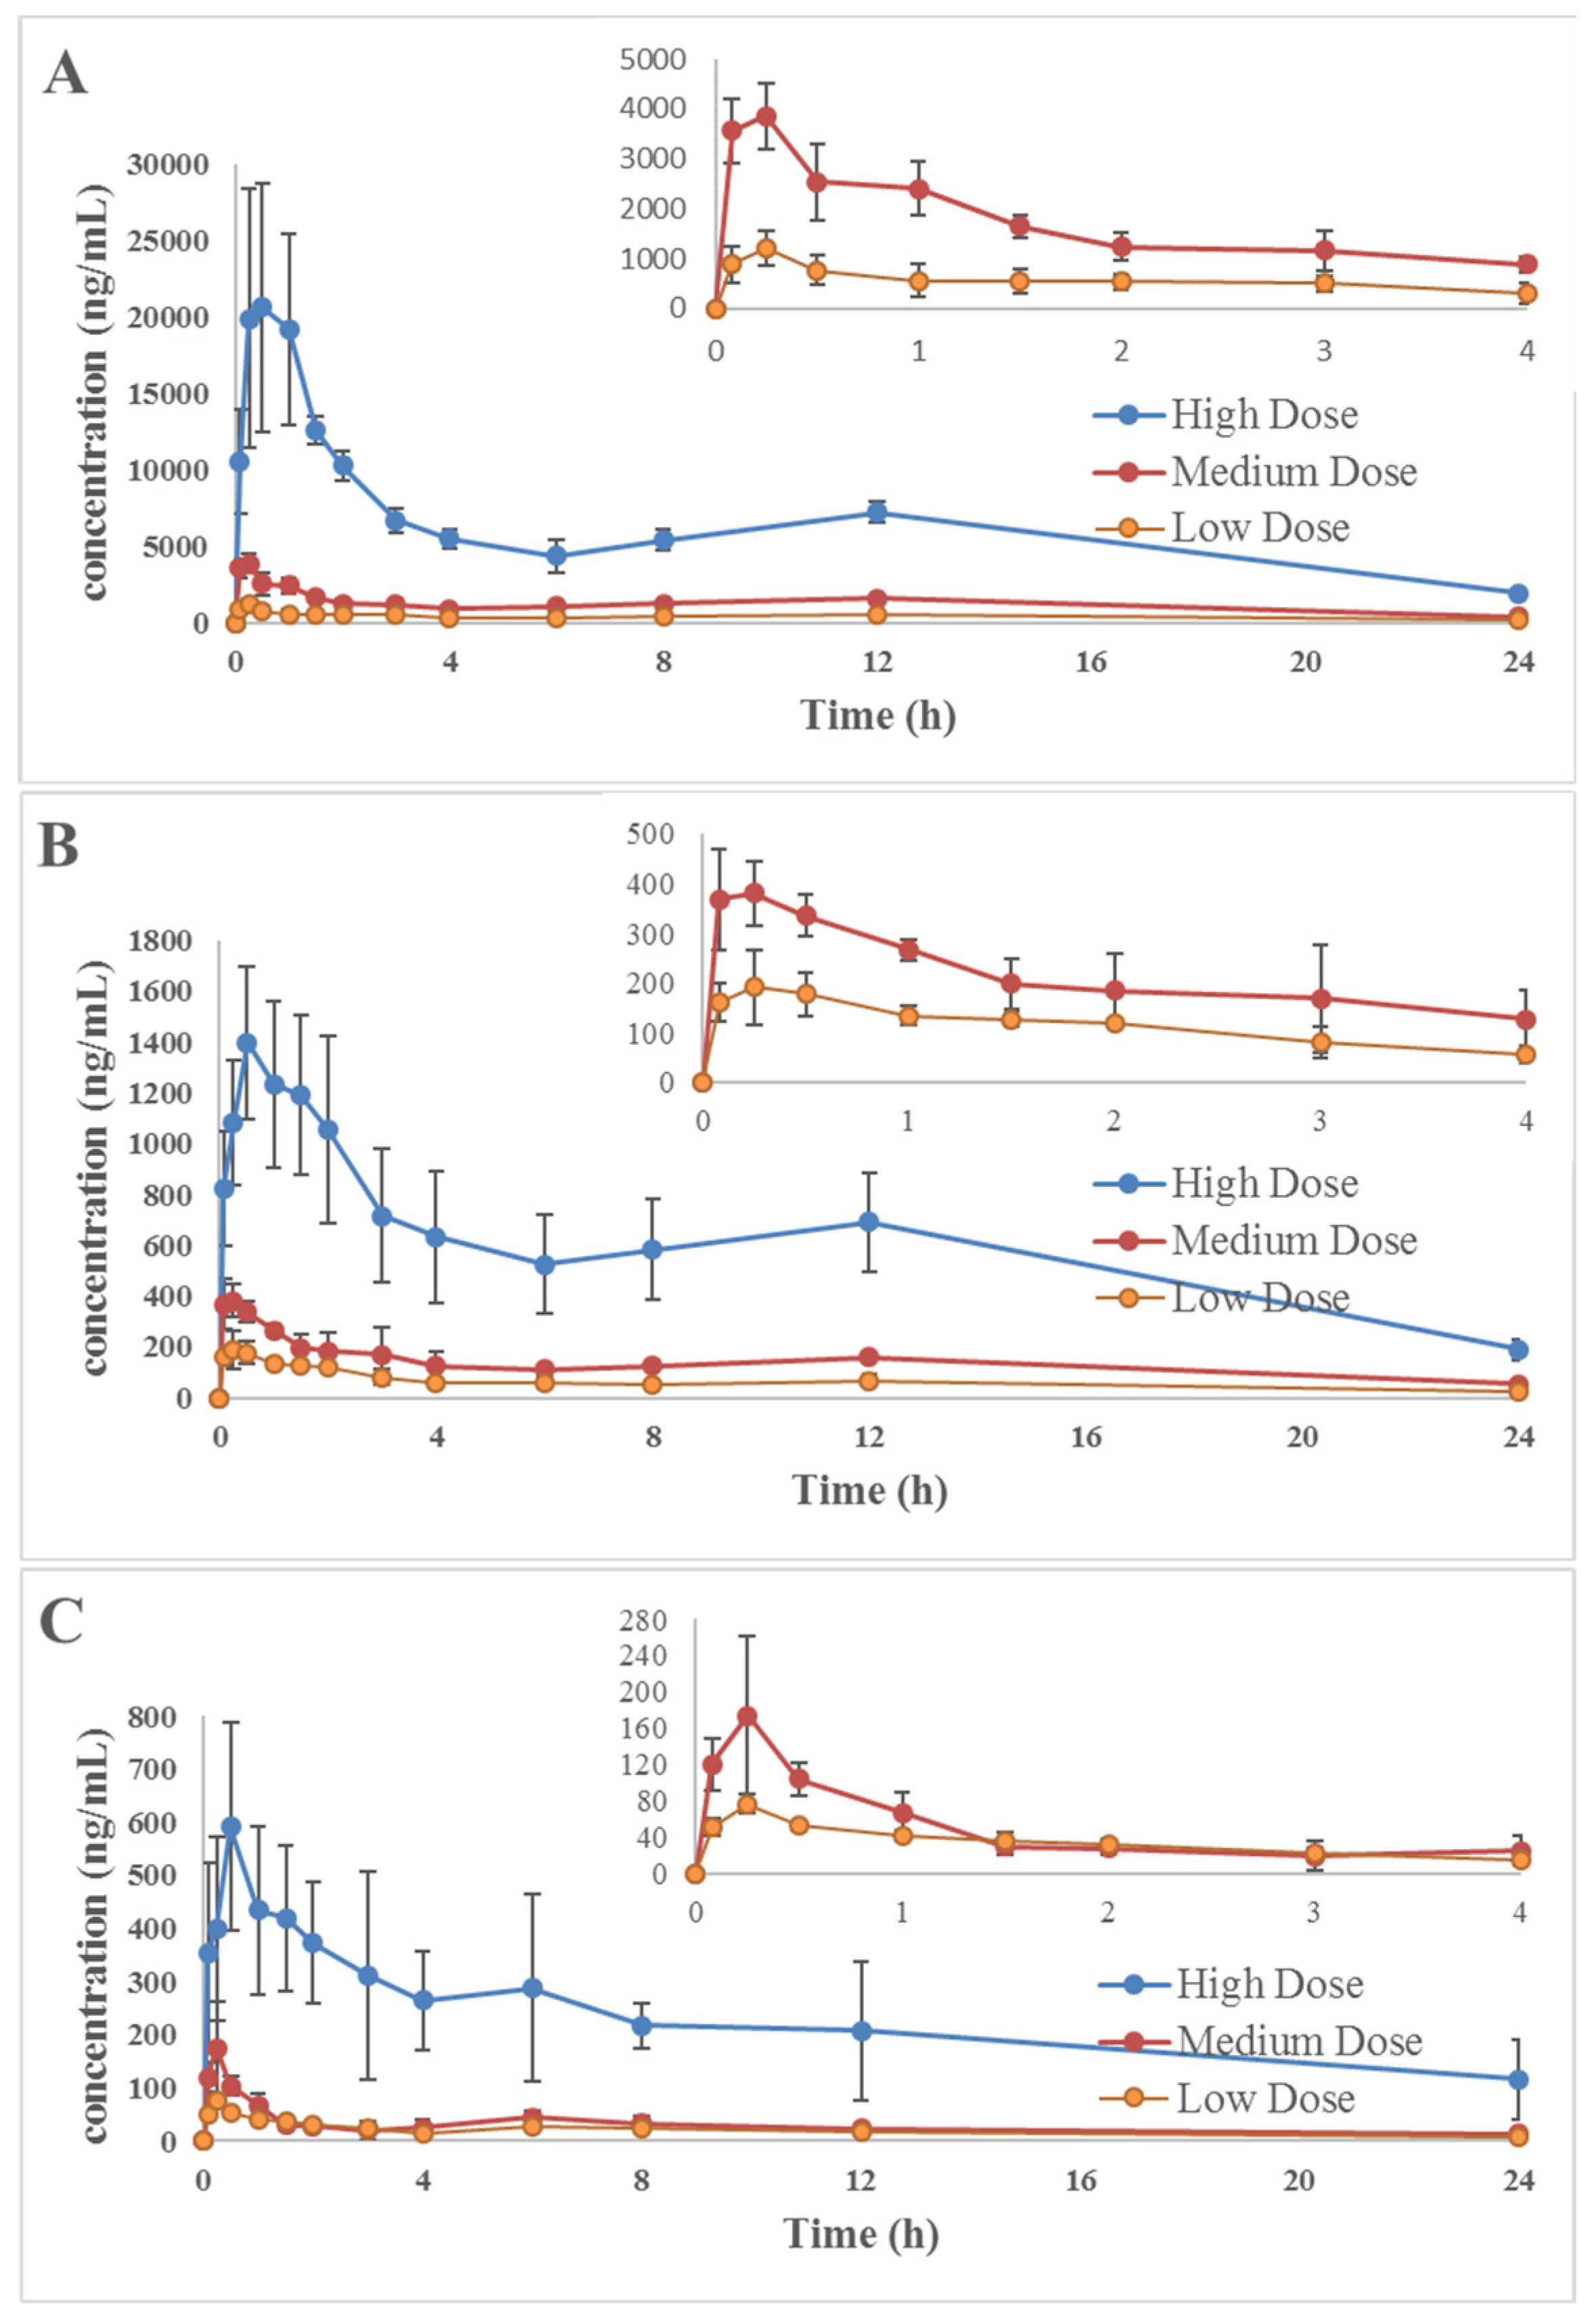
2.5. Application to a Pharmacokinetic Study
3. Materials and Methods
3.1. Materials and Reagents
3.2. Instruments and Analytical Conditions
3.3. Preparation of R. officinalis Extract in the Administration Solution
3.4. Preparation of Calibration Standards and Quality Control Samples
3.5. Animal Experiments
3.6. Plasma Sample Preparation
3.7. Method Validation
3.7.1. Selectivity
3.7.2. Linearity of Calibration Curves and Lower Limits of Quantification (LLOQ)
3.7.3. Accuracy and Precision
3.7.4. Extraction Recovery and Matrix Effect
3.7.5. Stability
3.8. Application to Pharmacokinetic Study
4. Conclusions
Acknowledgments
Author Contributions
Conflicts of Interest
References
- González-Trujano, M.E.; Peña, E.I.; Martínez, A.L.; Moreno, J.; Guevara-Fefer, P.; Déciga-Campos, M.; López-Muñoz, F.J. Evaluation of the antinociceptive effect of Rosmarinus officinalis L. using three different experimental models in rodents. J. Ethnopharmacol. 2007, 111, 476–482. [Google Scholar] [CrossRef] [PubMed]
- Bozin, B.; Mimica-Dukic, N.; Samojlik, I.; Jovin, E. Antimicrobial and antioxidant properties of posemary and sage (Rosmarinus officinalis L. and Salvia officinalis L., Lamiaceae) essential oils. J. Agric. Food Chem. 2007, 55, 7879–7885. [Google Scholar] [CrossRef] [PubMed]
- Erkan, N.; Ayranci, G.; Ayranci, E. Antioxidant activities of rosemary (Rosmarinus officinalis L.) extract, blackseed (Nigella sativa L.) essential oil, carnosic acid, rosmarinic acid and sesamol. Food Chem. 2008, 110, 76–82. [Google Scholar] [CrossRef] [PubMed]
- Aruoma, O.I.; Halliwell, B.; Aeschbach, R.; Löliger, J. Antioxidant and prooxidant properties of active rosemary constituents: carnosol and carnosic acid. Xenobiotica 1992, 22, 257–268. [Google Scholar] [CrossRef] [PubMed]
- Cheung, S.; Tai, J. Anti-proliferative and antioxidant properties of rosemary. Rosmarinus officinalis. Oncol. Rep. 2007, 17, 1525–1531. [Google Scholar] [PubMed]
- Pérez-Fons, L.; GarzÓn, M.T.; Micol, V. Relationship between the antioxidant capacity and effect of rosemary (Rosmarinus officinalis L.) polyphenols on membrane phospholipid order. J. Agric. Food Chem. 2010, 58, 161–171. [Google Scholar] [CrossRef] [PubMed]
- Bakırel, T.; Bakırel, U.; Keleş, O.Ü.; Ülgen, S.G.; Yardibi, H. In vivo assessment of antidiabetic and antioxidant activities of rosemary (Rosmarinus officinalis) in alloxan-diabetic rabbits. J. Ethnopharmacol. 2008, 116, 64–73. [Google Scholar] [CrossRef] [PubMed]
- Peng, C.H.; Su, J.D.; Chyau, C.C.; Sung, T.Y.; Ho, S.S.; Peng, C.C.; Peng, R.Y. Supercritical fluid extracts of rosemary leaves exhibit potent anti-inflammation and anti-tumor effects. Biosci. Biotechnol. Biochem. 2007, 71, 2223–2232. [Google Scholar] [CrossRef] [PubMed]
- Martínez, A.L.; González-Trujano, M.E.; Chávez, M.; Pellicer, F. Antinociceptive effectiveness of triterpenes from rosemary in visceral nociception. J. Ethnopharmacol. 2012, 142, 28–34. [Google Scholar] [CrossRef] [PubMed]
- Pourmortazavi, S.M.; Hajimirsadeghi, S.S. Supercritical fluid extraction in plant essential and volatile oil analysis. J. Chromatogr. A 2007, 1163, 2–24. [Google Scholar] [CrossRef] [PubMed]
- Thorsen, M.A.; Hildebrandt, K.S. Quantitative determination of phenolic diterpenes in rosemary extracts. Aspects of accurate quantification. J. Chromatogr. A 2003, 995, 119–125. [Google Scholar] [CrossRef]
- Babovic, N.; Djilas, S.; Jadranin, M.; Vajs, V.; Ivanovic, J.; Petrovic, S.; Zizovic, I. Supercritical carbon dioxide extraction of antioxidant fractions from selected Lamiaceae herbs and their antioxidant capacity. Innov. Food Sci. Emerg. Technol. 2010, 11, 98–107. [Google Scholar] [CrossRef]
- Yesil-Celiktas, O.; Sevimli, C.; Bedir, E.; Vardar-Sukan, F. Inhibitory effects of rosemary extracts, carnosic acid and rosmarinic acid on the growth of various human cancer cell lines. Plant Foods Hum. Nutr. 2010, 65, 158–163. [Google Scholar] [CrossRef] [PubMed]
- Brieskorn, C.H.; Fuchs, A.; Bredenberg, J.B.; McChesney, J.D.; Wenkert, E. The structure of carnosol. J. Organ. Chem. 1964, 29, 2293–2298. [Google Scholar] [CrossRef]
- Ibañez, E.; Kubátová, A.; Señoráns, F.J.; Cavero, S.; Reglero, G.; Hawthorne, S.B. Subcritical water extraction of antioxidant compounds from rosemary plants. J. Agric. Food Chem. 2003, 51, 375–382. [Google Scholar] [CrossRef] [PubMed]
- Johnson, J.J. Carnosol: A promising anti-cancer and anti-inflammatory agent. Cancer Lett. 2011, 305, 1–7. [Google Scholar] [CrossRef] [PubMed]
- Cheng, A.C.; Lee, M.F.; Tsai, M.L.; Lai, C.S.; Lee, J.H.; Ho, C.T.; Pan, M.H. Rosmanol potently induces apoptosis through both the mitochondrial apoptotic pathway and death receptor pathway in human colon adenocarcinoma COLO 205 cells. Food Chem. Toxicol. 2011, 49, 485–493. [Google Scholar] [CrossRef] [PubMed]
- Doolaege, E.H.A.; Raes, K.; De Vos, F.; Verhé, R.; De Smet, S. Absorption, distribution and elimination of carnosic acid, a natural antioxidant from rosmarinus officinalis in rats. Plant Food. Hum. Nutr. 2011, 66, 196–202. [Google Scholar] [CrossRef] [PubMed]
- Yan, H.; Wang, L.; Li, X.; Yu, C.; Zhang, K.; Jiang, Y.; Wu, L.; Lu, W.; Tu, P. High-performance liquid chromatography method for determination of carnosic acid in rat plasma and its application to pharmacokinetic study. Biomed. Chromatogr. 2009, 23, 776–781. [Google Scholar] [CrossRef] [PubMed]
- Wang, Z.B.; Sun, J.; Rong, R.; Tang, J.L.; He, Z.G. Quantification of trimetazidine in human plasma by liquid chromatography-electrospray ionization mass spectrometry and its application to a bioequivalence study. Die Pharmazie 2007, 62, 27–30. [Google Scholar] [PubMed]
- U.S. Food and Drug Administration. Available online: http://www.fda.gov/downloads/Drugs/GuidanceComplianceRegulatoryInformation/Guidances/UCM368107.pdf (accessed on 1 September 2013).
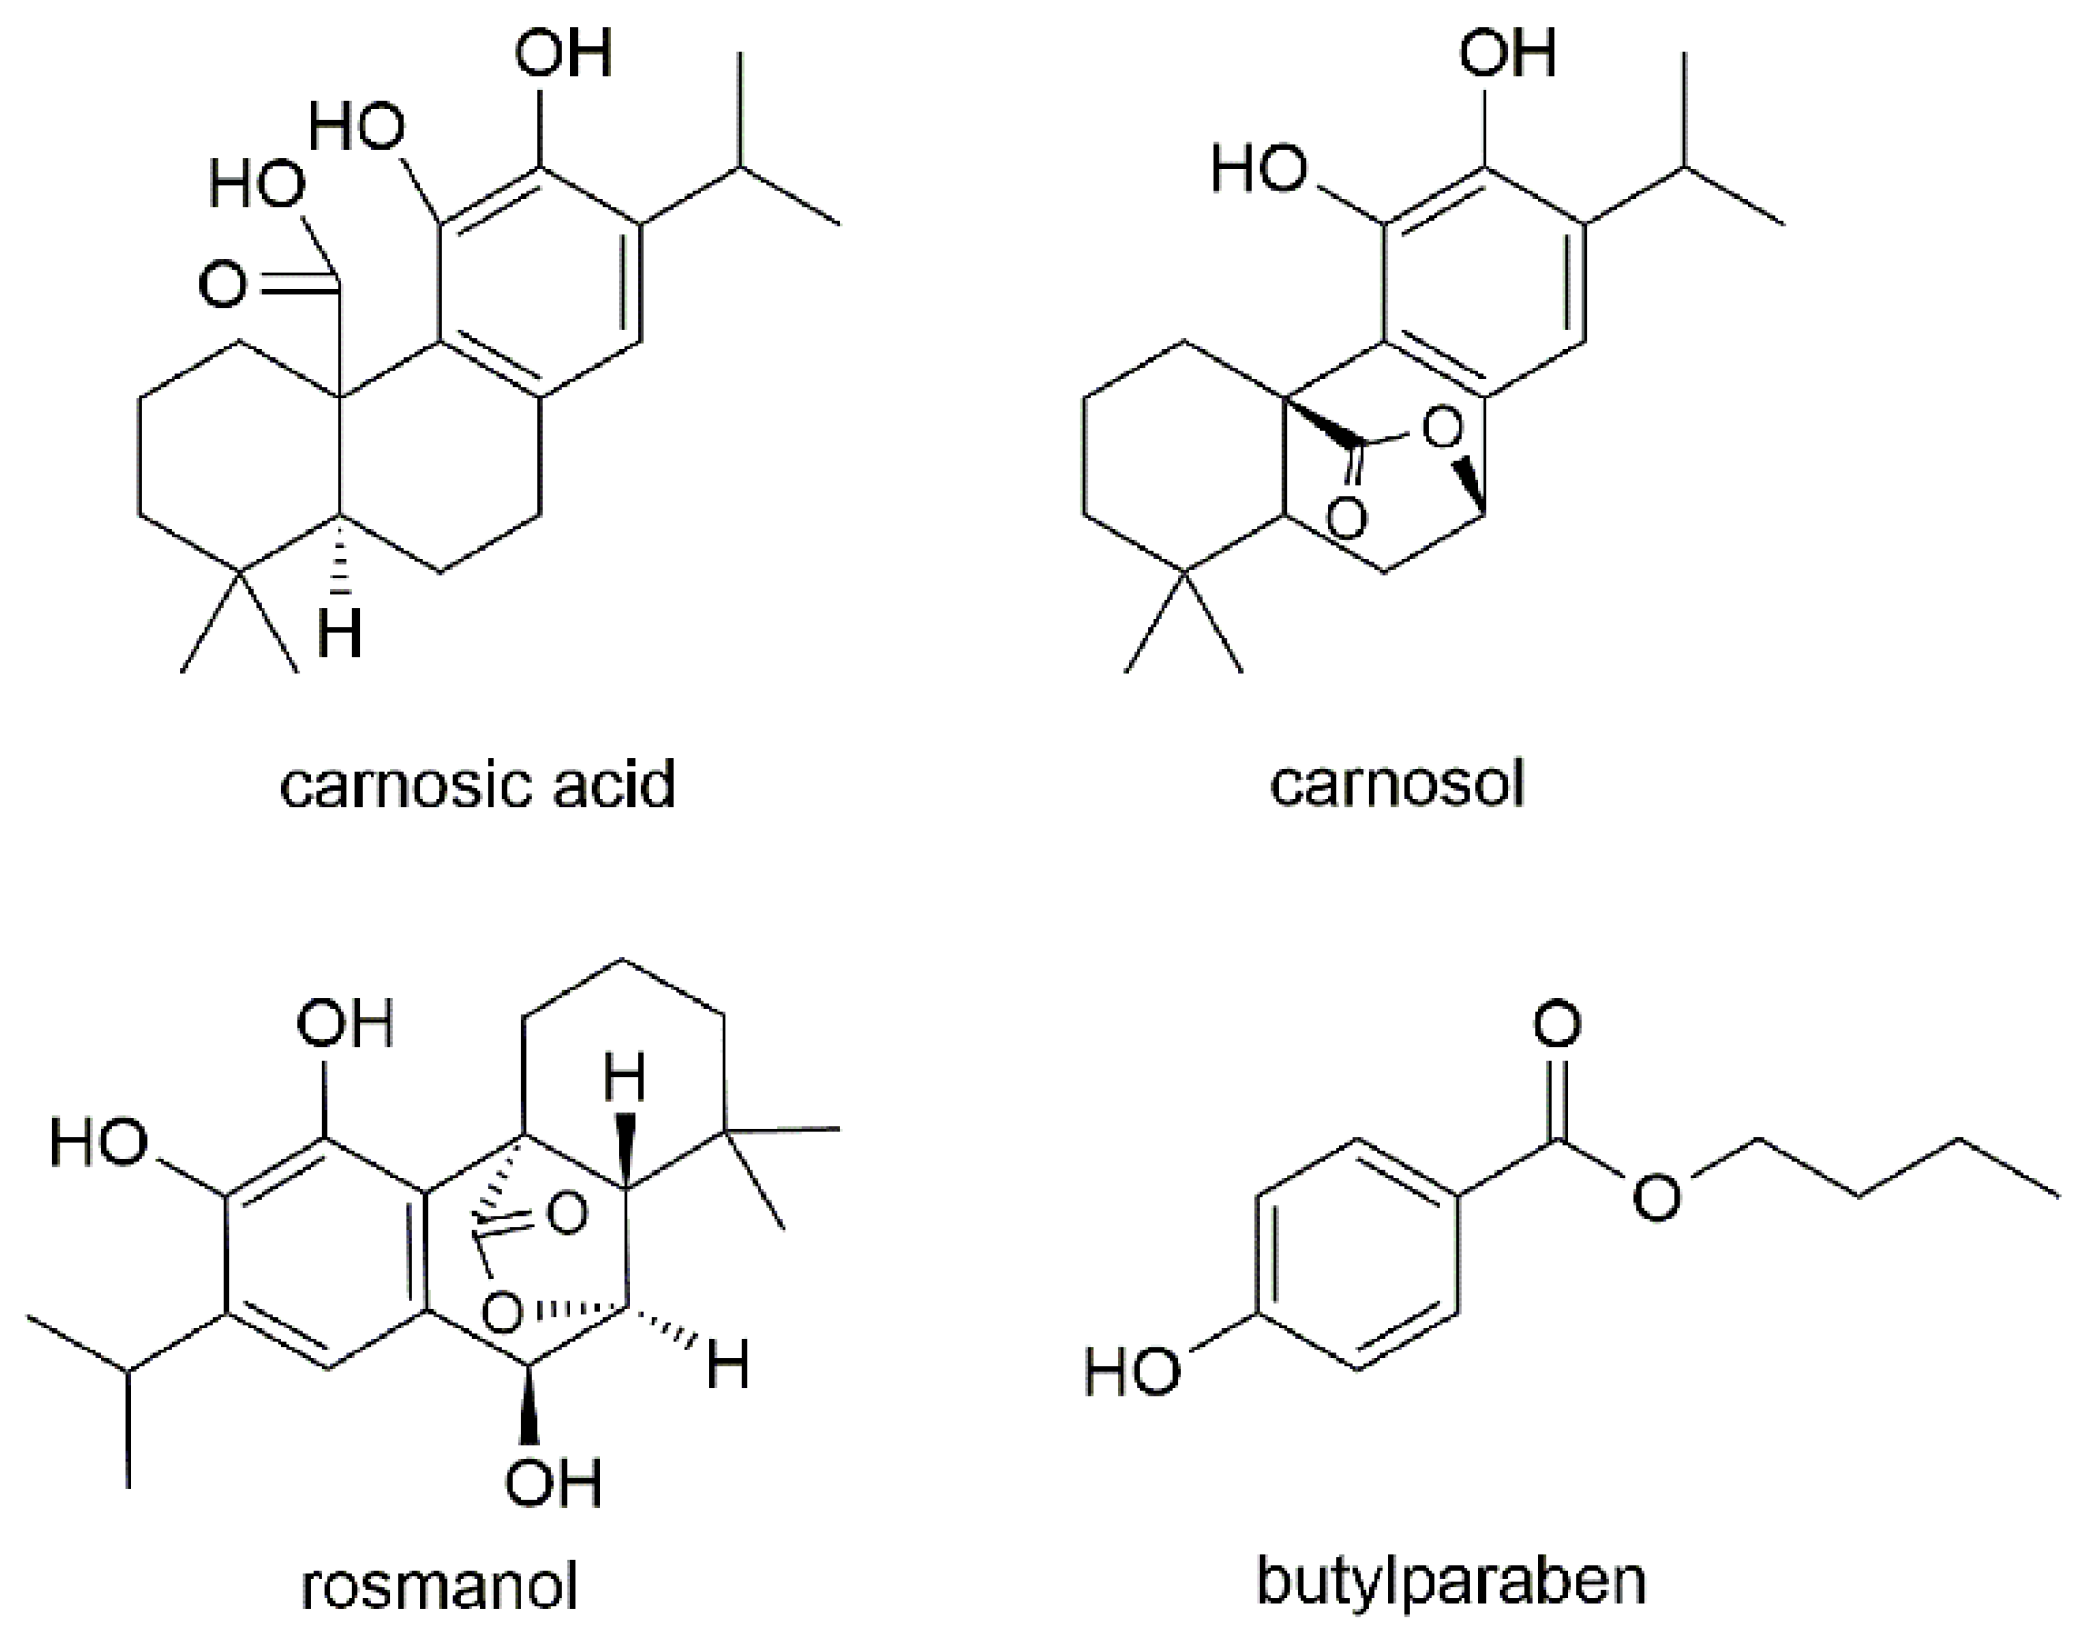
Sample Availability: Samples of the carnosol, rosmanol, carnosic acid and butylparaben are available from the authors. |


| No. | Compound | Transition | Fragmentor (V) | Collision Energy (eV) | Quantifier Ions | Qualifier Ions |
|---|---|---|---|---|---|---|
| 1 | Carnosic acid | 331.2→287.2 | 120 | 20 | 287.2 | 244.1 |
| 2 | Carnosol | 329.1→285.1 | 120 | 11 | 285.1 | 200.9 |
| 3 | Rosmanol | 345.1→283.0 | 184 | 24 | 283.0 | 227.0 |
| 4 | Butylparaben | 193.0→92.0 | 110 | 20 | 92.0 | 136.0 |
| Compounds | Regression Equation | R2 | Linear Range (ng/mL) | LLOQ (ng/mL) |
|---|---|---|---|---|
| Carnosic acid | Y = 0.069522X + 0.003893 | 0.9984 | 10.75~32,250 | 10.75 |
| Carnosol | Y = 18.04392X + 0.048801 | 0.9982 | 1.453~4360 | 1.453 |
| Rosmanol | Y = 3.279425X + 0.001014 | 0.9962 | 1.700~5100 | 1.700 |
| Compounds | Spiked Conc (ng/mL) | Measured Conc (ng/mL) | Accuracy (%) | Intra-Day Precision (%) | Inter-Day Precision (%) |
|---|---|---|---|---|---|
| Carnosic acid | 10.75 | 10.60 ± 1.15 | −1.39 | 11.30 | 6.44 |
| 21.50 | 22.58 ± 2.09 | 5.02 | 8.72 | 12.47 | |
| 1075 | 1124 ± 65.39 | 4.53 | 5.88 | 5.37 | |
| 25800 | 27905 ± 2440 | 8.16 | 8.52 | 10.29 | |
| Carnosol | 1.453 | 1.58 ± 0.20 | 8.39 | 12.60 | 14.37 |
| 2.910 | 3.11 ± 0.26 | 7.09 | 7.48 | 12.70 | |
| 145.3 | 151 ± 18.74 | 3.91 | 12.28 | 13.35 | |
| 3488 | 3490 ± 70.26 | 0.08 | 2.14 | 0.35 | |
| Rosmanol | 1.700 | 1.85 ± 0.24 | 8.88 | 11.89 | 14.29 |
| 3.400 | 3.55 ± 0.21 | 4.36 | 4.77 | 11.29 | |
| 170.0 | 159.7 ± 12.48 | −6.06 | 7.56 | 9.53 | |
| 4080 | 4270 ± 197.5 | 4.65 | 3.85 | 8.42 |
| Compounds | Spiked Conc. (ng/mL) | Stability (% RE) | |||
|---|---|---|---|---|---|
| Freeze-Thaw | Short-Term | Long-Term | Post-Preparative | ||
| Carnosic acid | 21.50 | 14.04 | 10.21 | 13.78 | 13.89 |
| 1075 | 14.82 | 14.80 | 14.30 | 14.10 | |
| 25,800 | 14.40 | 14.84 | 14.84 | 14.83 | |
| Carnosol | 2.910 | 5.39 | 8.07 | 3.10 | 2.32 |
| 145.3 | 8.40 | −8.67 | 14.49 | 0.66 | |
| 3488 | 0.30 | −0.79 | −0.48 | 2.09 | |
| Rosmanol | 3.400 | 4.65 | 5.01 | 7.17 | −0.30 |
| 170.0 | −7.12 | −8.16 | −8.56 | −7.65 | |
| 4080 | −0.07 | 0.65 | 9.17 | 4.60 | |
| Compounds | Spiked Conc. (ng/mL) | Recovery (%) | RSD (%) | Matrix Effect (%) | RSD (%) |
|---|---|---|---|---|---|
| Carnosic acid | 10.75 | 84.10 | 1.96 | 103.5 | 9.27 |
| 1075 | 88.47 | 2.74 | 105.3 | 5.65 | |
| 25800 | 92.60 | 1.67 | 101.4 | 2.52 | |
| Carnosol | 2.910 | 84.61 | 2.85 | 104.1 | 1.74 |
| 145.3 | 89.29 | 2.23 | 105.3 | 2.39 | |
| 3488 | 93.41 | 3.44 | 103.6 | 3.09 | |
| Rosmanol | 3.400 | 88.43 | 4.30 | 104.8 | 7.39 |
| 170.0 | 89.30 | 2.25 | 105.3 | 2.40 | |
| 4080 | 95.14 | 1.87 | 102.1 | 1.49 | |
| IS | 2120 | 82.64 | 5.58 | 97.34 | 10.01 |
| Analytes | Dose of Rosemary (g/kg) | Cmax (ng/mL) | tmax (h) | t1/2 (h) | AUC0→t (ng h/mL) | AUC0→∞ (ng h/mL) |
|---|---|---|---|---|---|---|
| Carnosic acid | 0.24 | 1212 ± 344.23 | 0.30 ± 0.11 | 8.02 ± 2.08 | 9142 ± 1504 | 14,922 ± 10,211 |
| 0.82 | 3955 ± 515.85 | 0.30 ± 0.11 | 12.81 ± 5.14 | 28,490 ± 2928 | 40,037 ± 32,222 | |
| 2.45 | 27,504 ± 1881 | 0.50 ± 0.31 | 12.84 ± 1.23 | 145,707 ± 12774 | 181,076 ± 19,700 | |
| Carnosol | 0.24 | 216.56 ± 53.09 | 0.40 ± 0.13 | 12.29 ± 2.36 | 1466 ± 190.18 | 1819 ± 327.06 |
| 0.82 | 413.34 ± 42.59 | 0.27 ± 0.15 | 13.86 ± 6.95 | 3187 ± 316.05 | 7358 ± 2738 | |
| 2.45 | 1480 ± 266.45 | 0.70 ± 0.45 | 12.83 ± 3.15 | 13,993 ± 3895 | 17,428 ± 4042 | |
| Rosmanol | 0.24 | 77.20 ± 10.54 | 0.25 ± 0.00 | 8.88 ± 3.52 | 460.48 ± 54.92 | 552.10 ± 130.19 |
| 0.82 | 187.90 ± 75.87 | 0.20 ± 0.18 | 9.75 ± 2.44 | 678.44 ± 56.94 | 825.96 ± 137.51 | |
| 2.45 | 633.41 ± 118.52 | 0.55 ± 0.27 | 15.36 ± 3.54 | 5369 ± 927.05 | 7985 ± 1648 |
© 2017 by the authors. Licensee MDPI, Basel, Switzerland. This article is an open access article distributed under the terms and conditions of the Creative Commons Attribution (CC BY) license (http://creativecommons.org/licenses/by/4.0/).
Share and Cite
Wang, L.; Gan, C.; Wang, Z.; Liu, L.; Gao, M.; Li, Q.; Yang, C. Determination and Pharmacokinetic Study of Three Diterpenes in Rat Plasma by UHPLC-ESI-MS/MS after Oral Administration of Rosmarinus officinalis L. Extract. Molecules 2017, 22, 934. https://doi.org/10.3390/molecules22060934
Wang L, Gan C, Wang Z, Liu L, Gao M, Li Q, Yang C. Determination and Pharmacokinetic Study of Three Diterpenes in Rat Plasma by UHPLC-ESI-MS/MS after Oral Administration of Rosmarinus officinalis L. Extract. Molecules. 2017; 22(6):934. https://doi.org/10.3390/molecules22060934
Chicago/Turabian StyleWang, Liqian, Chunli Gan, Zhibin Wang, Lu Liu, Mingjie Gao, Qian Li, and Chunjuan Yang. 2017. "Determination and Pharmacokinetic Study of Three Diterpenes in Rat Plasma by UHPLC-ESI-MS/MS after Oral Administration of Rosmarinus officinalis L. Extract" Molecules 22, no. 6: 934. https://doi.org/10.3390/molecules22060934