Article

Peptide Nucleic Acid Based Molecular Authentication for Identification of Four Medicinal Paeonia Species Using Melting Array Analysis of the Internal Transcribed Spacer 2 Region

K-herb Research Center, Korea Institute of Oriental Medicine, 1672 Yuseong-daero, Yuseong-gu, Daejeon 305-811, Korea
*
Author to whom correspondence should be addressed.
Molecules 2017, 22(11), 1922; https://doi.org/10.3390/molecules22111922
Submission received: 26 September 2017 / Revised: 3 November 2017 / Accepted: 3 November 2017 / Published: 7 November 2017
(This article belongs to the Special Issue Molecular Properties and the Applications of Peptide Nucleic Acids)

Abstract

:
Accurate taxonomic identification of plant materials in herbal medicines is important for product quality control. The genus Paeonia (Saxifragales) is the source of the herbal preparations Paeoniae Radix (Paeoniae Radix Alba and Paeoniae Radix Rubra) and Moutan Radicis Cotex. However, confusion has arisen regarding their contents due to linguistic and taxonomic ambiguities, similar morphologies and different definitions of Paeoniae Radix in the Korean and Chinese national pharmacopoeias, leading to the distribution of adulterated products. To develop a method for identifying the four Paeonia species used in these medicines, three fluorescently-labeled peptide nucleic acid (PNA) probes were designed against ITS2 sequences containing single nucleotide polymorphisms (SNPs) and used in a real-time PCR melting curve assay. Each of the four Paeonia species was accurately identified using this analysis. The accuracy and analytical stability of the PNA melting curve assay was confirmed using commercially available samples of the four Paeonia species. This assay is a reliable genetic tool to distinguish between different Paeonia-derived herbal medicines and identify the botanical origins of Paeoniae Radix and Moutan Radicis Cortex. This technique may also contribute to quality control and standardization of herbal medicines by providing a reliable authentication tool and preventing the distribution of inauthentic adulterants.

Graphical Abstract

1. Introduction

Herbal medicine derived from plants has been used in traditional medicine for conditions including injury and acute pain for more than one thousand years [1,2]. In oriental medicine, one or more species having equal effects can be used to treat the same disease, leading to plant species with different taxonomic classifications having the same herbal medicinal name. Medicinal plants used as sources of oriental medicines and folk remedies are under evaluation to verify their pharmacological efficacy [3], and several studies recently reported pharmacological effects associated with plant species used in traditional medicine [4,5]. To standardize the prescription of herbal medicines, only authentic herbal materials defined in national pharmacopoeias should be used for therapeutic purposes. However, definitions of botanical origin for numerous herbal remedies differ between pharmacopoeias [6], and some inauthentic species are sometimes included. In a similar way, the use of synonyms and homonyms has led to the inclusion of inauthentic substitutions or adulterants in traditional herbal medicines [7]. These inauthentic substitutions or adulterants, which have different pharmacological efficacy or may have toxic components in some cases, are not an appropriate use as herbal material. Therefore, authentic herbal materials should be used to standardize the quality of herbal medicines.
In Korean traditional herbal medicine, P. lactiflora, P. japonica and P. veitchii are considered as Paeoniae Radix, and P. suffruticosa is considered as Moutan Radicis Cortex [8]. These herbal medicines are prescribed to treat different symptoms [6,8]. Moutan Radicis Cortex, which is prescribed to activate blood and to treat extravasated blood in the heart, liver and kidney, is defined exclusively as the root bark of P. suffruticosa [6,9]. By contrast, Paeoniae Radix, which is used to treat extravasated blood, relieve pain, alleviate fever and induce hepatoprotection, has different botanical origins in the Korean, Chinese and Japanese pharmacopoeias [6,10]. Two different herbal medicines, Paeoniae Radix Rubra (synonymous with Paeoniae Radix) and Paeoniae Radix Alba, are used in Chinese traditional medicine [6]. Paeoniae Radix Rubra is defined as P. lactiflora and P. veitchii, and Paeoniae Radix Alba has excellent pharmacological effects on anti-inflammatory and immune regulation and is defined exclusively as the peeled root of P. lactiflora.
The pronunciation of Paeoniae Radix Alba is similar to that of P. japonica, termed Baekjak in Korean, which can cause confusion. P. japonica is considered to be more effective than P. lactiflora and P. veitchii and is more expensive in the Korean herbal market. P. lactiflora and P. veitchii are distributed as Paeoniae Radix in Korea, and the majority of P. lactiflora and P. veitchii is imported from China. Peeled bark and sliced roots of P. lactiflora are morphologically similar to those of P. japonica and are sometimes falsely distributed as P. japonica at the farm level and in herbal markets.
Molecular genetic tools such as DNA barcoding can be used to identify the botanical origins of herbal medicines and have a range of advantages such as analytical reliability, cost effectiveness and reproducibility [11,12,13]. Another advantage of DNA-based approaches is that they do not require years of taxonomic training as for plant taxonomist for morphologically accurate identification. DNA barcoding based on short nuclear or organellar DNA sequences is used for the identification of a broad spectrum of organisms including plants, animals, microorganisms and fungi [14,15,16,17]. Several genetic markers, including rbcL, matK, psbA-trnH, trnL-F and rps16 in the chloroplast genome and ribosomal DNA internal transcribed spacers (rDNA-ITS) in the nuclear genome, are widely used as representative DNA barcode regions for identification of plant species and/or botanical origins of herbaceous medicinal materials [17,18,19]. Although the Plant Working Group of the Consortium for the Barcode of Life (CBOL) recommended the combined use of matK and rbcL for plant classification, combined ITS (ITS1 + ITS2) regions or the ITS2 region alone are frequently used for examination of closely related species as the ITS subregions have higher substitution rates than the genetic markers rbcL, matK and rps16 [18,20]. While DNA barcoding provides accurate species identification, the process is relatively time consuming, and complicated, including processes such as DNA amplification, gel electrophoresis, rescue of amplicon, sub-cloning into T-vector, Escherichia coli transformation, sequencing and sequence analysis [7,20]. In addition, the limitations of DNA barcoding using the universal primers are that they are not amplified in some plant taxa [15,21].
Real-time PCR (RT-PCR) is a powerful method that identifies specific amplified fragments during PCR, removing the need for subsequent gel electrophoresis [22,23]. Fluorescent tagging of probes allows discrimination of different products and facilitates multiplexing within a single reaction [24,25]. Melting curve analysis allows the detection of multiple targeted DNA sequences with different melting temperature ™ values in individual fluorescent channels. Melting analysis using peptide nucleic acid (PNA) probes is a powerful method for the detection of single nucleotide polymorphisms (SNPs). PNAs contain an uncharged peptide backbone that has high chemical and thermal stability. Thermal stability differences between perfectly matched and mismatched PNA probe-template duplexes are higher than those in DNA probe-template duplexes, and mismatch sensitivity is therefore higher with PNA probes than with DNA probes. The lower melting temperatures exhibited by mismatched PNA probe-template duplexes compared with perfectly matched duplexes can be distinguished at high resolution. PNA fluorescent melting profile analysis can thus be used for efficient detection and identification of taxonomic origins at the species level [26,27,28].
In this study, we established an SNP-based PNA melting array method to discriminate four medically important Paeonia species using RT-PCR with specific PNA probes based on ITS2 sequences. This molecular authentication tool successfully identified the four Paeonia species with high resolution and stability. This method can be used to distinguish between two herbal medicines, Paeoniae Radix and Moutan Radicis Cortex, and to identify the botanical origins of Paeonia-derived herbal materials, including processed forms such as sliced preparations and ground powders.

2. Results

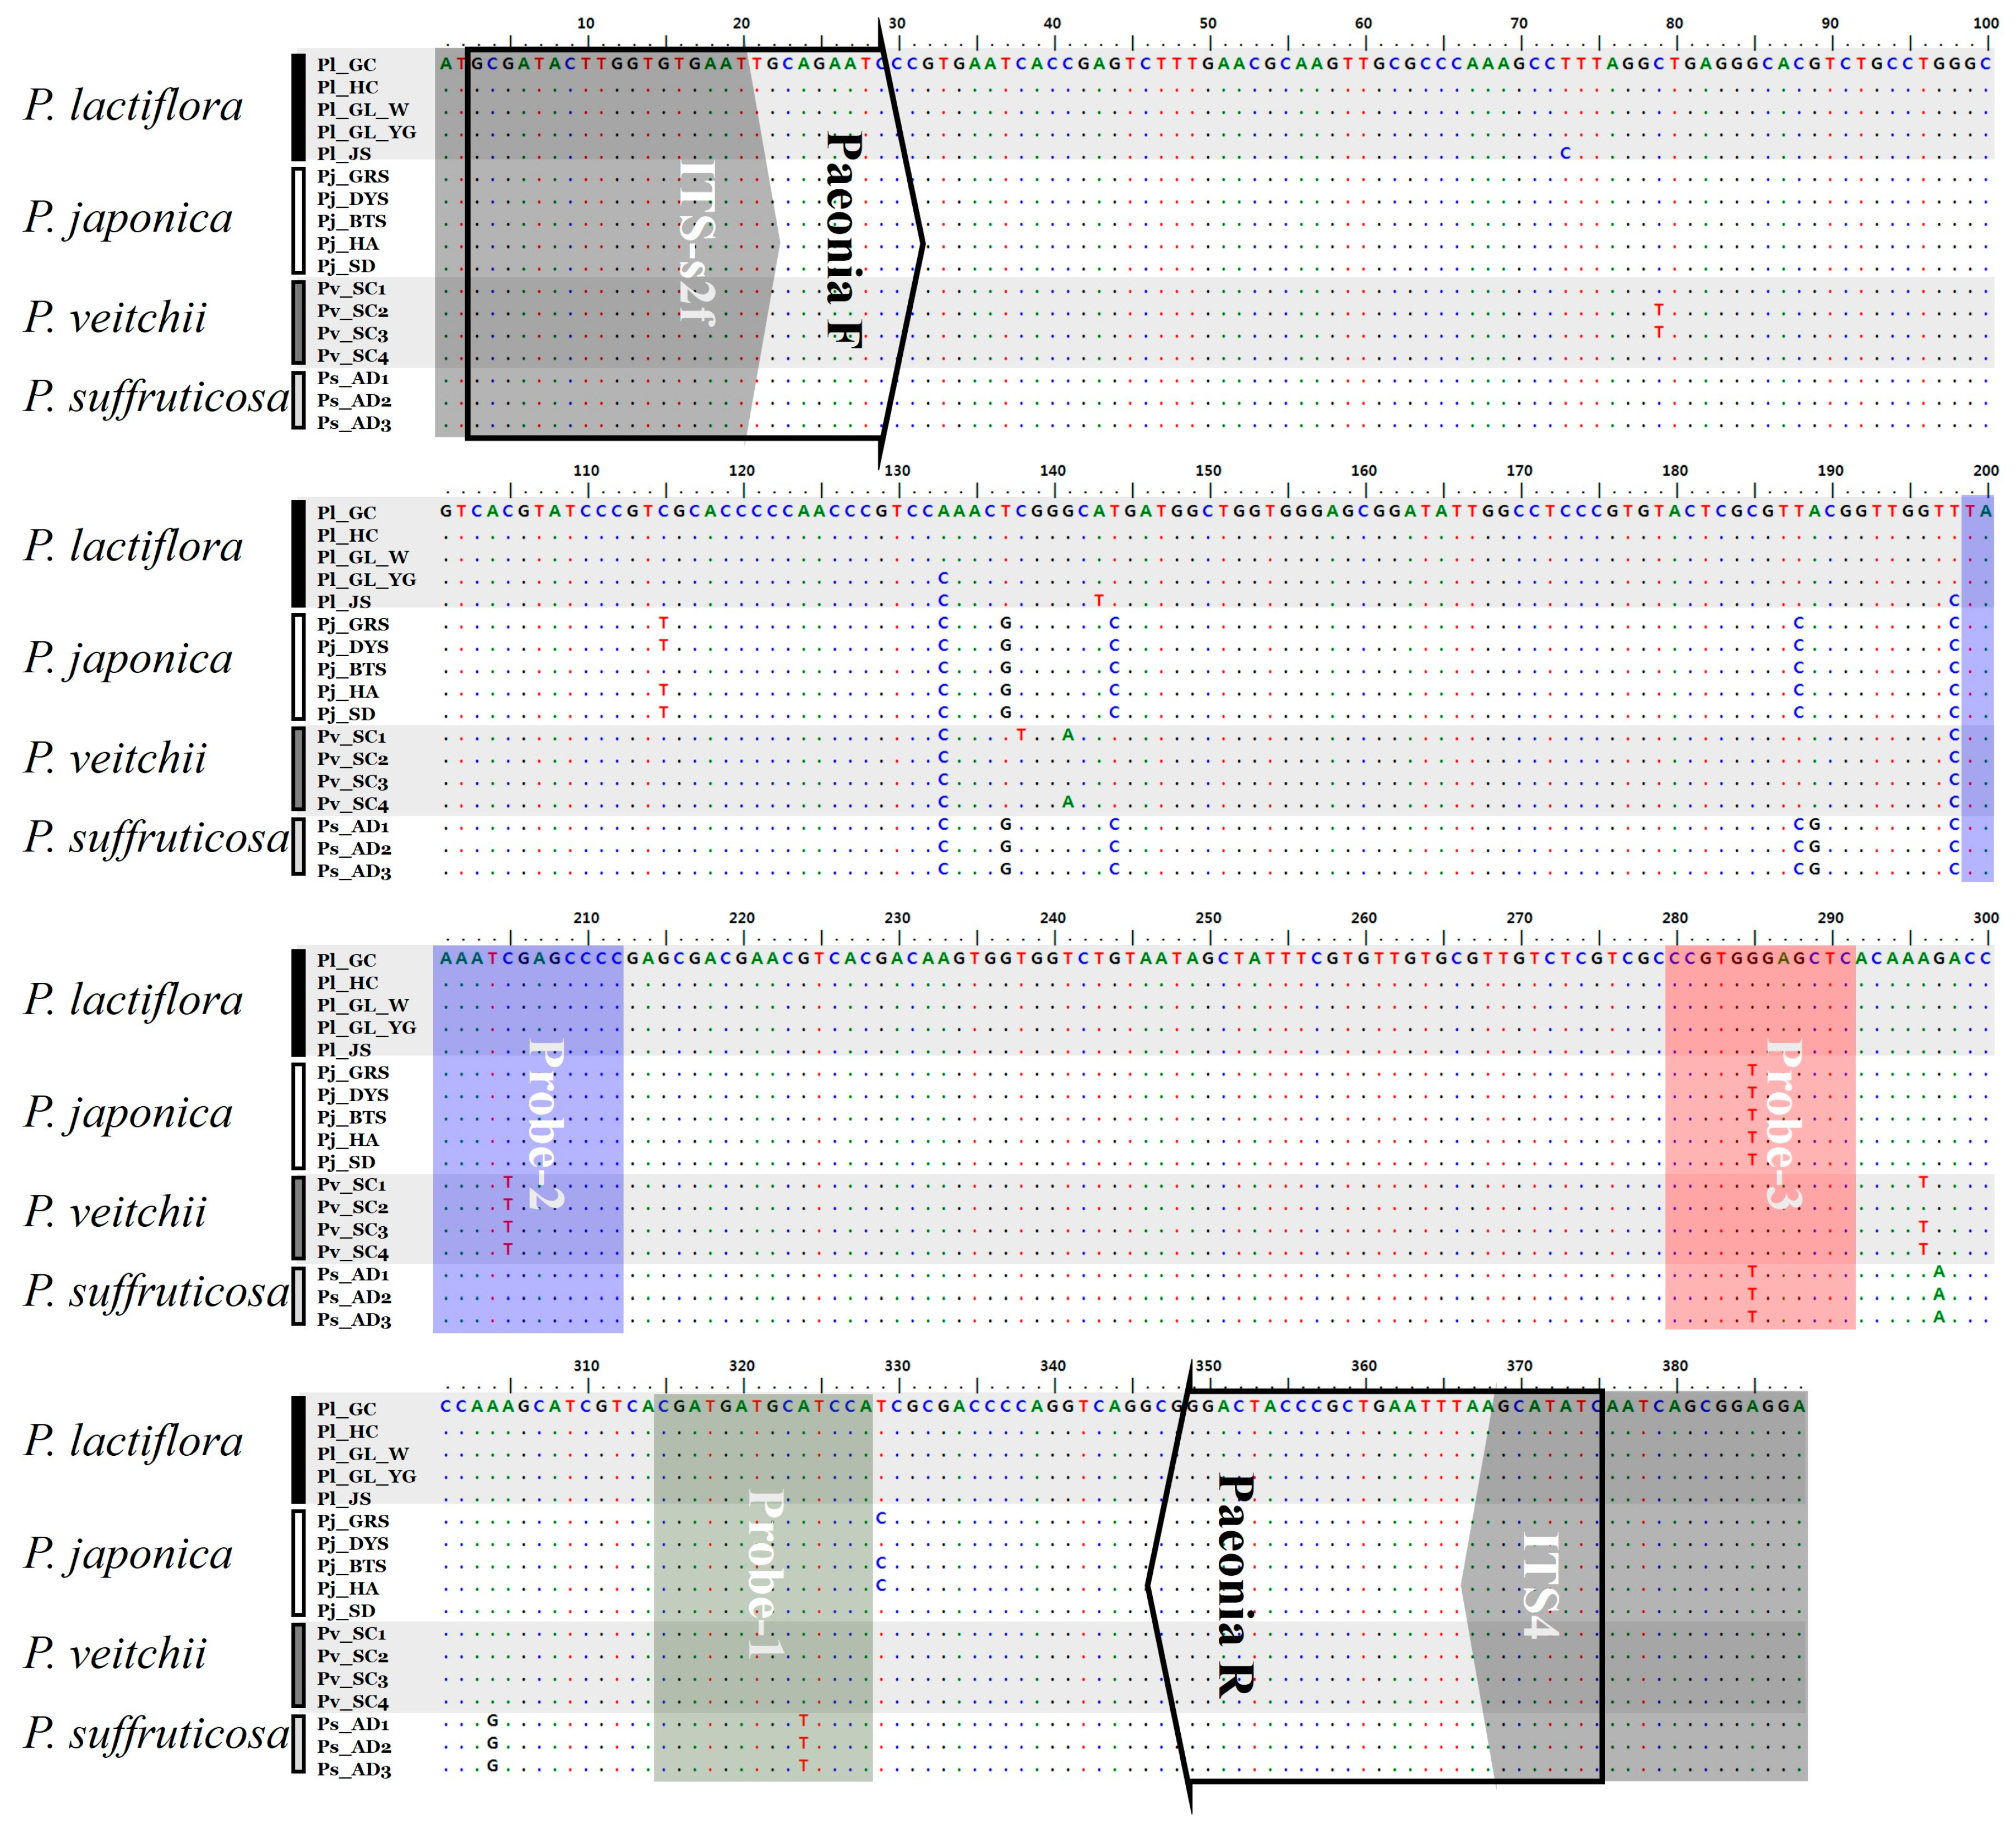
2.1. Analysis of ITS2 Sequences

ITS2 regions were amplified from the 17 Paeonia samples listed by Kim et al. [8] using universal primers. PCR amplification efficiency for all four Paeonia species was 100%. ITS2 amplicons of one band (approximately 400 bp in length) were separated by agarose gel electrophoresis. PCR products (approximately 400 bp) were sub-cloned into a T-vector, and the inserts were sequenced using T7 and SP6 promoters. We obtained trustworthy sequences from more than three clones considering sequences such as PCR errors, misreading and chimeric and geographic variations and confirmed the species using NCBI BLAST analyses. Full ITS2 sequences were aligned along a length of 388 bases (Table 1 and Figure 1). Intra-species distances for P. lactiflora, P. japonica, P. veitchii and P. suffruticosa were 0.47%, 0.26%, 0.61% and 0.00%, respectively (Table 1). Inter-species distances were 1.84%, 1.87%, 2.00% and 2.25%, respectively (Table 1). These results indicated that P. veitchii and P. suffruticosa had the highest genetic divergences within and between species, respectively. The G + C ratio of ITS2 regions was the highest in P. suffruticosa (57.2%), followed by P. japonica (56.9%), P. lactiflora (56.1%) and P. veitchii (55.9%) (Table 1). Species-specific nucleotides (i.e., SNPs) were located from ITS2 sequences at one position in P. veitchii and four positions in P. suffruticosa, but none were located in P. lactiflora and P. japonica (Table 3). These results demonstrated that the species-specific nucleotides located from comparative analysis of ITS2 sequences could not be used for identification of all four Paeonia species. The ITS2 region was thus unsuitable for standard DNA barcoding in Paeonia. Instead, PNA-based probes based on divergent regions of ITS2 were developed for identification of the four Paeonia species. In previous study, we reported that ITS1 regions have more variable sequences and species-specific nucleotides compared to ITS2, but ITS1 was inappropriate to design PNA probes for identifying Paeonia species because of its sequence variability [8].

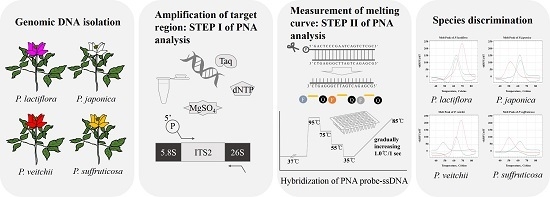
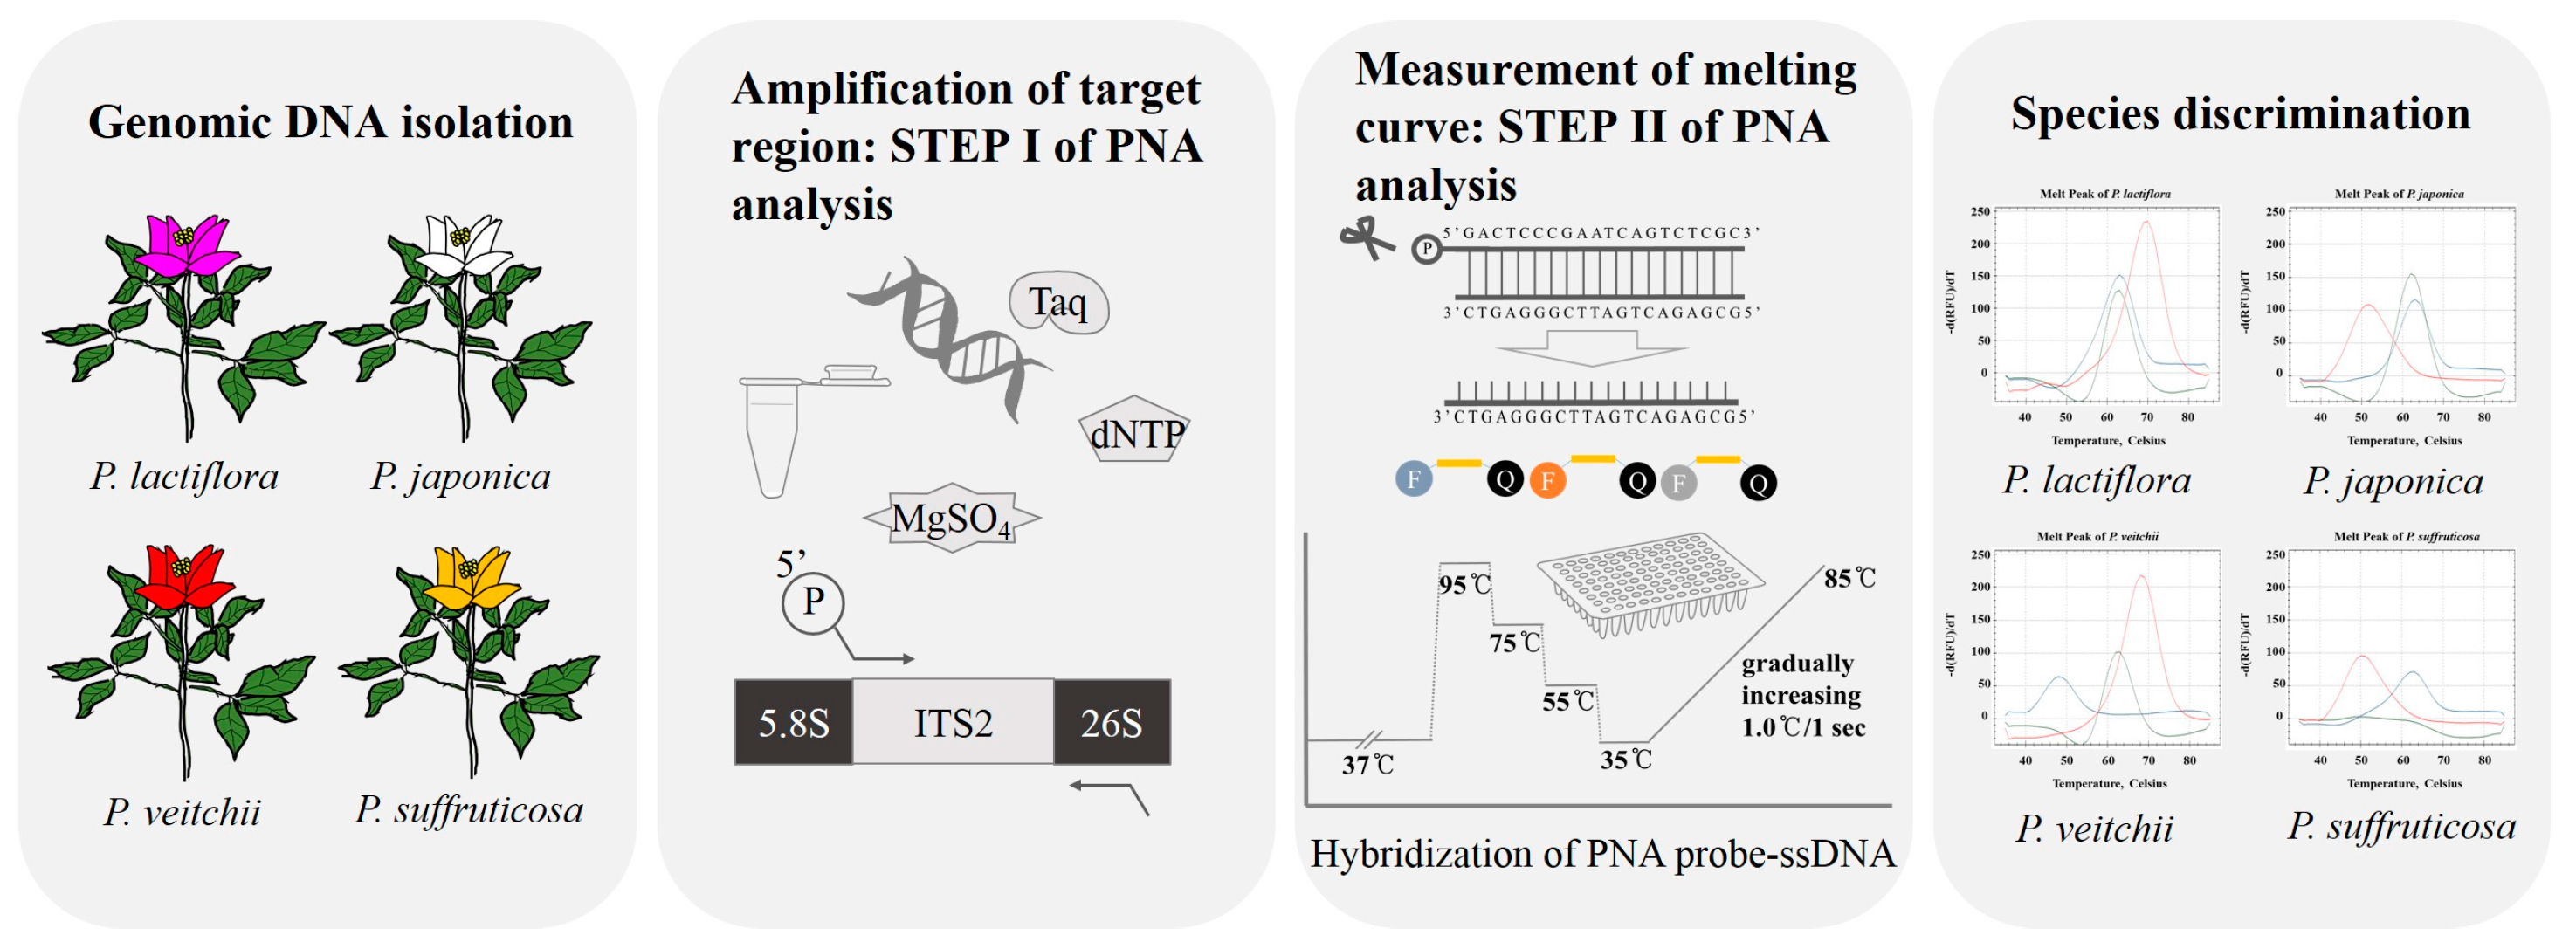
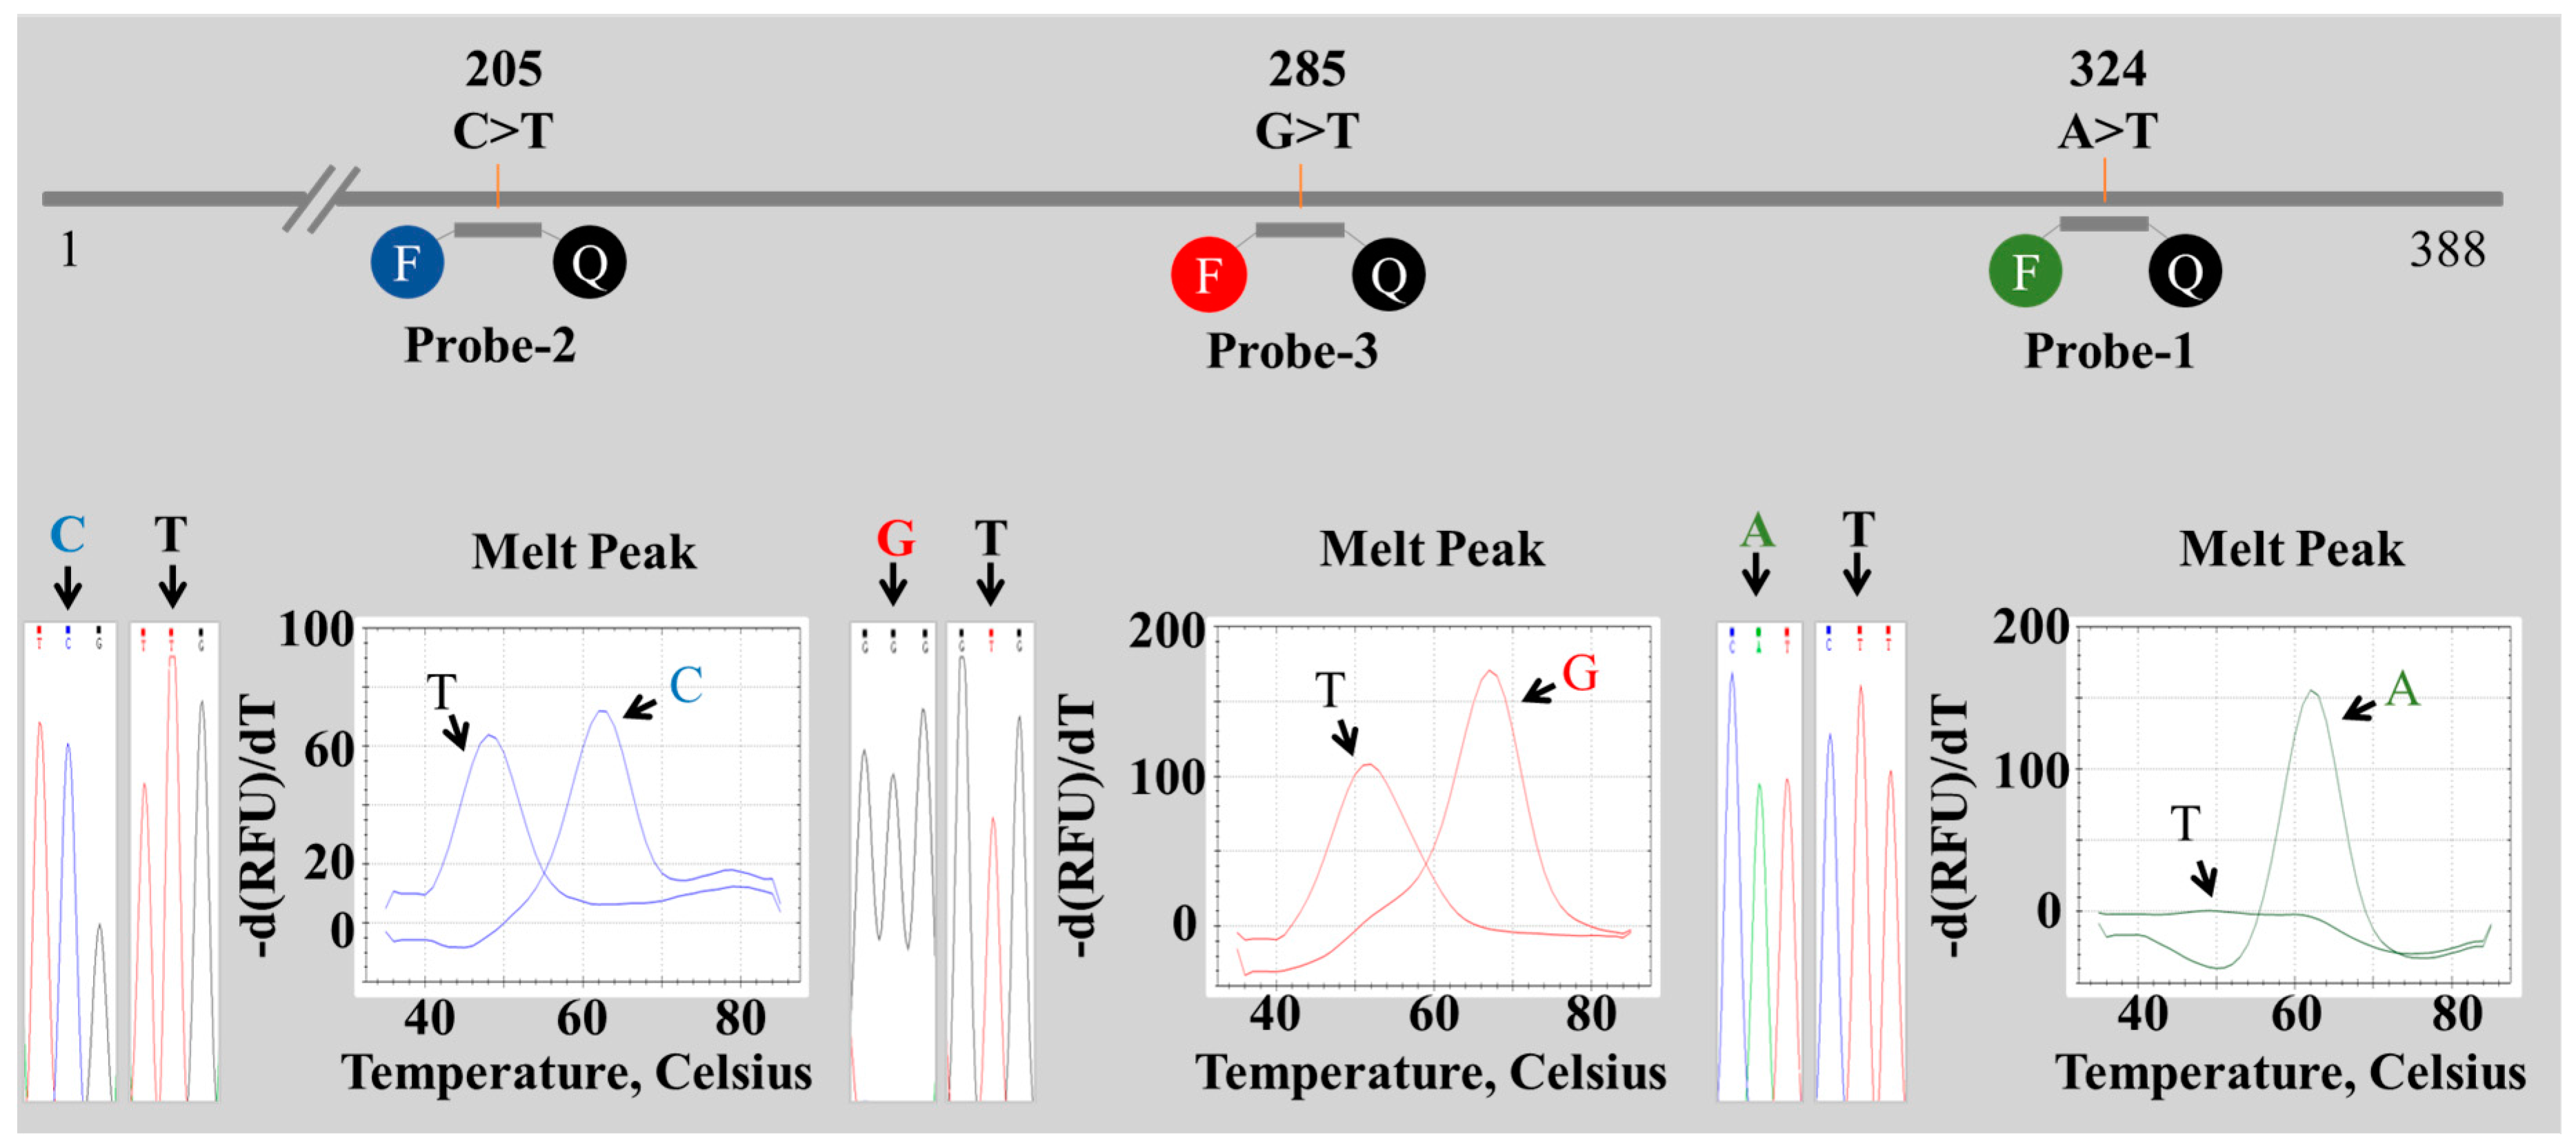
2.2. Establishment of a PNA Melting Array Method for Identification of Paeonia Species

The melting array analysis method using RT PCR and PNA probes is illustrated in Figure 2. Paeonia F and R primers were designed to amplify a 373-bp internal ITS2 region in all four Paeonia species (Table 2 and Figure 1). Abundant amplicons were produced that were suitable for melting array analysis (Supplemental Figure S1). To confirm amplicon identity, PCR products were sequenced (Sanger method) and compared to known ITS2 sequences from the four Paeonia species using blastn of NCBI Standard Nucleotide BLAST. The amplified sequences were identical to the corresponding ITS2 database sequences and previously obtained ITS2 sequences, demonstrating that the Paeonia F and R primers amplified a unique target region in all four Paeonia species.
Multiple alignment sequence analysis located nine candidate regions for probe design, with four polymorphic nucleotides at positions 137 (T/G), 144 (T/C), 188 (T/C) and 285 (G/T) and five species-specific nucleotides at positions 189 (G in P. suffruticosa), 205 (T in P. veitchii), 297 (A in P. suffruticosa), 304 (G in P. suffruticosa) and 324 (T in P. suffruticosa) (Figure 1 and Table 3). Regions corresponding to three of these nucleotide positions, 205, 285 and 324 (Figure 1 and Table 2), were used for PNA probe design. Alignment of the PNA probes (dually labeled with HEX, FAM or Texas Red and a quencher at opposite ends) to template is illustrated in Figure 1 and Figure 3. Probe regions exhibited no intra-species variation, and three probes was needed for Paeonia species discrimination (Figure 1 and Table 2).
Species-specific nucleotides at positions 324 (A/T) and 205 (C/T) were used to design Probes 1 and 2, respectively (Figure 3). Probe 1 (labeled with HEX) hybridized perfectly with P. lactiflora (A), P. japonica (A) and P. veitchii (A), but not with P. suffruticosa (T). P. lactiflora, P. japonica and P. veitchii formed a melting peak at 63 °C with Probe 1, whereas no melting peak within the 35–85 °C range was seen with P. suffruticosa (Figure 3). Probe 2 (labeled with FAM) hybridized perfectly with P. lactiflora (C), P. japonica (C) and P. suffruticosa (C), but not with P. veitchii (T). P. veitchii formed a melting peak at 48 °C with Probe 2, and the other three Paeonia species exhibited a peak at 63 °C (Figure 3). Probe 3 (labeled with Texas Red) hybridized perfectly with P. japonica (G) and P. suffruticosa (G) and formed a mismatch hybrid with P. lactiflora (T) and P. veitchii (T). P. lactiflora and P. veitchii formed a melting peak at 70 °C with Probe 3, and P. japonica and P. suffruticosa formed a melting peak at 52 °C (Figure 3). Each of the three probes was detected separately using distinct fluorescence channels. Melting analysis was performed with 1 °C increments over the 35–85 °C range to produce melting curve profiles (Figure 4). No adverse results were observed with a no template control (NTC), and no fluorescent signal was observed from the probe dimer of non-specific products. In addition, to confirm the duplexes of the PNA probe-template, we analyzed the hybridization of the PNA probe and template DNA using the PNA probe, the PNA probe and template mixture and the renatured PNA probe-template on gel electrophoresis. As shown in Supplemental Figure S2, Lane 3, PNA probe-template duplexes were observed with 373-bp templates at approximately 850 bp on agarose gel electrophoresis.
Melting curve profiles were scored for perfect matches (1) or mismatches (0), and each of the four Paeonia species was represented by a unique barcode: P. lactiflora, 111; P. japonica, 110; P. veitchii, 101; and P. suffruticosa, 010 (Table 4).

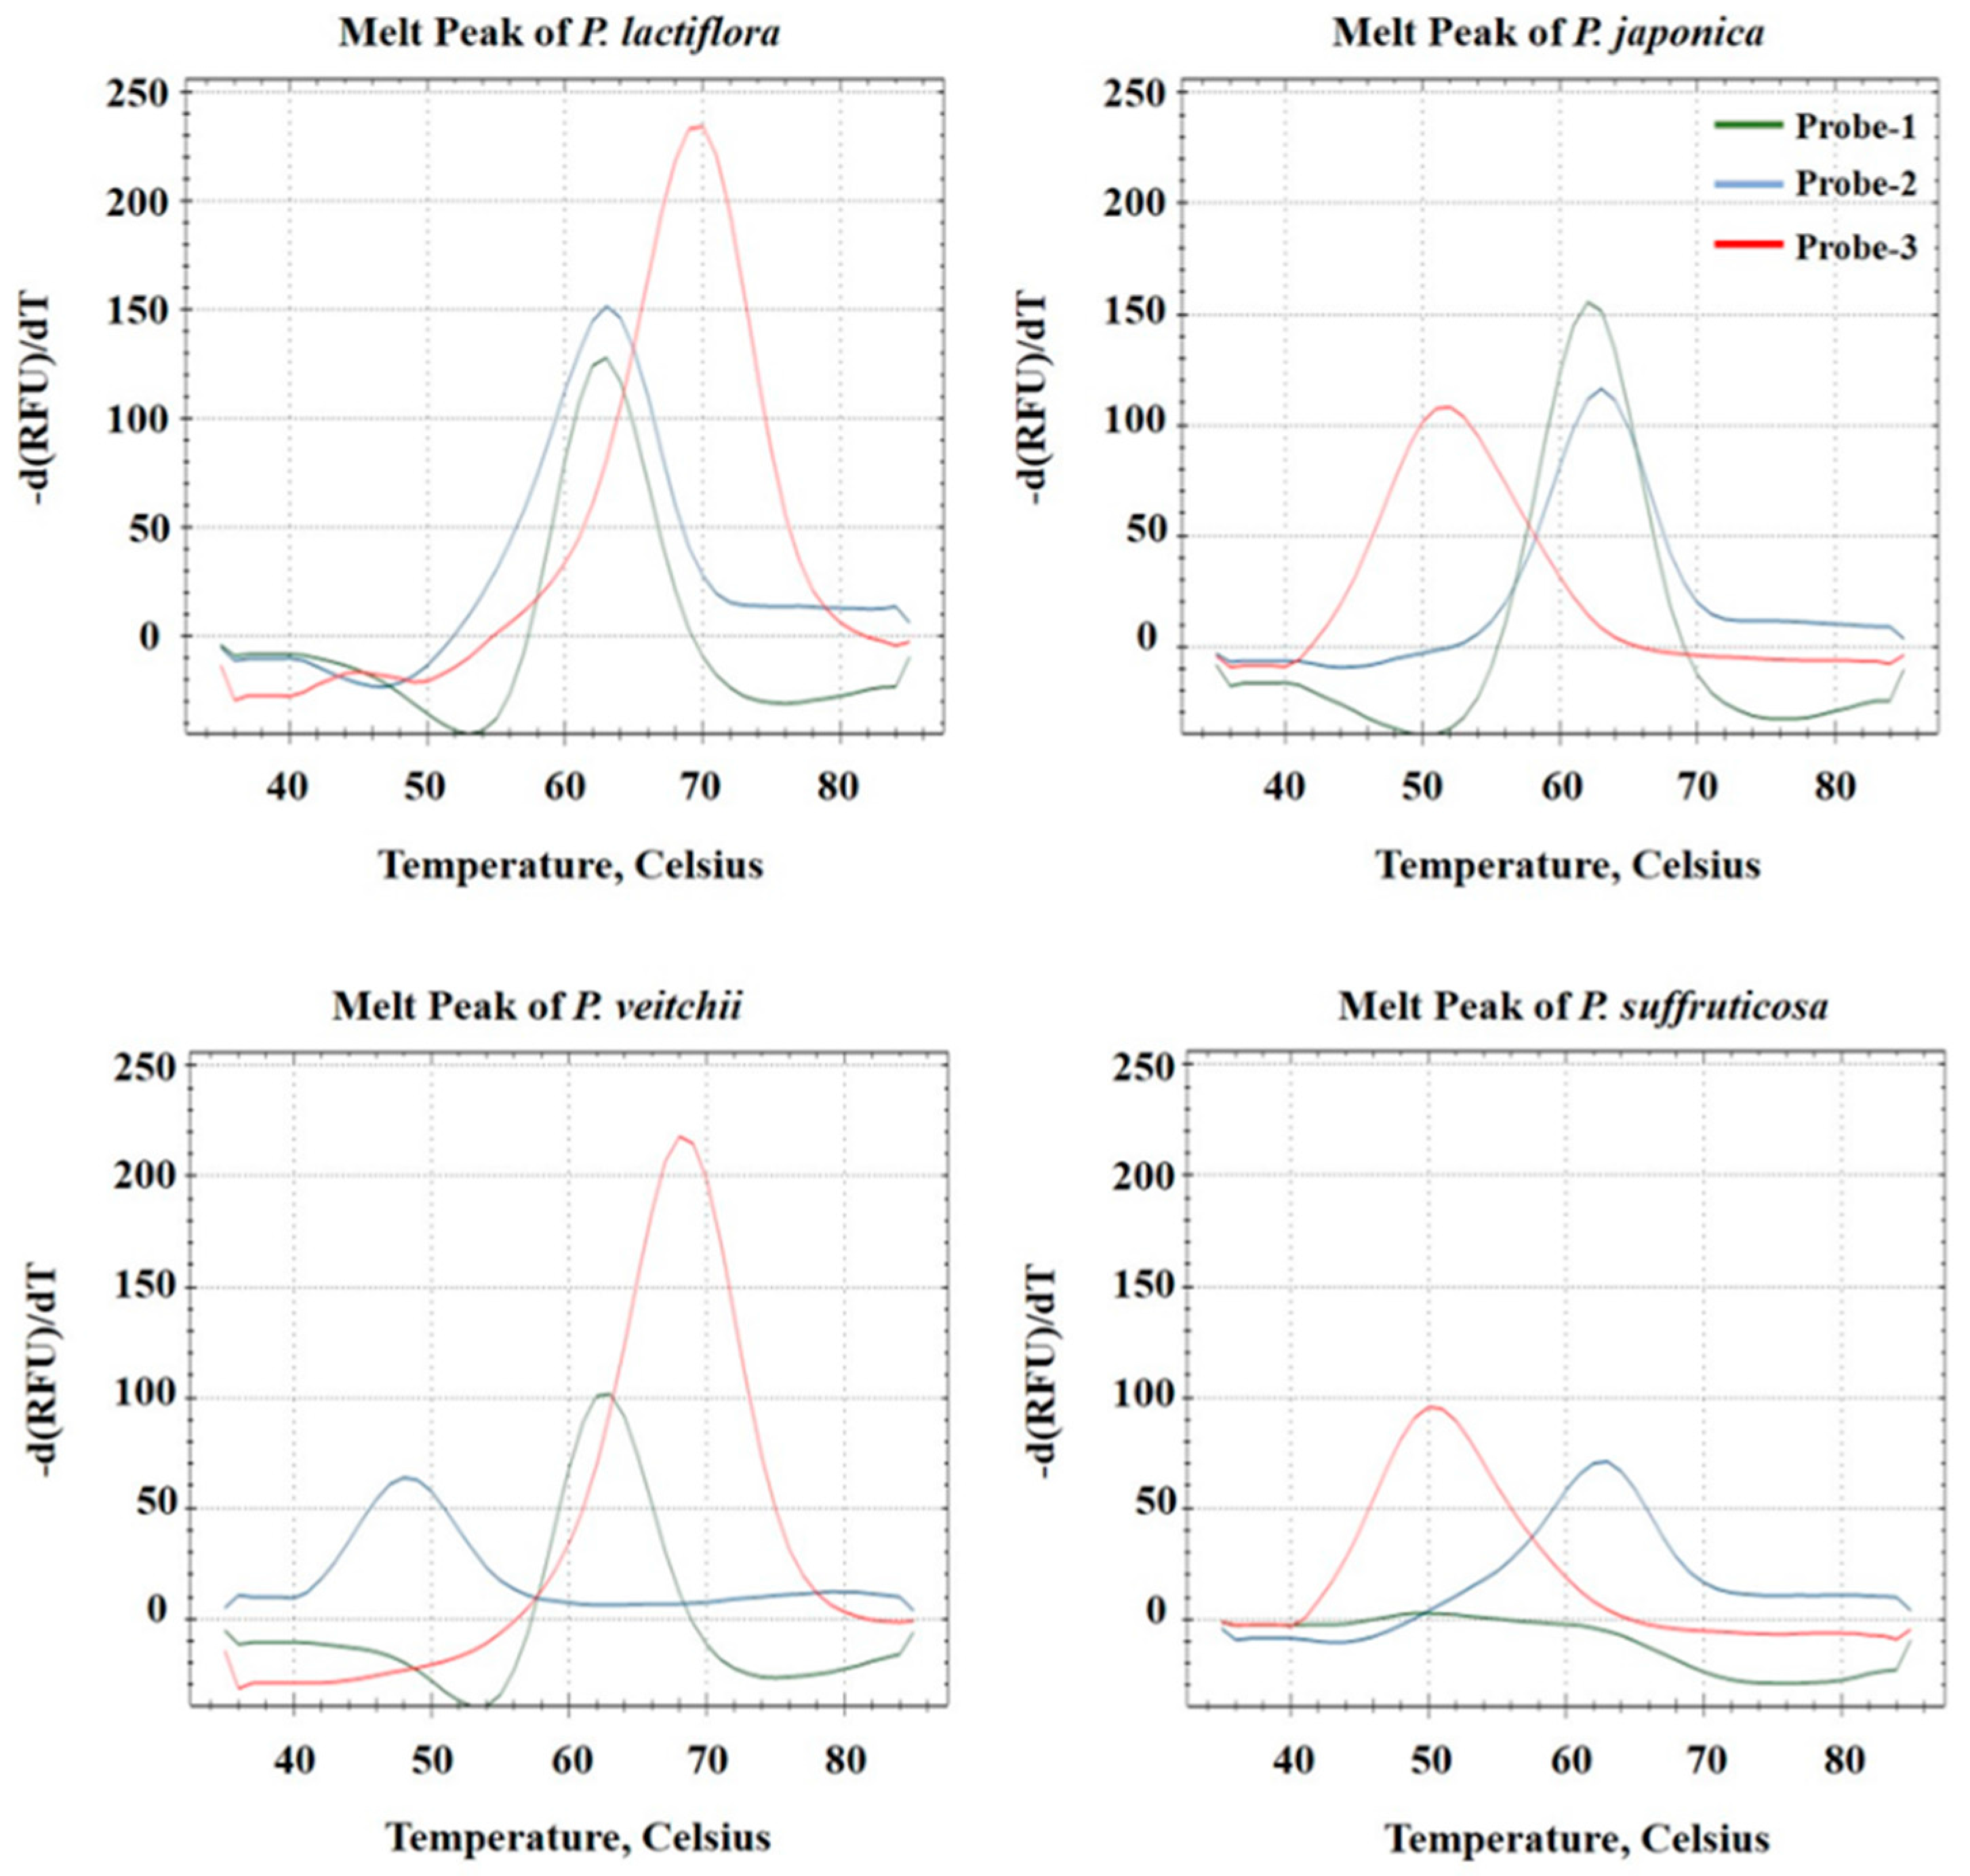
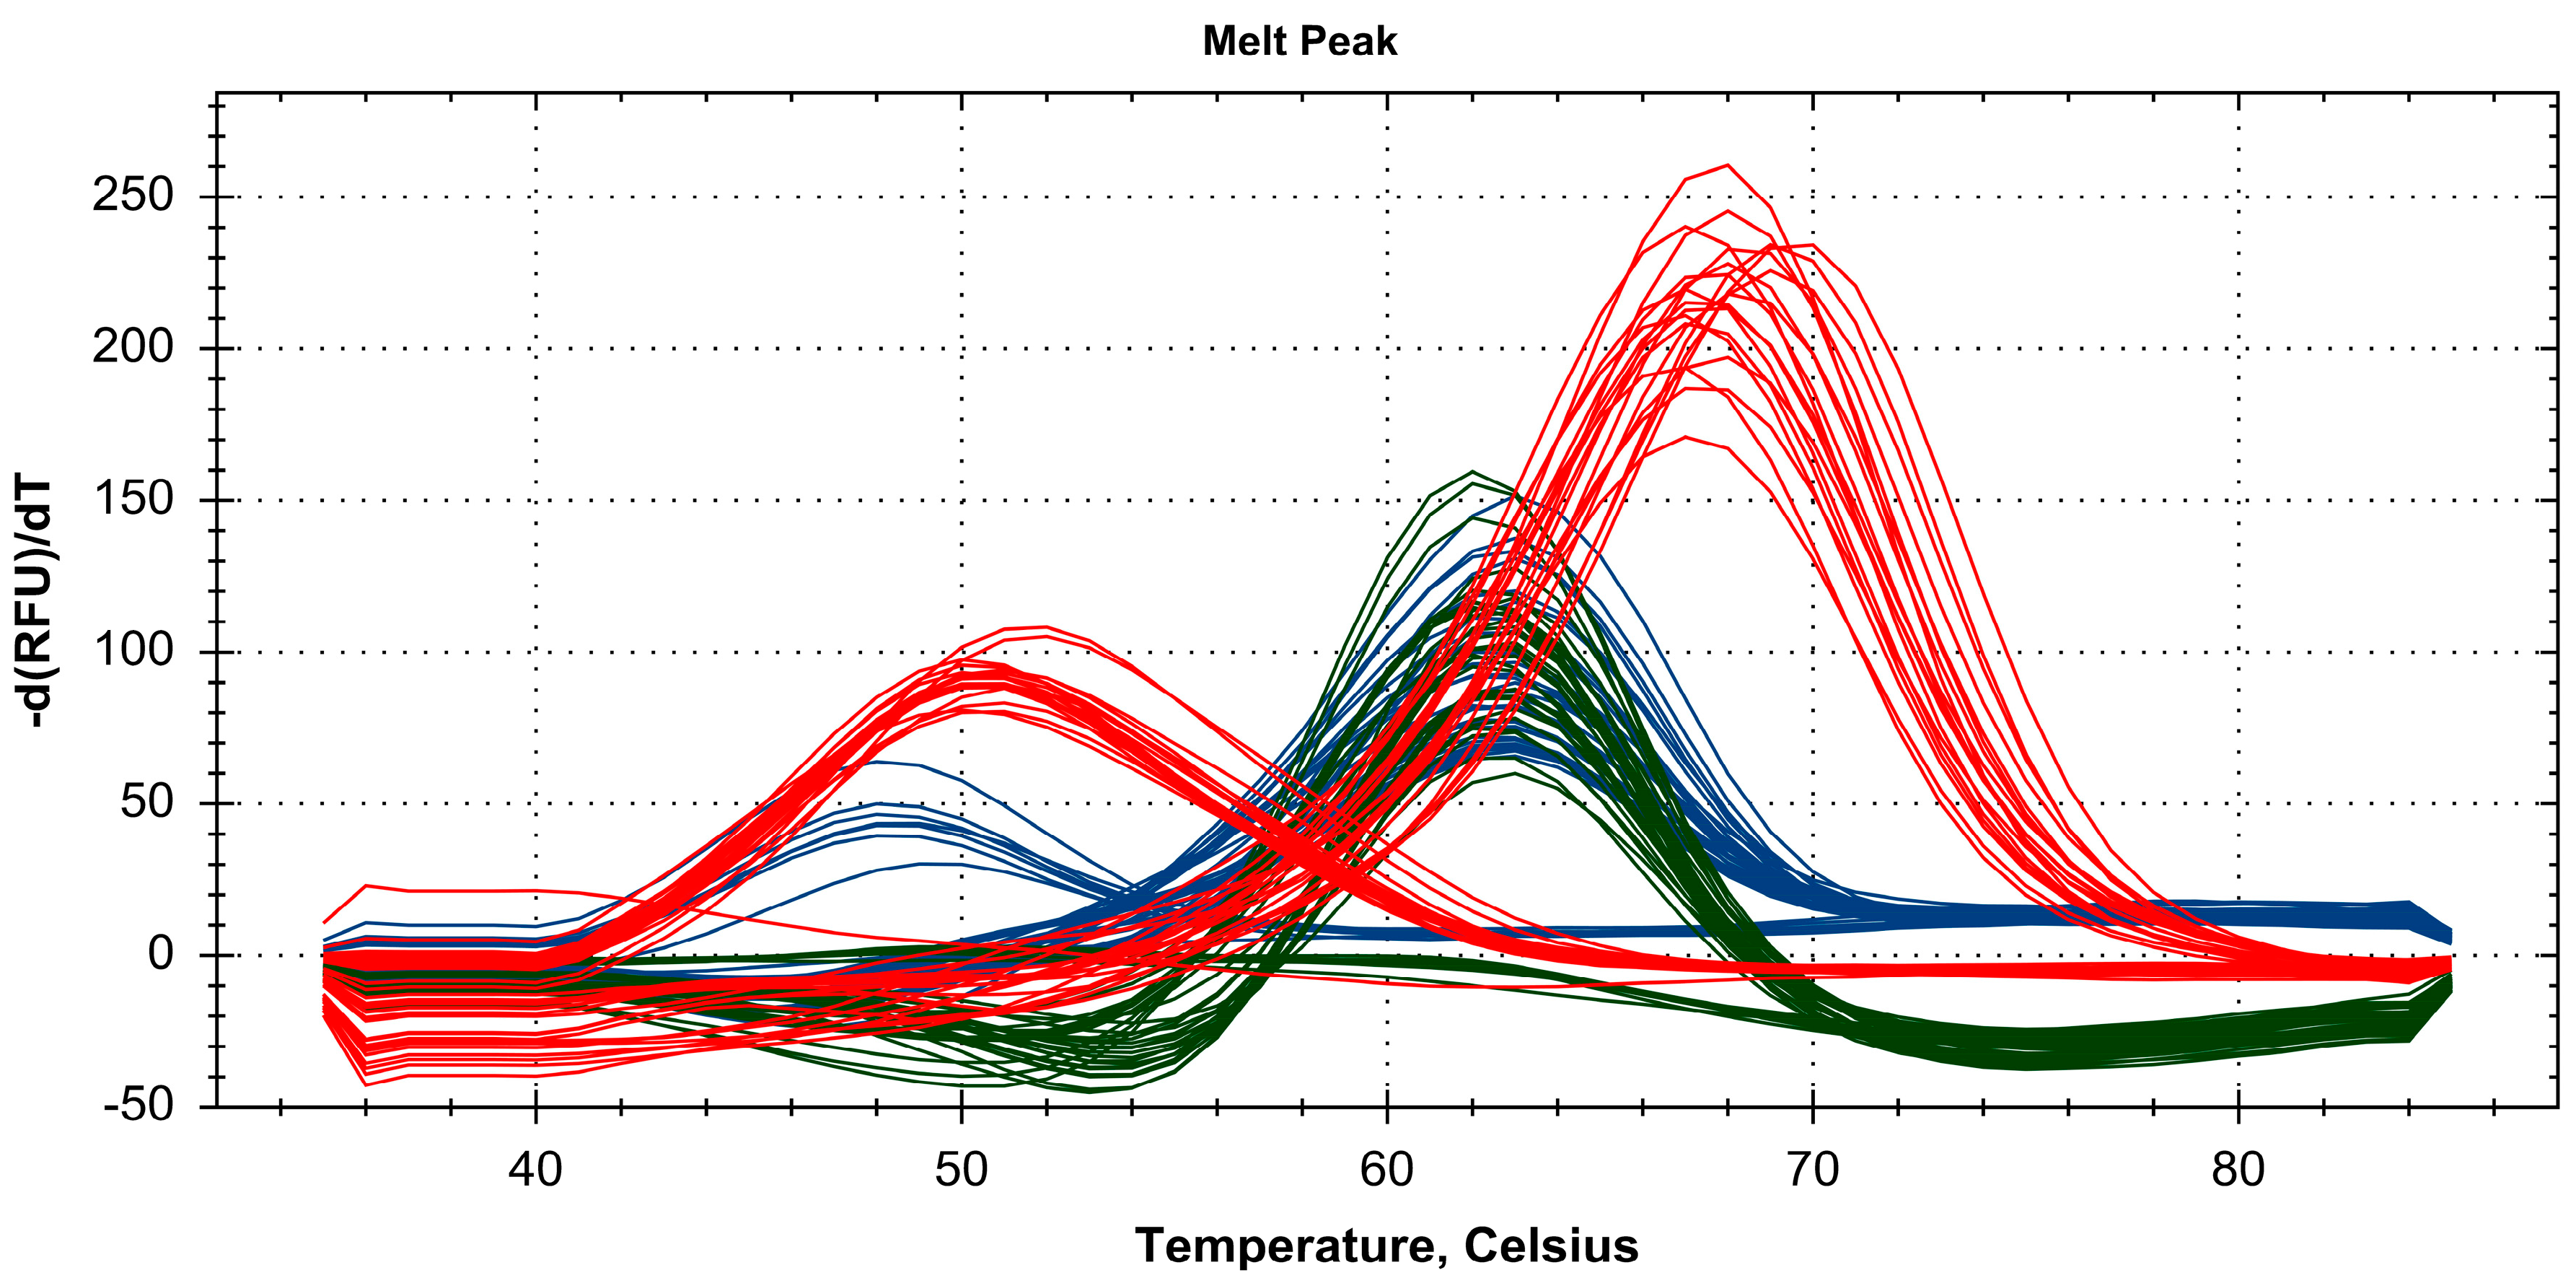
2.3. Discrimination of Four Paeonia Species Based on Melting Array Analysis

To test the robustness of the RT-PCR–PNA probe melting analysis identification method, 21 additional Paeonia samples were collected from diverse farmed locations in Korea and China and assessed. Six, seven, three and five samples of P. lactiflora, P. japonica, P. veitchii and P. suffruticosa were obtained, respectively. Figure 5 shows the merged melting curve profiles of 21 commercial Paeonia samples using the three PNA probes. As shown in Table 5, all 21 samples were successfully discriminated, and only one sample was inauthentic (Table 5 and Figure 5). This sample was described as P. japonica, but was identified as P. lactiflora. To confirm the accuracy of RT-PCR-PNA probe melting analysis, we analyzed nucleotide sequences of those PCR products using 373-bp amplicons of 21 samples, which were amplified using the Paeonia F and R primers (Supplemental Figure S3A). The resulting sequences were identical to the corresponding ITS2 sequences of the four Paeonia species excluding one sample, Sample No. 9 (Supplemental Figure S3B). This sample was identified as P. japonica in morphology-based species identification, but it was identified and confirmed as P. lactiflora in RT-PCR-PNA probe melting analysis.

3. Discussion

The same herbal medicine is often associated with different plant species in different national pharmacopoeias, which sometimes leads to adulteration and misidentification of herbal remedies [6,7]. Identifying the botanical origins of herbal medicines can be challenging, particularly where herbal medicines are distributed in highly processed forms such as powders or slices [7,14]. Morphological and genetic features are the main characteristics used for discrimination of herbal medicine species [11,14,20]. Morphological identification of processed herbal medicines requires professional expertise and taxonomic keys that accurately identify features such as color, size and shape of the sliced and whole plant parts [29]. DNA barcodes and molecular marker-based genetic traits are used for accurate identification of herbal medicines [12,20]. In contrast to molecular markers such as simple sequence repeats (SSRs) or random amplified polymorphic DNAs (RAPDs), which do not usually have broad utility, DNA barcoding uses short DNA regions that are found in diverse organisms. In plants, common sequences located in the nuclear and organellar (chloroplast, mitochondria) genomes are widely used for barcoding [20].
Several DNA barcode regions were investigated previously for their efficiency in identifying original herbal medicine species and closely related adulterants. Chen et al. [21] evaluated the utility of several plant barcoding sequences (ITS, ITS2, matK, rbcL, psbA-trnH, rpoC1 and ycf5) for identifying more than 6600 medicinal plants and their closely related species and proposed ITS2, with a success rate of 92.7%, as the most suitable barcoding sequence.
Previously, we evaluated DNA barcoding of four Paeonia species with ITS, matK and rbcL sequence regions [8] and found that ITS and rbcL were both discriminatory at the species level. However, DNA barcoding is something of a cumbersome process involving PCR amplification, sub-cloning, sequencing and data analysis, and we wished to develop a simple genetic technique for discrimination of the four Paeonia species [30]. The sequence-characterized amplified region (SCAR) marker has been known as one of the accurate and simple molecular markers for species identification in medicinal plants, and SCAR markers based on universal DNA barcode regions were developed for several medicinal plants [7,20,30]. An ideal SCAR marker based on DNA barcoding region contains (1) short sequences in a 1-kb region that can be routinely amplified by PCR, (2) species-specific nucleotides distinguishable among the allied species and (3) minimal intra-species variation [20,30]. However, these regions (ITS, matK and rbcL) did not harbor sufficient species-specific nucleotides to allow SCAR marker development for Paeonia species [8]. We therefore used an RT PCR approach with PNA probe melting curve analysis to develop a multiplex-discriminable marker for the four Paeonia species.
Several genotyping applications using melting curve analysis were reported previously in plants [31,32,33]. Melting curve analysis using PNA probes, which are artificially synthesized DNA analogs with an uncharged peptide backbone, can be combined with various fluorescent dye to allow multiplex discrimination of DNA variants with insufficient species-specific marker nucleotides [26]. This method exploits differences in melting temperatures between perfectly matched and mismatched DNA-PNA probe duplexes. Here, the ITS2 region was selected for melting curve analysis of Paeonia species. ITS2 had sufficient inter-species sequence variation to allow PNA probe design, had minimal intra-species variation and was more amenable to PCR amplification than ITS and rbcL, with 100% PCR efficiency. In this study, a region of the ITS2 sequence was amplified, and melting curve analysis was performed using three PNA probes labeled with distinct fluorescent tags. This technique allowed discrimination of four Paeonia species in a single reaction. The PNA probe-based method established in this study is a rapid and sensitive method for discriminating Paeonia species.
PNA probe techniques that utilize the strong DNA-binding capacity of PNA can be used to discriminate herbal medicine species from allied species and from morphologically similar adulterant species in herbal preparations. Abundant amplicons are produced by the RT-PCR step of this technique, allowing discrimination of small amounts of material in mixed preparations without the need for further analysis steps such as gel electrophoresis. Melting curve analysis of the four Paeonia species offers substantial advantages similar to DNA barcoding analysis such as ITS and matK, including fast and accurate species discrimination. The mixed adulterants could be distributed in herbal markets because herbal medicines are usually distributed as processed forms (powders or slices). Therefore, the discrimination of botanical origin is very important for quality control of herbal medicines. Melting curve analysis could be applied to discriminate the mixture of two Paeonia species using the three PNA-probes. In theory, the multiple mixtures excluding P. suffruticosa also could discriminate the botanical origins depending on the meting temperature (Tm) and fluorescence intensity (height of melting peak) of individual PNA probes. For example, the mixture of three Paeonia species, P. lactiflora, P. japonica and P. veitchii, would be detected at Tm 63 °C with Probe 1, at both 52 °C and 63 °C with Probe 2 and at both 52 °C and 70 °C with Probe 3, respectively. However, the fluorescence intensity of Probes 2 and 3 would be detected half against perfect match (PM) at the Tm of mismatch (MM). In contrast, two species mixtures between P. lactiflora, P. japonica and P. veitchii, would be detected with the same intensity of fluorescence at both MM and PM. These results indicate that an additional PNA probe specific to P. lactiflora or P. japonica is needed to establish an ideal method for discriminating the botanical origins of three or four Paeonia species mixtures. However, we could not find appropriate PNA probe regions in the nrDNA-ITS region, as well as matK and rbcL genes for four Paeonia species [8].
The melting curve analysis method established in this study was used to test 21 commercial samples of four Paeonia species, P. lactiflora, P. japonica, P. veitchii and P. suffruticosa, obtained from farms in Korea and China. We could not detect mixed adulterants in 21 commercial medicinal samples analyzed in this study. Of these samples, one P. japonica sample was revealed to be P. lactiflora. P. japonica is of higher value than other Paeonia species in the Korean herbal market, and adulteration of P. japonica preparations with other Paeonia species is possible. The accurate melting curve technique developed in this study allows the accurate discrimination of four Paeonia species and will contribute to quality control and standardization of Paeoniae Radix and Moutan Radicis Cortex.

4. Materials and Methods

4.1. Plant Materials and DNA Extraction

Seventeen Paeonia samples from four species, P. lactiflora, P. japonica, P. veitchii and P. suffruticosa, were used to establish a PNA-based melting array analysis method. All samples were collected from native habitats or farming fields in Korea and China, and species were identified based on analysis of morphological features by the Classification and Identification Committee of the Korea Institute of Oriental Medicine (KIOM), which comprises experts in the fields of plant taxonomy, botany, ecology, pharmacognosy and herbology. All plant materials were prepared voucher specimens that were preserved in the herbarium of the KIOM (Index Herbariorum code: KIOM) (Supplemental Photo 1). Fresh leaves of samples were quick frozen in liquid nitrogen and stored at −80 °C. To validate the PNA-based melting array method of distinguishing between Paeonia species, 21 commercial medicinal samples were purchased from herbal markets in Korea and China and tested.
Approximately 100 mg of frozen leaves were crushed in 800 μL AP1 buffer (DNeasy® Plant Mini Kit, Qiagen, Valencia, CA, USA) using a Precellys™ Grinder (Bertin Technologies, Montigny-le-Bretonneux, France). Genomic DNA was extracted using the DNeasy® Plant Mini Kit according to the manufacturer’s protocol. Genomic DNA quality was confirmed using 1.5% agarose gel electrophoresis with a 1-kb DNA ladder (Solgent, Daejeon, Korea), and DNA concentration was determined with UV/Vis spectrophotometry by absorbance at 260 nm (ND-1000, NanoDrop, Wilmington, DE, USA). DNA was diluted to a final concentration of ~15 ng/μL and used as a template for PCR amplification.

4.2. Amplification and Sequencing of ITS2 Regions

ITS2 regions were amplified from 17 Paeonia samples (P. lactiflora, P. japonica, P. veitchii and P. suffruticosa) using ITS-s2f and ITS4 universal primers (0.5 µM of each primers). PCR conditions were as described in Table 2. PCR amplification was performed using Solg™ 2 × Taq PCR Smart-Mix I (Solgent). The amplified products were separated using 1.5% agarose gel electrophoresis with a 100-bp DNA ladder (Solgent, Daejeon, Korea). DNA fragments were excised from the gel and extracted using a Gel Extraction Kit (Qiagen, Valencia, CA, USA). Eluted DNA fragments were sub-cloned into pGEM®-T Easy Vector (Promega, Madison, WI, USA) and transformed into E. coli using a JUMBO-80 kit with HIT-JM109 (RBC Bioscience, Taipei, Taiwan) competent cells according to the manufacturers’ protocols. Transformed E. coli were spread on LB agar medium containing 100 μg/mL ampicillin, 40 μg/mL X-gal and 0.5 mM IPTG and incubated for 18–20 h at 37 °C. Plasmid DNA was isolated from white colonies, and insert sequences were determined using dideoxynucleotide chain termination sequencing (Sanger sequencing) with standard SP6 and T7 primers. Raw ITS2 sequences were obtained from a minimum of three bacterial colonies for each of the 17 Paeonia samples. Nilsson et al. [34] suggested guidelines for quality control of barcoding sequence. Thus, we edited raw ITS2 sequences considering on target genes, orientation of sequences and chimeras and also confirmed species using NCBI BLAST. Sequences were assembled using the BioEdit Version 7.2.5 software, and the representative sequences of individual samples were determined [35]. These representative ITS2 sequences of individual samples were registered in the NCBI GenBank (P. lactiflora, MG210828-MG210832; P. japonica, MG210833-MG210837; P. veitchii, MG210838-MG210841; P. suffruticosa, MG210842-MG210843). These individual ITS2 sequences were aligned to analyze the intra-/inter-species genetic distance using the Kimura-2-parameter (K2P) model in the MEGA6 (Molecular Evolutionary Genetics Analysis Version 6.0, Tempe, AZ, USA) program.

4.3. Comparative Analysis of ITS2 Sequences for the Design of PNA Probes

Candidate ITS2 sequence regions that included species-specific variable sequences were identified by comparative analysis and used to design PCR primers (Paeonia F and R) and PNA probes for the melting curve analysis method. Three specific PNA probes dually labeled with an HEX, FAM or Texas Red fluorophore and a quenchers (dabcyl) at opposite ends were synthesized commercially (SeaSun Biomaterials, Daejeon, Korea). The probes are designed to form a hairpin structure that places the fluorescence and quencher in close proximity to maximize the clamping effect. Probes were purified using high-performance liquid chromatography, and purity was confirmed by mass spectrometry. Probe matching capacities were confirmed by test hybridizations between PNA and complementary target DNA using a CFX96™ Real-Time System (C1000™ Thermal Cycler, Bio-Rad, Hercules, CA, USA).

4.4. Establishment of PNA-Based Melting Array Method

The target ITS2 region for hybridization to PNA probes was amplified using 5’-phosphorylated Paeonia F primer (0.5 µM), Paeonia R primer (0.5 µM) and 2 × q-PCR Pre-mix™ (SeaSun Biomaterials, Daejeon, Korea), as described in Table 2. Specificity and sequence of PCR products were confirmed by 1.5% agarose gel electrophoresis and Sanger sequencing, respectively. After PCR amplification, 9 μL amplicon containing phosphate groups at the 5’ end of all antisense sequences were used for the melting curve analysis. The hybridization between PNA probe and amplicon was reacted using 2× melting array Buffer A, melting array Buffer B and 0.5 µM of each PNA probe, as described in Table 2. PCR amplification of the target region and hybridization between probes and amplicon were performed using a CFX96™ Real-Time System (C1000™ Thermal Cycler, Bio-Rad, Hercules, CA, USA). As described in Table 2, Step 1 was carried out at 37 °C for 1 h to digest the 5’-phosphorylated strands of PCR amplicons by 5’→3’ exonuclease activity. Then, Step 2 was conducted to anneal PNA probes and templates at 75 °C for 1 min, 55 °C for 1 min and 35 °C for 3 min after denaturation at 95° for 2 min. Finally, PNA probe-template duplexes were gradually dissociated from 35 °C to 85 °C with increasing by 1 °C/s in Step 3. The fluorescence of PNA probe dissociated with template was detected in three separate fluorescent channels (HEX, FAM and Texas Red), and melting profiles were analyzed using Bio-Rad CFX Manager Version 3.1 (Bio-Rad, Hercules, CA, USA). The hybridization of PNA probe-template was confirmed on gel electrophoresis using renatured samples (Supplemental Figure S2). Perfectly matched PNA probe-template duplexes were dissociated at a higher temperature than imperfectly hybridized duplexes because of the difference in DNA-binding capacity. The melting temperature differences between perfectly matching and mismatching duplexes were used to score melting curves as 1 or 0 for perfectly matching and mismatching duplexes, respectively. The score combinations for the three probes allowed the four Paeonia species to be identified with high accuracy.

5. Conclusions

ITS2 sequences of four Paeonia species that are used as Paeoniae Radix (P. lactiflora, P. japonica and P. veitchii) or Moutan Radicis Cortex (P. suffruticosa) in traditional Korean herbal medicine were analyzed by ClustalW multiple alignment to identify polymorphic nucleotides. PNA probes (dually labelled with an HEX, FAM or Texas Red fluorophore and a quencher at opposite ends) were designed against regions containing polymorphic nucleotides and used to develop a melting curve method for the discrimination of four Paeonia species. The method was tested using commercially available Paeonia samples from Korea and China. Of 21 samples, one was found to be P. japonica rather than P. lactiflora, indicating the possible adulteration of P. japonica preparations. The PNA melting curve method allowed simple, rapid identification of four Paeonia species and will be useful for quality control and standardization of Paeonia herbal medicines.

Supplementary Materials

Supplementary materials are available online.

Acknowledgments

We thank the ‘Classification and Identification Committee of the KIOM’ for critical identification of Paeonia samples and also thank the Korean Herbarium of Standard Herbal Resources (IH code: KIOM) for providing plant materials. This work was supported by the grant awards ‘Development of Foundational Techniques for the Domestic Production of Authentic Herbal Medicines based on the Establishment of Molecular Authentication System’ (K14417 and K17403) and funded by the Ministry of Science, ICT and Future Planning (MSIP) of Korea to the Korea Institute of Oriental Medicine.

Author Contributions

B.C.M. and W.J.K. were responsible for the experimental concept and design, PCR, sequence analysis, primer design, performing the experiments and manuscript preparation. S.Y., G.C. and B.C.M. performed sample collection and species identification.

Conflicts of Interest

The authors declare no conflicts of interest.

References

  1. Ahmad, I.; Mehmood, Z.; Mohammad, F. Screening of some Indian medicinal plants for their antimicrobial properties. J. Ethnopharmacol. 1998, 62, 183–193. [Google Scholar] [CrossRef]
  2. Yuan, H.; Ma, Q.; Ye, L.; Piao, G. The traditional medicine and modern medicine from natural products. Molecules 2016, 21, 559. [Google Scholar] [CrossRef] [PubMed]
  3. Dutra, R.C.; Campos, M.M.; Santos, A.R.S.; Calixto, J.B. Medicinal plants in Brazil: Pharmacological studies, drug discovery, challenges and perspectives. Pharmacol. Res. 2016, 112, 4–29. [Google Scholar] [CrossRef] [PubMed]
  4. Cai, Y.; Luo, Q.; Sun, M.; Corke, H. Antioxidant activity and phenolic compounds of 112 traditional Chinese medicinal plants associated with anticancer. Life Sci. 2004, 74, 2157–2184. [Google Scholar] [CrossRef] [PubMed]
  5. Angulo, P.; Kaushik, G.; Subramaniam, D.; Dandawate, P.; Neville, K.; Chastain, K.; Anant, S. Natural compounds targeting major cell signaling pathways: A novel paradigm for osteosarcoma therapy. J. Hematol. Oncol. 2017, 10, 10. [Google Scholar] [CrossRef] [PubMed]
  6. Defining Dictionary for Medicinal Herbs in Korea Institute of Oriental Medicine. Available online: http://boncho.kiom.re.kr/codex/ (accessed on 9 May 2017). (In Korean).
  7. Kim, W.J.; Moon, B.C.; Yang, S.; Han, K.S.; Choi, G.; Lee, A.Y. Rapid authentication of the herbal medicine plant species Aralia continentalis Kitag. and Angelica biserrata C.Q. Yuan and R.H. Shan using ITS2 sequences and multiplex-SCAR markers. Molecules 2016, 21, 270. [Google Scholar] [CrossRef] [PubMed]
  8. Kim, W.J.; Ji, Y.; Choi, G.; Kang, Y.M.; Yang, S.; Moon, B.C. Molecular identification and phylogenetic analysis of important medicinal plant species in genus Paeonia based on rDNA-ITS, matK, and rbcL DNA barcode sequences. Genet. Mol. Res. 2016, 15. [Google Scholar] [CrossRef] [PubMed]
  9. Kim, J.; Lee, H.; Lee, Y.; Oh, B.G.; Cho, C.; Kim, Y.; Shin, M.; Hong, M.; Jung, S.K.; Bae, H. Inhibition effects of Moutan Cortex Radicis on secretion of eotaxin in A549 human epithelial cells and eosinophil migration. J. Ethnopharmacol. 2007, 114, 186–193. [Google Scholar] [CrossRef] [PubMed]
  10. Li, X.; Wang, Y.; Sun, Q.; Xu, B.; Yu, Y.; Wang, X. Molecularly imprinted solid phase extraction in a syringe filter for determination of triazine herbicides in Radix Paeoniae Alba by ultra-fast liquid chromatography. Talanta 2016, 148, 539–547. [Google Scholar] [CrossRef] [PubMed]
  11. Semagn, K.; Bjørnstad, Å.; Ndjiondjop, M.N. An overview of molecular marker methods for plants. Afr. J. Biotechnol. 2006, 5, 2540–2568. [Google Scholar]
  12. Moon, B.C.; Ji, Y.; Lee, Y.M.; Kang, Y.M.; Kim, H.K. Authentication of Akebia quinata DECNE. from its common adulterant medicinal plant species based on the RAPD-derived SCAR markers and multiplex-PCR. Genes Genom. 2015, 37, 23–32. [Google Scholar] [CrossRef]
  13. Joshi, K.; Chavan, P.; Warude, D.; Patwardhan, B. Molecular markers in herbal drug technology. Curr. Sci. 2004, 87, 159–165. [Google Scholar]
  14. Li, J.; Cui, Y.; Jiang, J.; Yu, J.; Niu, L.; Deng, J.; Shen, F.; Zhang, L.; Yue, B.; Li, J. Applying DNA barcoding to conservation practice: A case study of endangered birds and large mammals in China. Biodivers. Conserv. 2017, 26, 653–668. [Google Scholar] [CrossRef]
  15. Benqtsson-Palme, J.; Hartmann, M.; Eriksson, K.M.; Pal, C.; Thorell, K.; Larsson, D.G.; Nilsson, R.H. METAXA2: Improved identification and taxonomic classification of small and large subunit rRNA in metagenomic data. Mol. Ecol. 2015, 15, 1403–1414. [Google Scholar] [CrossRef] [PubMed]
  16. Hibbett, D.; Abarenkov, K.; Kõljalg, U.; Öpik, M.; Chai, B.; Cole, J.; Wang, Q.; Crous, P.; Robert, V.; Helgason, T.; et al. Sequence-based classification and identification of Fungi. Mycologia 2016, 108, 1049–1068. [Google Scholar] [PubMed]
  17. CBOL Plant Working Group. A DNA barcode for land plants. Proc. Natl. Acad. Sci. USA 2009, 106, 12794–12797. [Google Scholar]
  18. Tripathi, A.M.; Tyagi, A.; Kumar, A.; Singh, A.; Singh, S.; Chaudhary, L.B.; Roy, S. The Internal Transcribed Spacer (ITS) region and trnhH-psbA are suitable candidate loci for DNA barcoding of tropical tree species of India. PLoS ONE 2013, 8, e57934. [Google Scholar] [CrossRef] [PubMed]
  19. Mattia, F.D.; Bruni, I.; Galimberti, A.; Cattaneo, F.; Casiraghi, M.; Labra, M. A comparative study of different DNA barcoding markers for the identification of some members of Lamiacaea. Food Res. Int. 2011, 44, 693–702. [Google Scholar] [CrossRef]
  20. Ganie, S.H.; Upadhyay, P.; Das, S.; Sharma, M.P. Authentication of medicinal plants by DNA markers. Plant Gene 2015, 4, 83–99. [Google Scholar] [CrossRef]
  21. Chen, S.; Yao, H.; Han, J.; Liu, C.; Song, J.; Shi, L.; Zhu, Y.; Ma, X.; Gao, T.; Pang, X.; et al. Validation of the ITS2 region as a novel DNA barcode for identifying medicinal plant species. PLoS ONE 2010, 5, e8613. [Google Scholar] [CrossRef] [PubMed]
  22. Ren, Y.; Li, X.; Liu, Y.; Yang, L.; Cai, Y.; Quan, S.; Pan, L.; Chen, S. A novel quantitative real-time PCR method for identification and quantification of mammalian and poultry species in foods. Food Control 2017, 76, 42–51. [Google Scholar] [CrossRef]
  23. Kitpipit, T.; Penchart, K.; Ouithavon, K.; Satasook, C.; Linacre, A.; Thanakiatkrai, P. A novel real time PCR assay using melt curve analysis for ivory identification. Forensic Sci. Int. 2016, 267, 210–217. [Google Scholar] [CrossRef] [PubMed]
  24. Kikkawa, H.S.; Tsuge, K.; Kubota, S.; Aragane, M.; Ohta, H.; Sugita, R. Species identification of white false hellebore (Veratrum album subsp. oxysepalum) using real-time PCR. Forensic Sci. Int. 2017, 275, 160–166. [Google Scholar] [PubMed]
  25. Iwobi, A.; Sebah, D.; Spielmann, G.; Maggipinto, M.; Schrempp, M.; Kraemer, I.; Gerdes, L.; Busch, U.; Huber, I. A multiplex real-time PCR method for the quantitative determination of equine (horse) fractions in meat products. Food Control 2017, 74, 89–97. [Google Scholar] [CrossRef]
  26. Hur, D.; Kim, M.S.; Song, M.; Jung, J.; Park, H. Detection of genetic variation using dual-labeled peptide nucleic acid (PNA) probe-based melting point analysis. Biol. Proced. Online 2015, 17, 14. [Google Scholar] [CrossRef] [PubMed]
  27. Han, J.Y.; Choi, J.J.; Kim, J.Y.; Han, Y.L.; Lee, G.K. PNA clamping-assisted fluorescence melting curve analysis for detecting EGFR and KRAS mutations in the circulating tumor DNA of patients with advanced non-small cell lung cancer. BMC Cancer 2016, 16, 627. [Google Scholar]
  28. Kim, Y.T.; Kim, J.W.; Kim, S.K.; Joe, G.H.; Hong, I.S. Simultaneous genotyping of multiple somatic mutations by using a clamping PNA and PNA detection probes. Chembiochem 2015, 16, 209–213. [Google Scholar] [CrossRef] [PubMed]
  29. Chen, S.; Pang, X.; Song, J.; Shi, L.; Yao, H.; Han, J.; Leon, C. A renaissance in herbal medicine identification: From morphology to DNA. Biotechnol. Adv. 2014, 32, 1237–1244. [Google Scholar] [CrossRef] [PubMed]
  30. Moon, B.C.; Kim, W.J.; Han, K.S.; Yang, S.; Kang, Y.; Park, I.; Piao, R. Differentiating authentic Adenophorae Radix from its adulterants in commercially-processed samples using multiplexed ITS sequence-based SCAR markers. Appl. Sci. 2017, 7, 660. [Google Scholar] [CrossRef]
  31. Monteros, M.J.; Ha, B.K.; Phillips, D.V.; Boerma, H.R. SNP assay to detect the ‘Hyuuga’ red-brown lesion resistance gene for Asian soybean rust. Theor. Appl. Genet. 2010, 121, 1023–1032. [Google Scholar] [CrossRef] [PubMed]
  32. Li, Y.D.; Chu, Z.Z.; Liu, X.G.; Jing, H.C.; Liu, Y.G.; Hao, D.Y. A Cost-effective high-resolution melting approach using the EvaGreen dye for DNA polymorphism detection and genotyping in plants. J. Integr. Plant Biol. 2010, 52, 1036–1042. [Google Scholar] [CrossRef] [PubMed]
  33. Sun, W.; Yan, S.; Li, J.; Xiong, C.; Shi, Y.; Wu, L.; Xiang, L.; Deng, B.; Ma, W.; Chen, S. Study of commercially available Lobelia chinensis products using bar-HRM technology. Front. Plant Sci. 2017, 8. [Google Scholar] [CrossRef] [PubMed]
  34. Nilssson, R.H.; Tedersoo, L.; Abarenkov, K.; Ryberg, M.; Kristiansson, E.; Hartmann, M.; Schoch, C.L.; Nylander, J.A.A.; Bergsten, J.; Porter, T.M.; et al. Five simple guidelines for establishing basic authenticity and reliability of newly generated fungal ITS sequences. MycoKeys 2012, 4, 37–63. [Google Scholar] [CrossRef]
  35. Hall, T.A. BioEdit: A user-friendly biological sequence alignment editor and analysis program for Windows 95/98/NT. Nucleic Acids Symp. Ser. 1999, 41, 95–98. [Google Scholar]
Sample Availability: Samples of the four Paeonia species are available from the authors and the herbarium KIOM.
Figure 1. Design of primers and three PNA probes for melting curve analysis. Sequences were designed against ITS2 sequences from Paeonia species. Arrows and boxes indicate specific primers used for amplification and PNA probes used for melting curve analysis, respectively.
Molecules 22 01922 g001
Figure 2. RT-PCR amplification and PNA probe melting curve analysis of four Paeonia species. A region of the ITS2 sequence was amplified, and melting analysis with three fluorescently-labeled PNA probes was used to discriminate between the four species.
Molecules 22 01922 g002
Figure 3. Melting curve analysis of perfectly matching and mismatching duplexes between PNA probes and amplified ITS2 sequences. PNA probes were dually labelled with HEX (Probe 1), FAM (Probe 2) or Texas Red (Probe 3) and a quencher at opposite ends.
Molecules 22 01922 g003
Figure 4. Melting curve profiles of four Paeonia species with three ITS2 PNA probes. Perfectly matched probes produced melting peaks at 63 °C (Probe 1; green), 63 °C (Probe 2; blue) and 70 °C (Probe 3; red). Corresponding mismatches produced no curve (Probe 1), 48 °C melting peak (Probe 2) or 52 °C melting peak (Probe 3).
Molecules 22 01922 g004
Figure 5. Melting profiles of Paeonia samples cultivated in Korea and China derived from melting curve analysis with PNA probes. Green, blue, and red indicates the melting peaks generated by HEX (Probe 1), FAM (Probe 2), and Texas Red (Probe 3), respectively.
Molecules 22 01922 g005
Table 1. Statistical characteristics of ITS2 regions.
Scientific NameAmplicon Length (bp)Intra-Species Distance (%)Inter-Species Distance (%)G + C (%)
P. lactiflora3880.47 ± 0.451.84 ± 0.5356.1
P. japonica3880.26 ± 0.171.87 ± 0.3556.9
P. veitchii3880.61 ± 0.322.00 ± 0.6955.9
P. suffruticosa3880.00 ± 0.002.25 ± 0.6657.2
Table 2. Primer sequences and PCR parameters for ITS2 amplification and PNA melting analysis.
Primer NamePrimer Sequence (5′ to 3′)PCR ParameterReaction Component
ITS-s2f
ITS4
ATG CGA TAC TTG GTG TGA AT
TCC TCC GCT TAT TGA TAT GC
Step 1: 95 °C, 2 min
Step 2: 95 °C, 40 s
53 °C, 30 s
72 °C, 40 s (35 cycles)
Step 3: 72 °C 5 min
gDNA: 1 µL (15 ng/µL)
Primer: each 2 µL (10 pmol/µL)
2 × Pre-mix: 20 µL
Final vol.: 40 µL
Paeonia F
Paeonia R
GCG ATA CTT GGT GTG AAT TGC AGA ATC
GAT ATG CTT AAA TTC AGC GGG TAG TCC
Step 1: 95 °C, 10 min
Step 2: 95 °C, 30 s
60 °C, 40 s
72 °C, 40 s (33 cycles)
Step 3: 72 °C, 1 min
20 °C, 1 min
gDNA: 1 µL (15 ng/µL)
Primer: mixture 1 µL
2 × qPCR Pre-mix: 10 µL
Final vol.: 20 µL
PNA Probe-1
PNA Probe-2
PNA Probe-3
CGA TGA TGC ATC CA
TAA ATC GAG CCC CG
CCG TGG GAG CTC
Step 1: 37 °C, 1 h
Step 2: 95 °C, 2 min
75 °C, 1 min
55 °C, 1 min
35 °C, 3 min
Step 3: 35–85 °C, increasing 1 °C/s
Amplicon DNA: 9 µL
2 × melting array Buffer A: 10 µL
Melting array Buffer B: 0.5 µL
PNA probe mixture: 0.5 µL
Final vol.: 20 µL
Table 3. Species-specific nucleotides and polymorphic nucleotides in ITS2 sequences from four Paeonia species.
SpeciesAligned Nucleic Acid Position
137144188189205285297304324
P. lactifloraTTTACGGAA
P. japonicaGCCACTGAA
P. veitchiiTTTATGGAA
P. suffruticosaGCCGCTAGT
Underlined bold characters indicate species-specific nucleotides.
Table 4. Barcodes of four Paeonia species based on melting curve analysis with three PNA probes.
SpeciesProbe 1Probe 2Probe 3Barcode
NT 1Tm 2MT 3NT 1Tm 2MT 3NT 1Tm 2MT 3
P. lactifloraA63 °CPMC63 °CPMG70 °CPM1 1 1
P. japonicaA63 °CPMC63 °CPMT52 °CMM1 1 0
P. veitchiiA63 °CPMT48 °CMMG70 °CPM1 0 1
P. suffruticosaTNDMMC63 °CPMT52 °CMM0 1 0
1 NT: nucleotide type; 2 Tm: melting temperature; 3 MT: matching type: perfect match (PM) or mismatch (MM).
Table 5. Discrimination of Paeonia samples using PNA melting analysis.
No.Collection SiteSample NameBarcodeDiscrimination Result
1Tongyoung, Gyeongnam, KoreaP. lactiflora1 1 1P. lactiflora
2Jeongseon, Gangwon, KoreaP. lactiflora1 1 1P. lactiflora
3Jinju, Gyeongnam, KoreaP. lactiflora1 1 1P. lactiflora
4Sejong, Sejong, KoreaP. lactiflora1 1 1P. lactiflora
5Inje, Gangwon, KoreaP. lactiflora1 1 1P. lactiflora
6Yanji, Jilin, ChinaP. lactiflora1 1 1P. lactiflora
7Andong, Gyeongbuk, KoreaP. japonica1 1 0P. japonica
8Geochang, Gyeongnam, KoreaP. japonica1 1 0P. japonica
9Sejong, Sejong, KoreaP. japonica *1 1 1P. lactiflora *
10Geumsan, Chungnam, KoreaP. japonica1 1 0P. japonica
11Hamyang, Gyeongnam, KoreaP. japonica1 1 0P. japonica
12Jeongseon, Gangwon, KoreaP. japonica1 1 1P. japonica
13Sancheong, Gyeongnam, KoreaP. japonica1 1 1P. japonica
14Ngawa, Sichuan, ChinaP. veitchii1 0 1P. veitchii
15Ngawa, Sichuan, ChinaP. veitchii1 0 1P. veitchii
16Gannan, Gansu, ChinaP. veitchii1 0 1P. veitchii
17Jinju, Gyeongnam, KoreaP. suffruticosa0 1 0P. suffruticosa
18Jinju, Gyeongnam, KoreaP. suffruticosa0 1 0P. suffruticosa
19Jinju, Gyeongnam, KoreaP. suffruticosa0 1 0P. suffruticosa
20Jinju, Gyeongnam, KoreaP. suffruticosa0 1 0P. suffruticosa
21Jinju, Gyeongnam, KoreaP. suffruticosa0 1 0P. suffruticosa
Asterisk (*) indicates inauthentic sample.

