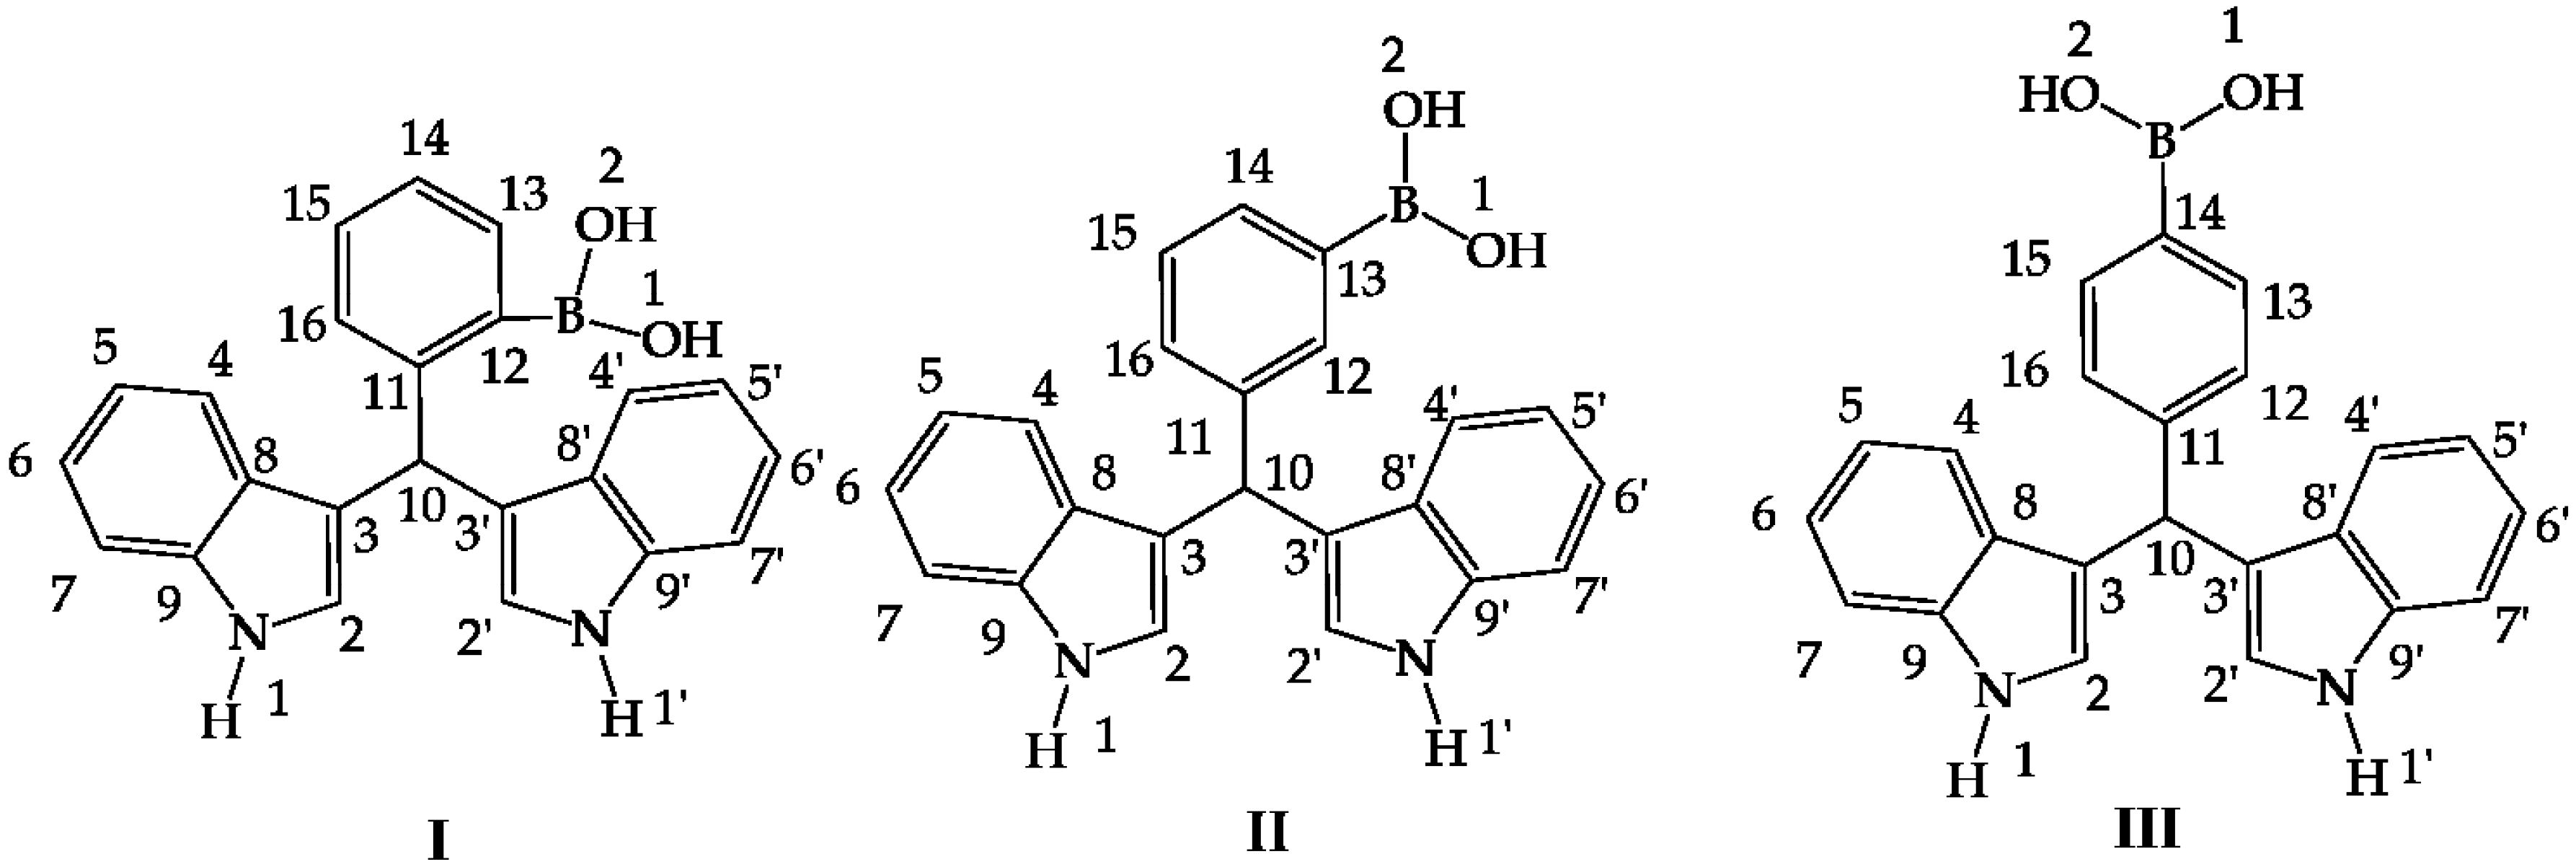
Figure 1.
Hybrid diindolylmethane phenylboronic acid regioisomers: ortho (I), meta (II) and para (III).
Figure 1.
Hybrid diindolylmethane phenylboronic acid regioisomers: ortho (I), meta (II) and para (III).
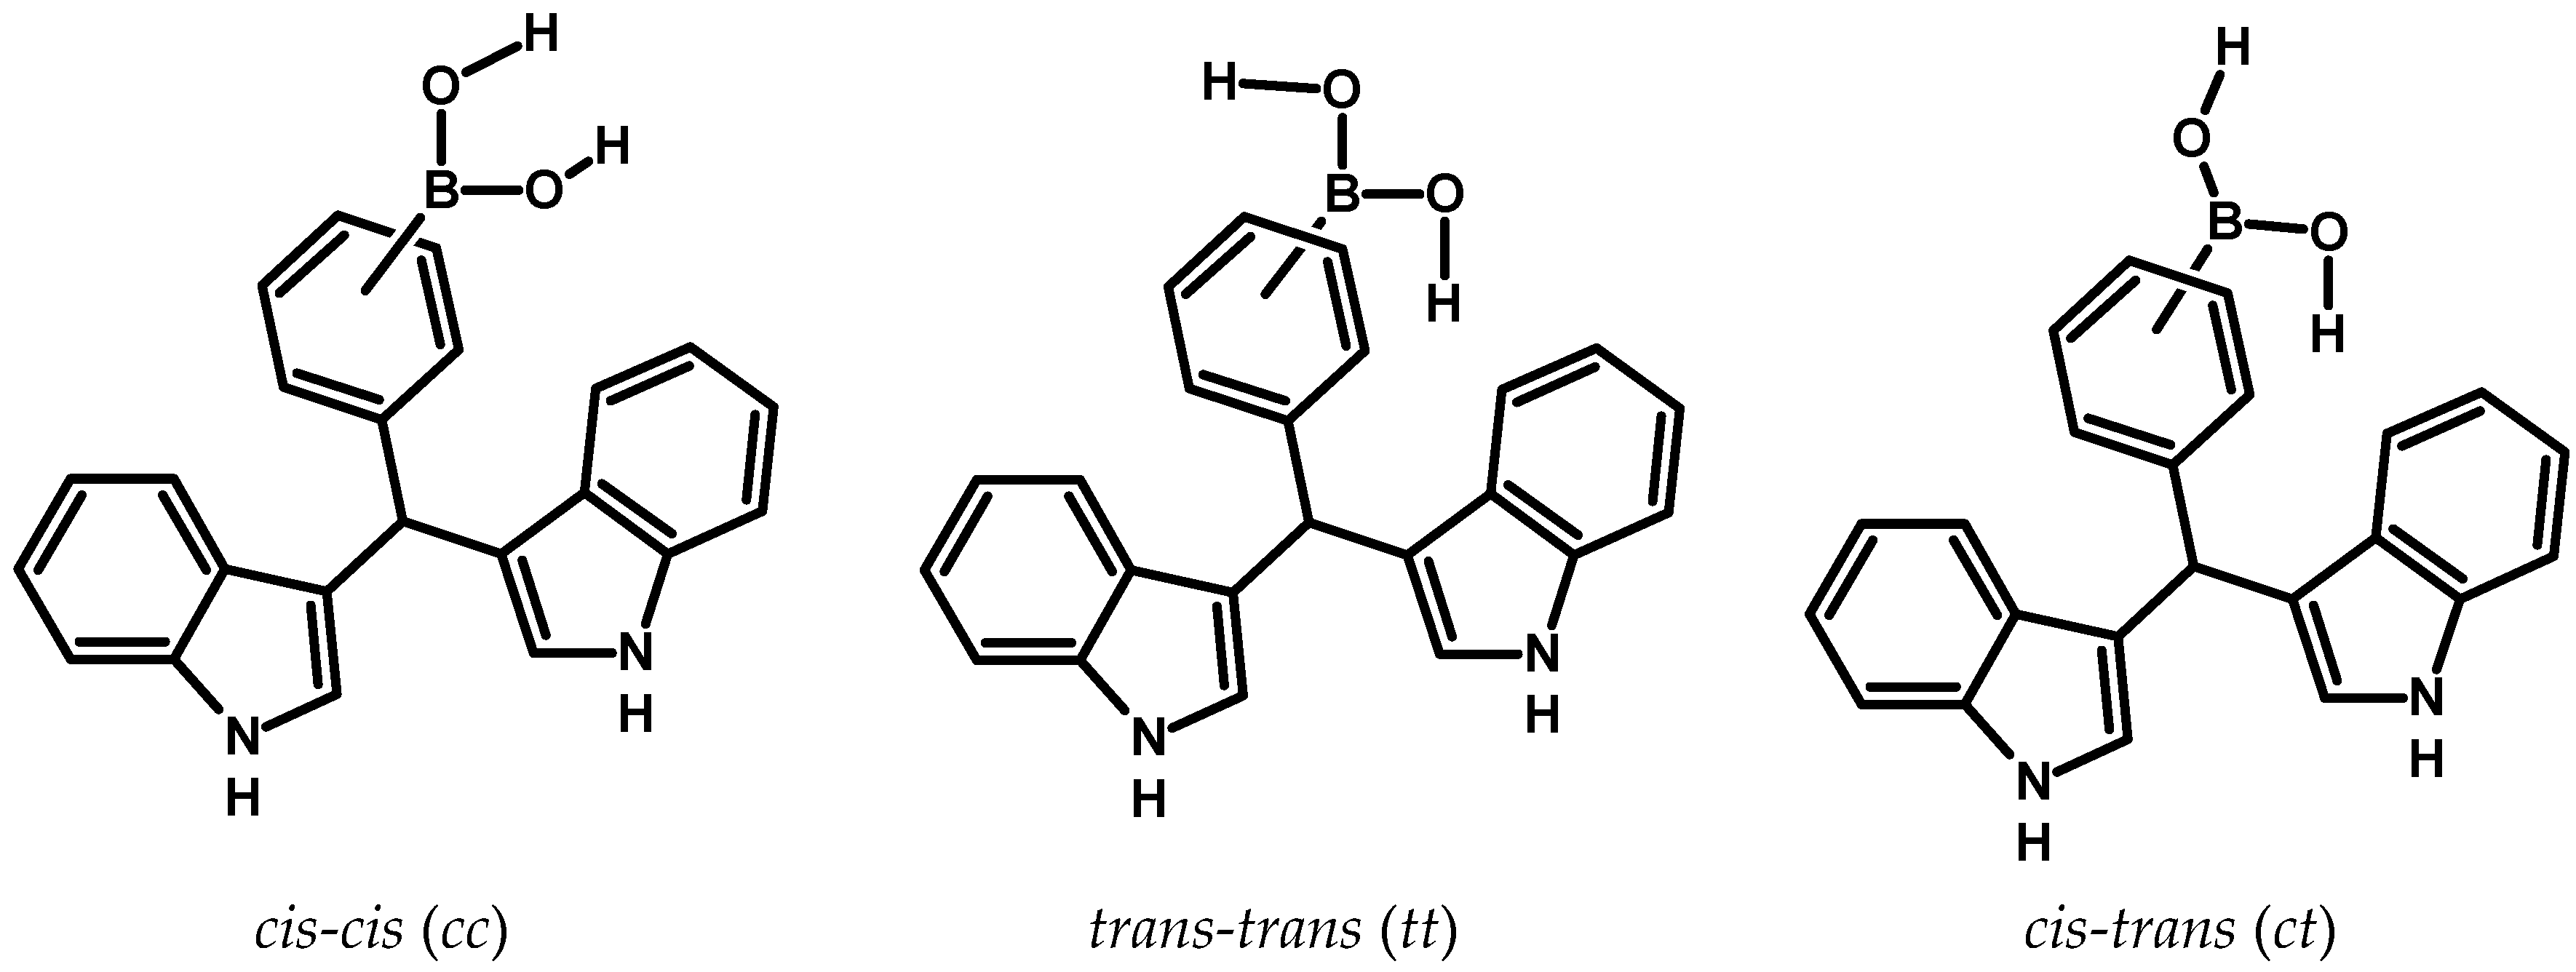
Figure 2.
There is the possibility of forming three possible conformers, this depends on the location of the hydrogen atoms that are bonded to the oxygen atoms of the –B(OH)2 group.
Figure 2.
There is the possibility of forming three possible conformers, this depends on the location of the hydrogen atoms that are bonded to the oxygen atoms of the –B(OH)2 group.
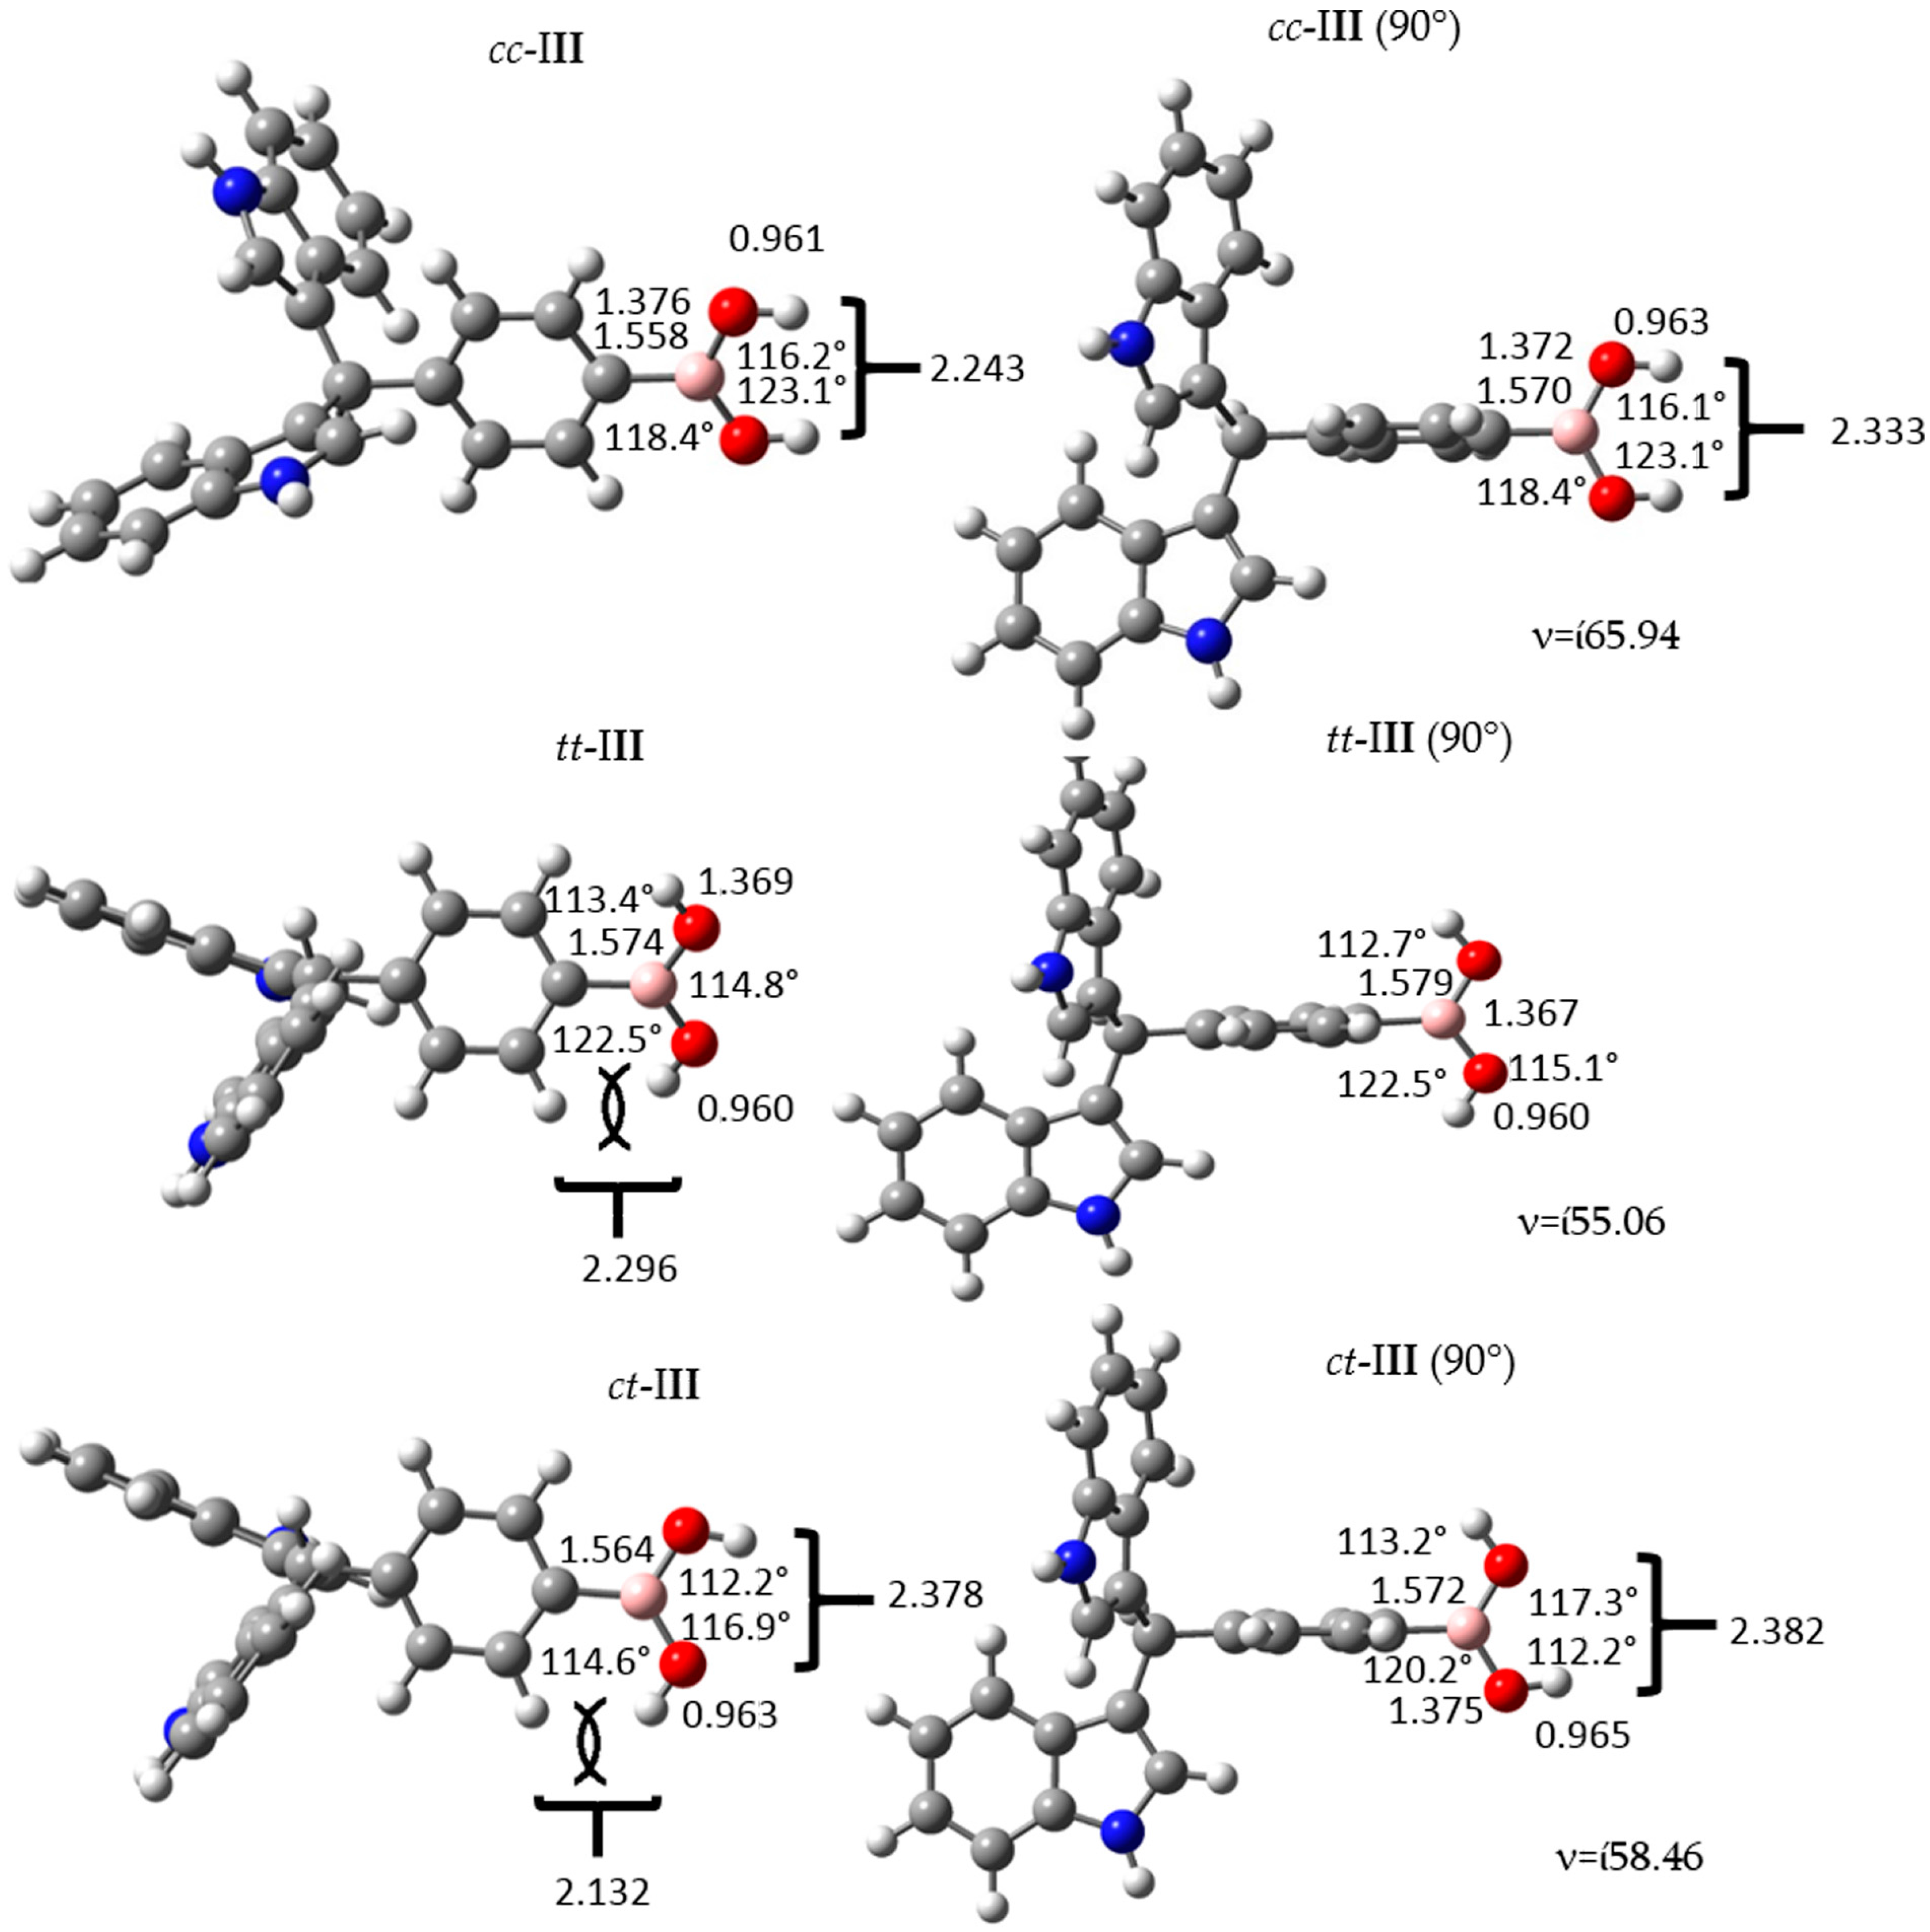
Figure 3.
Structure and geometrical parameters of the p-diindolylmethane phenylboronic acid hybrid isomers and their corresponding 90° conformers. The gray, blue, pink, red and white spheres are for carbon, nitrogen, boron, oxygen and hydrogen atoms respectively.
Figure 3.
Structure and geometrical parameters of the p-diindolylmethane phenylboronic acid hybrid isomers and their corresponding 90° conformers. The gray, blue, pink, red and white spheres are for carbon, nitrogen, boron, oxygen and hydrogen atoms respectively.
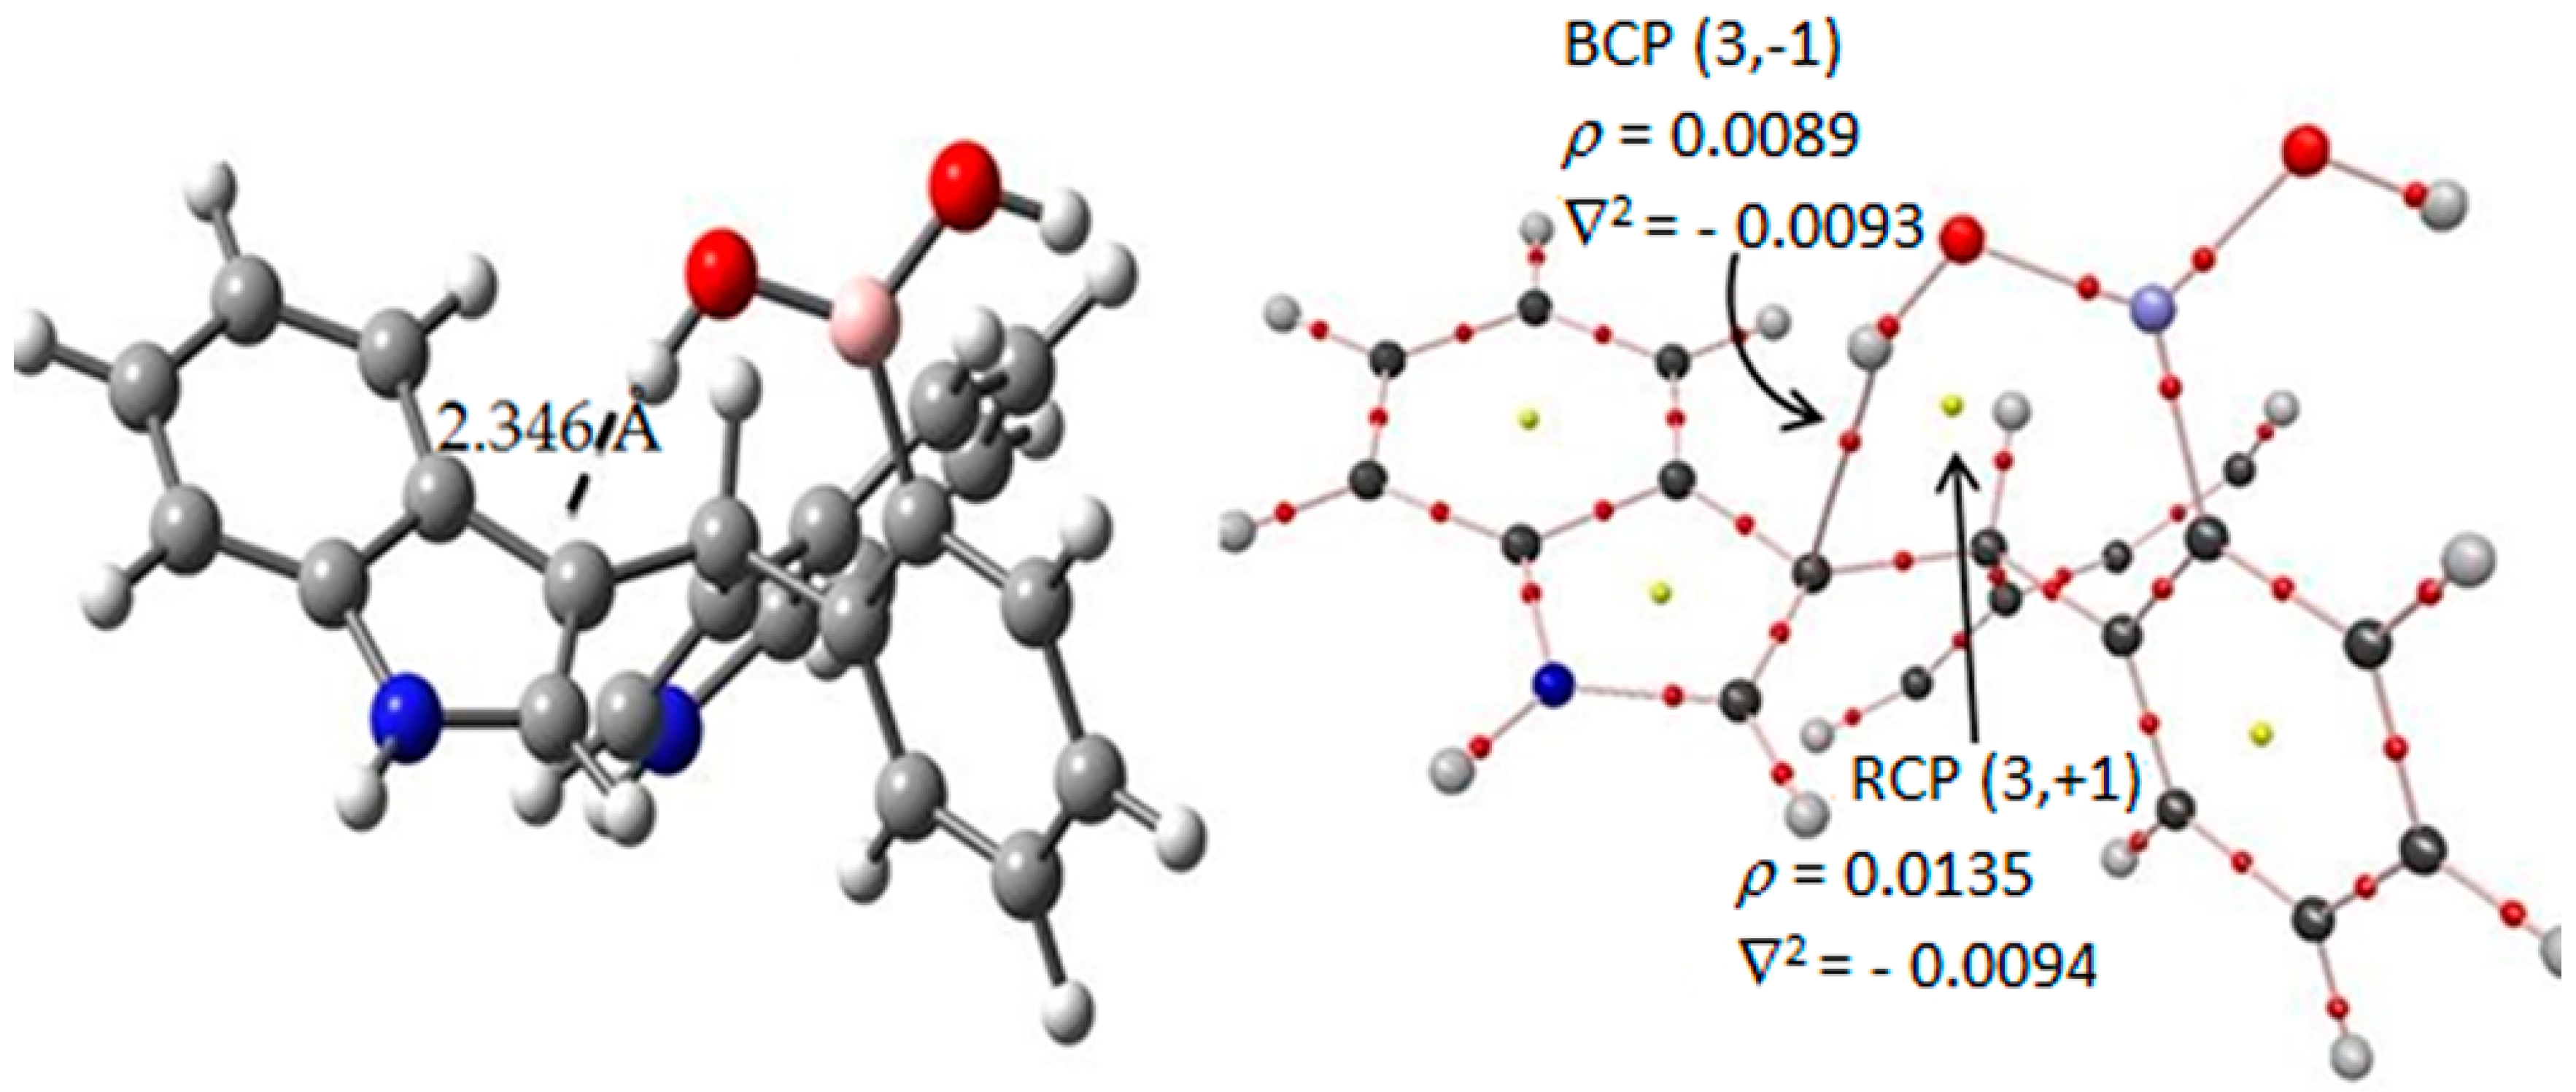
Figure 4.
AIM results of the hydrogen–C3′ interaction in the tt-I diindolylmethane-phenylboronic acid hybrid. Molecular graphs for tt-ortho-regioisomer interaction. Density ρ(r) and its Laplacian ∇2ρ(r) at the BCPs characterizing the HB interactions. The gray, blue, pink, red and white spheres are for carbon, nitrogen, boron, oxygen and hydrogen atoms respectively.
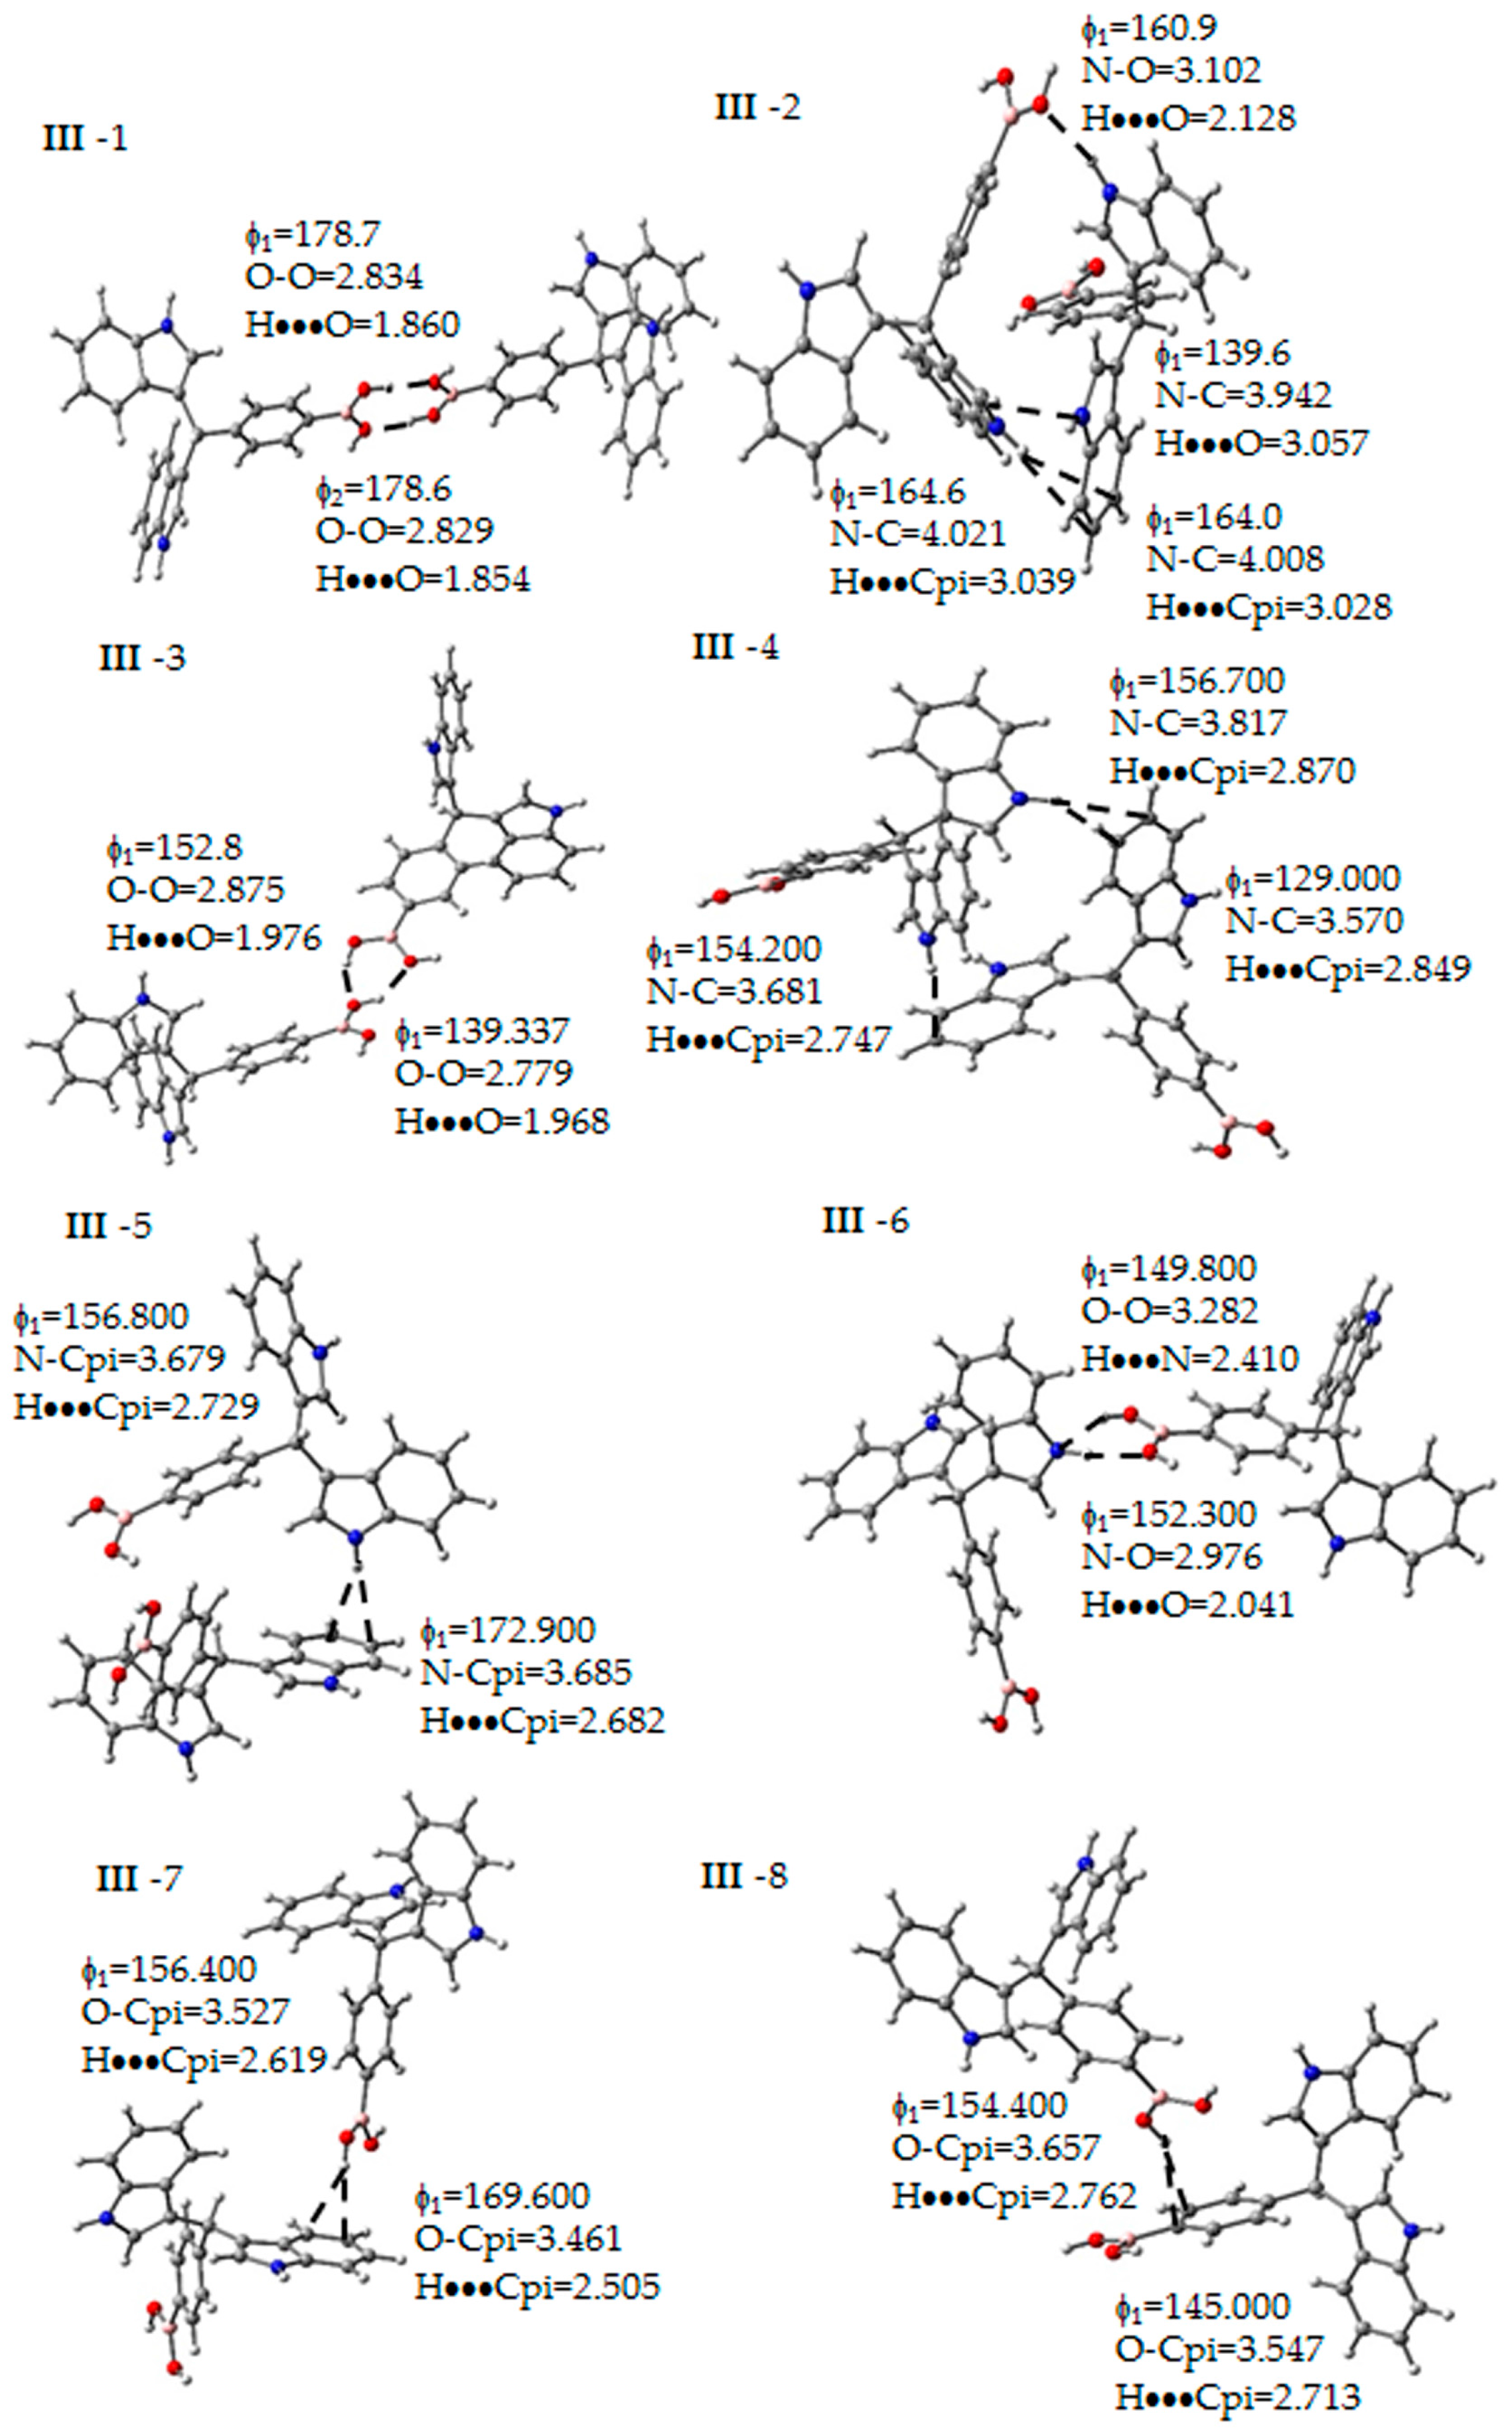
Figure 5.
Non-covalent interactions determined between the molecules of III. Some geometrical parameters as bond length and angle are next to the bond. The gray, blue, pink, red and white spheres are for carbon, nitrogen, boron, oxygen and hydrogen atoms respectively.
Figure 5.
Non-covalent interactions determined between the molecules of III. Some geometrical parameters as bond length and angle are next to the bond. The gray, blue, pink, red and white spheres are for carbon, nitrogen, boron, oxygen and hydrogen atoms respectively.
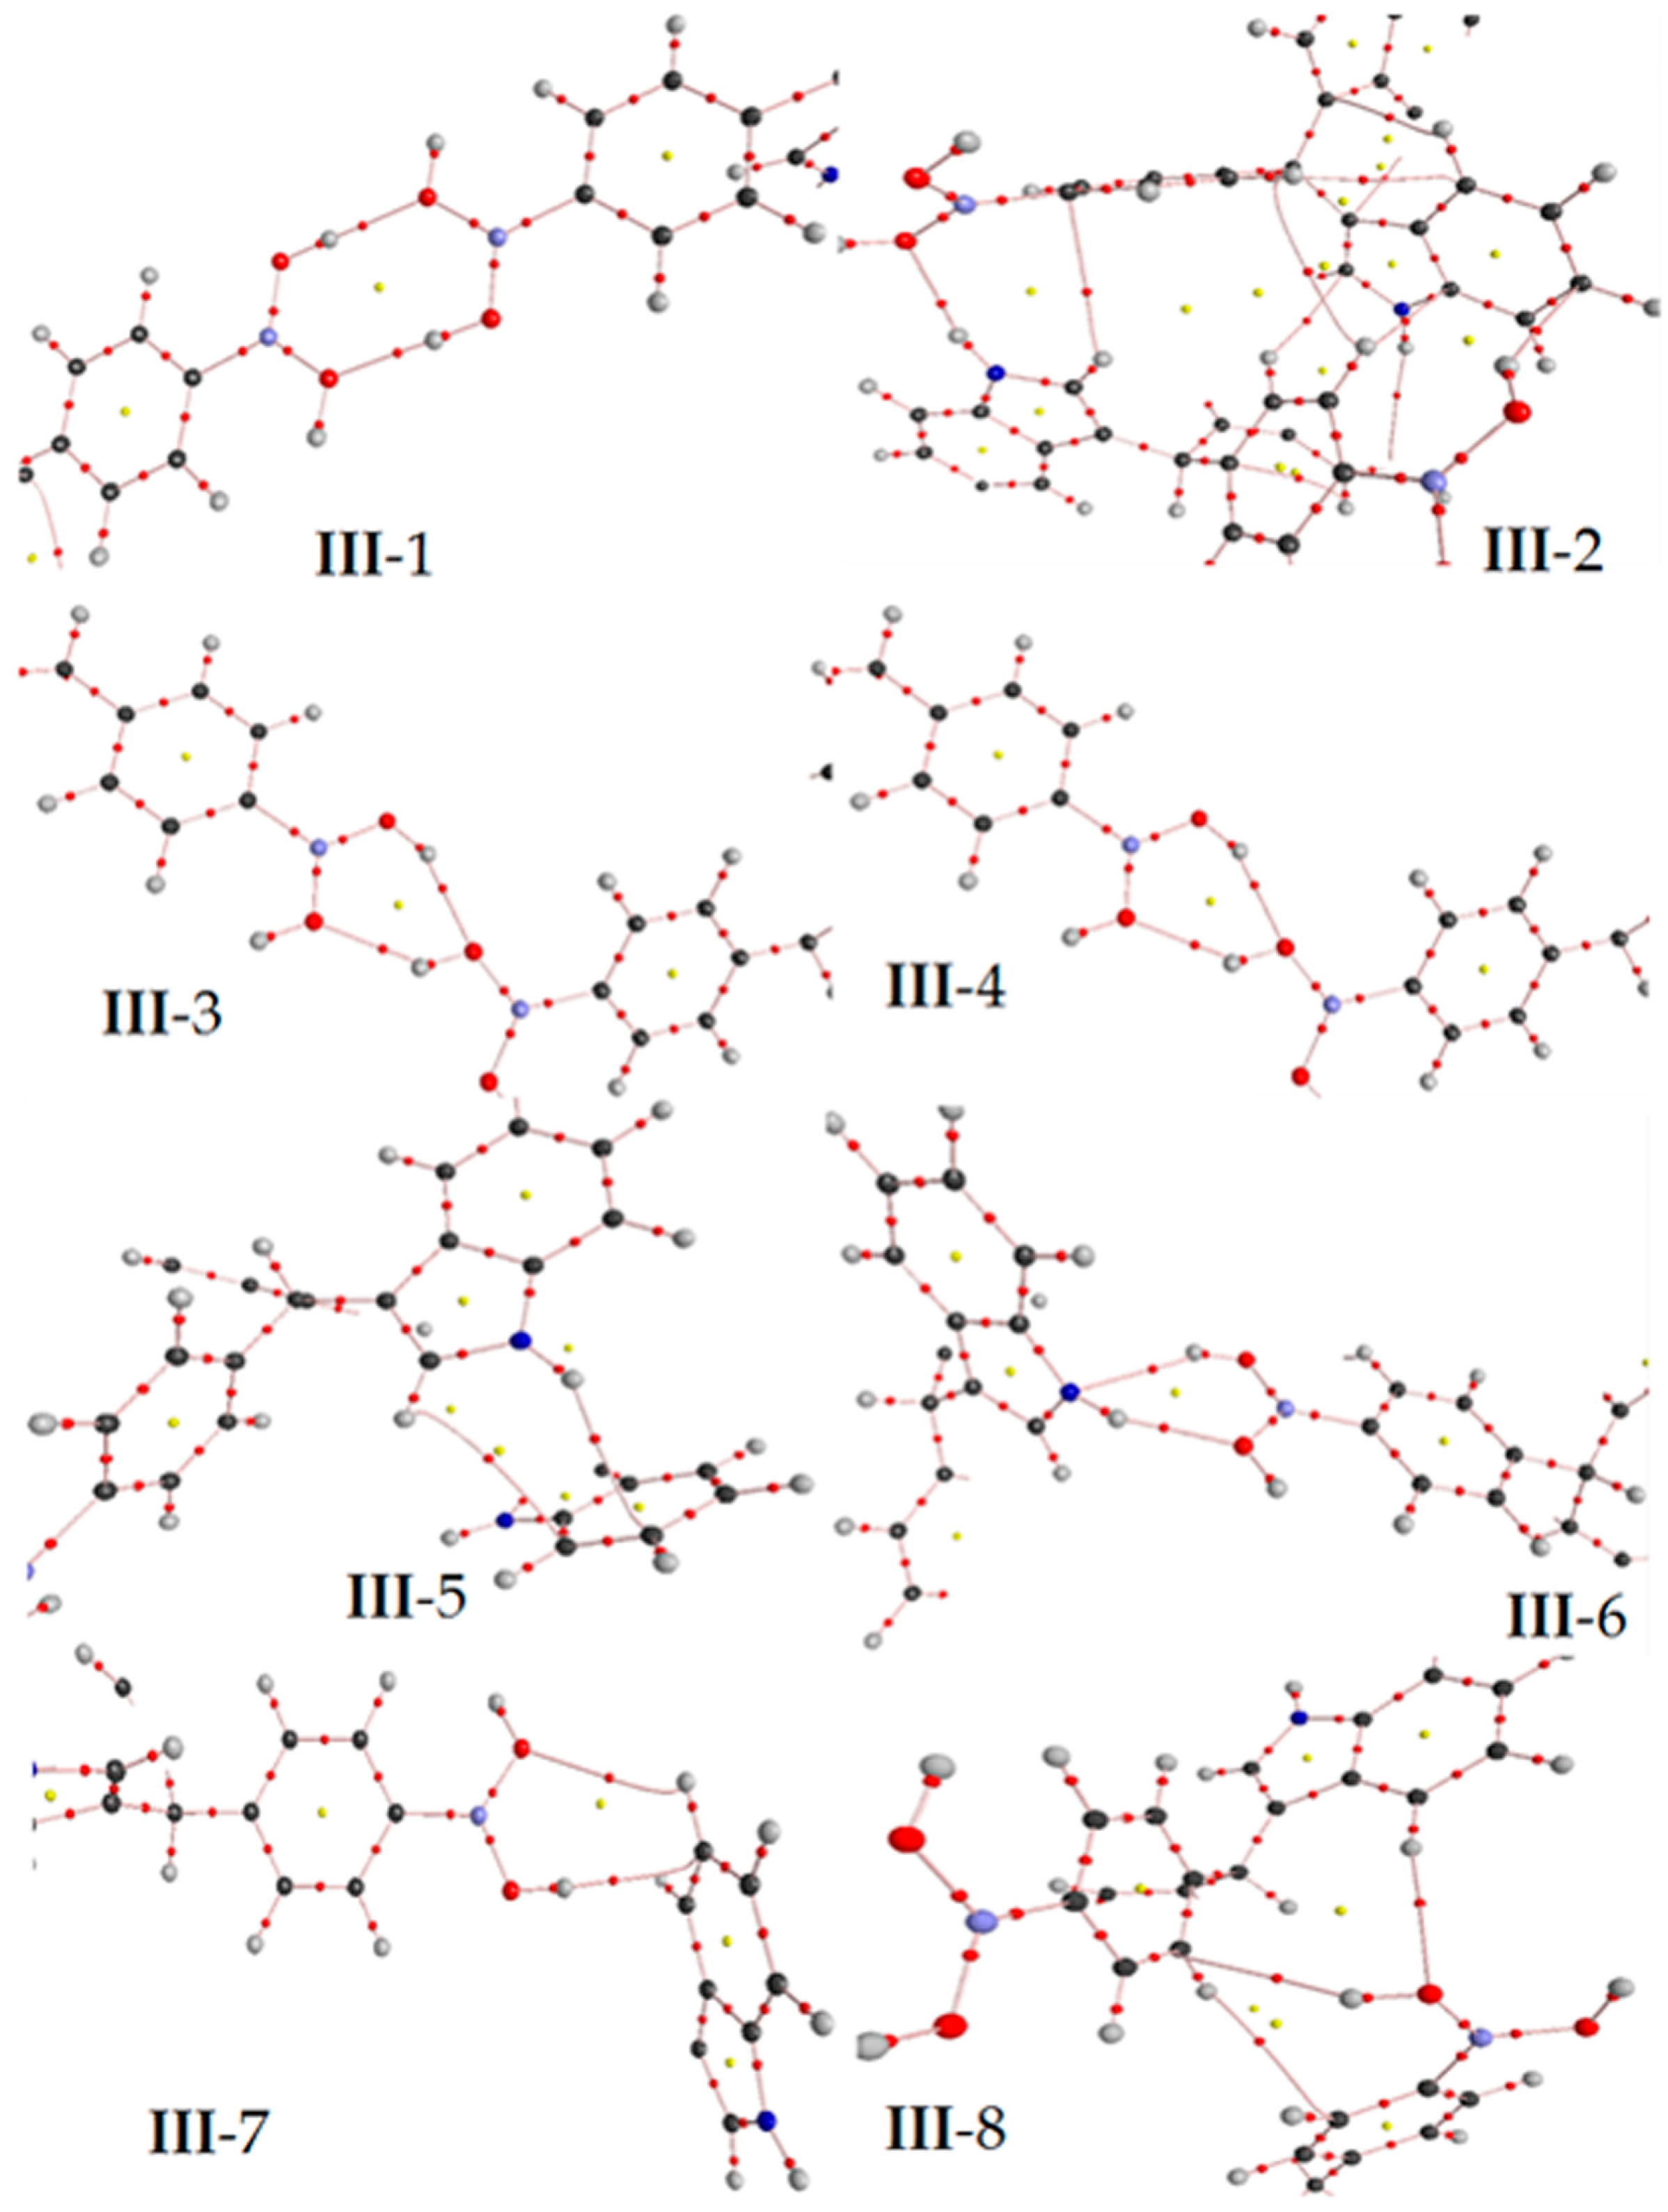
Figure 6.
In the target molecule (ct-III) the bond critical points (3,−1) is marked in red small points and ring critical points (3,+1) are presented as yellow points. The gray, blue, pink, red and white spheres are for carbon, nitrogen, boron, oxygen and hydrogen atoms respectively.
Figure 6.
In the target molecule (ct-III) the bond critical points (3,−1) is marked in red small points and ring critical points (3,+1) are presented as yellow points. The gray, blue, pink, red and white spheres are for carbon, nitrogen, boron, oxygen and hydrogen atoms respectively.
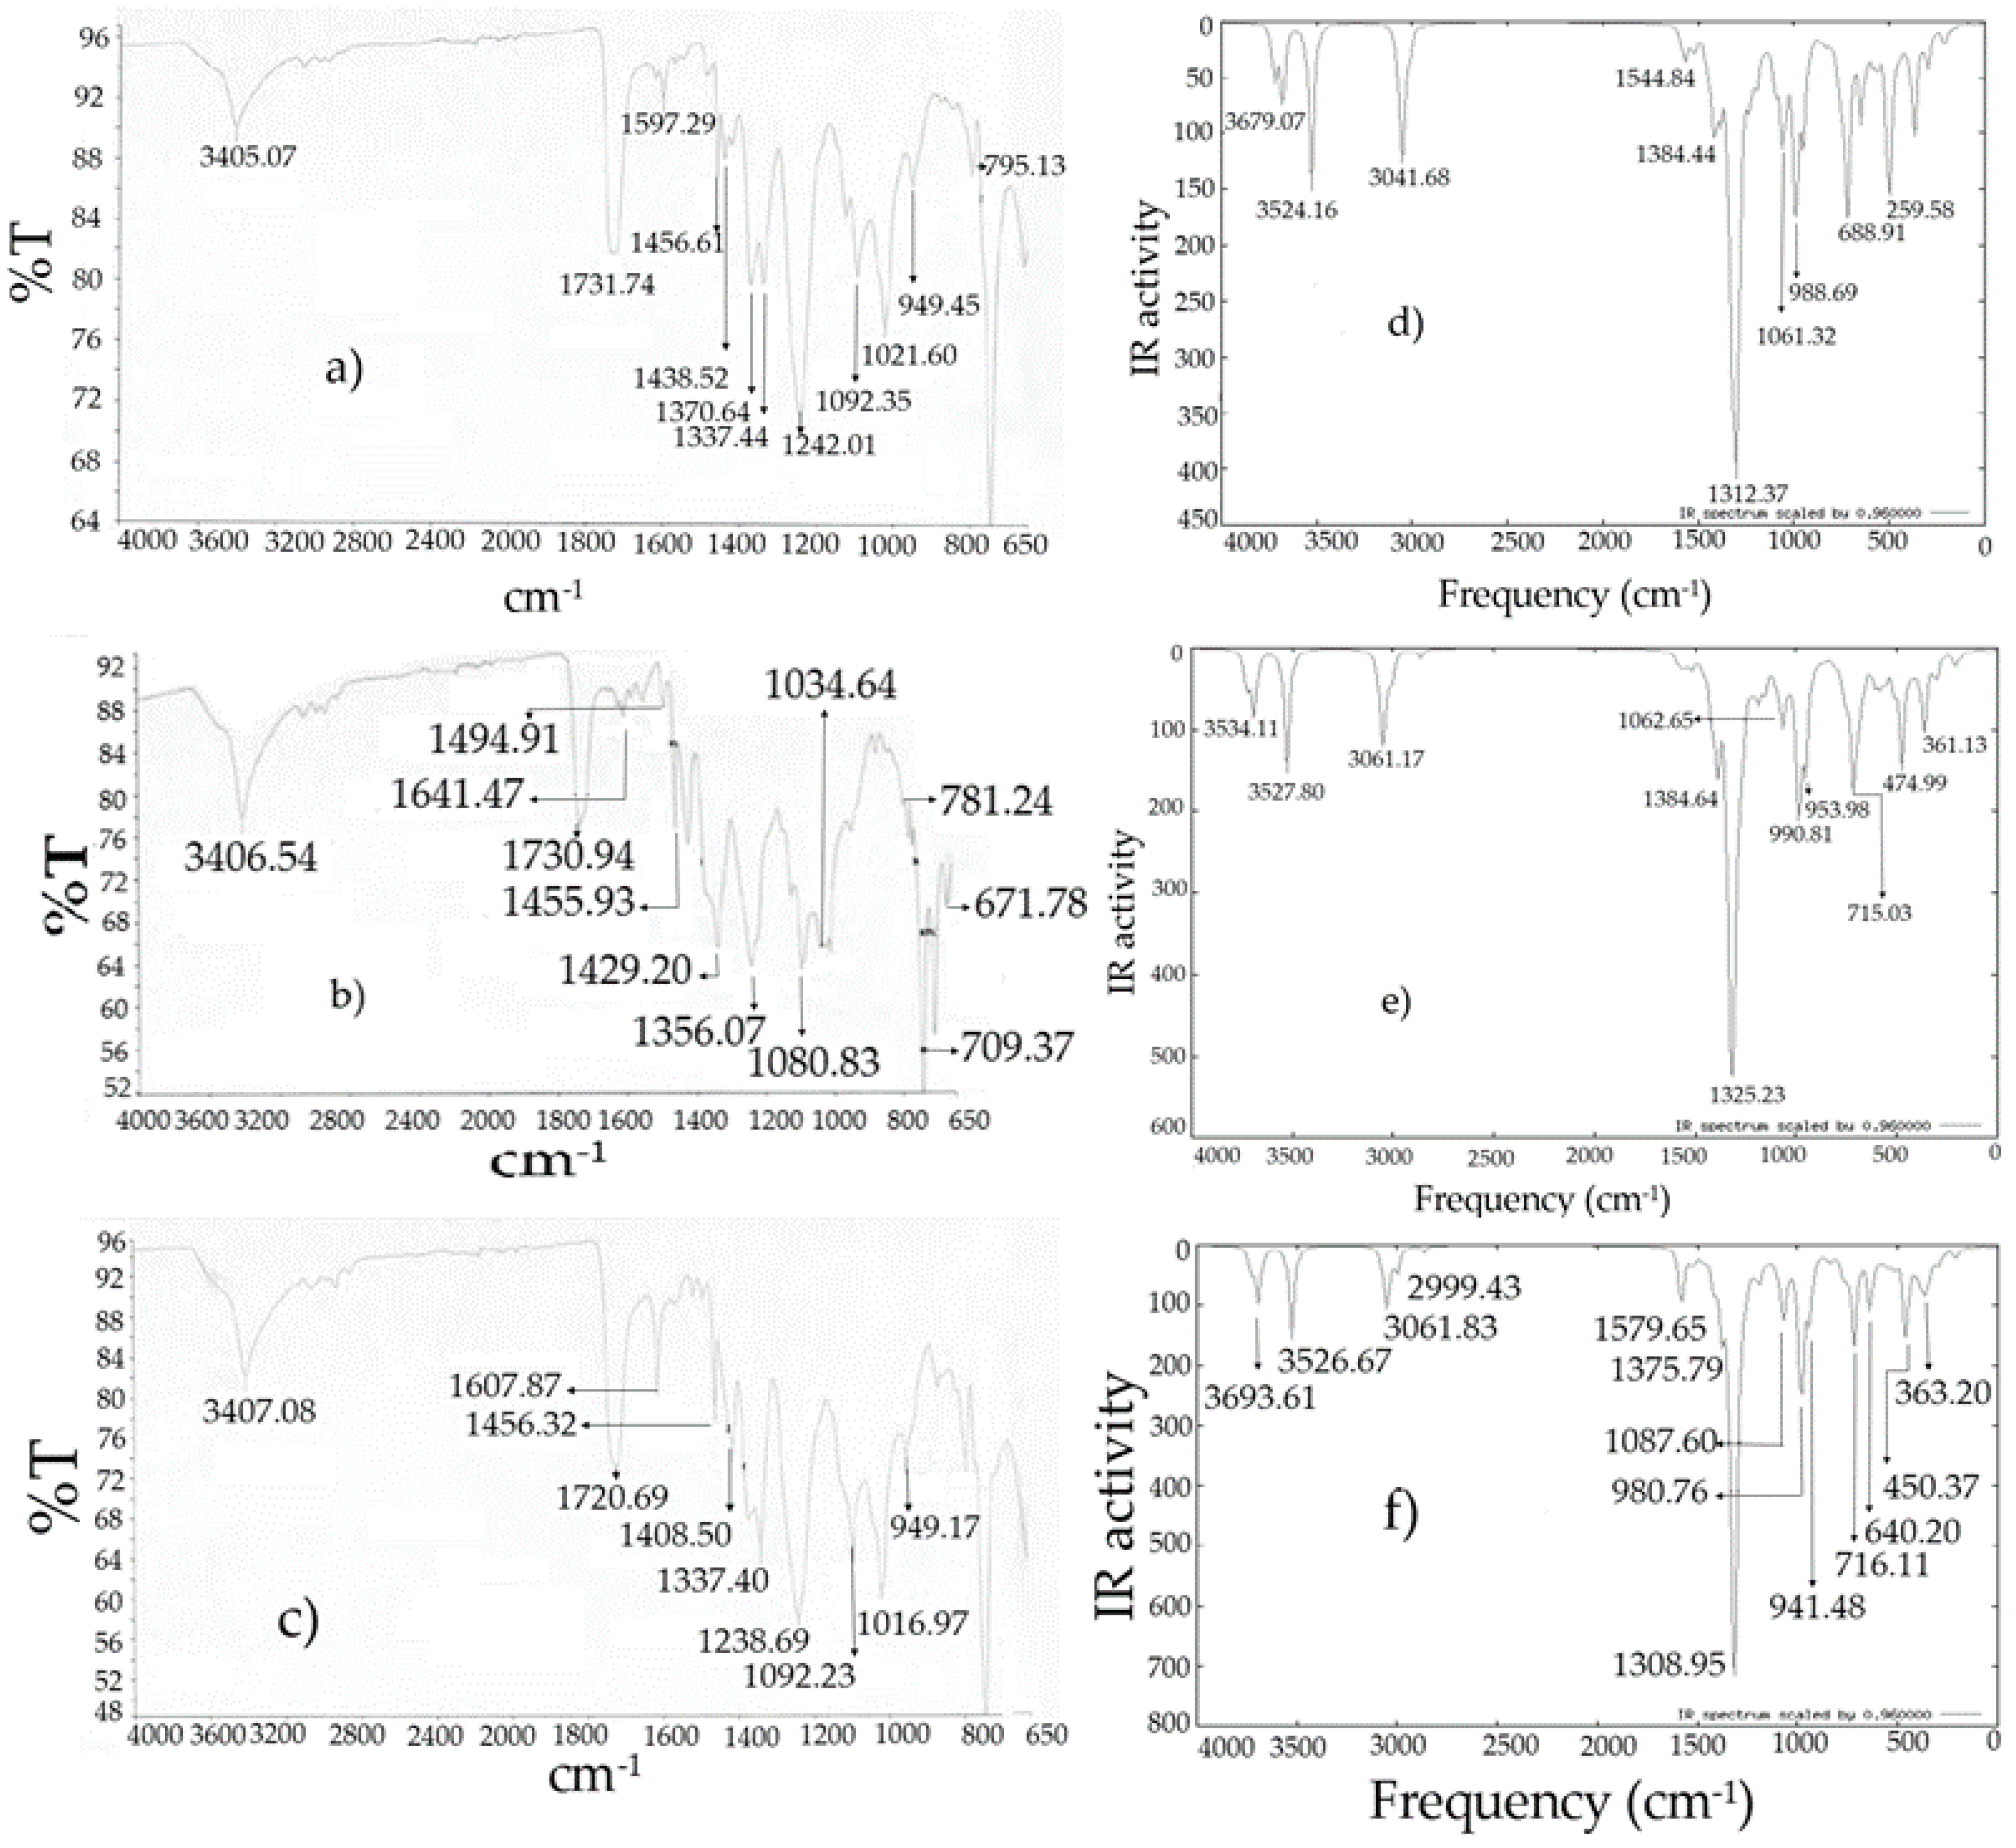
Figure 7.
Infrared spectra: (
a)
I experimental [
10]; (
b)
II experimental [
10]; (
c)
III experimental [
10]; (
d)
I theoretical; (
e)
II theoretical; (
f)
III theoretical.
Figure 7.
Infrared spectra: (
a)
I experimental [
10]; (
b)
II experimental [
10]; (
c)
III experimental [
10]; (
d)
I theoretical; (
e)
II theoretical; (
f)
III theoretical.
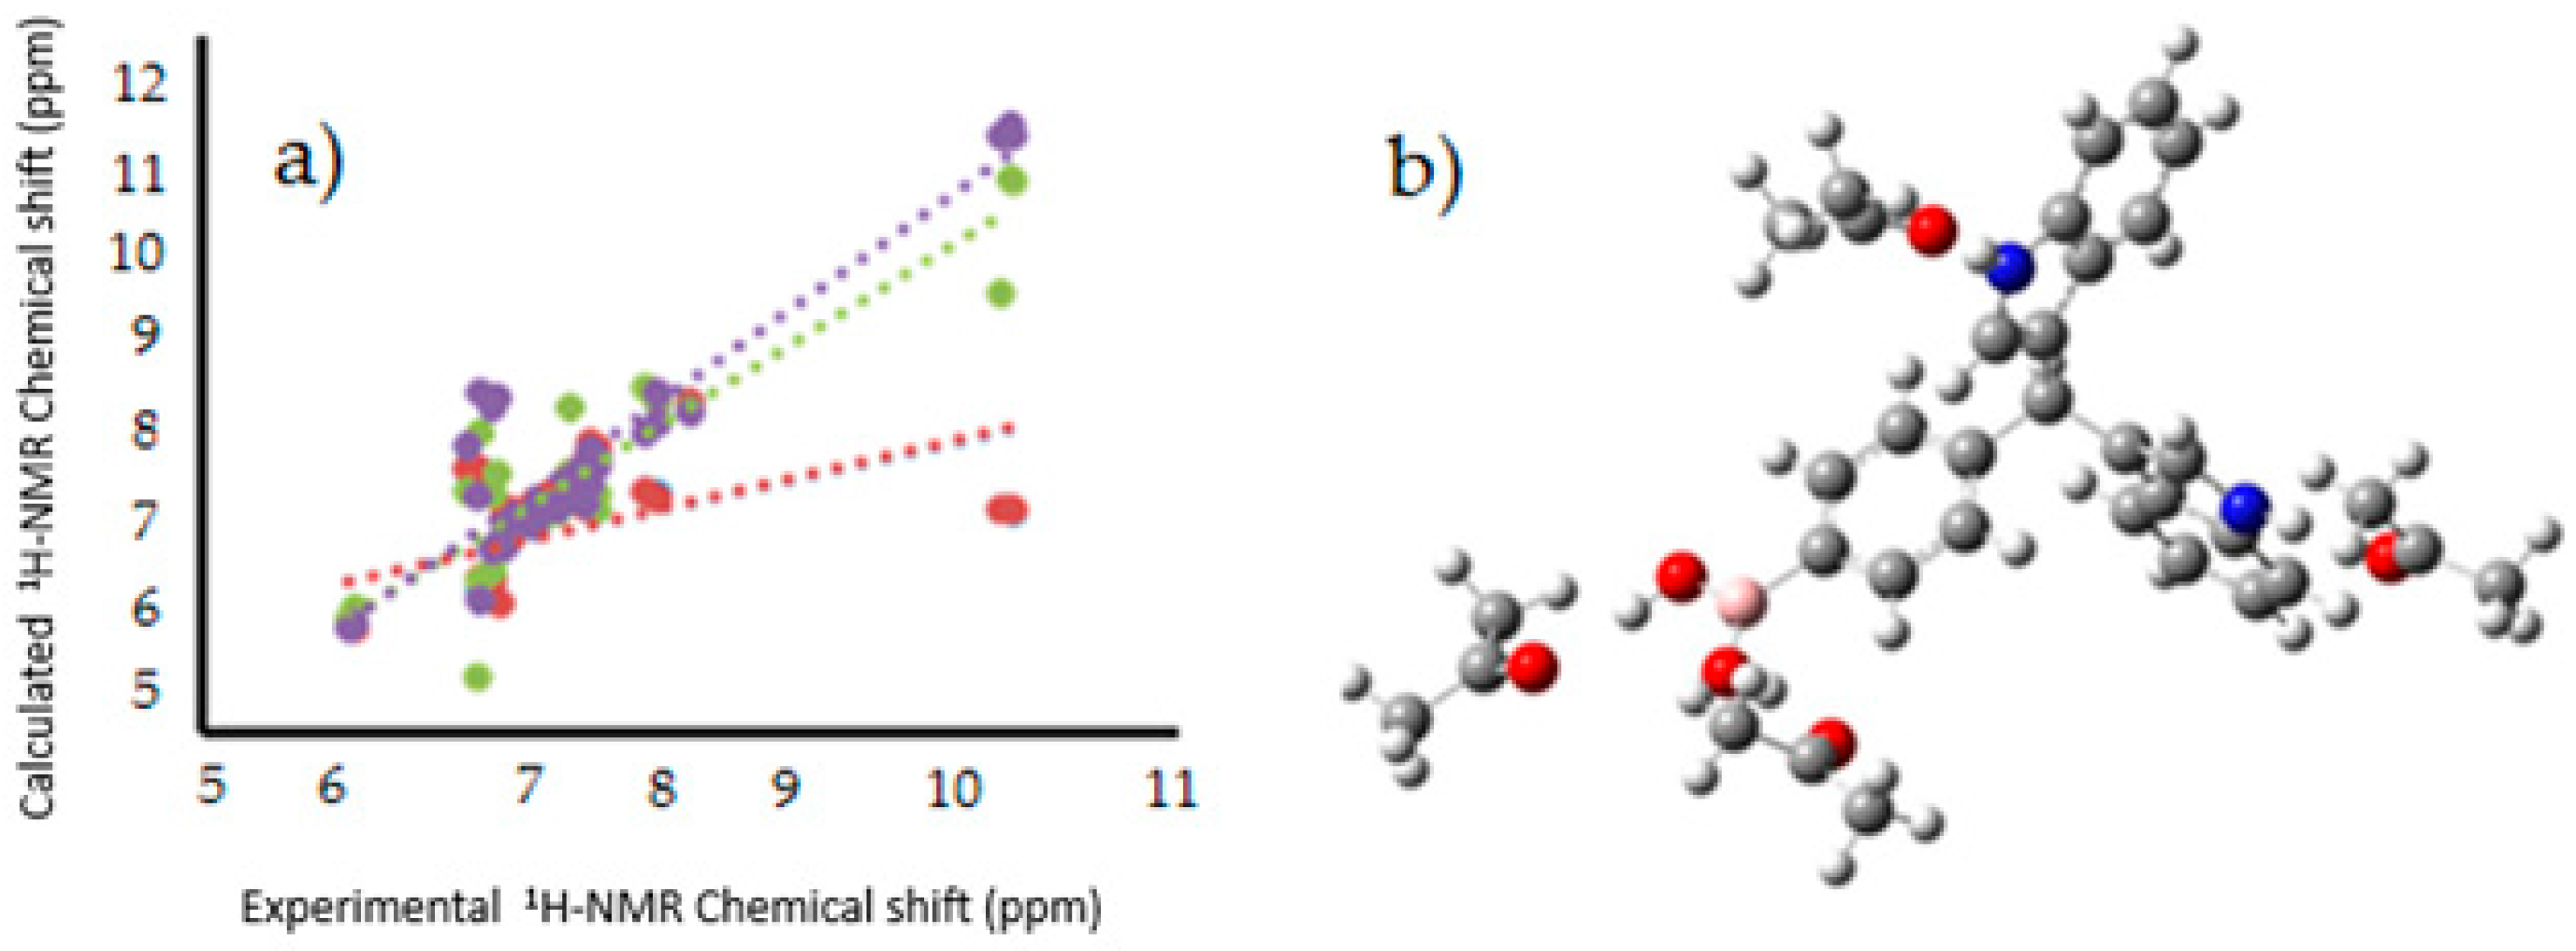
Figure 8.
(
a) Linear regression between experimental [
12],and calculated
1H-NMR chemical shifts for the target molecules in PCM (Red), explicit interaction (Green), PCM and explicit interaction (purple); (
b) Model of explicit interaction for
III with four acetone molecules. The gray, blue, pink, red and white spheres are for carbon, nitrogen, boron, oxygen and hydrogen atoms respectively.
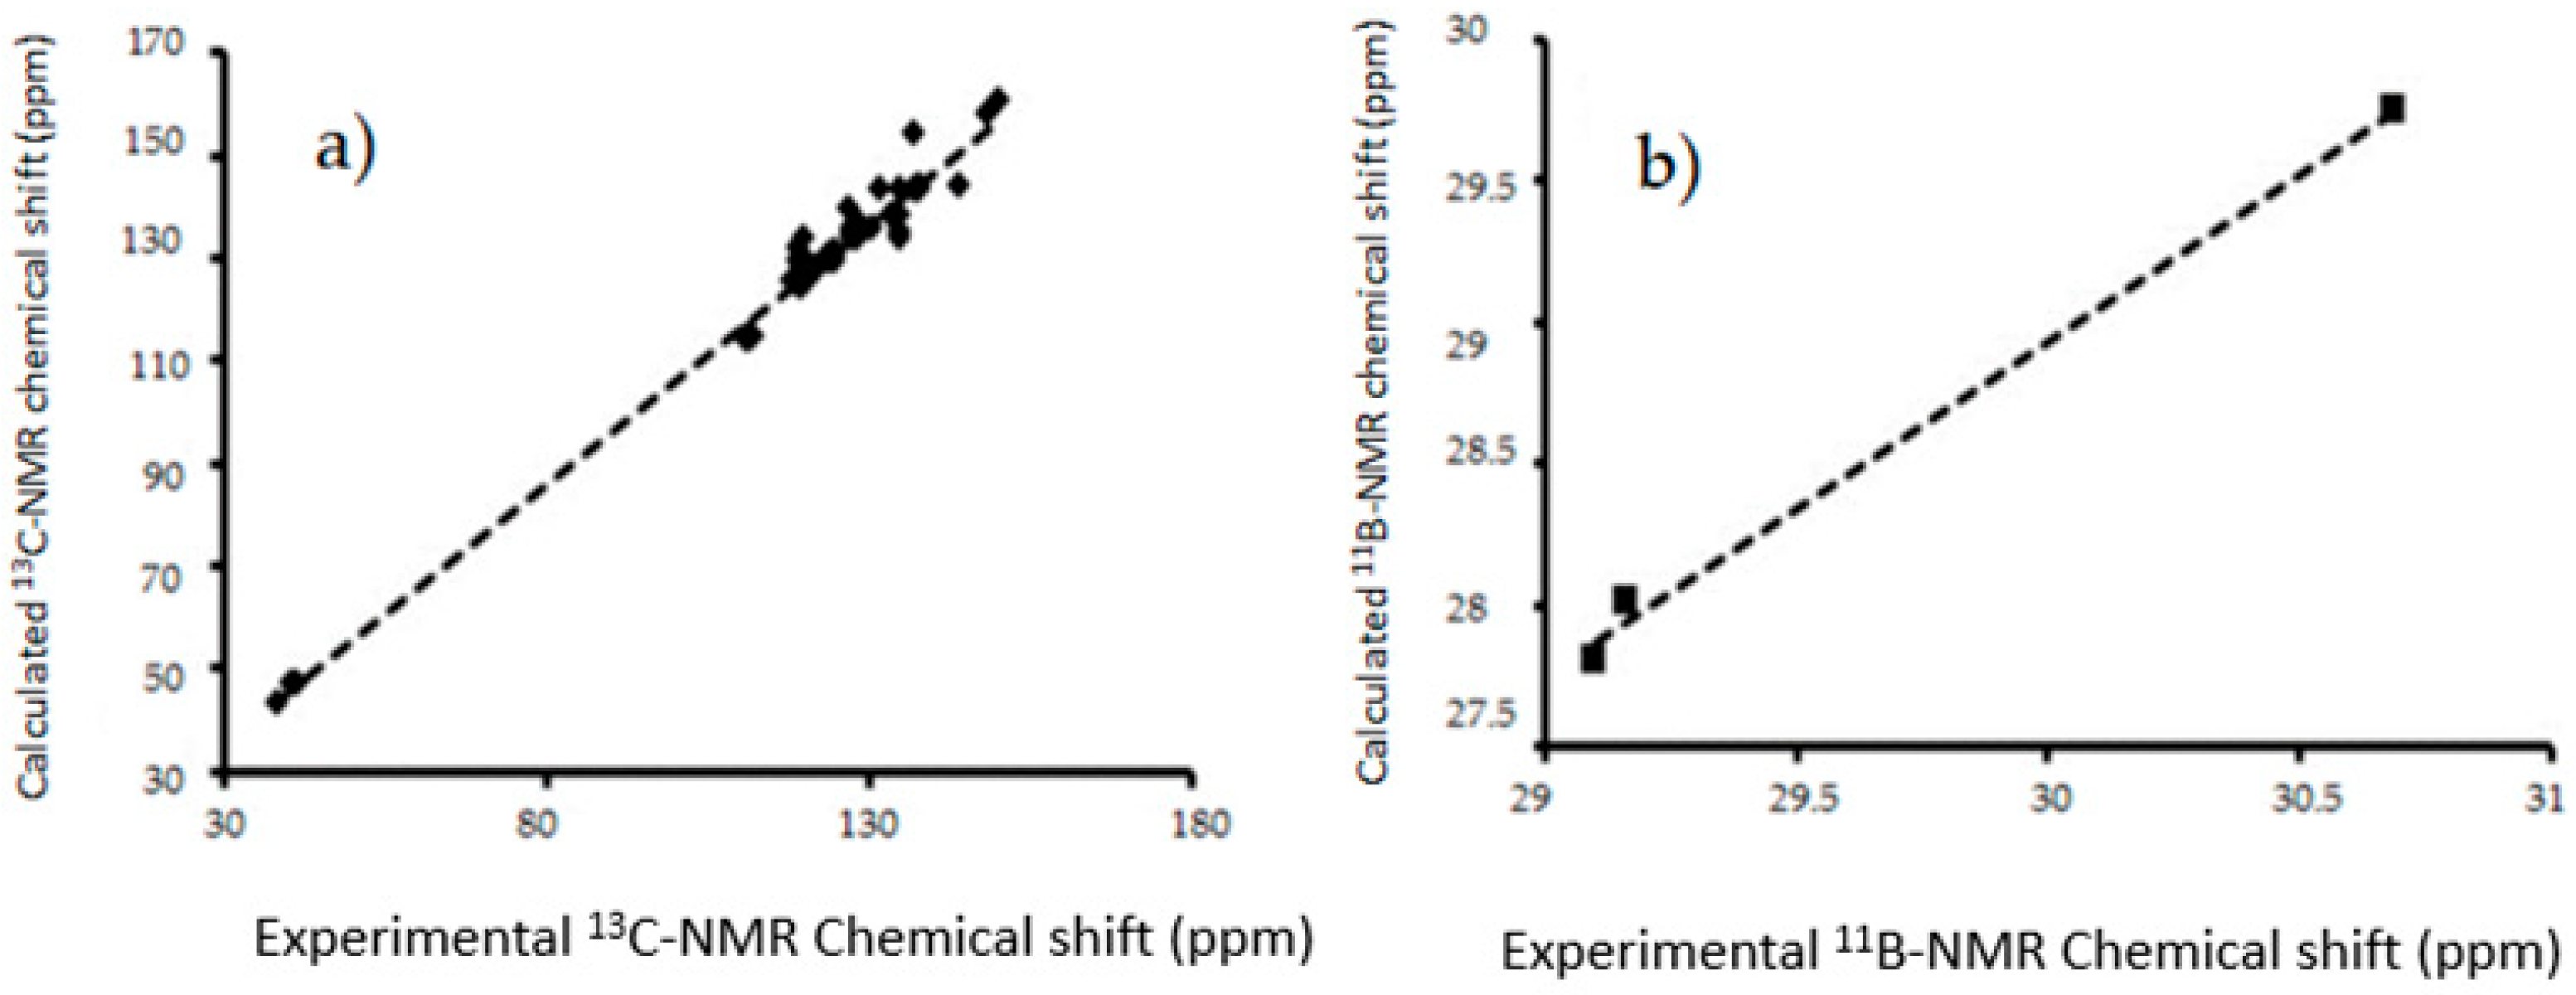
Figure 9.
The linear regressions between experimental and B3LYP/6-311++G(d,p) calculated (a) 13C-NMR chemical shifts for in gas phase (b) 11B-NMR chemical shifts in gas phase I–III.
Figure 9.
The linear regressions between experimental and B3LYP/6-311++G(d,p) calculated (a) 13C-NMR chemical shifts for in gas phase (b) 11B-NMR chemical shifts in gas phase I–III.
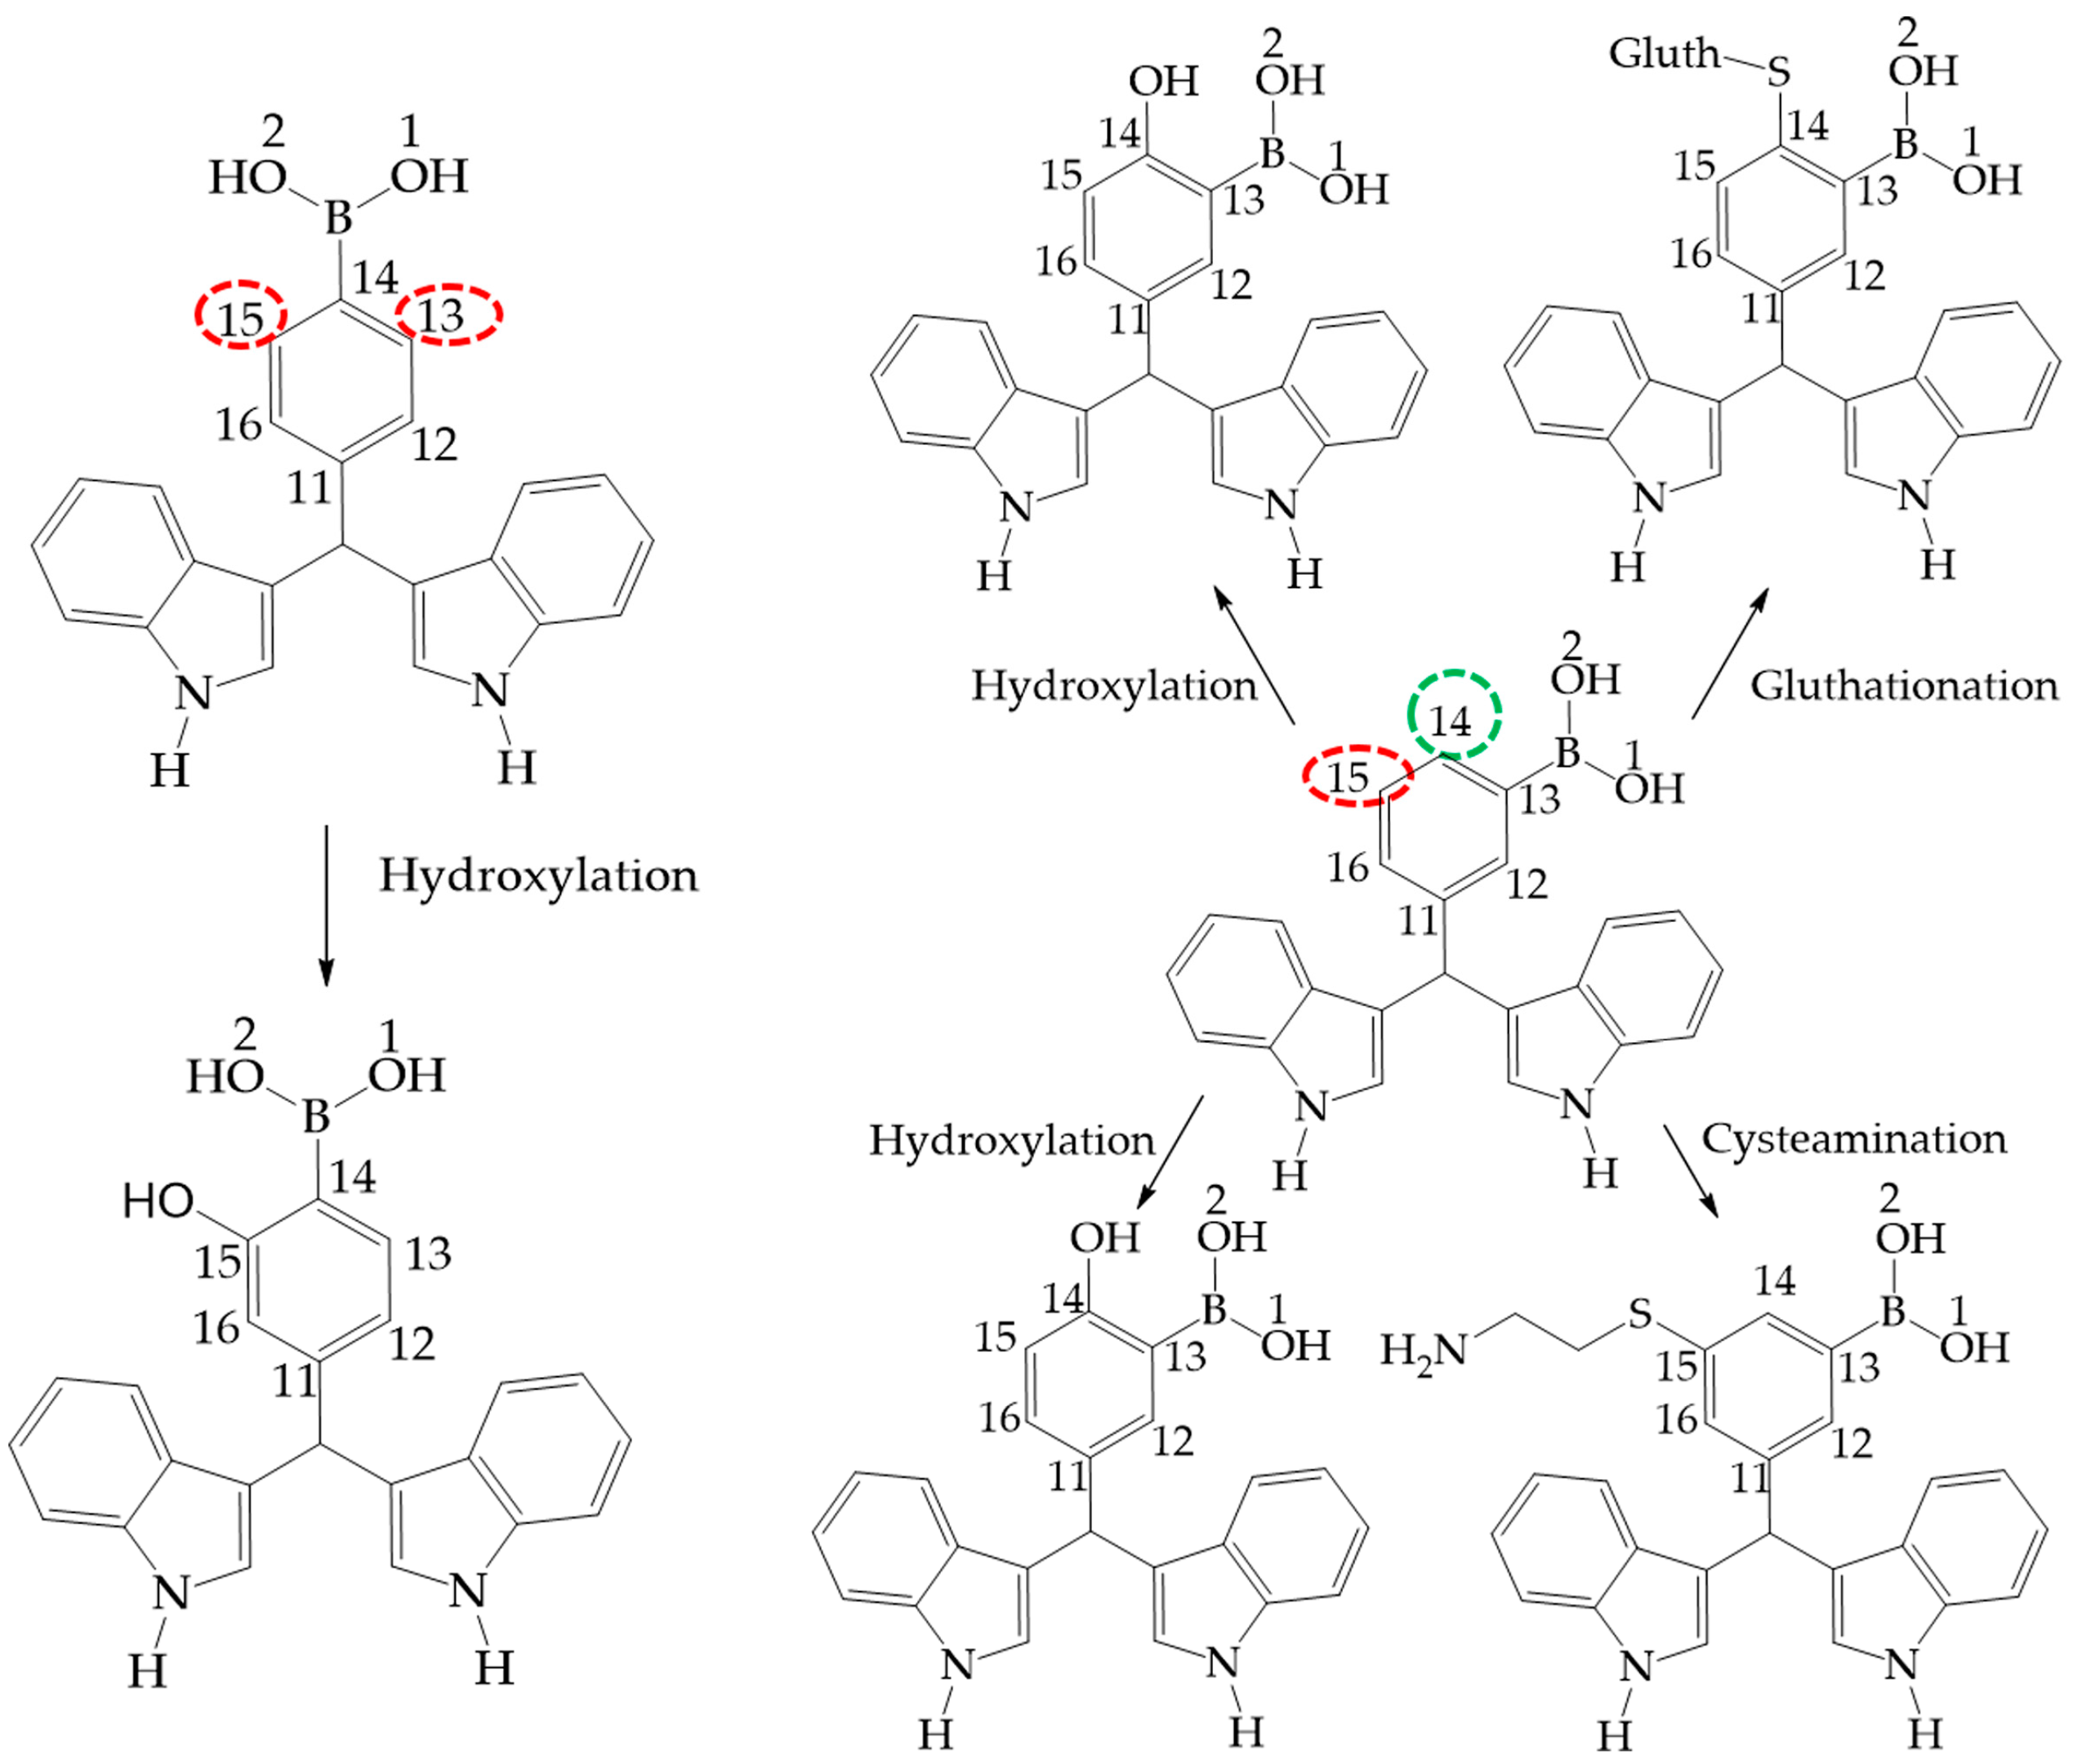
Figure 10.
Phase 1 metabolic pathways of III and II. The red color indicates high values of NOR, from 0.66 to 1. The green color indicates a NOR value range of 0.15 to 0.33.
Figure 10.
Phase 1 metabolic pathways of III and II. The red color indicates high values of NOR, from 0.66 to 1. The green color indicates a NOR value range of 0.15 to 0.33.
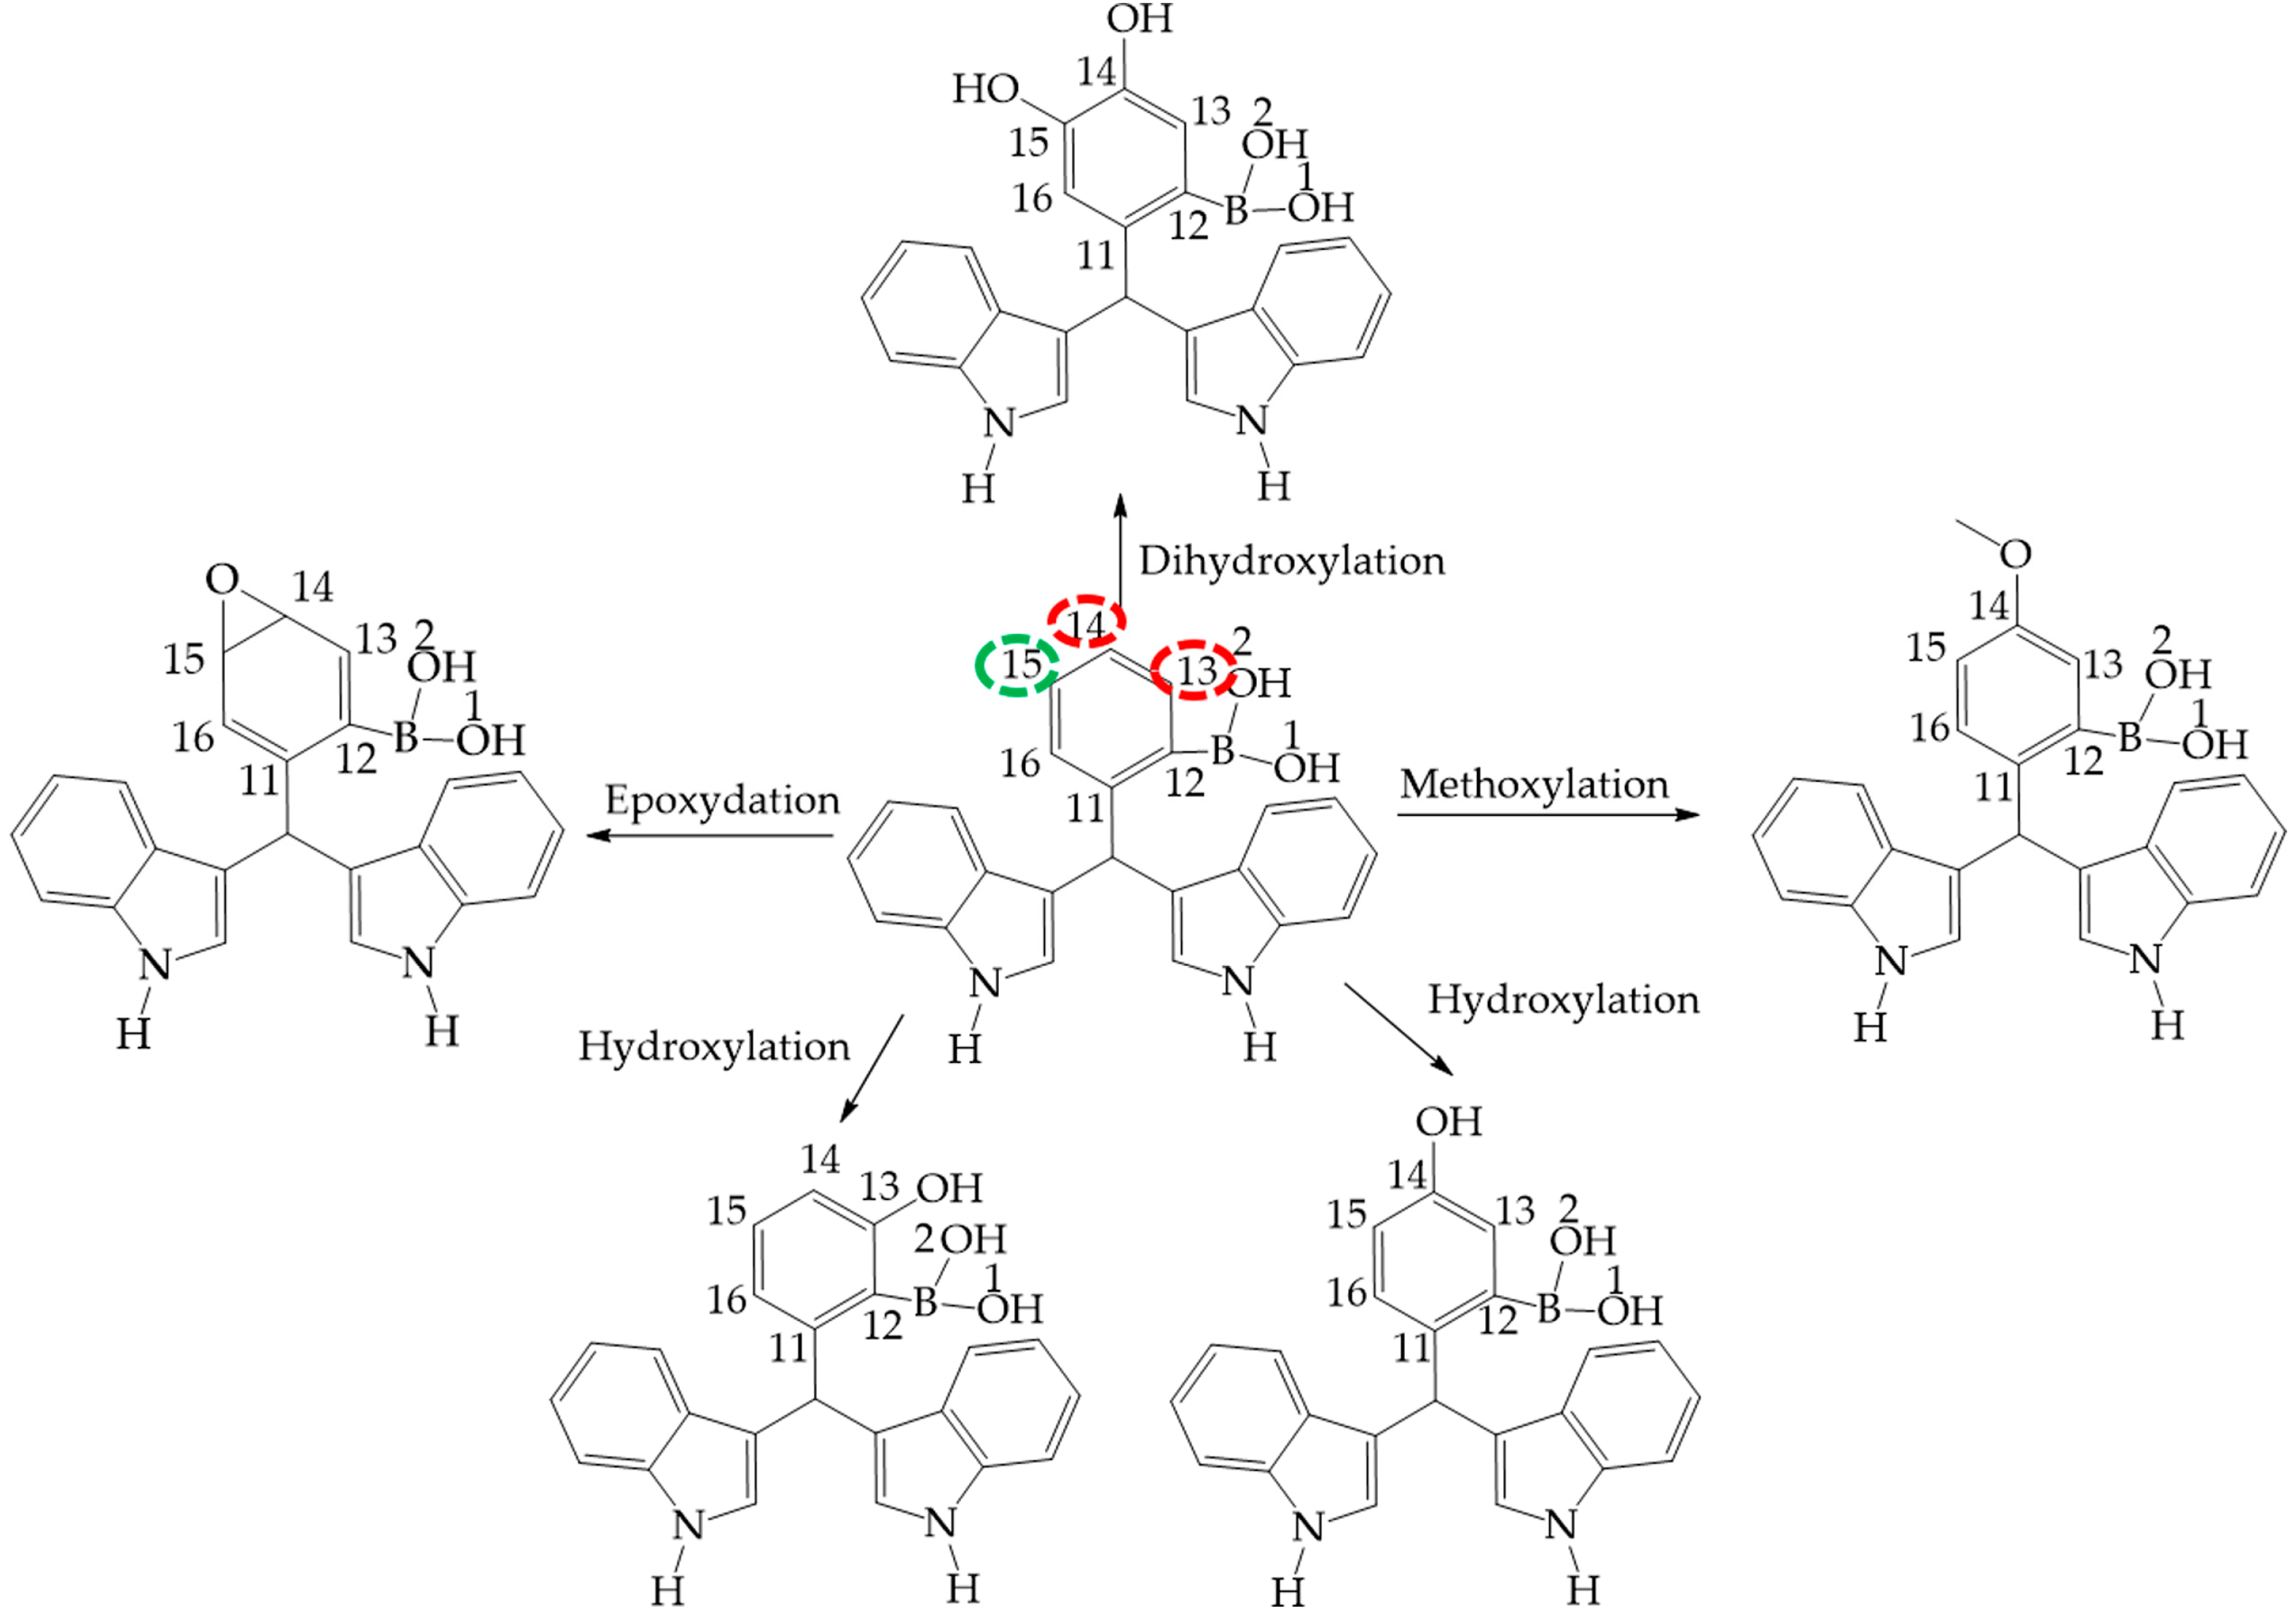
Figure 11.
Phase 1 metabolic pathway of I. The red color indicates high values of NOR, from 0.66 to 1. The green color indicates a NOR value range of 0.15 to 0.33.
Figure 11.
Phase 1 metabolic pathway of I. The red color indicates high values of NOR, from 0.66 to 1. The green color indicates a NOR value range of 0.15 to 0.33.
Table 1.
Conformational energy values for I–III.
Table 1.
Conformational energy values for I–III.
| Conformer | Isomers |
|---|
| I | II | III |
|---|
| Energy (Hartrees) | ΔE (kcal/mol) | Energy (Hartrees) | ΔE (kcal/mol) | Energy (Hartrees) | ΔE (kcal/mol) |
|---|
| cis–trans (ct) | −1173.13344187 | 0.0 | −1173.13778578 | 0.0 | −1173.13846019 | 0.0 |
| trans–trans (tt) | −1173.13246585 | 0.7 | −1173.13341930 | 2.7 | −1173.13351019 | 3.1 |
| cis–cis (cc) | −1173.12883432 | 3.3 | −1173.13395050 | 2.4 | −1173.13460054 | 2.4 |
Table 2.
Relative energy difference between the conformers when the group –B(OH)2 is 90° of the benzene ring in the systems I: ortho, II: meta and III: para. In each case, the dihedral angle is between C12–C13–B–O.
Table 2.
Relative energy difference between the conformers when the group –B(OH)2 is 90° of the benzene ring in the systems I: ortho, II: meta and III: para. In each case, the dihedral angle is between C12–C13–B–O.
| Conformer | Isomers |
|---|
| I (90°) | II (90°) | III (90°) |
|---|
| Energy (Hartrees) | * ΔE (kcal/mol) | Energy (Hartrees) | * ΔE (kcal/mol) | Energy (Hartrees) | * ΔE (kcal/mol) |
|---|
| cis–trans (ct) | −1173.13188159 | 0.0 | −1173.13317105 | 0.0 | −1773.13273599 | 0.0 |
| trans–trans (tt) | −1173.12910953 | 1.7 | −1173.13082945 | 1.5 | −1173.13071757 | 1.3 |
| cis–cis (cc) | −1173.12453200 | 4.6 | −1173.12514551 | 5.0 | −1173.12527473 | 4.7 |
Table 3.
Effect of the rotation of the boronic acid group on the conformational energy values of the structures for I–III.
Table 3.
Effect of the rotation of the boronic acid group on the conformational energy values of the structures for I–III.
| Conformer |
|---|
| Isomer | cis-trans (ct) | trans-trans (tt) | cis-cis (cc) |
|---|
| Energy (Hartrees) | ΔE (kcal/mol) | Energy (Hartrees) | ΔE (kcal/mol) | Energy (Hartrees) | ΔE (kcal/mol) |
|---|
| I | −1173.13344187 | 1.0 | −1173.13246585 | 2.1 | −1173.12883432 | 2.7 |
| I (90°) | −1173.13188159 | −1173.12910953 | −1173.12453200 |
| II | −1173.13778578 | 2.9 | −1173.13341930 | 1.6 | −1173.13395050 | 5.5 |
| II (90°) | −1173.13317105 | −1173.13082945 | −1173.12514551 |
| III | −1173.13846019 | 3.6 | −1173.13351019 | 1.8 | −1173.13460054 | 5.9 |
| III (90°) | −1773.13273599 | −1173.13071757 | −1173.12527473 |
Table 4.
Selected theoretical and experimental bond length (Å) of the conformers for I, II and III.
Table 4.
Selected theoretical and experimental bond length (Å) of the conformers for I, II and III.
| Bond | I | II | III | Exp |
|---|
| ct | cc | Δcc-ct | tt | Δtt-ct | ct | cc | Δcc−ct | tt | Δtt-ct | ct | cc | Δcc−ct | tt | Δtt−ct |
|---|
| N1–H1 | 1.005 | 1.005 | 0.000 | 1.005 | 0.000 | 1.005 | 1.005 | 0.000 | 1.005 | 0.000 | 1.005 | 1.005 | 0.000 | 1.005 | 0.000 | 0.91 c |
| O1–H(O1) | 0.964 | 0.964 | 0.000 | 0.961 | −0.003 | 0.963 | 0.960 | −0.003 | 0.961 | −0.002 | 0.963 | 0.960 | −0.003 | 0.96 | −0.003 | 0.92 b |
| O2–H(O2) | 0.960 | 0.960 | 0.000 | 0.961 | 0.001 | 0.960 | 0.960 | 0.000 | 0.961 | 0.001 | 0.960 | 0.960 | 0.000 | 0.96 | 0.000 | 0.92 b |
| N1–C2 | 1.384 | 1.383 | −0.001 | 1.384 | 0.000 | 1.382 | 1.382 | 0.000 | 1.383 | 0.001 | 1.383 | 1.383 | 0.000 | 1.383 | 0.000 | 1.388 a |
| C2–C3 | 1.369 | 1.370 | 0.001 | 1.368 | −0.001 | 1.369 | 1.370 | 0.001 | 1.369 | 0.000 | 1.370 | 1.370 | 0.000 | 1.37 | 0.000 | 1.366 c |
| C3–C10 | 1.513 | 1.513 | 0.000 | 1.513 | 0.000 | 1.513 | 1.513 | 0.000 | 1.513 | 0.000 | 1.515 | 1.515 | 0.000 | 1.515 | 0.000 | 1.508 a |
| N1′−C2′ | 1.384 | 1.381 | −0.003 | 1.384 | 0.000 | 1.383 | 1.383 | 0.000 | 1.383 | 0.000 | 1.383 | 1.382 | −0.001 | 1.383 | 0.000 | 1.379 b |
| C2′−C3′ | 1.371 | 1.374 | 0.003 | 1.370 | −0.001 | 1.370 | 1.370 | 0.000 | 1.370 | 0.000 | 1.369 | 1.370 | 0.001 | 1.369 | 0.000 | 1.370 c |
| C3′−C10 | 1.515 | 1.517 | 0.002 | 1.515 | 0.000 | 1.515 | 1.515 | 0.000 | 1.515 | 0.000 | 1.513 | 1.513 | 0.000 | 1.513 | 0.000 | 1.513 b |
| C10–C11 | 1.536 | 1.538 | 0.002 | 1.538 | 0.002 | 1.531 | 1.532 | 0.001 | 1.532 | 0.001 | 1.530 | 1.530 | 0.000 | 1.53 | 0.000 | 1.518 b |
| C11–C12 | 1.415 | 1.414 | −0.001 | 1.417 | 0.002 | 1.395 | 1.395 | 0.000 | 1.395 | 0.000 | 1.399 | 1.398 | −0.001 | 1.399 | 0.000 | 1.372 b |
| C12–C13 | 1.406 | 1.406 | 0.000 | 1.406 | 0.000 | 1.405 | 1.405 | 0.000 | 1.405 | 0.000 | 1.390 | 1.391 | 0.001 | 1.39 | 0.000 | 1.384 b |
| C13–C14 | 1.392 | 1.392 | 0.000 | 1.391 | −0.001 | 1.403 | 1.403 | 0.000 | 1.403 | 0.000 | 1.405 | 1.405 | 0.000 | 1.404 | −0.001 | 1.385 b |
| C14–C15 | 1.390 | 1.391 | 0.001 | 1.390 | 0.000 | 1.392 | 1.393 | 0.001 | 1.392 | 0.000 | 1.402 | 1.404 | 0.002 | 1.403 | 0.001 | 1.374 b |
| C15–C16 | 1.394 | 1.393 | −0.001 | 1.393 | −0.001 | 1.392 | 1.392 | 0.000 | 1.393 | 0.001 | 1.392 | 1.393 | 0.001 | 1.392 | 0.000 | 1.374 b |
| C16–C11 | 1.396 | 1.397 | 0.001 | 1.397 | 0.001 | 1.398 | 1.398 | 0.000 | 1.398 | 0.000 | 1.396 | 1.396 | 0.000 | 1.397 | 0.001 | 1.378 b |
| C12–B | 1.573 | 1.584 | 0.011 | 1.569 | −0.004 | - | - | | - | - | - | - | - | - | - | 1.579 b |
| C13–B | - | - | - | - | - | 1.565 | 1.575 | 0.010 | 1.559 | −0.006 | - | - | - | - | - | 1.579 b |
| C14–B | - | - | - | - | - | - | - | | - | - | 1.563 | 1.574 | 0.011 | 1.557 | −0.006 | 1.579 b |
| B–O1 | 1.367 | 1.372 | 0.005 | 1.374 | 0.007 | 1.368 | 1.368 | 0.000 | 1.375 | 0.007 | 1.368 | 1.368 | 0.000 | 1.376 | 0.008 | 1.355 b |
| B–O2 | 1.375 | 1.362 | −0.013 | 1.377 | 0.002 | 1.375 | 1.368 | −0.007 | 1.376 | 0.001 | 1.375 | 1.369 | −0.006 | 1.376 | 0.001 | 1.362 b |
Table 5.
Selected theoretically and experimental bond angles (°) of the conformers of the target molecules.
Table 5.
Selected theoretically and experimental bond angles (°) of the conformers of the target molecules.
| Bond Angle | I | II | III | Exp |
|---|
| ct | cc | Δcc−ct | tt | Δtt−ct | ct | cc | Δcc−ct | tt | Δtt−ct | ct | cc | Δcc−ct | tt | Δtt−ct |
|---|
| C9–N1–C2 | 109.20 | 109.20 | 0.00 | 109.20 | 0.00 | 109.30 | 109.20 | −0.10 | 109.20 | −0.10 | 109.20 | 109.20 | 0.00 | 109.20 | 0.00 | 108.70 b |
| C3–C10–C11 | 113.40 | 113.40 | 0.00 | 113.70 | 0.30 | 112.90 | 113.10 | 0.20 | 113.10 | 0.20 | 111.40 | 113.10 | 1.70 | 111.40 | 0.00 | 113.11 a |
| C9′−N1′−C2′ | 109.20 | 109.30 | 0.10 | 109.20 | 0.00 | 109.30 | 109.20 | −0.10 | 109.20 | −0.10 | 109.20 | 109.20 | 0.00 | 109.20 | 0.00 | 108.80 b |
| C3′−C10–C11 | 111.10 | 111.30 | 0.20 | 111.00 | −0.10 | 111.60 | 111.50 | −0.10 | 111.60 | 0.00 | 113.10 | 111.40 | −1.70 | 113.10 | 0.00 | 110.60 a |
| C11–C12–C13 | 118.20 | 118.00 | −0.20 | 118.20 | 0.00 | 122.00 | 122.40 | 0.40 | 121.80 | −0.20 | 121.00 | 120.90 | −0.10 | 120.90 | −0.10 | 119.20 b |
| C12–C13–C14 | 122.10 | 122.10 | 0.00 | 122.10 | 0.00 | 117.90 | 117.60 | −0.30 | 118.40 | 0.50 | 121.30 | 121.60 | 0.30 | 121.10 | −0.20 | 123.00 b |
| C14–C15–C16 | 119.90 | 119.80 | −0.10 | 119.90 | 0.00 | 119.90 | 120.00 | 0.10 | 120.00 | 0.10 | 121.80 | 121.80 | 0.00 | 121.40 | −0.40 | 123.00 b |
| C15–C16–C11 | 121.50 | 121.40 | −0.10 | 121.60 | 0.10 | 120.80 | 120.70 | −0.10 | 120.90 | 0.10 | 121.50 | 120.70 | −0.80 | 120.70 | −0.80 | 119.40 b |
| C11–C12–B | 124.90 | 124.90 | 0.00 | 125.80 | 0.90 | - | - | - | - | - | - | - | - | - | - | 121.90 b |
| B–C12–C13 | 116.90 | 117.10 | 0.20 | 116.00 | −0.90 | - | - | - | - | - | - | - | - | - | - | 121.90 b |
| C12–B–O1 | 121.30 | 124.30 | 3.00 | 121.10 | −0.20 | - | - | - | - | - | - | - | - | - | - | 118.20 b |
| C12–B–O2 | 121.90 | 120.70 | −1.20 | 116.90 | −5.00 | − | - | - | - | - | - | - | - | - | - | 122.20 b |
| C12–C13–B | - | - | - | - | - | 119.90 | 121.00 | 1.10 | 120.80 | 0.90 | - | - | - | - | - | 121.90 b |
| B–C13–C14 | - | - | - | - | - | 122.20 | 121.40 | −0.80 | 120.90 | −1.30 | - | - | - | - | - | 122.70 b |
| C13–B–O1 | - | - | - | - | - | 119.00 | 122.50 | 3.50 | 118.50 | −0.50 | - | - | - | - | - | 118.20 b |
| C13–B–O2 | - | - | - | - | - | 124.10 | 122.60 | −1.50 | 118.40 | −5.70 | - | - | - | - | - | 122.20 b |
| C13–C14–B | - | - | - | - | - | - | - | - | - | - | 120.20 | 121.60 | 1.40 | 121.20 | 1.00 | 121.90 b |
| B–C14–C15 | - | - | - | - | - | - | - | - | - | - | 122.70 | 121.60 | −1.10 | 121.20 | −1.50 | 122.70 b |
| C14–B–O1 | - | - | - | - | - | - | - | - | - | - | 118.80 | 122.60 | 3.80 | 118.40 | −0.40 | 118.20 b |
| C14–B–O2 | - | - | - | - | - | - | - | - | - | - | 124.30 | 122.50 | −1.80 | 118.50 | −5.80 | 122.20 b |
| B–O1–H(O1) | 112.10 | 113.60 | 1.50 | 116.10 | 4.00 | 112.10 | 113.30 | 1.20 | 116.20 | 4.10 | 112.20 | 113.40 | 1.20 | 116.20 | 4.00 | 111.40 b |
| B–O2–H(O2) | 113.70 | 113.00 | −0.70 | 115.80 | 2.10 | 114.40 | 113.40 | −1.00 | 116.10 | 1.70 | 114.60 | 113.30 | −1.30 | 116.20 | 1.60 | 115.60 b |
| O1–B–O2 | 116.70 | 114.90 | −1.80 | 122.00 | 5.30 | 116.90 | 114.90 | −2.00 | 126.10 | 9.20 | 116.90 | 114.80 | −2.10 | 123.10 | 6.20 | 119.50 b |
Table 6.
Energetic properties of the eight dimers found.
Table 6.
Energetic properties of the eight dimers found.
| Dimer | Electronic Energy (Hartrees) | IE (kcal/mol) | RE (kcal/mol) |
|---|
| III-1 | −2346.28916998 | −7.7 | 0.0 |
| III-2 | −2346.28480554 | −4.9 | 2.7 |
| III-3 | −2346.28456653 | −4.8 | 2.9 |
| III-4 | −2346.28343557 | −4.1 | 3.6 |
| III-5 | −2346.28249966 | −3.5 | 4.2 |
| III-6 | −2346.28131638 | −2.8 | 4.9 |
| III-7 | −2346.28044096 | −2.2 | 5.5 |
| III-8 | −2346.27761899 | −0.4 | 7.3 |
Table 7.
Values of electronic density and the square Laplacian of density for the dimers.
Table 7.
Values of electronic density and the square Laplacian of density for the dimers.
| Dimer | Interaction | ρ | ∇2ρ | Dimer | Interaction | ρ | ∇2ρ |
|---|
| 1 | BCP (3,−1) O1H●●●O1H | 0.0289 | −0.0264 | 5 | BCP (3,−1) N–H1●●●π indol | 0.0063 | −0.0045 |
| BCP (3,−1) O2H●●●O2H | 0.0293 | −0.0267 | BCP (3,−1) C–H2●●●π | 0.0034 | −0.0027 |
| RCP (3,+1) | 0.0043 | −0.0053 | RCP (3,+1) | 0.0034 | −0.0028 |
| 2 | BCP (3,−1) O1H●●●NH1 | 0.0165 | −0.0149 | 6 | BCP (3,−1) O1H●●●N | 0.0110 | −0.0083 |
| BCP (3,−1) CH2 indol●●●π boronic | 0.0037 | −0.0026 | | | |
| RCP (3,+1) C–H2●●●π O1H●●●NH1 | 0.0023 | −0.0023 | BCP (3,−1) NH1●●●O2 | 0.0202 | −0.0191 |
| BCP (3,−1) N●●●H2–C indol | 0.0036 | −0.0027 | | | |
| BCP (3,−1) N–H1π●●●indol | 0.0038 | −0.0029 | RCP (3,+1) | 0.0075 | −0.0081 |
| RCP (3,+1) N●●●H–C indol | 0.0026 | −0.0024 | | | |
| N–H1●●●π indol |
| 3 | BCP (3,−1) O1H●●●O1 | 0.0223 | −0.0211 | 7 | BCP (3,−1) O1H●●●π indol | 0.0047 | −0.0030 |
| RCP (3,−1) O1H●●●O2 | 0.0231 | −0.0226 | BCP (3,−1) C–H2●●●π | 0.0042 | −0.0032 |
| RCP(3,+1) | 0.0098 | −0.0121 | BCP (3,−1) CH●●●O | 0.0027 | −0.0022 |
| | | | RCP (3,+1) CH●●●π OH●●●π | 0.0027 | −0.0022 |
| | | | RCP (3,+1) OH●●●π CH●●●O | 0.0010 | −0.0009 |
| 4 | BCP (3,−1) NH1●●●π indol 1 | 0.0057 | −0.0039 | 8 | BCP (3,−1) C–H2●●●O2 | 0.0033 | −0.0031 |
| BCP (3,−1) C–H2●●●π indol 1 | 0.0033 | −0.0023 | BCP (3,−1) O1H●●●π indol | 0.0097 | −0.0066 |
| BCP (3,−1) NH1●●●π indol 2 | 0.0063 | −0.0045 | RCP (3,+1) | 0.0031 | −0.0031 |
| BCP (3,−1) C–H2●●●π indol 2 | 0.0034 | −0.0027 | | | |
| RCP (3,+1) 1 | 0.0031 | −0.0025 | | | |
| RCP (3,+1) 2 | 0.0034 | −0.0028 | | | |
Table 8.
Experimental and theoretical infrared frequencies for the conformer ct to I–III and their approximate mode description.
Table 8.
Experimental and theoretical infrared frequencies for the conformer ct to I–III and their approximate mode description.
| Experimental Frequencies | Theoretically Results | Mode Descriptions |
|---|
| I | II | III | ct-I | ct-II | ct-III |
|---|
| F | S a | S b | F | S a | S b | F | S a | S b |
|---|
| 3405.1 | 3403.5 | 3407.1 | 3875.5 | 3720.5 | 3712.7 | 3881.4 | 3726.1 | 3718.3 | 3882.9 | 3727.6 | 3719.8 | υO2H |
| 3832.4 | 3679.1 | 3671.4 | 3845.5 | 3691.7 | 3684.0 | 3847.5 | 3693,6 | 3685.9 | υO1H |
| 3674.9 | 3527.9 | 3520.6 | 3674.8 | 3527.8 | 3520.4 | 3674.1 | 3527.2 | 3519.8 | υN1’H |
| 3674.1 | 3527.2 | 3519.8 | 3674.4 | 3527.5 | 3520.1 | 3673.6 | 3526.7 | 3519.3 | υN1H |
| 3189.0 | 3061.5 | 3055.1 | 3188.7 | 3061.2 | 3054.8 | 3189.4 | 3061.8 | 3055.5 | υsC4H + υsC5H + υsC6H + υsC7H |
| 3043.0 | 3077.9 | 3080.0 | 3188.7 | 3061.2 | 3054.8 | 3188.1 | 3060.6 | 3054.2 | 3189.1 | 3061.5 | 3055.2 | υsC4’H + υsC5’H + νsC6’H + υsC7’H |
| 3186.3 | 3058.9 | 3052.5 | 3182.9 | 3055,5 | 3049.2 | 3182.8 | 3055.5 | 3049.1 | υsC16H + υsC15 + υsC13 + υsC12 |
| 2949.5 | 3000.0 | 2991.5 | 3179.9 | 3052.7 | 3046.3 | 3178.8 | 3051.7 | 3045.3 | 3179.7 | 3052.5 | 3046.2 | υasC4H + υasC6H + υasC7H |
| 3179.2 | 3052.1 | 3045.7 | 3177.8 | 3050.7 | 3044.3 | 3178.8 | 3051.6 | 3045.3 | υasC4’H + υasC6’H + υasC7’H |
| 2885.9 | 2962.7 | 2943.6 | 3177.5 | 3050.4 | 3044.1 | 3176.1 | 3049,0 | 3042.7 | 3177.7 | 3050.5 | 3044.2 | υasC16 + υasC14 + υasC15 + υasC13 |
| 1656.2 | 1623.1 | 1628.1 | 1656.5 | 1623.3 | 1628.3 | 1656.7 | 1623.6 | 1628.5 | υasIndolyl |
| 1731.0 | 1730.9 | 1720.7 | 1655.6 | 1622.5 | 1627.4 | 1656.0 | 1622.9 | 1627.8 | 1656.1 | 1623.0 | 1628.0 | υasIndolyil’ |
| 1634.6 | 1601.9 | 1606.8 | 1637.0 | 1604.2 | 1609.1 | 1645.5 | 1612.6 | 1617.5 | υasbenzene ring |
| 1614.0 | 1581.8 | 1586.6 | 1613.5 | 1581.2 | 1586.1 | 1613.8 | 1581.5 | 1586.4 | υasIndolyl + υasIndolyl’ |
| 1612.2 | 1579.9 | 1584.8 | 1611.1 | 1578.9 | 1583.7 | 1611.7 | 1579.4 | 1584.3 | υasIndolyl + υasIndolyl’ + υasbenzene ring |
| 1597.3 | 1601.7 | 1607.9 | 1519.9 | 1489.5 | 1494.0 | 1583.9 | 1552.2 | 1557.0 | 1584.3 | 1552.6 | 1557.4 | υasIndolyl + υasIndolyl’ + δN1H + δN1’H |
| 1519.3 | 1488.9 | 1493.4 | 1520.0 | 1489.6 | 1494.2 | 1579.2 | 1547.7 | 1552.4 | υasIndolyl + υasIndolyl’ + δN1H + δN1’H + δC5H + δC5’H’ |
| 1456.6 | 1455.9 | 1456.3 | 1508.0 | 1477.9 | 1512.6 | 1479.2 | 1449.6 | 1425.0 | 1443.8 | 1415.0 | 1419.3 | υsC11C12C15C16 + δH13H15 |
| 1480.5 | 1450.9 | 1426.1 | 1452.4 | 1423.3 | 1399.2 | 1442.8 | 1414.0 | 1418.3 | υasC8C9C4C5C6C7 + δH4H5 |
| 1438.6 | 1419.2 | 1408.5 | 1469.4 | 1440.0 | 1415.5 | 1444.3 | 1415.4 | 1391.4 | 1433.1 | 1404.5 | 1408.8 | υasC11C12C13C14C15C16 + δH14H15H16 |
| 1388.9 | 1361.1 | 1337.9 | 1442.3 | 1413.5 | 1389.5 | | | | δIndolyl + δIndolyl’ + δbenzene ring |
| 1370.6 | | 1392.0 | 1381.9 | 1354.3 | 1331.2 | 1385.9 | 1358.2 | 1362.3 | 1519.5 | 1489.1 | 1493.6 | δIndolyl + δIndolyl’ + δbenzene ring + υasBO1 + δoopC10H |
Table 9.
Reactivity properties of objective molecules and the corresponding relationship with their biological effect.
Table 9.
Reactivity properties of objective molecules and the corresponding relationship with their biological effect.
| Property | | ct-I | ct-II | ct-III |
|---|
| Energy (Hartree) | Neutral | −1173.13344187 | −1173.13778578 | −1173.13846019 |
| Negative | −1173.12670369 | −1173.13148373 | −1173.13365972 |
| Positive | −1172.88003603 | −1172.88224063 | −1172.87999701 |
| Reactivity (Ev) | EA | −0.18 | −0.17 | −0.13 |
| I | 6.90 | 6.95 | 7.03 |
| µ | −6.80 | −6.87 | −6.97 |
| η | 3.54 | 3.56 | 3.58 |
| ω | 6.54 | 6.62 | 6.78 |
| N | −6.90 | −6.95 | −7.03 |
| Biological activity (%) | U251 | 36 | 49 | 7.59 |
| PC-3 | 62.79 | 50.63 | 26.85 |
| K562 | 0.00 | 19.42 | 0.00 |
| HCT-15 | 47.59 | 59.13 | 15.96 |
| MCF-7 | 60.27 | 81.81 | 48.40 |
| SKLU-1 | 44.11 | 63.99 | 11.09 |
Table 10.
Selected local reactivity parameters of I–III.
Table 10.
Selected local reactivity parameters of I–III.
| Atom | f− | P−k | P+k | Nk | ωk |
|---|
| I | II | III | I | II | III | I | II | III | I | II | III | I | II | III |
|---|
| C11 | 0.030 | 0.020 | 0.060 | 0.010 | 0.030 | 0.010 | 0.020 | −0.040 | 0.010 | −0.140 | 0.280 | −0.070 | 0.050 | 0.220 | 0.030 |
| C12 | −0.010 | 0.080 | 0.010 | 0.000 | −0.010 | 0.000 | 0.010 | 0.010 | 0.000 | −0.030 | −0.050 | 0.020 | 0.010 | −0.070 | 0.030 |
| C13 | −0.010 | −0.170 | 0.010 | −0.010 | 0.010 | 0.000 | 0.020 | 0.000 | 0.000 | −0.140 | −0.030 | −0.010 | −0.050 | 0.040 | 0.020 |
| C14 | −0.030 | 0.030 | 0.070 | 0.010 | 0.010 | 0.000 | 0.030 | 0.000 | −0.060 | −0.210 | −0.010 | 0.390 | 0.040 | 0.090 | −0.030 |
| C15 | −0.010 | 0.230 | −0.030 | 0.020 | −0.010 | −0.010 | 0.040 | −0.030 | 0.000 | −0.280 | 0.210 | −0.010 | 0.130 | −0.030 | −0.040 |
| C16 | 0.000 | −0.040 | 0.020 | 0.040 | 0.010 | 0.000 | 0.020 | 0.060 | −0.010 | −0.140 | −0.420 | 0.040 | 0.260 | 0.030 | −0.010 |


 ,
, 


