Article

Chemical Composition and Inhibitory Effect of Lentinula edodes Ethanolic Extract on Experimentally Induced Atopic Dermatitis in Vitro and in Vivo

1
Division of Sport Science, College of Science and Technology, Konkuk University, Chungju 27478, Korea
2
School of Life Sciences, Immune Synapse Research Center and Cell Dynamics Research Center, Gwangju Institute of Science and Technology, Gwangju 61005, Korea
3
Division of Food Bioscience, College of Biomedical and Health Sciences, Konkuk University, Chungju 27478, Korea
*
Authors to whom correspondence should be addressed.
Molecules 2016, 21(8), 993; https://doi.org/10.3390/molecules21080993
Submission received: 27 May 2016 / Revised: 23 July 2016 / Accepted: 25 July 2016 / Published: 29 July 2016

Abstract

:
The ethanolic extract of Lentinula edodes was partially analyzed and then characterized for its efficacy in treating atopic dermatitis. Polyphenols were determined to be the major antioxidant component in the extract (6.12 mg/g), followed by flavonoids (1.76 mg/g), β-carotene (28.75 μg/g), and lycopene (5.25 μg/g). An atopic dermatitis (AD) model was established and epidermal and dermal ear thickness, mast cell infiltration, and serum immunoglobulin levels were measured after oral administration of the L. edodes extract for 4 weeks. L. edodes extract decreased Dermatophagoides farinae extract (DFE) and 4-dinitrochlorobenzene (DNCB)-induced expression of several inflammatory cytokines in the ears, cervical lymph nodes, and splenocytes. Consequently, L. edodes extract may have therapeutic potential in the treatment of AD attributable to its immunomodulatory effects.

Graphical Abstract

1. Introduction

Wild mushrooms are highly valued as a nutritious and palatable food in many societies worldwide [1,2]. They contain high amounts of protein, low total fat levels, and a high proportion of polyunsaturated fatty acids, making them an excellent component of low-calorie diets [3,4]. Furthermore, mushrooms contain dietary fiber, peptides, lectins, phenolics, terpenes, alkaloids, vitamins, and minerals [5,6]. In addition to their nutritional value, many wild edible mushrooms have been investigated for their potential as neutraceutical agents. The antitumor, immunomodulatory, antimicrobial, antifungal, and antiviral properties of wild mushrooms are well established [7,8,9].
Lentinula edodes (commonly known as shiitake) is the second most cultivated edible mushroom in the world, representing about 25% of worldwide mushroom production; it has also been used as a food and medicine in South Korea and China for millennia. In the past 10 years, production of L. edodes has increased faster than that of any other mushroom species [10]. The bioactive compounds in L. edodes have been shown to have anti-tumor and antihypertensive effects [11,12,13,14,15]. L. edodes also contain lentinan and vitamin B12, which support the human immune response [16], as well as large amounts of ergosterol and fungisterol. Ultraviolet rays in sunlight can convert bioactive sterol constituents of L. edodes into vitamin D, which enhances human resistance to the common cold and other diseases. Meanwhile, there are some reports about inducing effects of L. edodes on respiratory symptoms or contact dermatitis [17,18,19,20,21,22,23,24,25]. However, there are also investigations about antiallergenic effects of some mushrooms including L. edodes and Grifola frondosa [26,27]. Therefore, in this study, we determined the chemical composition of an ethanolic extract of L. edodes and its efficacy in the treatment of AD. Chemical analysis included preliminary phytochemical screening of the L. edodes ethanolic extract as well as tests to determine carbohydrate and protein quantities, monosaccharide composition, and phenolic, flavonoid, carotenoid, lycopene, and ascorbic acid content. In addition, we used Fourier transform infrared spectroscopy (FT-IR) to further analyze the chemical composition of the L. edodes ethanolic extract. To clarify the mechanisms of L. edodes ethanolic extract in AD in vitro and in vivo, we investigated its immunomodulatory effects using keratinocyte and murine model, respectively.

2. Results and Discussion

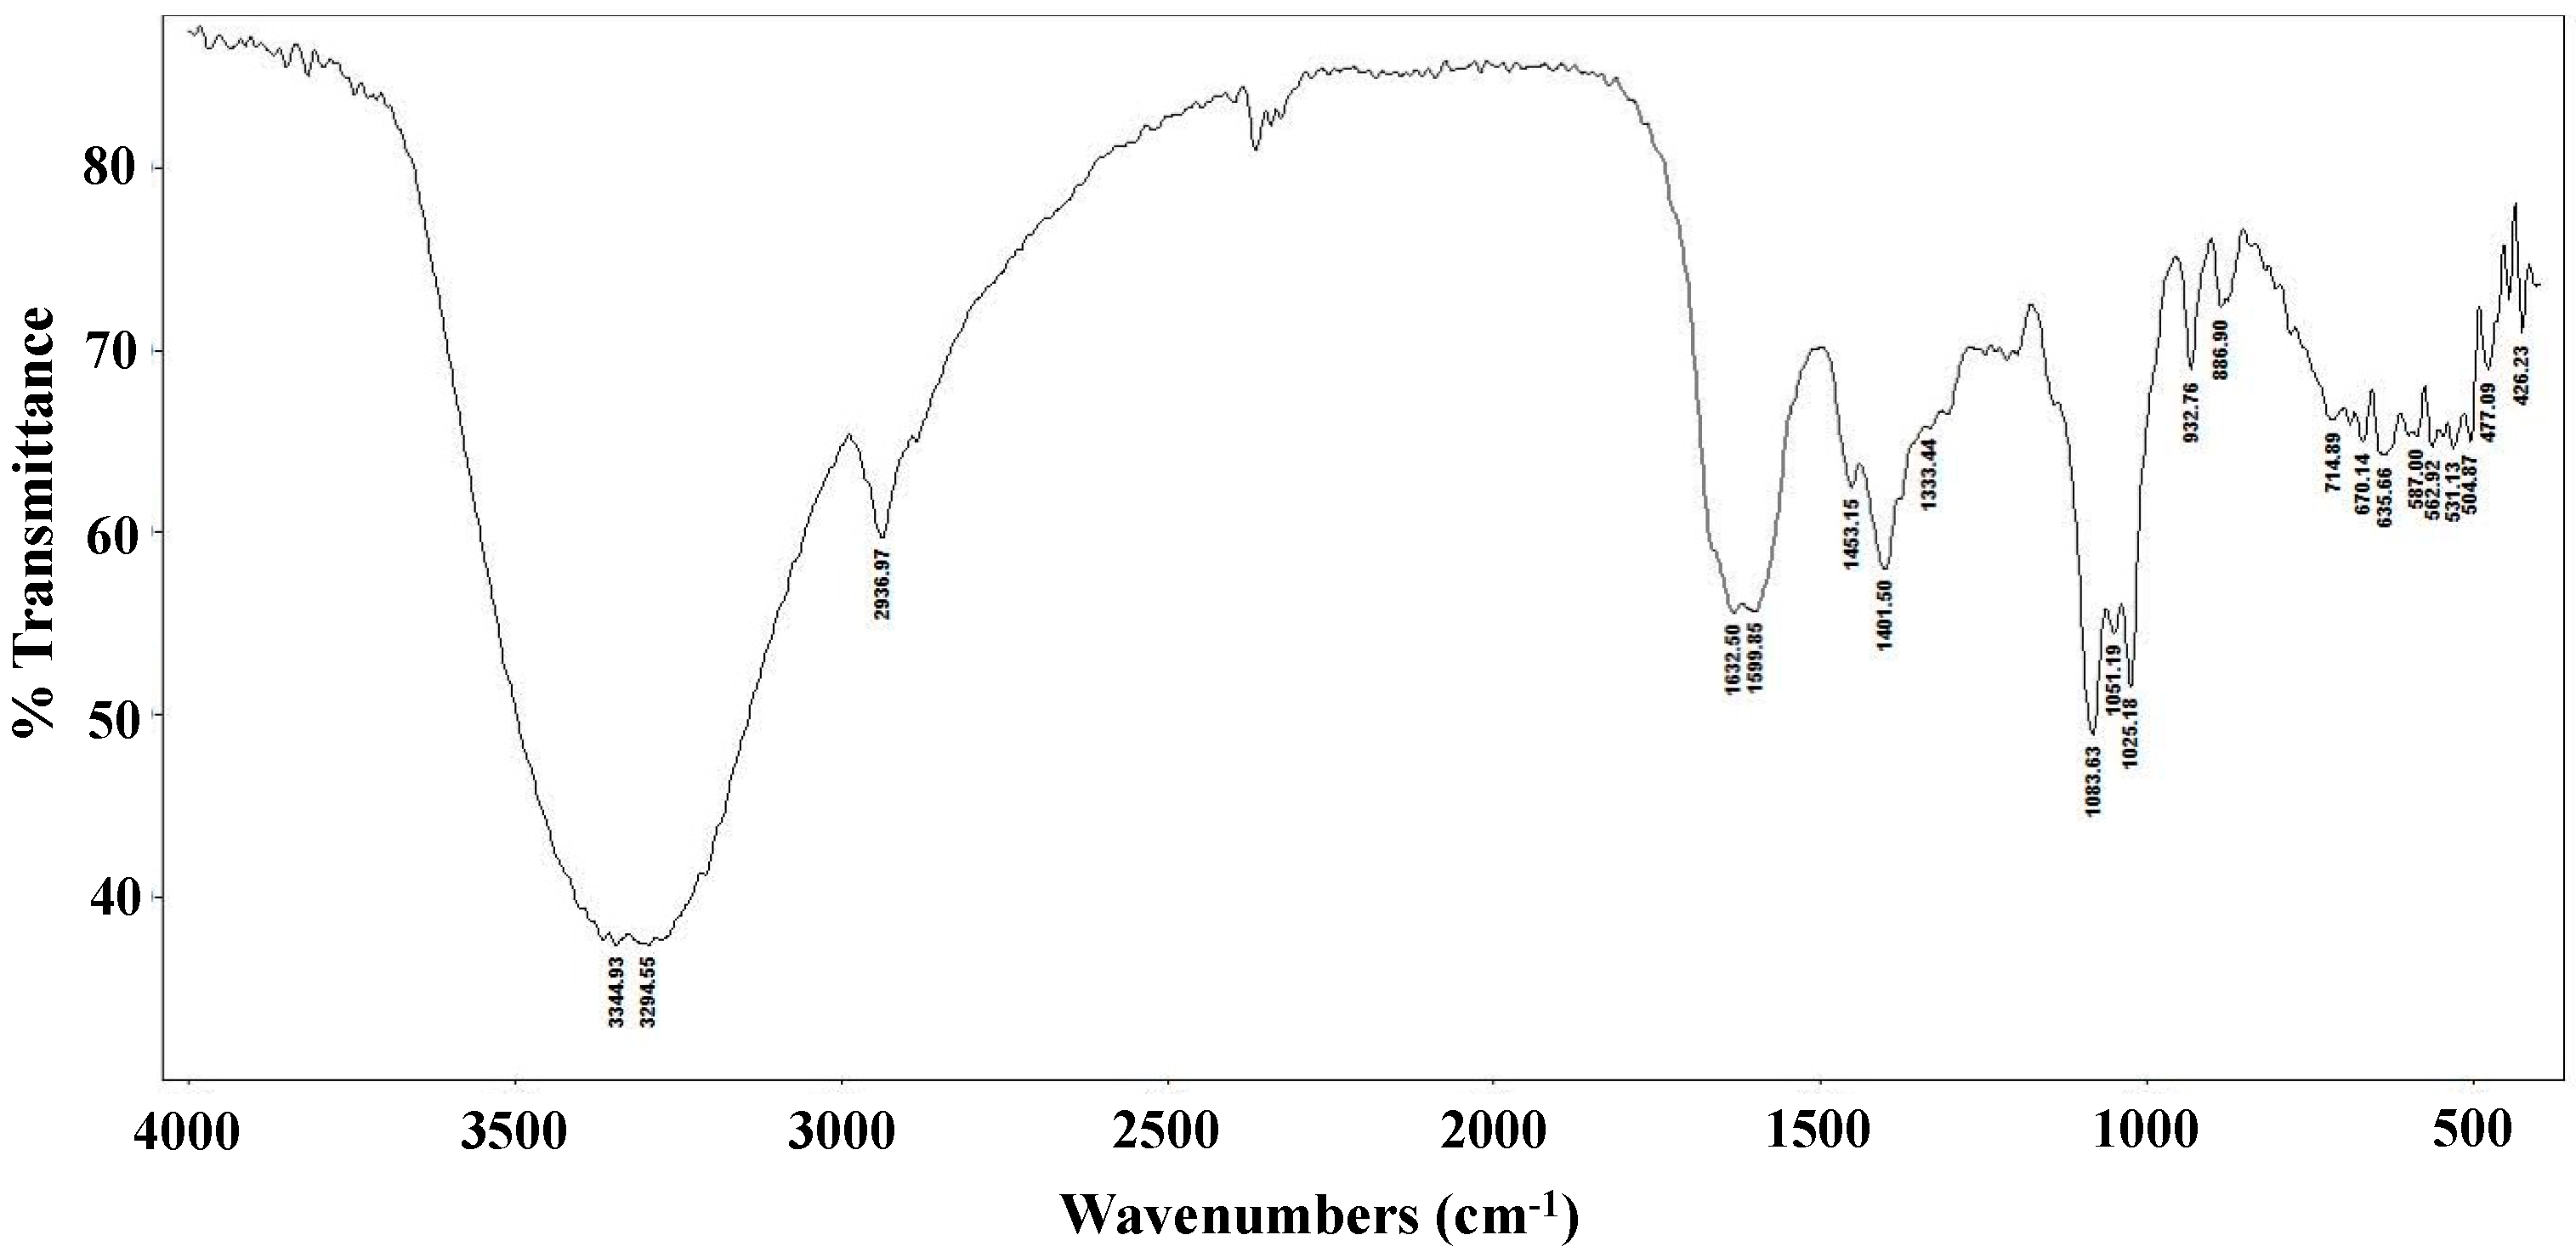
2.1. Partial Chemical Characterization of Lentinula edodes

Phytochemicals are used in humans to modulate lipid peroxidation involved in atherogenesis, thrombosis and carcinogenesis due to their antioxidant activity and anti-inflammatory action [28,29]. The contents of carbohydrate, monosaccharide, protein, amino acid, and selected phytochemical in the L. edodes extract are shown in Table 1.
The polysaccharide and protein concentration of the L. edodes extract were 151.43 ± 1.05 μg/g and 205.17 ± 1.44 μg/g, respectively. The monosaccharide constituents of the L. edodes extract were primarily glucose (127.78 ± 1.32 μg/mL) and mannose (4.27 ± 0.53 μg/mL). The protein portion of the extract predominantly consisted of glutamic acid (2.8103 g/100 g) and alanine (0.6621 g/100 g).
Polyphenols were the primary constituent of the L. edodes extract (6.12 ± 0.04 mg/g), followed by flavonoids (1.76 ± 0.22 mg/g), β-carotene (28.75 ± 0.25 μg/g), and lycopene (5.25 ± 0.04 μg/g). The flavonoids level was higher than that of L. edodes from Ethiopia (1.50 mg/g) [30].
The FT-IR spectrum of the L. edodes extract is shown in Figure 1. The bands at 3344 and 3294 cm−1 indicate hydroxyl stretching of hydrogen bonds and N–H vibrations. The band at 2936 cm−1 is attributable to C–H stretching vibrations, whereas the band at 1632 cm−1 indicates asymmetric carboxylic acid group vibrations. The peak at 1401 cm−1 is associated with the typical stretching frequencies of OH groups from phenolic compounds. Peaks at 1083, 1051, and 1025 cm−1 are associated with C–O–C linkages from intact sugars remaining in the extract [31].

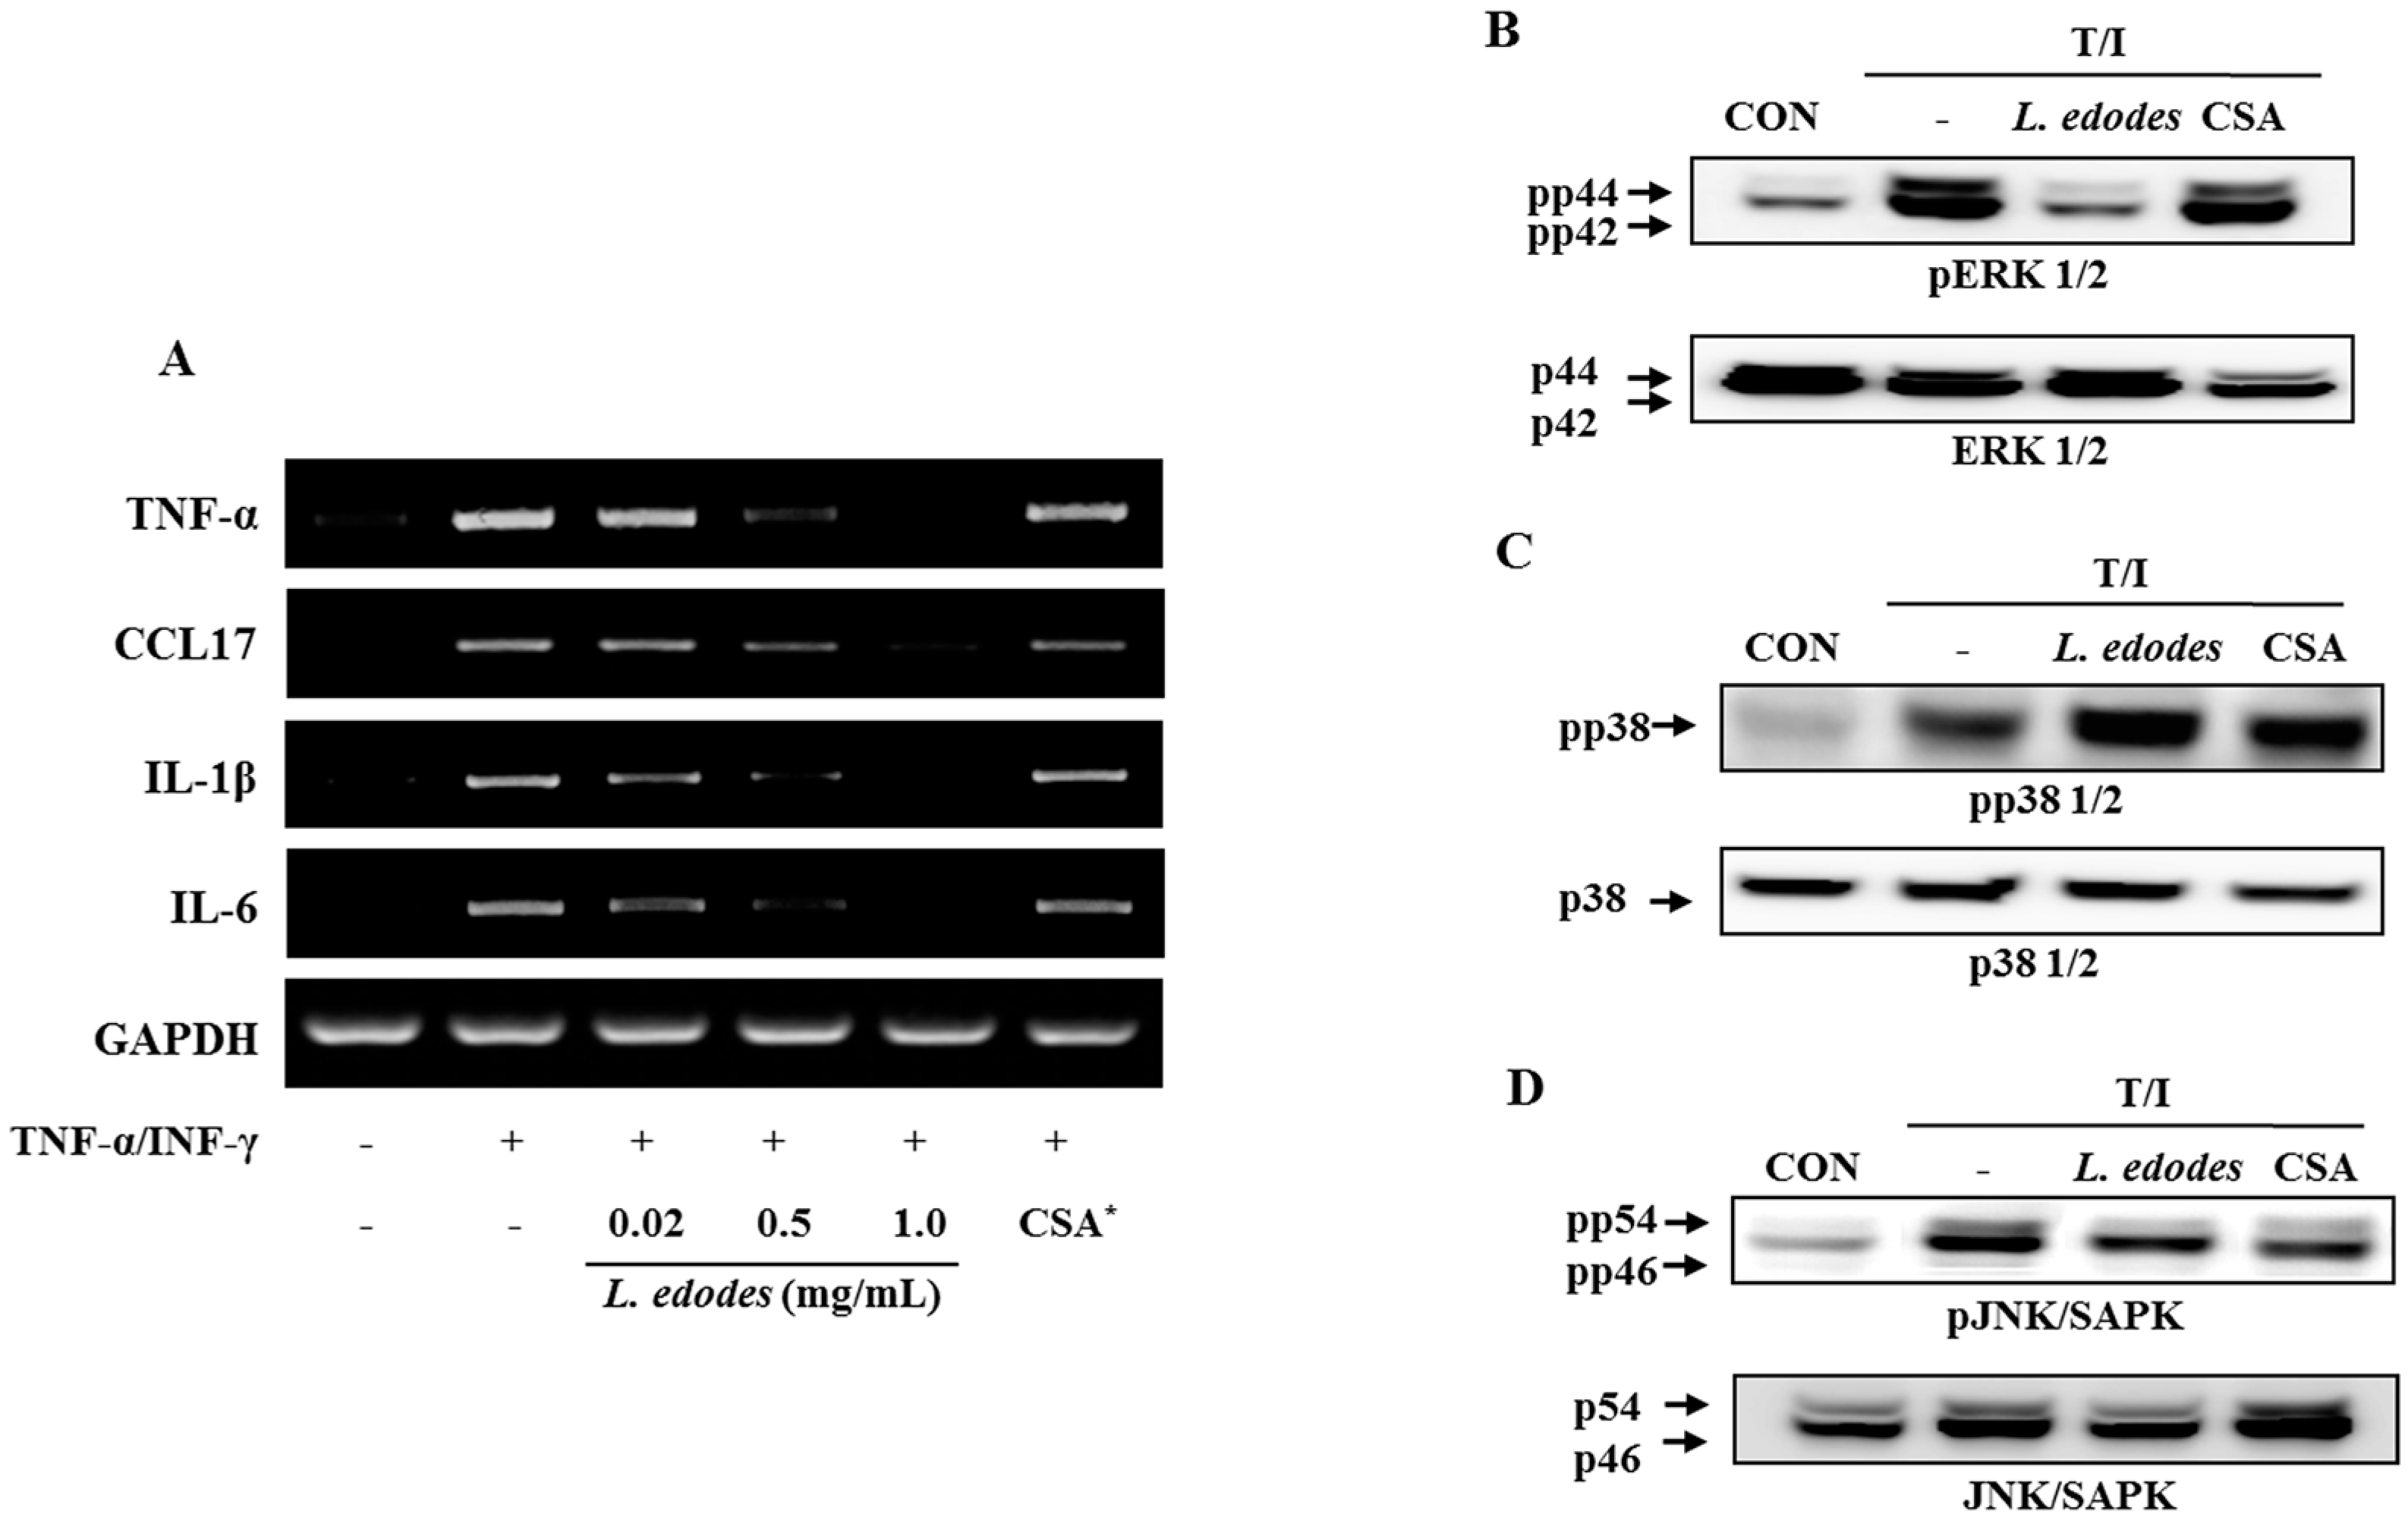
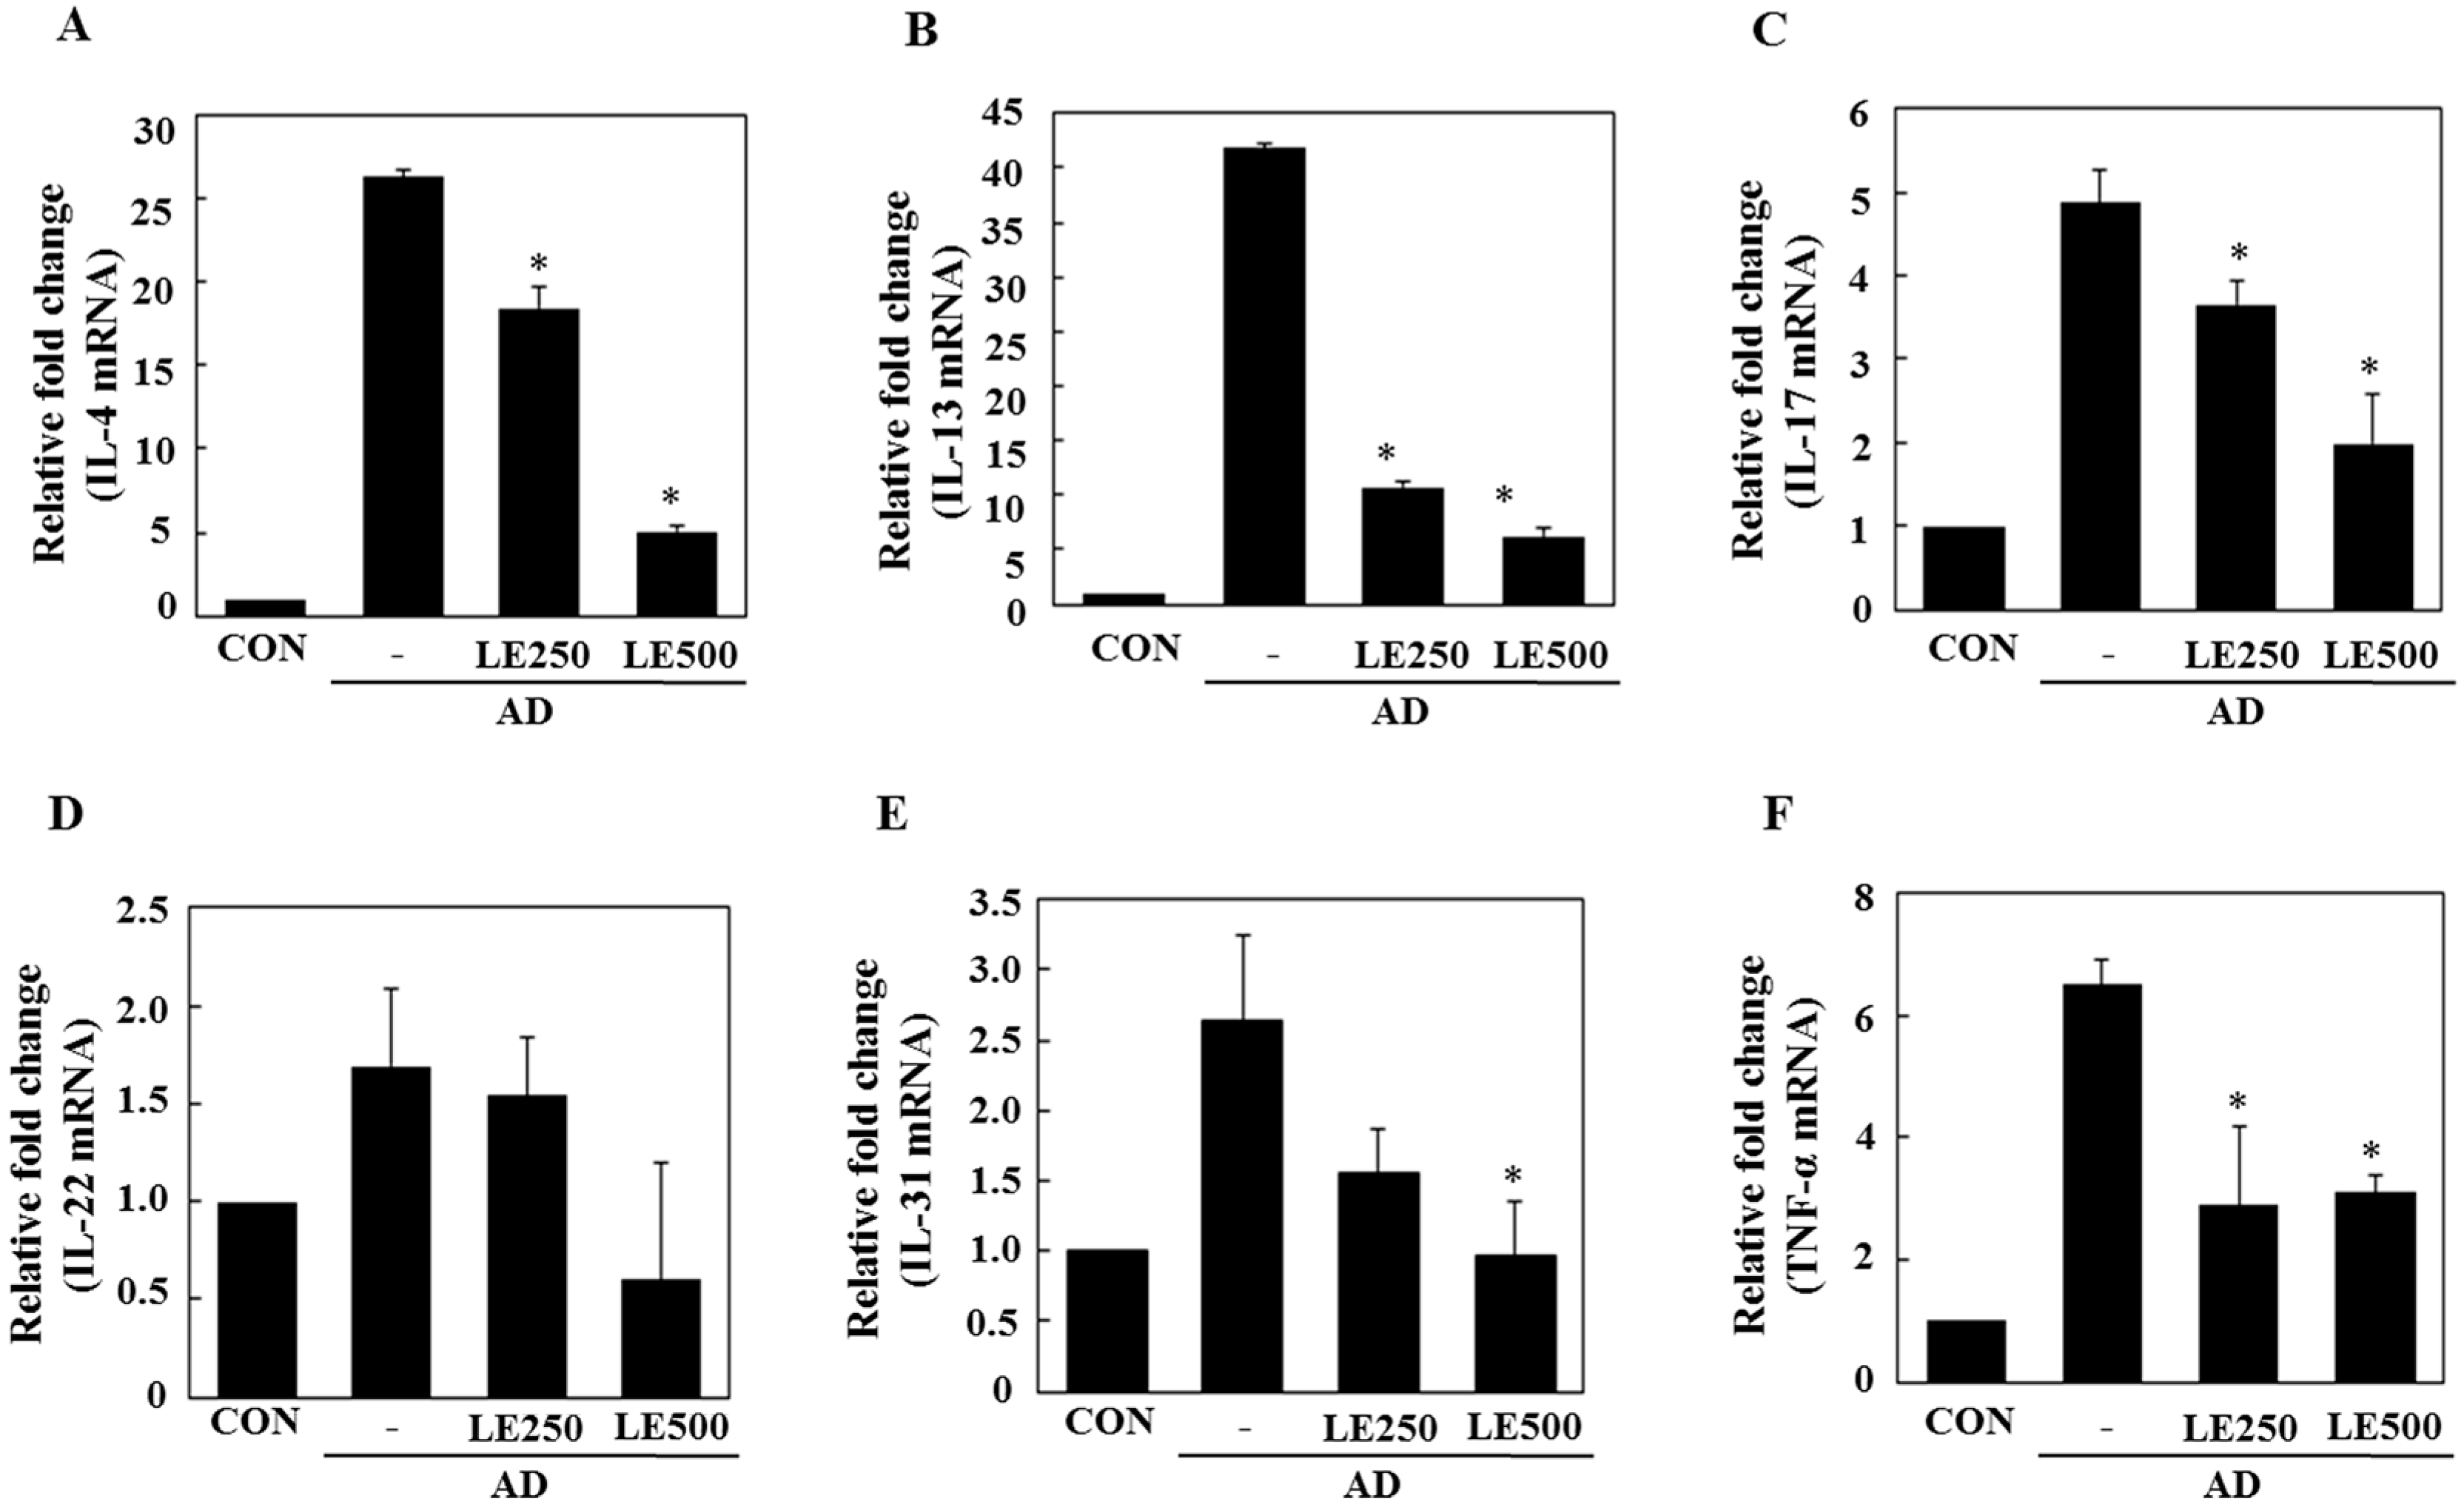
2.2. Lentinula edodes Attenuated Inflammatory Stress in Stimulated Keratinocytes

The effects of L. edodes extract on HaCaT keratinocytes co-stimulated by the pro-inflammatory mediators, TNF-α (10 ng/mL) and IFN-γ (10 ng/mL), were assessed using PCR (Figure 2A) and western blot analysis (Figure 2B–D).
Treatment with L. edodes extract effectively reduced TNF-α and IFN-γ-induced mRNA expression of TNF-α, CCL17, IL-1β, and IL-6 in a dose-dependent manner (Figure 2A). These data suggest that treatment with L. edodes extract (0.02, 0.5, and 1.0 mg/mL) results in a broad spectrum of inhibitory effects on pro-inflammatory cytokine production in HaCaT keratinocytes stimulated with TNF-α and IFN-γ.
The expression level of mitogen-activated protein kinase (MAP Kinase) in HaCaT cells was also investigated. The keratinocyte was pretreated with L. edodes extract at the indicated concentrations for 30 min, after which they were stimulated with TNF-α (10 ng/mL) and IFN-γ (10 ng/mL) for 6 h. Total cell lysates were probed with phospho-specific antibodies for ERK1/2, JNK, and p38. The extent of ERK1/2, JNK, and p38 phosphorylation increased in cells treated with TNF-α and IFN-γ. However, phosphorylation of ERK1/2 and JNK declined after treatment with L. edodes extract in relation to the unphosphorylated proteins in TNF-α and IFN-γ co-stimulated HaCaT cells (Figure 2B,D). In contrast, phosphorylation of the p38 protein was unaffected by treatment with L. edodes extract (Figure 2C).

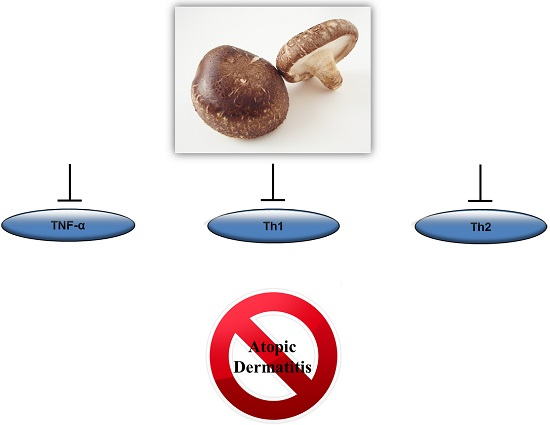
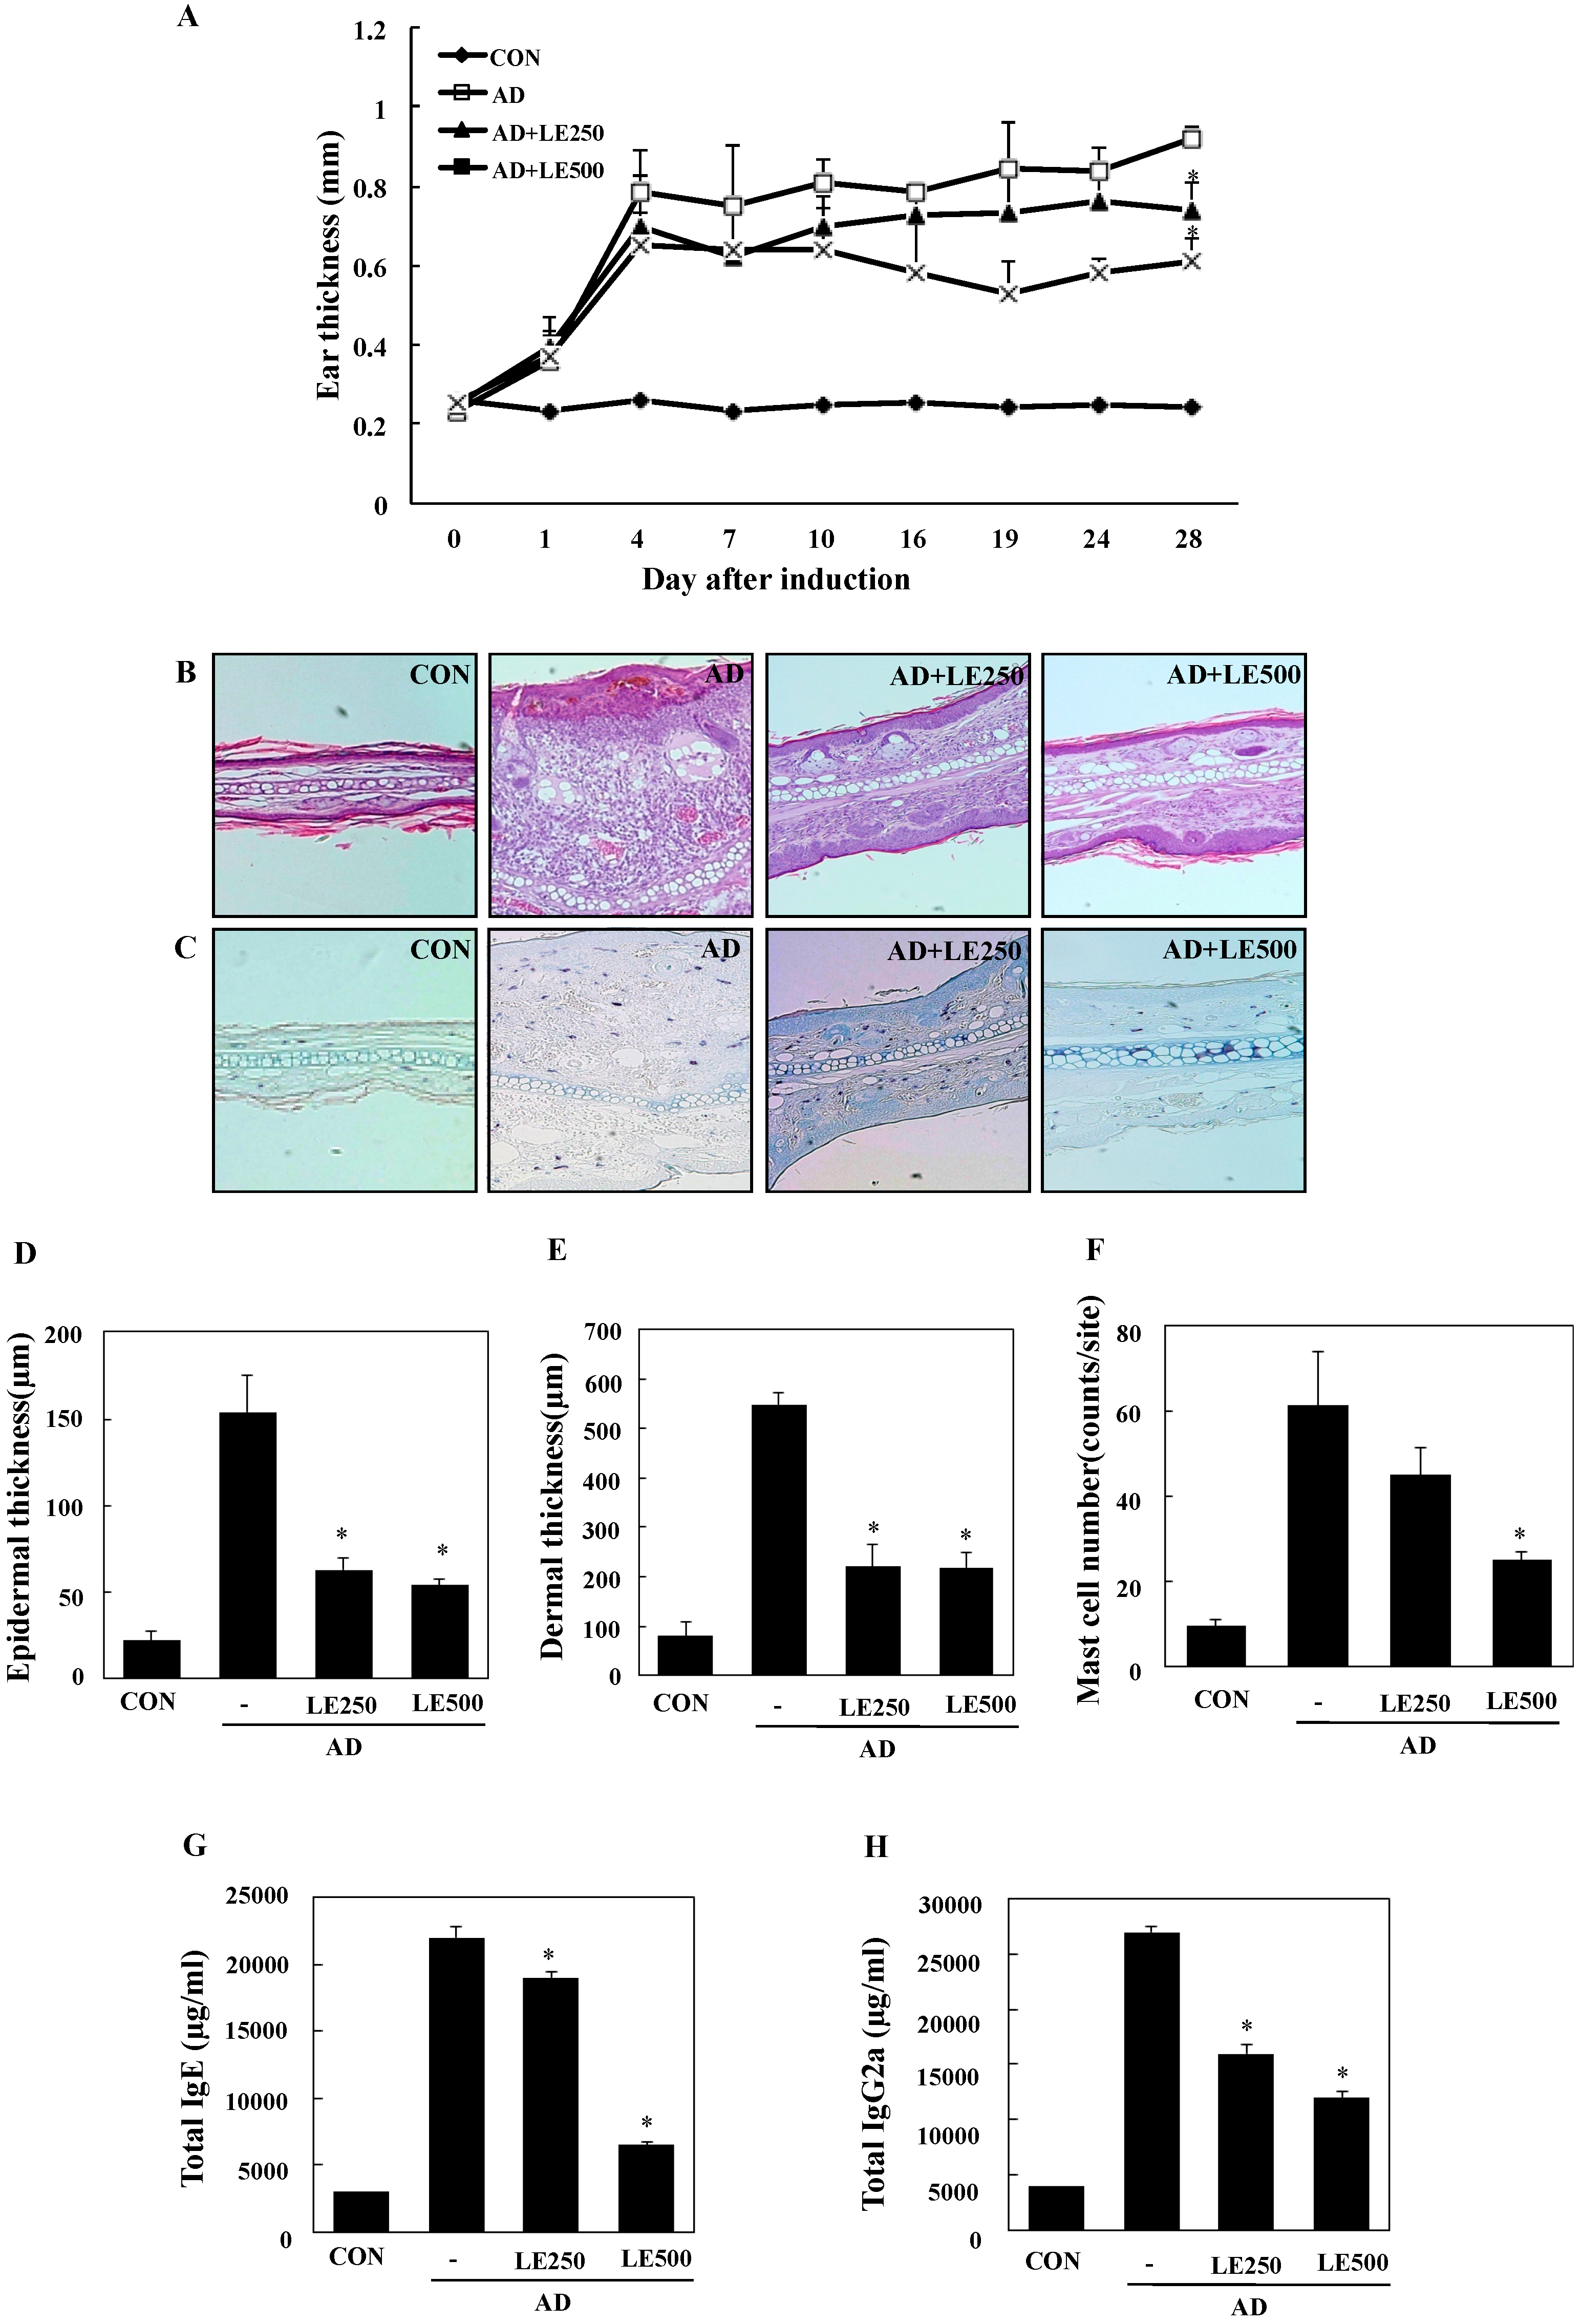
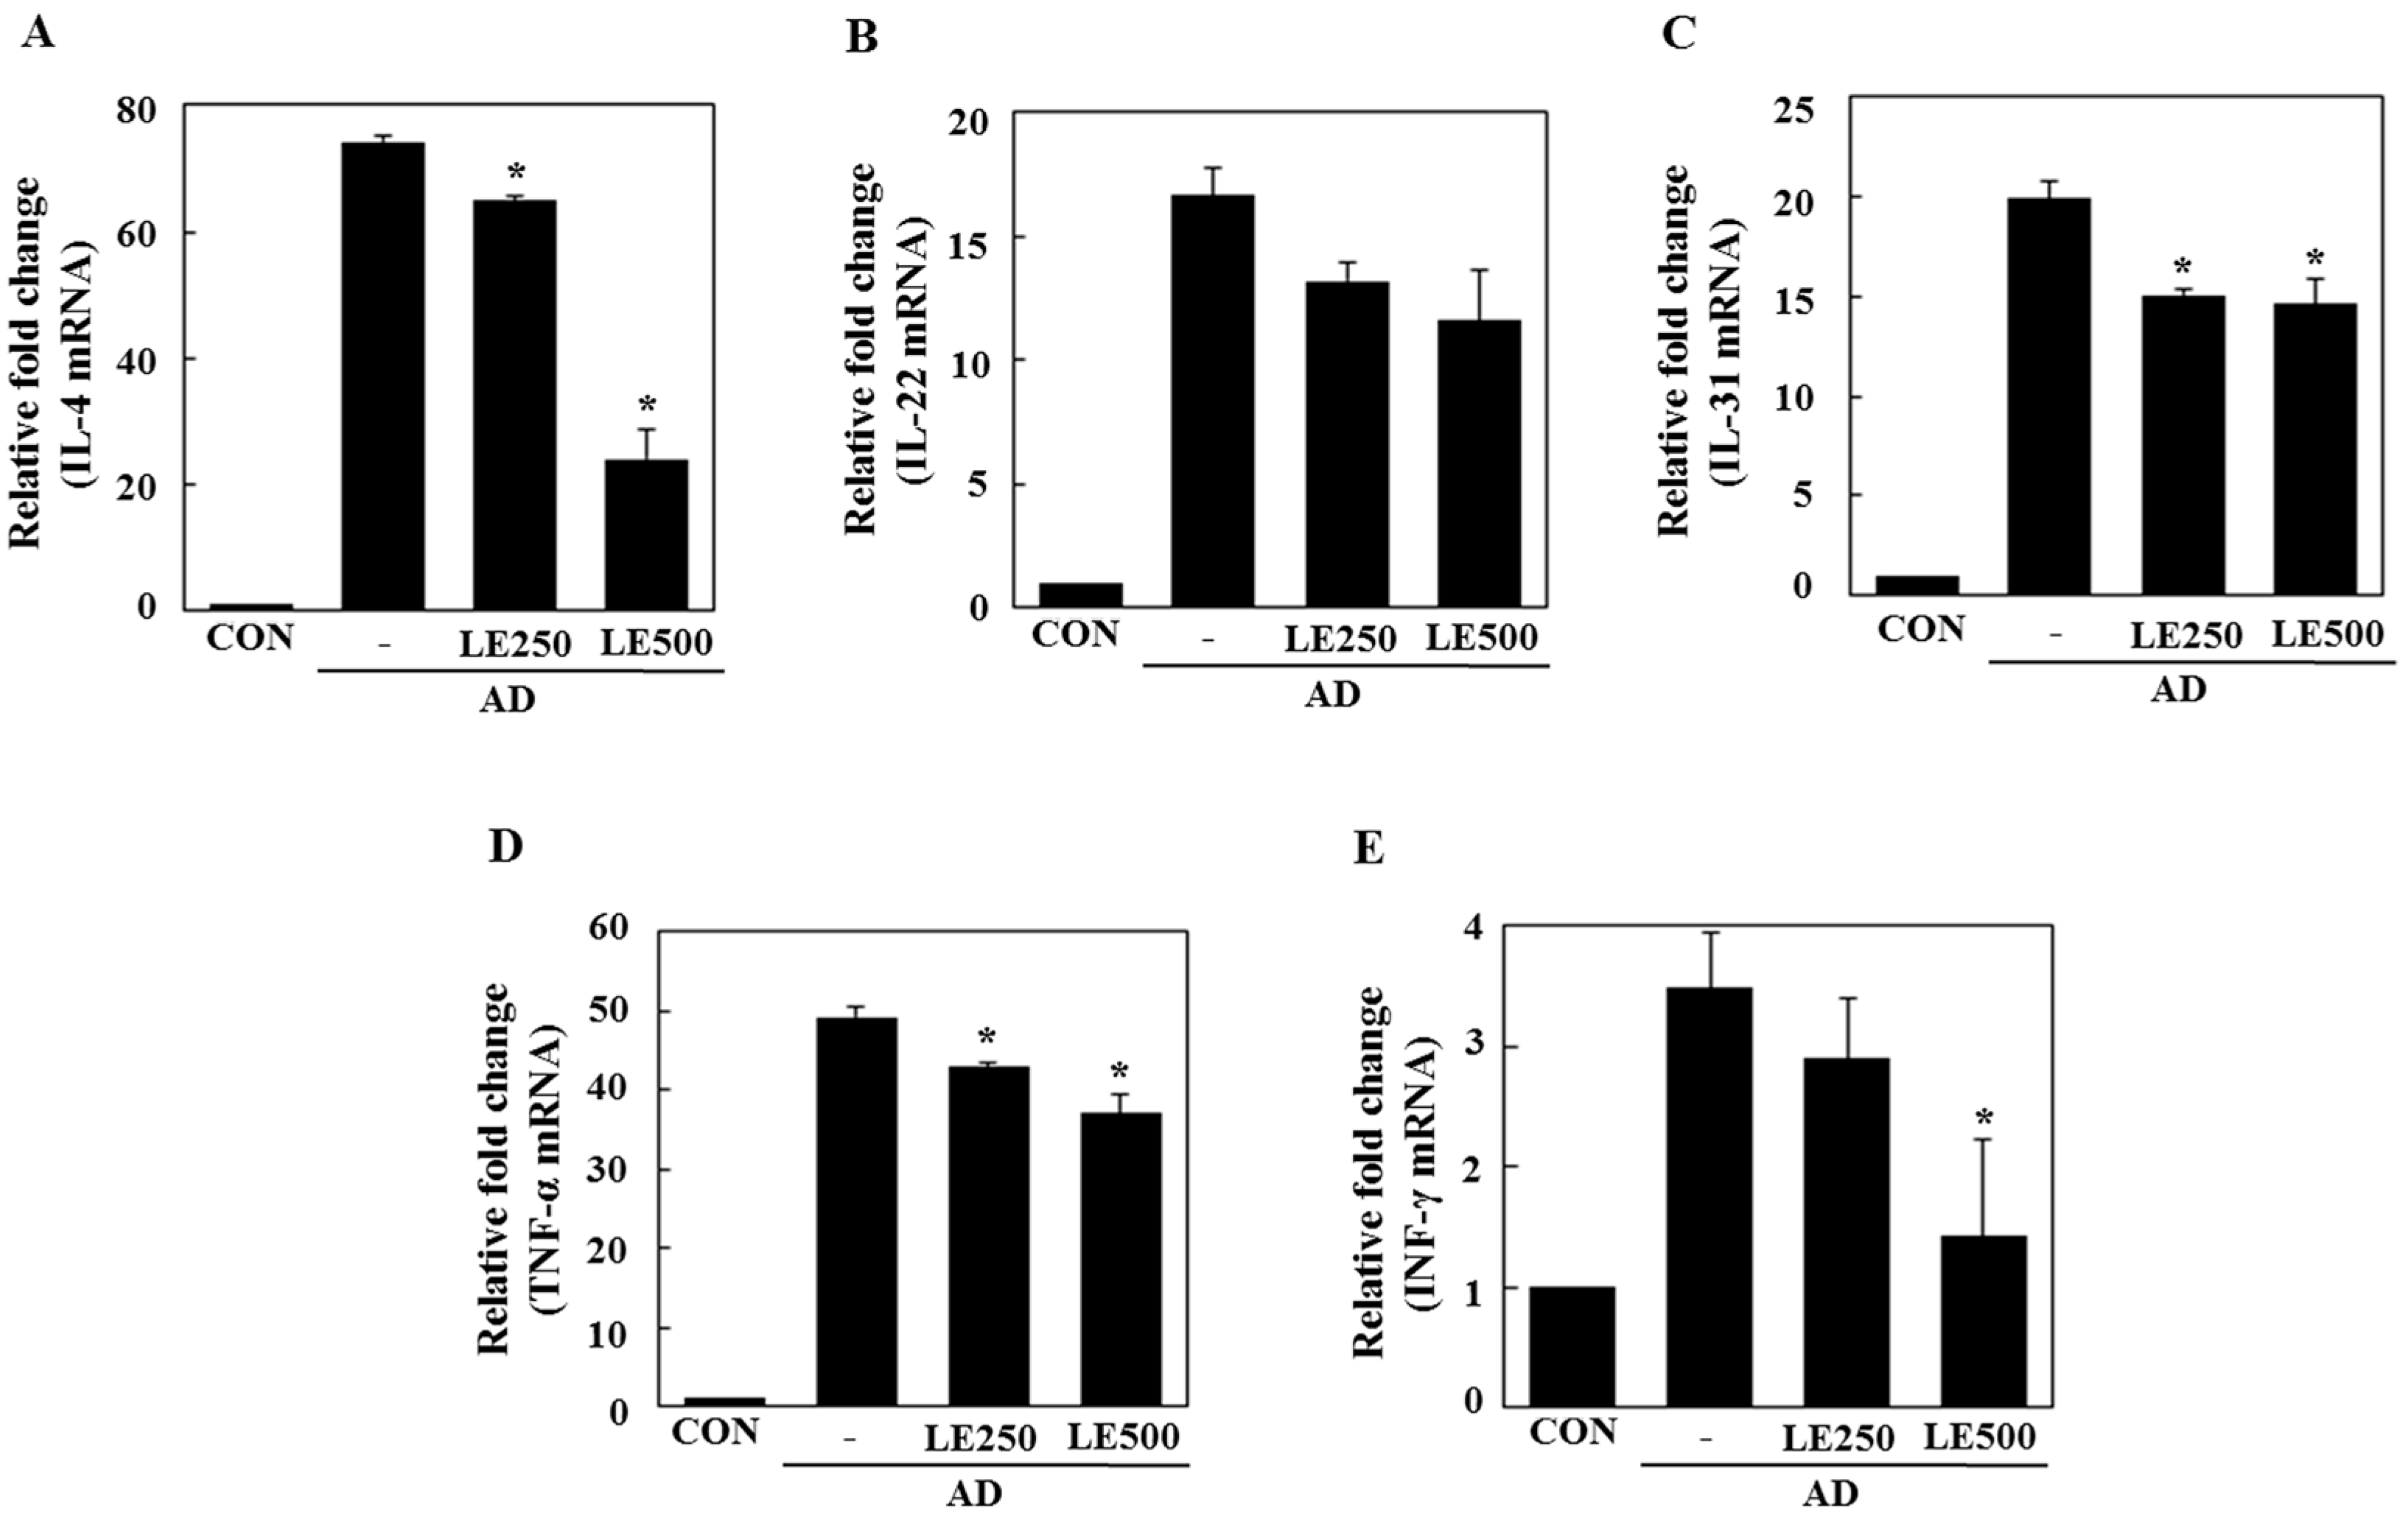
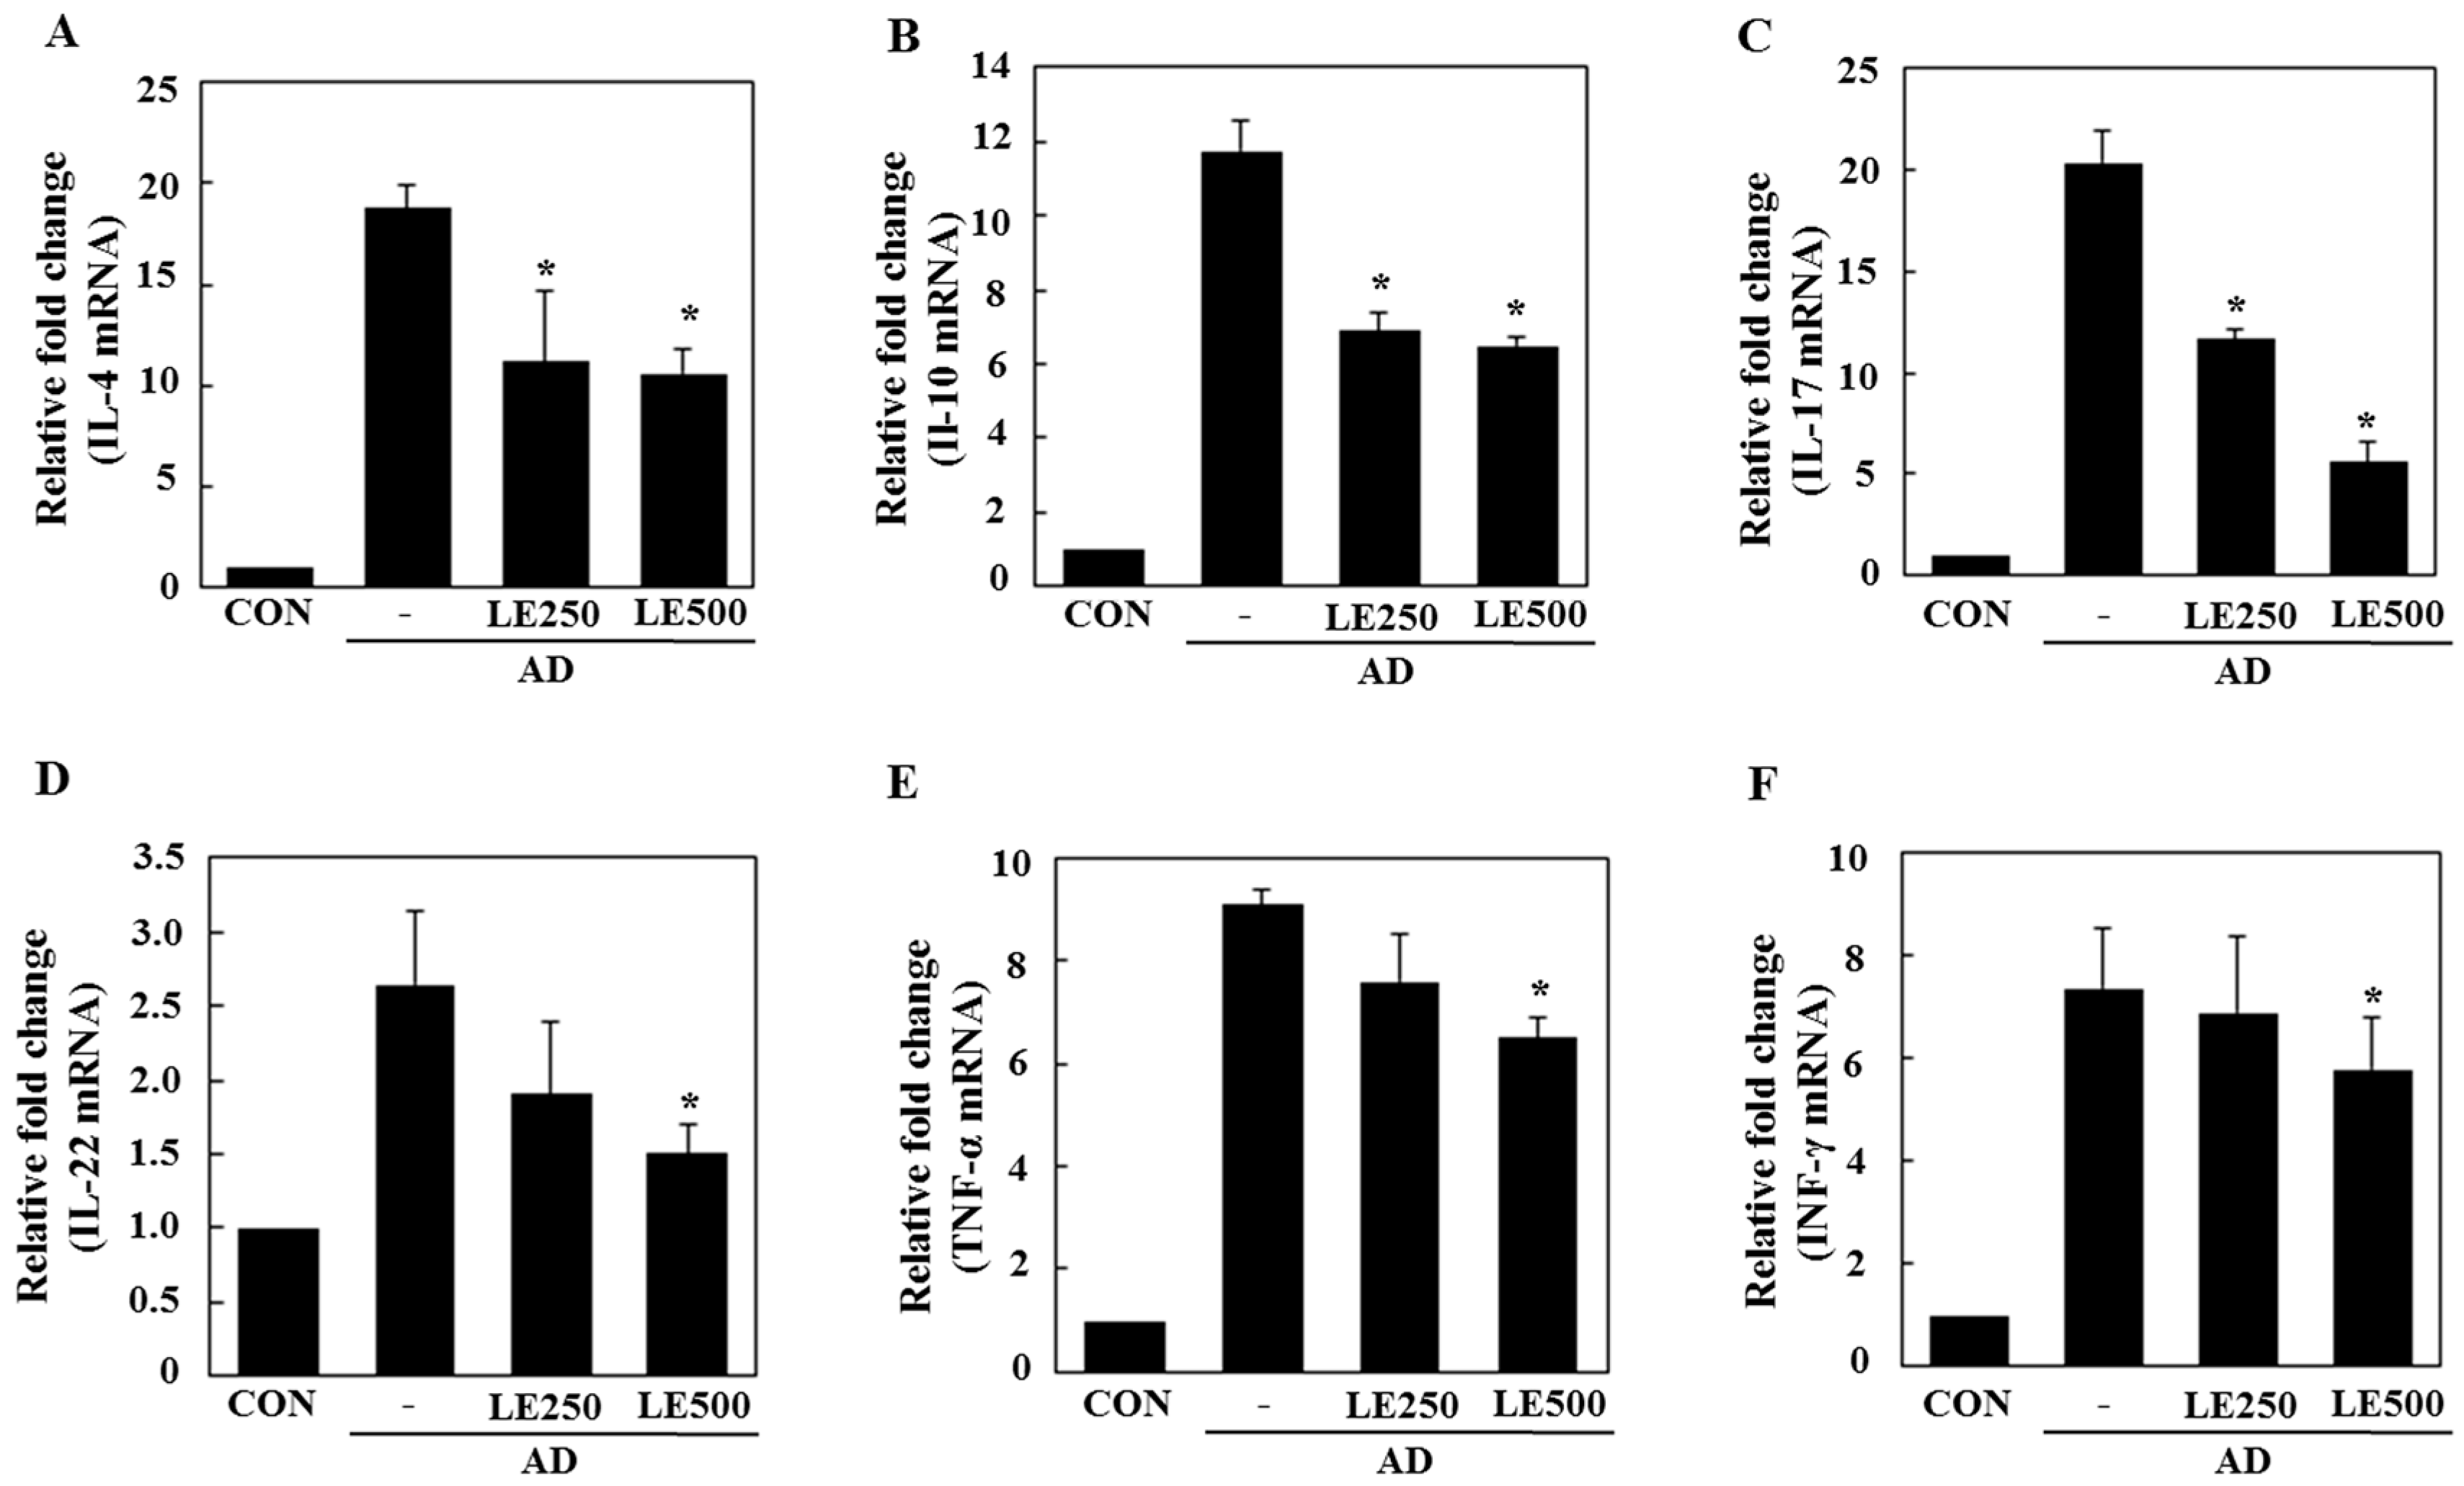
2.3. Lentinula edodes Supressed Inflammatory Cytokines in a Murine Model

In order to investigate the effects of L. edodes extract on AD, a model was established using BALB/c mice by alternately painting DFE and DNCB on both earlobes for 4 weeks [32]. As shown in Figure 3A,B, repeated topical application of DFE/DNCB significantly increased ear thickness. In addition, L. edodes extract attenuated the DFE/DNCB-induced increase in ear thickness. DFE/DNCB treatment resulted in remarkable AD lesions, including hemorrhage, edema, excoriation, and scaling that diminished in severity after treatment with L. edodes extract (Figure 3B).
Mast cells are important effectors and the primary source of histamine in AD. Therefore, we evaluated the influence of L. edodes extract on infiltration of mast cells into the ears. Treatment with L. edodes extract reduced the number of infiltrated mast cells in comparison with that induced by DFE/DNCB treatment (Figure 3C,F).
To analyze the effect of L. edodes extract on skin hypertrophy and granulocyte infiltration, sections of the ear were stained and observed under an optical microscope. Repeated DFE/DNCB exposure caused pathological changes, including thickening of the epidermis and dermis in the ear tissue of AD mice (Figure 3D,E).
Hyper-production of IgE is associated with a Th2 cellular response and is a primary characteristic of AD. In contrast, IgG2a production is associated with a Th1 response [32]. To determine whether L. edodes extract exerts its effects through a Th1 or Th2 response, serum levels of IgE (total and DFE-specific) and IgG2a were measured. Repeated application of DFE/DNCB caused an apparent elevation of total IgE and IgG2a. However, the mice treated with L. edodes extract showed significantly reduced serum levels of total IgE and IgG2a than untreated DFE/DNCB-treated mice (Figure 3G,H).
To better understand the mechanisms by which L. edodes extract alleviates the AD response, we measured mRNA expression of AD-related inflammatory cytokines in the ear tissue, cervical lymph nodes, and splenocytes by using real-time quantitative PCR. All of the tested cytokines were upregulated in the ear tissue, cervical lymph nodes, and splenocytes of AD mice in comparison to controls.
In tissue from the ear, L. edodes extract significantly inhibited the expression of Th2-related cytokines IL-4, IL-13, IL-17, IL-22, and IL-31, as well as that of TNF-α (Figure 4). In the cervical lymph nodes, L. edodes extract reduced the expression of Th2-related cytokines IL-4, IL-22, and IL-31, as well as that of TNF-α and the Th1-related cytokine, IFN-γ (Figure 5). In splenocytes, L. edodes extract markedly inhibited the expression of Th2-related cytokines IL-4, IL-10, IL-17, and IL-22, as well as that of TNF-α and the Th1-related cytokine, IFN-γ (Figure 6). It is likely that higher levels of cytokines measured in the ear than that of the cervical lymph nodes and splenocytes are attributable to the direct application of DFE and DNCB to the ear.
Th2 cytokines are highly expressed during the acute stages of AD, whereas Th1 cytokines are predominantly expressed in chronic AD [32]. Our results suggest that L. edodes extract inhibits the expression of Th1 and Th2 cytokines in the ears, cervical lymph nodes, and splenocytes, indicating that the therapeutic effects of L. edodes extract could be utilized during both the acute and chronic stages of AD.
We assessed the ability of L. edodes extract to treat AD-associated pathological lesions and modulate the immune system in BALB/c mice. Alleviation of AD symptoms and stimulation of the immune system by L. edodes extract were evaluated by measuring ear thickness, histopathological changes (including mast cell infiltration), serum IgE and IgG2a levels, and gene expression of AD-related inflammatory cytokines in the ear tissue, cervical lymph nodes, and splenocytes from DFE- and DNCB-induced AD mice and controls.
Acute AD lesions are characterized by spongiosis (epidermal intercellular edema) and hyperkeratosis (thickening of the stratum corneum), whereas chronic lesions are characterized by acanthosis (diffuse epidermal hyperplasia) and infiltration of mast cells [33]. In the present study, L. edodes extract mitigated the typical histological changes associated with AD, including increases in ear thickness, ulcers, increased epidermal thickness, epidermal hyperplasia, and infiltration of mast cells (Figure 3). Mast cells release several important signaling molecules; histamine, in particular, has potent pro-inflammatory activity [34]. In the present study, oral administration of L. edodes extract significantly reduced the severity of the typical histopathological phenomena associated with AD and the number of mast cells infiltrating the skin lesions of AD mice. These data suggest that L. edodes extract may directly inactivate mast cells associated with AD.
In AD patients, elevated total IgE and IgG2a levels are commonly detected in response to specific environmental allergens [35]. Historically, a Th1/Th2 imbalance was thought to cause AD symptoms. Th1-mediated inflammation serves to fight infections via IFN-γ, whereas Th2-associated cytokines such as IL-4 and IL-5 are involved in allergic responses and mediate IgE class switching, among other functions [36,37]. In the present study, L. edodes extract decreased levels of IL-4 and IL-31, which play an important role in Ig isotype switching. These results imply that L. edodes extract suppresses elevated serum IgE levels by decreasing the Th2 response, especially IL-4 production (Figure 4A, Figure 5A and Figure 6A). AD is associated with Th2 expansion in the skin [38]. Recently, Th17 and Th22 were identified as distinct T-cell subsets involved in the pathogenesis of various conditions, including allergic skin diseases [39,40,41,42,43]. A role for IL-17 in allergic skin disease is consistent with the observation that IL-17-deficient mice show impaired contact and delayed-type hypersensitivity responses upon sensitization and challenge with the corresponding allergen [44]. In AD patients, the number of IL-17-positive CD4+ T cells in the peripheral blood correlates well with disease severity [45]. Moreover, IL-17-positive cells infiltrate acute AD lesions [46,47]. In the skin, IL-22 induces keratinocyte proliferation and epidermal hyperplasia. The frequency of IL-22-expressing T cells in the skin of AD patients correlates well with disease severity as well [48,49]. Levels of IL-31 also correlate well with the number of Th2 cells in the skin of subjects with AD [35]. IL-31 transgenic mice developed spontaneous pruritus and hallmarks of AD skin lesions [50]. In our AD model, L. edodes extract markedly reduced serum levels of IgE and IgG2a. In addition, the expression levels of Th2-related cytokines IL-4, IL-5, IL-17, IL-22, and IL-31 as well as the pro-inflammatory cytokine, TNF-α, were lower in ear tissue from L. edodes extract treated AD mice than that of untreated AD mice (Figure 4). These results indicate that L. edodes extract suppresses Th1 and Th2 responses in AD lesions of the ear. In addition, L. edodes extract significantly inhibited the expression of TNF-α, Th1-related cytokine IFN-γ, and the Th2-related cytokines IL-4 and IL-22 in the cervical lymph nodes (Figure 5) and splenocytes (Figure 6). Previous studies have reported that some mushrooms suppress pro-inflammatory cytokines, Th1-related cytokines, and Th2-related cytokines in splenocytes [51]. Similarly, we suggest that L. edodes extract significantly inhibits the inflammatory response by blocking Th1 and Th2 cell activation in the cervical lymph nodes and splenocytes, as well as in AD lesions of the ear.

3. Materials and Methods

3.1. Materials

Cultivated L. edodes (Sanjo 701) were obtained from the National Institute of Horticultural and Herbal Science of Korea. L. edodes specimens were lyophilized and subjected to three 2-h extractions in a 70% ethanol solution. The L. edodes extract was filtered (0.25 μm) and lyophilized in a freeze dryer for 5 days. TRIzol reagent for RNA extraction was received from Invitrogen (Carlsbad, CA, USA). Primary antibodies and peroxidase-conjugated secondary antibodies were purchased from Santa Cruz Biotechnology Inc. (Santa Cruz, CA, USA). All other reagents were of the highest grade that was commercially available at the time of the study.

3.2. Analysis of Polysaccharides and Monosaccharides

The total polysaccharide content of the extract was determined by the phenol-sulfuric acid method using d-glucose as a reference [52]. For the polysaccharide analysis, 1 mg of protein-bound polysaccharides was hydrolyzed with 2 M trifluoroacetic acid (TFA) and evaporated. A high-pressure liquid chromatography system (Waters, Milford, MA, USA) with a Sugar-Pak column (Millipore, Tokyo, Japan) and a differential refractive index (RI) detector (RID-6A) was used to detect monosaccharides at 80 °C.

3.3. Analysis of Protein Content and Amino Acids

The protein concentration of the extract was determined using the Bradford method [53]. Bovine serum albumin (BSA, 0.1–1.0 mg·mL−1) was used to produce a standard calibration curve. For amino acid analysis, the extract was hydrolyzed in 6N hydrochloric acid in vacuum-sealed tubes at 110 °C for 24 h. The amino acid content of the extract was determined using an amino acid analyzer (L-8900, Hitachi, Tokyo, Japan) with post-column derivatization using ninhydrine. The amino acid analyzer conditions were as follows: ion exchange column (4.6 mm × 60 mm); injection volume, 20 μL; UV detector, VIS1: 570 nm, VIS2: 440 nm. An amino acid standard solution (016-08641, Wako, Osaka, Japan) was used for identification and quantification of amino acids.

3.4. Phytochemical Content

Total phenolic (TP) content of the extract was determined using the recently developed Fast Blue BB (FBBB) method [54]. First, the ethanolic extract was diluted with dimethyl sulfoxide (DMSO) [55,56]. TP analysis then consisted of adding 0.1 mL of 0.1% Fast Blue BB diazonium dye to 1 mL of the diluted sample, followed by the addition of 0.1 mL of 5% NaOH. After 90 min of reaction time, absorbance was measured at 420 nm with a UV/Vis spectrophotometer (UV-1650 PC, Shimadzu, Tokyo, Japan). A standard curve was generated using 15–250 μg·mL−1 gallic acid. TP content is expressed as gallic acid equivalents (GAE) per g dry weight (DW) of the extract.
The flavonoid content of the extract was determined by a colorimetric method described by Jia et al. with some modifications introduced by Barros et al. [57,58]. The extract (250 μL) was mixed with 1.25 mL of Milli-Q water (MQ, Temecula, CA, USA) and 75 μL of 5% NaNO2 solution. After 5 min, 150 μL of a 10% AlCl3 solution was added. After 6 min, 500 μL of 1 M NaOH and 275 μL of MQ were added to the mixture, which was mixed well. The intensity of the solution’s pink color was measured at 510 nm using a UV/Vis spectrophotometer (Shimadzu UV-1650 PC, Kyoto, Japan). (+)-Catechin was used to generate the standard curve (0.022–0.34 mM). Flavonoid content is expressed as mg of (+)-catechin equivalents (CEs) per g of extract.
β-Carotene and lycopene contents were determined according to the method of Nagata and Yamashita [59]. The dried ethanolic extract (100 mg) was vigorously shaken with 10 mL of an acetone-hexane mixture (4:6) for 1 min and filtered through Whatman No. 4 filter paper. Absorbance of the filtrate was measured at 453, 505, and 663 nm. The contents of β-carotene and lycopene were calculated according to the following equations: lycopene (mg per 100 mL) = −0.0458A663 + 0.372A505 − 0.0806A453; β-carotene (mg per 100 mL) = 0.216A663 − 0.304A505 + 0.452A453. The results of these analyses are expressed as μg of carotenoids g−1 of the extract.

3.5. FT-IR Spectroscopy

FT-IR spectra were obtained using an Agilent Cary 630 spectrophotometer (Agilent Technologies, Santa Clara, CA, USA) equipped with a Single Bounce Diamond ATR Module for KBr and MicroLab Software plus Resolutions Pro Software (Version 5.0, Agilent Technologies). FT-IR spectra were obtained in the 350–6300 cm−1 range at a resolution of 2 cm−1 in transmission mode.

3.6. Cell Culture

HaCaT cells were cultured in Dulbecco’s modified Eagle’s medium (DMEM) supplemented with 10% fetal bovine serum and 10 μg/100 mL penicillin/streptomycin in a 5% CO2 atmosphere at 37 °C. For analysis by PCR and western blotting, HaCaT cells were pre-incubated with TNF-α (10 ng/mL) and IFN-γ (10 ng/mL) for stimulation. After 6 h of stimulation, cells were harvested and total RNA or protein isolated.

3.7. Animals

Eight-week-old female BALB/c mice were purchased from Samtako (Osan, Korea) and housed under specific pathogen-free conditions. All experiments were approved by the Institutional Animal Care and Use Committee of Konkuk University (KU14012).

3.8. Induction of AD Lesions in the Ear

AD was induced in the mice by repeated local exposure of the ears to Dermatophagoides farinae extract (DFE; house dust mite extract) and 2,4-dinitrochlorobenzene (DNCB) as previously described [60]. For the induction of AD, the mice were divided into four groups (control, AD only, AD + L. edodes 250 mg/kg, and AD + 500 mg/kg). The surface of both earlobes was stripped five times with surgical tape (Nichiban, Tokyo, Japan). After stripping, 20 μL of 1% DNCB was painted onto each ear; 4 days later, 20 μL of DFE (10 mg/mL) was painted onto each ear. DFE or DNCB treatment was alternated once per week for 4 weeks. Animals were oral administered L. edodes (250 or 500 mg/kg) throughout the 4 weeks of DFE and DNCB treatment.
Ear thickness was measured 24 h after DNCB or DFE application with a dial thickness gauge (ID-C1012XBS, Mitutoyo Co., Kawasaki, Japan). On days 14 and 28, blood samples were collected by orbital puncture. Plasma samples were prepared from the blood samples and stored at −70 °C for further analysis. After the final blood collection, the animals were euthanized and ears, cervical lymph nodes, and splenocyte were removed. Serum immunoglobulin (Ig)E and IgG2a levels were measured on days 14 and 28 after the DFE or DNCB treatment using an IgE enzyme-linked immunoassay kit (Bethyl Laboratories, Inc., Montgomery, TX, USA) according to the manufacturer’s instructions.

3.9. Histological Observations

Excised ears were fixed in 4% paraformaldehyde for 16 h and embedded in paraffin. Thin (6 μm) sections were stained with hematoxylin and eosin (H & E). Epidermal and dermal thicknesses were measured under a microscope. For measurement of mast cell infiltration, skin sections were stained with toluidine blue, after which the number of mast cells was counted in five randomly chosen fields of view.

3.10. Analysis of mRNA Expression

For the reverse transcription polymerase (RT)-chain reaction (PCR), the total cellular RNA was isolated from the ear tissue, cervical lymph nodes, and splenocytes of each treatment group using TRIzol according to the manufacturer’s protocol [46]. The first-strand complementary DNA (cDNA) was synthesized using Superscript II reverse transcriptase (Invitrogen). The conditions for RT-PCR were similar ones that have been previously described in related studies [60].
For the quantitative PCR, real-time PCR was performed in triplicate using 12.5 μL of SYBR Premix Ex Taq (Takara, Tokyo, Japan) and 2 μL of cDNA as a template in 25 μL of final volume. PCR amplification was preceded by incubation of the mixture for 15 min at 95 °C, and 40 cycles of the amplification step. The denaturation was performed for 30 s at 95 °C; annealing was performed in a transitional temperature range from 58 to 62 °C, with an increase of 0.5 °C per cycle; and the extension was performed for 30 s at 72 °C with fluorescence detection at 72 °C after each cycle. After the final cycle, melting-point analyses of all samples were performed within the range from 65 to 95 °C with continuous fluorescence detection. Target gene mRNA levels were normalized to GAPDH levels using the following formula: relative mRNA expression = 2−(ΔCt of target gene − ΔCt of GAPDH), where Ct is the threshold cycle value. In each sample, the expression level of the analyzed gene was normalized to that of GAPDH and presented as a relative mRNA level.

3.11. Statistical Analysis

Statistical analysis was carried out using SAS statistical software (SAS Institute, Cary, NC, USA). Multiple group data were analyzed using one-way analysis of variance followed by Dunnett’s multiple range test. All results are expressed as the mean ± standard deviation of comparative fold differences. Data are representative of three independent experiments. The threshold for significance was set at p < 0.05.

4. Conclusions

In the present study, we demonstrate that L. edodes extract ameliorates the development of DFE/DNCB-induced AD symptoms in BALB/c mice by reducing the severity of pathological lesions, production of IgE, and expression of inflammatory cytokines. The evidence provided above indicates that L. edodes extract is a potential therapeutic candidate for treating patients with AD. Furthermore, our data suggest that L. edodes extract may effectively prevent the occurrence of AD; therefore, it may also be useful as a cosmetic supplement as well as neutraceutical agent.

Author Contributions

Eun-Ju Choi and Eun-Kyung Kim, both of them together performed the experiments, analyzed the data, and wrote the article. Zee-Yong Park was dedicated to writing and revising the article.

Conflicts of Interest

The authors declare no conflict of interest.

References

  1. Gry, J.; Andersson, C.; Kruger, L.; Lyran, B.; Jensvoll, L.; Matilainen, N.; Nurttila, A.; Olafsson, G.; Fabech, B. TemaNord; Nordic Council of Ministers: Copenhagen, Denmark, 2012; p. 81. [Google Scholar]
  2. Yang, Z. The Divine Farmer’s Materia Medica: A Translation of the Shen Nong Ben Cao; Blue Poppy Press: Boulder, CO, USA, 1998; p. 121. [Google Scholar]
  3. Grangeia, C.; Heleno, S.A.; Barros, L.; Martins, A.; Ferreira, I.C.F.R. Tocopherols composition of Portuguese wild mushrooms with antioxidant capacity. Food Res. Int. 2011, 44, 1029–1035. [Google Scholar] [CrossRef]
  4. Chang, S.T.; Buswell, J.A. Medicinal mushrooms—A prominent source of nutraceuticals for the 21st century. Curr. Top. Nutraceutical Res. 2003, 1, 257–280. [Google Scholar]
  5. Wani, B.A.; Bodha, R.H.; Wani, A.H. Nutritional and medicinal importance of mushrooms. J. Med. Plants Res. 2010, 4, 2598–2604. [Google Scholar]
  6. Cheung, P.C.K. Nutritional value and health benefits of mushrooms. In Mushrooms as Functional Foods; John Wiley and Sons, Inc.: New York, NY, USA, 2008; p. 71. [Google Scholar]
  7. Fan, L.; Pan, H.; Soccol, A.T.; Pandey, A.; Soccol, C.R. Advances in mushroom research in the last decade. Food Technol. Biotechnol. 2006, 44, 303–311. [Google Scholar]
  8. Lindequist, U.; Niedermeyer, T.H.S.; Julich, W.D. The pharmacological potential of mushrooms. Evid. Based Complement. Altern. Med. 2005, 2, 285–299. [Google Scholar] [CrossRef] [PubMed]
  9. Wasser, S.P.; Weis, A.L. Therapeutic effects of substances occurring in higher Basidiomycetes mushrooms: A modern perspective. Crit. Rev. Immunol. 1999, 19, 65–96. [Google Scholar] [PubMed]
  10. Jiang, T.; Luo, Z.; Ying, T. Fumigation with essential oils improves sensory quality and enhanced antioxidant ability of shiitake mushroom (Lentinus edodes). Food Chem. 2015, 172, 692–698. [Google Scholar] [CrossRef] [PubMed]
  11. Zheng, Y.; Hao, M.; Nan, H.; Jeff, I.; Zhou, Y.; Gao, Y. Relationship of chemical composition and cytotoxicity of water-soluble polysaccharides from Lentinus edodes fruiting bodies. Pak. J. Pharm. Sci. 2015, 28, 1069–1074. [Google Scholar] [PubMed]
  12. Kabir, Y.; Yamaguchi, M.; Kimura, S. Effect of shiitake (Lentinus edodes) and maitake (Grifola frondosa) mushrooms on blood pressure and plasma lipids of spontaneously hypertensive rats. J. Nutr. Sci. Vitaminol. 1987, 33, 341–346. [Google Scholar] [CrossRef] [PubMed]
  13. Bisen, P.S.; Baghel, R.K.; Sanodiya, B.S.; Thakur, G.S.; Prasad, G.B. Lentinus edodes: A macrofungus with pharmacological activities. Curr. Med. Chem. 2010, 17, 2419–2430. [Google Scholar] [CrossRef] [PubMed]
  14. Hobbs, C. Medicinal Value of Lentinus edodes (Berk.) Sing. (Agaricomycetideae). A Literature Review. Int. J. Med. Mushrooms 2000, 2, 16. [Google Scholar] [CrossRef]
  15. Kuppusamy, U.R.; Chong, Y.L.; Mahmood, A.A.; Indran, M.; Abdullah, N.; Vikineswary, S. Lentinula edodes (Shiitake) mushroom extract protects against hydrogen peroxide induced cytotoxicity in peripheral blood mononuclear cells. Indian J. Biochem. Biophys. 2009, 46, 161–165. [Google Scholar] [PubMed]
  16. Zhang, Y.; Li, S.; Wang, X.; Zhang, L.; Cheung, P.C.K. Advances in lentinan: Isolation, structure, chain conformation and bioactivities. Food Hydrocoll. 2011, 25, 196–206. [Google Scholar] [CrossRef]
  17. Aalto-Korte, K.; Susitaival, P.; KaMinska, R.; Mäkinen-Kiljunen, S. Occupational protein contact dermatitis from shiitake mushroom and demonstration of shiitake-specific immunoglobulin E. Contact Derm. 2005, 53, 211–213. [Google Scholar] [CrossRef] [PubMed]
  18. Curnow, P.; Tam, M. Contact dermatitis to Shiitake mushroom. Australas. J. Dermatol. 2003, 44, 155–157. [Google Scholar] [CrossRef] [PubMed]
  19. Ueda, A.; Obama, K.; Aoyama, K.; Ueda, T.; Xu, B.H.; Li, Q.; Huang, J.; Kitano, T.; Inaoka, T. Allergic contact dermatitis in shiitake (Lentinus edodes (Berk) Sing) growers. Contact Dermat. 1992, 26, 228–233. [Google Scholar] [CrossRef]
  20. Tarvainen, K.; Salonen, J.P.; Kanerva, L.; Estlander, T.; Keskinen, H.; Rantanen, T. Allergy and toxicodermia from shiitake mushrooms. J. Am. Acad. Dermatol. 1991, 24, 64–66. [Google Scholar] [CrossRef]
  21. Nakamura, T. Shiitake (Lentinus edodes) dermatitis. Contact Dermat. 1992, 27, 65–70. [Google Scholar] [CrossRef]
  22. Haas, N.; Vogt, R.; Sterry, W. Shiitake dermatitis: Flagellate dermatitis after eating mushrooms. Hautarzt 2001, 52, 132–135. [Google Scholar] [CrossRef] [PubMed]
  23. Adriano, A.R.; Acosta, M.L.; Azulay, D.R.; Quiroz, C.D.; Talarico, S.R. Shiitake dermatitis: The first case reported in Brazil. An. Bras. Dermatol. 2013, 88, 417–419. [Google Scholar] [CrossRef] [PubMed]
  24. Boels, D.; Landreau, A.; Bruneau, C.; Garnier, R.; Pulce, C.; Labadie, M.; de Haro, L.; Harry, P. Shiitake dermatitis recorded by French Poison Control Centers—New case series with clinical observations. Clin. Toxicol. 2014, 52, 625–628. [Google Scholar] [CrossRef] [PubMed]
  25. McNally, A.; Ross, C.; Wayte, J. Shiitake dermatitis: The tale of an under-recognised, undercooked fungus. Med. J. Aust. 2016, 204, 124–126. [Google Scholar] [CrossRef] [PubMed]
  26. Nagaoka, H. Antiallergy Agents Containing Basidiomycota Extracts. Japan Patent JP 2004067567, 4 March 2004. [Google Scholar]
  27. Shimizu, M. Medicinal Composition Comprising Dried Powder or Water Extract of Grifola frondosa for Treating Chronic Diseases. Japan Patent JP 06072889, 15 March 1994. [Google Scholar]
  28. Frankell, E.N.; Meyer, A.S. The problems of using one-dimensional methods to evaluate multifunctional food and biological antioxidants. J. Sci. Food Agric. 2000, 80, 1925–1941. [Google Scholar] [CrossRef]
  29. Becker, S.P. Antioxidant properties of various solvent extracts of total phenolic constituents from three different agroclimatic origins of drumstick tree (Moringa oleifera Lam.) leaves. J. Agric. Food Chem. 2003, 51, 2144–2155. [Google Scholar]
  30. Woldegiorgis, A.Z.; Abate, D.; Haki, G.D.; Ziegler, G.R. Antioxidant property of edible mushrooms collected from Ethiopia. Food Chem. 2014, 15, 30–36. [Google Scholar] [CrossRef] [PubMed]
  31. Mathlouthi, M.; Koenig, J.L. Vibrational spectra of carbohydrates. Adv. Carbohydr. Chem. Biochem. 1986, 44, 7–89. [Google Scholar] [PubMed]
  32. Choi, J.K.; Kim, S.H. Inhibitory effect of galangin on atopic dermatitis-like skin lesions. Food Chem. Toxicol. 2014, 68, 135–141. [Google Scholar] [CrossRef] [PubMed]
  33. Oyoshi, M.K.; Akdis, M.; Akdis, C.A. Regulation of the immune response and inflammation by histamine and histamine receptors. J. Allergy Clin. Immunol. 2011, 128, 1153–1562. [Google Scholar]
  34. Schmid-Grendelmeier, P.; Simon, D.; Simon, H.U.; Akdis, C.A.; Wuthrich, B. Epidemiology, clinical features, and immunology of the “intrinsic” (non-IgE-mediated) type of atopic dermatitis (constitutional dermatitis). Allergy 2001, 56, 841–849. [Google Scholar] [CrossRef] [PubMed]
  35. Dokmeci, E.; Herrick, C.A. The immune system and atopic dermatitis. Semin. Cutan. Med. Surg. 2008, 27, 138–143. [Google Scholar] [CrossRef] [PubMed]
  36. Homey, B.; Steinhoff, M.; Ruzicka, T.; Leung, D.Y. Cytokines and chemokines orchestrate atopic skin inflammation. J. Allergy Clin. Immunol. 2006, 118, 178–189. [Google Scholar] [CrossRef] [PubMed]
  37. Leung, D.Y.; Bhan, A.K.; Schneeberger, E.E.; Geha, R.S. Characterization of the mononuclear cell infiltrate in atopic dermatitis using monoclonal antibodies. J. Allergy Clin. Immunol. 1983, 71, 47–56. [Google Scholar] [CrossRef]
  38. Albanesi, C.; Cavani, A.; Girolomoni, G. IL-17 is produced by nickel-specific T lymphocytes and regulates ICAM-1 expression and chemokine production in human keratinocytes: Synergistic or antagonist effects with IFN-gamma and TNF-α. J. Immunol. 1999, 162, 494–502. [Google Scholar] [PubMed]
  39. Guttman-Yassky, E.; Lowes, M.A.; Fuentes-Duculan, J.; Zaba, L.C.; Cardinale, I.; Nograles, K.E.; Khatcherian, A.; Novitskaya, I.; Carucci, J.A.; Bergman, R.; et al. Low expression of the IL-23/Th17 pathway in atopic dermatitis compared to psoriasis. J. Immunol. 2008, 181, 7420–7427. [Google Scholar] [CrossRef] [PubMed]
  40. Duhen, T.; Geiger, R.; Jarrossay, D.; Lanzavecchia, A.; Sallusto, F. Production of interleukin 22 but not interleukin 17 by a subset of human skin-homing memory T cells. Nat. Immunol. 2009, 10, 857–863. [Google Scholar] [CrossRef] [PubMed]
  41. Eyerich, S.; Eyerich, K.; Pennino, D.; Carbone, T.; Nasorri, F.; Pallotta, S.; Cianfarani, F.; Odorisio, T.; Traidl-Hoffmann, C.; Behrendt, H.; et al. Th22 cells represent a distinct human T cell subset involved in epidermal immunity and remodeling. J. Clin. Investig. 2009, 119, 3573–3585. [Google Scholar] [CrossRef] [PubMed]
  42. Fischer-Stabauer, M.; Boehner, A.; Eyerich, S.; Carbone, T.; Traidl-Hoffmann, C.; Schmidt-Weber, C.B.; Cavani, A.; Ring, J.; Hein, R.; Eyerich, K. Differential in situ expression of IL-17 in skin diseases. Eur. J. Dermatol. 2012, 22, 781–784. [Google Scholar] [PubMed]
  43. Nakae, S.; Komiyama, Y.; Nambu, A.; Sudo, K.; Iwase, M.; Homma, I.; Sekikawa, K.; Asano, M.; Iwakura, Y. Antigen-specific T cell sensitization is impaired in IL-17-deficient mice, causing suppression of allergic cellular and humoral responses. Immunity 2002, 17, 375–387. [Google Scholar] [CrossRef]
  44. Koga, C.; Kabashima, K.; Shiraishi, N.; Kobayashi, M.; Tokura, Y. Possible pathogenic role of Th17 cells for atopic dermatitis. J. Investig. Dermatol. 2008, 128, 2625–2630. [Google Scholar] [CrossRef] [PubMed]
  45. Toda, M.; Leung, D.Y.; Molet, S.; Boguniewicz, M.; Taha, R.; Christodoulopoulos, P.; Fukuda, T.; Elias, J.A.; Hamid, Q.A. Polarized in vivo expression of IL-11 and IL-17 between acute and chronic skin lesions. J. Allergy Clin. Immunol. 2003, 111, 875–881. [Google Scholar] [CrossRef] [PubMed]
  46. Boniface, K.; Bernard, F.X.; Garcia, M.; Gurney, A.L.; Lecron, J.C.; Morel, F. IL-22 inhibits epidermal differentiation and induces proinflammatory gene expression and migration of human keratinocytes. J. Immunol. 2005, 174, 3695–3702. [Google Scholar] [CrossRef] [PubMed]
  47. Nograles, K.E.; Zaba, L.C.; Shemer, A.; Fuentes-Duculan, J.; Cardinale, I.; Kikuchi, T.; Ramon, M.; Bergman, R.; Krueger, J.G.; Guttman-Yassky, E. IL-22-producing “T22” T cells account for upregulated IL-22 in atopic dermatitis despite reduced IL-17-producing TH17 T cells. J. Allergy Clin. Immunol. 2009, 123, 1244–1252. [Google Scholar] [CrossRef] [PubMed]
  48. Neis, M.M.; Peters, B.; Dreuw, A.; Wenzel, J.; Bieber, T.; Mauch, C.; Krieg, T.; Stanzel, S.; Heinrich, P.C.; Merk, H.F.; et al. Enhanced expression levels of IL-31 correlate with IL-4 and IL-13 in atopic and allergic contact dermatitis. J. Allergy Clin. Immunol. 2006, 118, 930–937. [Google Scholar] [CrossRef] [PubMed]
  49. Brandt, E.B.; Sivaprasad, U. Th2 cytokines and atopic dermatitis. J. Clin. Cell. Immunol. 2011, 2, 110. [Google Scholar] [CrossRef] [PubMed]
  50. Park, H.S.; Hwang, Y.H.; Kim, M.K.; Hong, G.E.; Lee, H.J.; Nagappan, A.; Yumnam, S.; Kim, E.H.; Heo, J.D.; Lee, S.J.; et al. Functional polysaccharides from Grifola frondosa aqueous extract inhibit atopic dermatitis-like skin lesions in NC/Nga mice. Biosci. Biotechnol. Biochem. 2015, 79, 147–154. [Google Scholar] [CrossRef] [PubMed]
  51. Ukawa, Y.; Izumi, Y.; Ohbuchi, T.; Takahashi, T.; Ikemizu, S.; Kojima, Y. Oral administration of the extract from Hatakeshimeji (Lyophyllum decastes sing.) mushroom inhibits the development of atopic dermatitis-like skin lesions in NC/Nga mice. J. Nutr. Sci. Vitaminol. 2007, 53, 293–296. [Google Scholar] [CrossRef] [PubMed]
  52. Du Bois, M.; Gilles, K.A.; Hamitton, J.K.; Reders, P.A.; Smith, F. Colorimetric Method for Determination of Sugars and Related Substances. Anal. Chem. 1956, 28, 350–356. [Google Scholar] [CrossRef]
  53. Bradford, M.M. A rapid and sensitive method for the quantitation of microgram quantities of protein utilizing the principle of protein-dye binding. Anal. Biochem. 1976, 72, 248–254. [Google Scholar] [CrossRef]
  54. Medina, M.B. Determination of the total phenolics in juices and superfruits by a novel chemical method. J. Funct. Foods 2011, 3, 79–87. [Google Scholar] [CrossRef]
  55. Lester, G.E.; Lewers, K.S.; Medina, M.B.; Saftner, R.A. Comparative analysis of strawberry total phenolics via Fast Blue BB vs. Folin–Ciocalteu: Assay interference by ascorbic acid. J. Food Compos. Anal. 2012, 27, 102–107. [Google Scholar] [CrossRef]
  56. Jin, C.W.; You, G.Y.; He, Y.F.; Tang, C.; Wu, P.; Zheng, S.J. Iron deficiency-induced secretion of phenolics facilitates the reutilization of root apoplastic iron in red clover. Plant Physiol. 2007, 144, 278–285. [Google Scholar] [CrossRef] [PubMed]
  57. Jia, Z.; Tang, M.; Wu, J. The determination of flavonoid content in mulberry and their scavenging effects on superoxide radicals. Food Chem. 1999, 64, 555–559. [Google Scholar]
  58. Barros, L.; Baptista, P.; Ferreira, I.C.F.R. Effect of Lactarius piperatus fruiting body maturity stage on antioxidant activity measured by several biochemical assays. Food Chem. Toxicol. 2007, 45, 1731–1737. [Google Scholar] [CrossRef] [PubMed]
  59. Nagata, M.; Yamashita, I. Simple method for simultaneous determination of chlorophyll and carotenoids in tomato fruits. Nippon Shokuhin Kogyo Gakkaishi 1992, 39, 925–928. [Google Scholar] [CrossRef]
  60. Kim, S.H.; Kim, E.K.; Choi, E.J. High-intensity swimming exercise increases dust mite extract and 1-chloro-2,4-dinitrobenzene-derived atopic dermatitis in BALB/c mice. Inflammation 2014, 37, 1179–1185. [Google Scholar] [CrossRef] [PubMed]
  • Sample Availability: Not available.
Figure 1. FT-IR spectrum of a crude Lentinula edodes ethanolic extract.
Molecules 21 00993 g001
Figure 2. HaCaT cells were pre-incubated with TNF-α (10 ng/mL) and IFN-γ (10 ng/mL) to stimulate the cells. After 6 h of stimulation, cells were harvested and total RNA was isolated. Gene expression levels of pro-inflammatory cytokines (TNFα, CCL17, IL-1β, and IL-6) were measured by conventional PCR (A); After 6 h of stimulation, cells were harvested and total protein was isolated. Phosphorylation of ERK1/2 (B) and JNK (D) was inhibited by treatment with L. edodes extract, but that of p38 was not (C). The results provided are representative of three independent experiments. * CSA, cyclosporine A (1 μg/mL); +, treatment; −, no treatment.
Molecules 21 00993 g002
Figure 3. Histopathological and serum analysis to assess the effects of L. edodes extract on ear thickness and mast cell infiltration. Ear thickness was measured with a dial thickness gauge every 3 days after 2,4-dinitrochlorobenzene (DNCB) or Dermatophagoides farinae extract (DFE) application (A); Representative photomicrographs of ear sections stained with hematoxylin and eosin (B) or toluidine blue (C); epidermal (D) and dermal (E) thickness was measured using microphotographs of hematoxylin and eosin stained tissue; (F) The number of infiltrated mast cells was determined on the basis of toluidine blue staining. Blood samples were collected by orbital puncture at day 28. Plasma IgE (G) and IgG2a (H) levels were quantified by enzyme-linked immunosorbent assay. Data are presented as the mean ± SD of triplicate determinations. * Significant difference from the value of the DFE/DNCB-treated mice at p < 0.05. AD, atopic dermatitis induced by DFE and DNCB treatment. The pictures shown are representative of each group (n = 3–6). The original magnification was 100×. CON, control; L. edodes, Lentinula edodes; AD, atopic dermatitis.
Molecules 21 00993 g003
Figure 4. Effect of L. edodes extract on the expression of various cytokines in the ear. The ears were excised on day 28 and total RNA was isolated. Quantitative real-time polymerase chain reaction was performed as described in the Materials and Methods. The relative fold change in mRNA for IL-4 (A); IL-13 (B); IL-17 (C); IL-22 (D); IL-31 (E); and TNFα (F) are shown. Data are presented as the mean ± SD of triplicate determinations. * Significantly different from the value of the DFE/DNCB-treated mice at p < 0.05. DFE, Dermatophagoides farinae extract; DNCB, 2,4-dinitrochlorobenzene; AD, atopic dermatitis induced by DFE and DNCB treatment.
Molecules 21 00993 g004
Figure 5. Effect L. edodes extract on the expression of various cytokines in the cervical lymph nodes. The cervical lymph node was excised on day 28 and total RNA was isolated. Quantitative real-time polymerase chain reaction was performed as described in the Materials and Methods. The relative fold change in mRNA for IL-4 (A); IL-22 (B); IL-31 (C); TNF-α (D); and INF-γ (E) are shown. Data are presented as the mean ± SD of triplicate determinations. * Significantly different from the value of the DFE/DNCB-treated mice at p < 0.05. DFE, Dermatophagoides farinae extract; DNCB, 2,4-dinitrochlorobenzene; AD, atopic dermatitis induced by DFE and DNCB treatment.
Molecules 21 00993 g005
Figure 6. Effect of L. edodes extract on the expression of various cytokines in the splenocytes. The splenocytes were separated from spleen on day 28 and total RNA was isolated. Quantitative real-time polymerase chain reaction was performed as described in the Materials and Methods. The relative fold change in mRNA for IL-4 (A); IL-10 (B); IL-17 (C); IL-22 (D); TNF-α (E); and INF-γ (F) are shown. Data are presented as the mean ± SD of triplicate determinations. * Significantly different from the value of the DFE/DNCB-treated mice at p < 0.05. DFE, Dermatophagoides farinae extract; DNCB, 2,4-dinitrochlorobenzene; AD, atopic dermatitis induced by DFE and DNCB treatment.
Molecules 21 00993 g006
Table 1. Carbohydrates, monosaccharide, total protein, amino acid, and selected phytochemical content in L. edodes ethanolic extract.
ComponentsContent
Total carbohydrates (μg/g)151.43 ± 1.05
Monosaccharides (μg/mL)Arabinose2.57 ± 0.17
Galactose1.83 ± 0.19
Glucose127.78 ± 1.32
Mannose4.27 ± 0.53
Xylose2.5 ± 0.51
Total protein (μg/g)205.17 ± 1.44
Amino acids (g/100 g)Asp0.4725
Thr0.4435
Ser0.3789
Glu2.8103
Pro0.1789
Gly0.3781
Ala0.6621
Val0.3696
Ile0.0963
Leu0.1554
Tyr0.0711
Phe0.1393
Lys0.4127
His0.1611
Arg0.3783
Cys0.5109
Met0.0284
PhytochemicalsPolyphenols (mg/g)6.12 ± 0.04
Flavonoids (mg/g)1.76 ± 0.22
β-Carotene (μg/g)28.75 ± 0.25
Lycopene (μg/g)5.25 ± 0.04

