1. Introduction
Scrophulariae Radix (Xuanshen in Chinese), derived from the dried root of
Scrophularia ningpoensis Hemsl., is one of the most popular traditional Chinese medicines (TCMs), and is officially documented in the Chinese Pharmacopoeia. It has been used for thousands of years in China for its excellent traditional therapeutic effects on blood cooling, yin nourishing, fire purging, and toxin removal [
1]. Modern pharmacological studies and clinical practice demonstrated that it possesses anti-angiogenesis [
2], ventricular remodeling [
3,
4], anti-inflammatory [
5], and antimicrobial [
6] activities, and can be used for the treatment of rheumatism, pharyngalgia, arthritis, constipation, and conjunctival congestion [
7]. Phytochemical investigation has revealed that Scrophulariae Radix mainly contains several types of constituents, such as iridoid glycosides, phenylpropanoid glycosides, and organic acids [
8,
9,
10,
11]. A recent research proved that these constituents contained in Scrophulariae Radix could exhibit various biological activities, including inhibiting macrophage functions involved in the inflammatory process and antioxidative activity for reducing the oxidized OH adducts of dAMP and dGMP [
12,
13,
14,
15], enhancing immune activity [
16], protecting the liver [
17], and decreasing levels of hyaluronic acid [
18]. The synergistic action of these various components is considered to be responsible for the therapeutic effects of Scrophulariae Radix.
A variety of analytical methods, including high-performance liquid chromatography [
19,
20,
21,
22], capillary electrophoresis [
23], and ultra-performance liquid chromatography [
24,
25] were established for analyzing chemical constituents of Scrophulariae Radix, but these methods only focused on the determination of iridoid glycosides and/or phenylpropanoid glycosides. There is no method for simultaneous determination of iridoid glycosides, phenylpropanoid glycosides, and organic acids. It is well known that the content of a few index compounds might not accurately reflect the quality of the complex herbal products. Therefore, it was necessary to develop a rapid and sensitive method to simultaneously determine iridoid glycosides, phenylpropanoid glycosides, and organic acids for the quality control of Scrophulariae Radix. The developed ultra high performance liquid chromatography coupled with triple quadrupole-linear ion trap mass spectrometry (UPLC-QTRAP-MS/MS) method is highly sensitive, strongly selectivity, quantitatively accurate, and results in fast analysis. Compared with the HPLC method, the developed method has the advantages of good separation efficiency, high peak capacity, and high sensitivity, which is more suitable for the separation and analysis of the complex systems of traditional Chinese medicines (TCMs). UPLC-QTRAP-MS/MS uses multiple reaction monitoring (MRM) for quantitative analysis, and the neutral fragment scan is used for the target material. It can solve the problem that the UPLC method is difficult to separate the complex systems. Not only does the quadrupole linear ion trap system retain all of the traditional functions of the standard triple quadrupole but, also in the linear ion trap (LIT) mode, the QTRAP system can improve the sensitivity of the full scan mode, enhance the ion scan (EPI), and provide the multipole ion scan (MS
3) functions [
26,
27,
28].
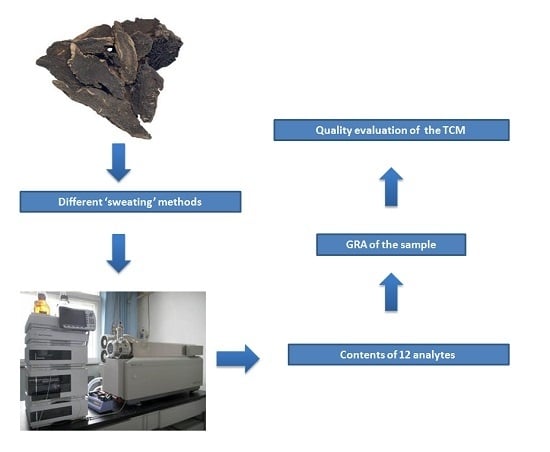
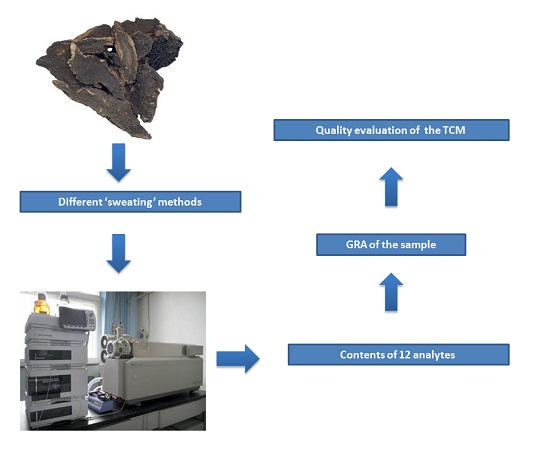
Primary processing of Scrophulariae Radix is an important link which closely relates to the quality of products in this TCM. According to the Chinese Pharmacopoeia (2015), Scrophulariae Radix needs to be processed by ‘sweating’ methods. ‘Sweating’ is a traditional technology for primary processing of Chinese herbal medicine, which was derived from long-term practices and experiences. A Chinese herbal medicine was baked with a micro fire to semi-dry, or micro cooked and micro steamed, then was piled up to sweat to make the internal moisture spillover during the procedure of processing. The ‘sweating’ process makes the Chinese herbal medicine become soft and change color to increase fragrance or reduce irritation, which is conducive to drying. However, due to the difference of ‘sweating’ methods during primary processing, the variation of effective components contained in this TCM is large, and its quality is uneven. The key to the manufacturing procedure of Scrophulariae Radix is how to ensure its high and uniform quality.
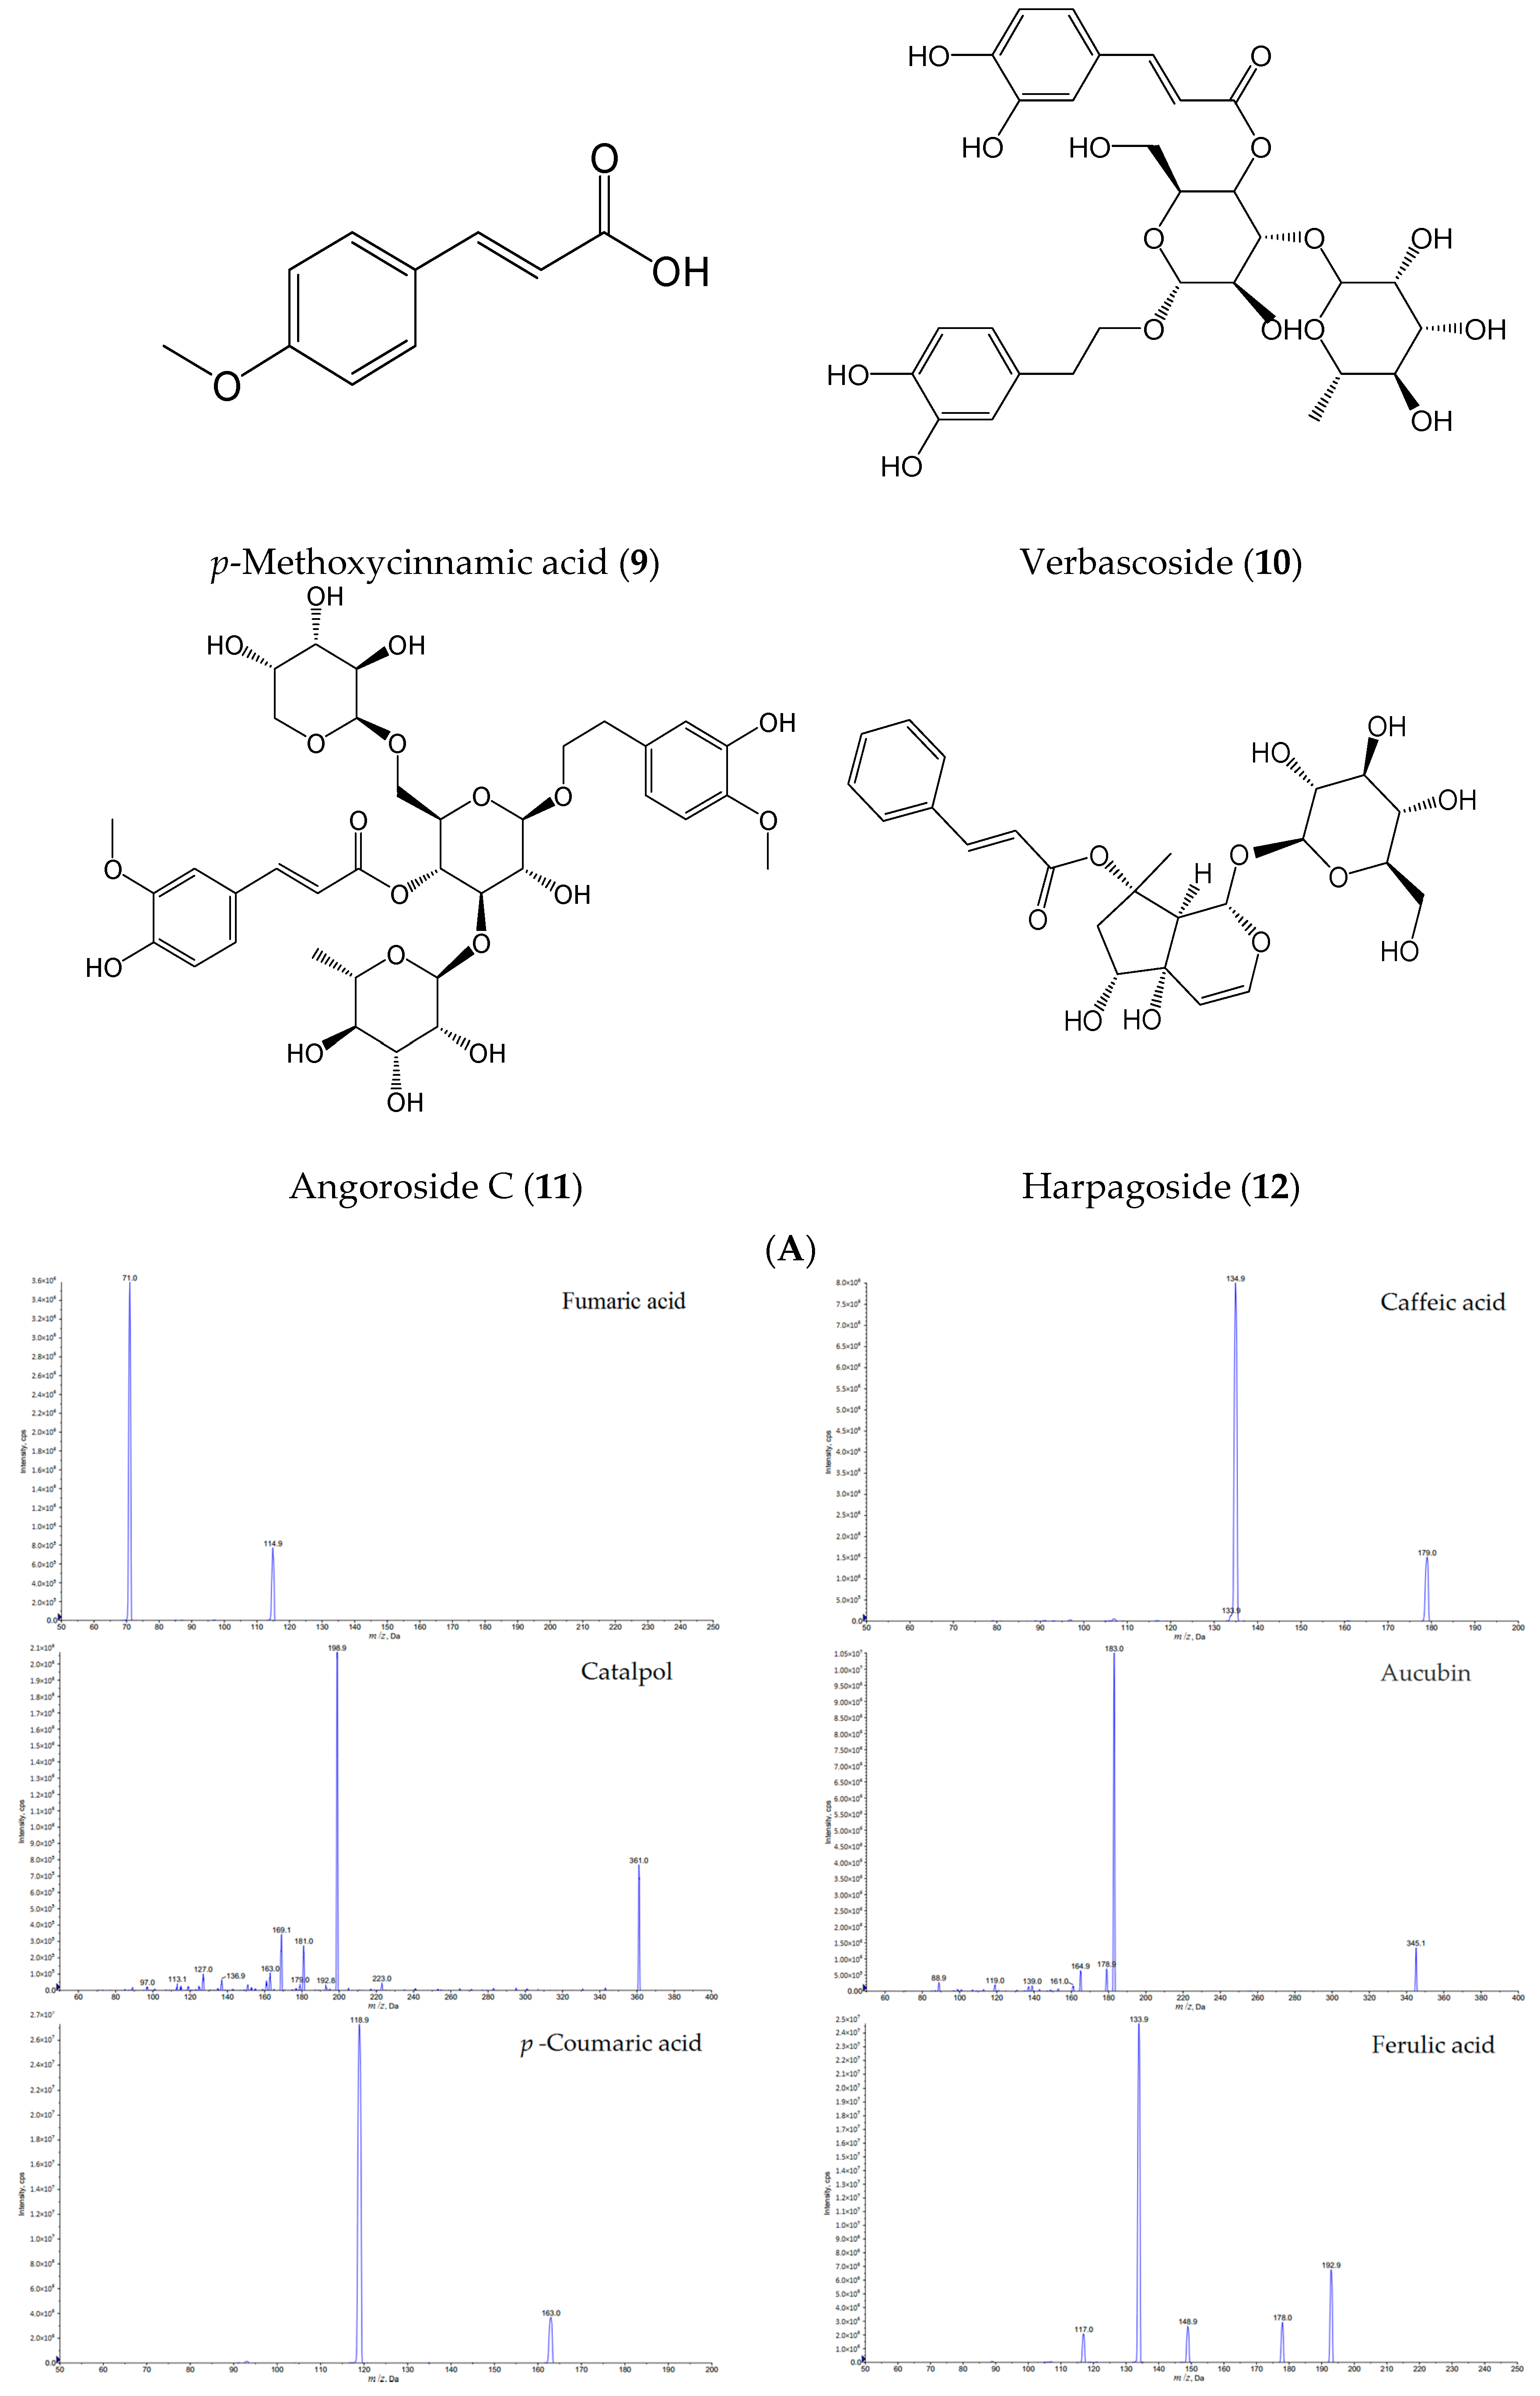
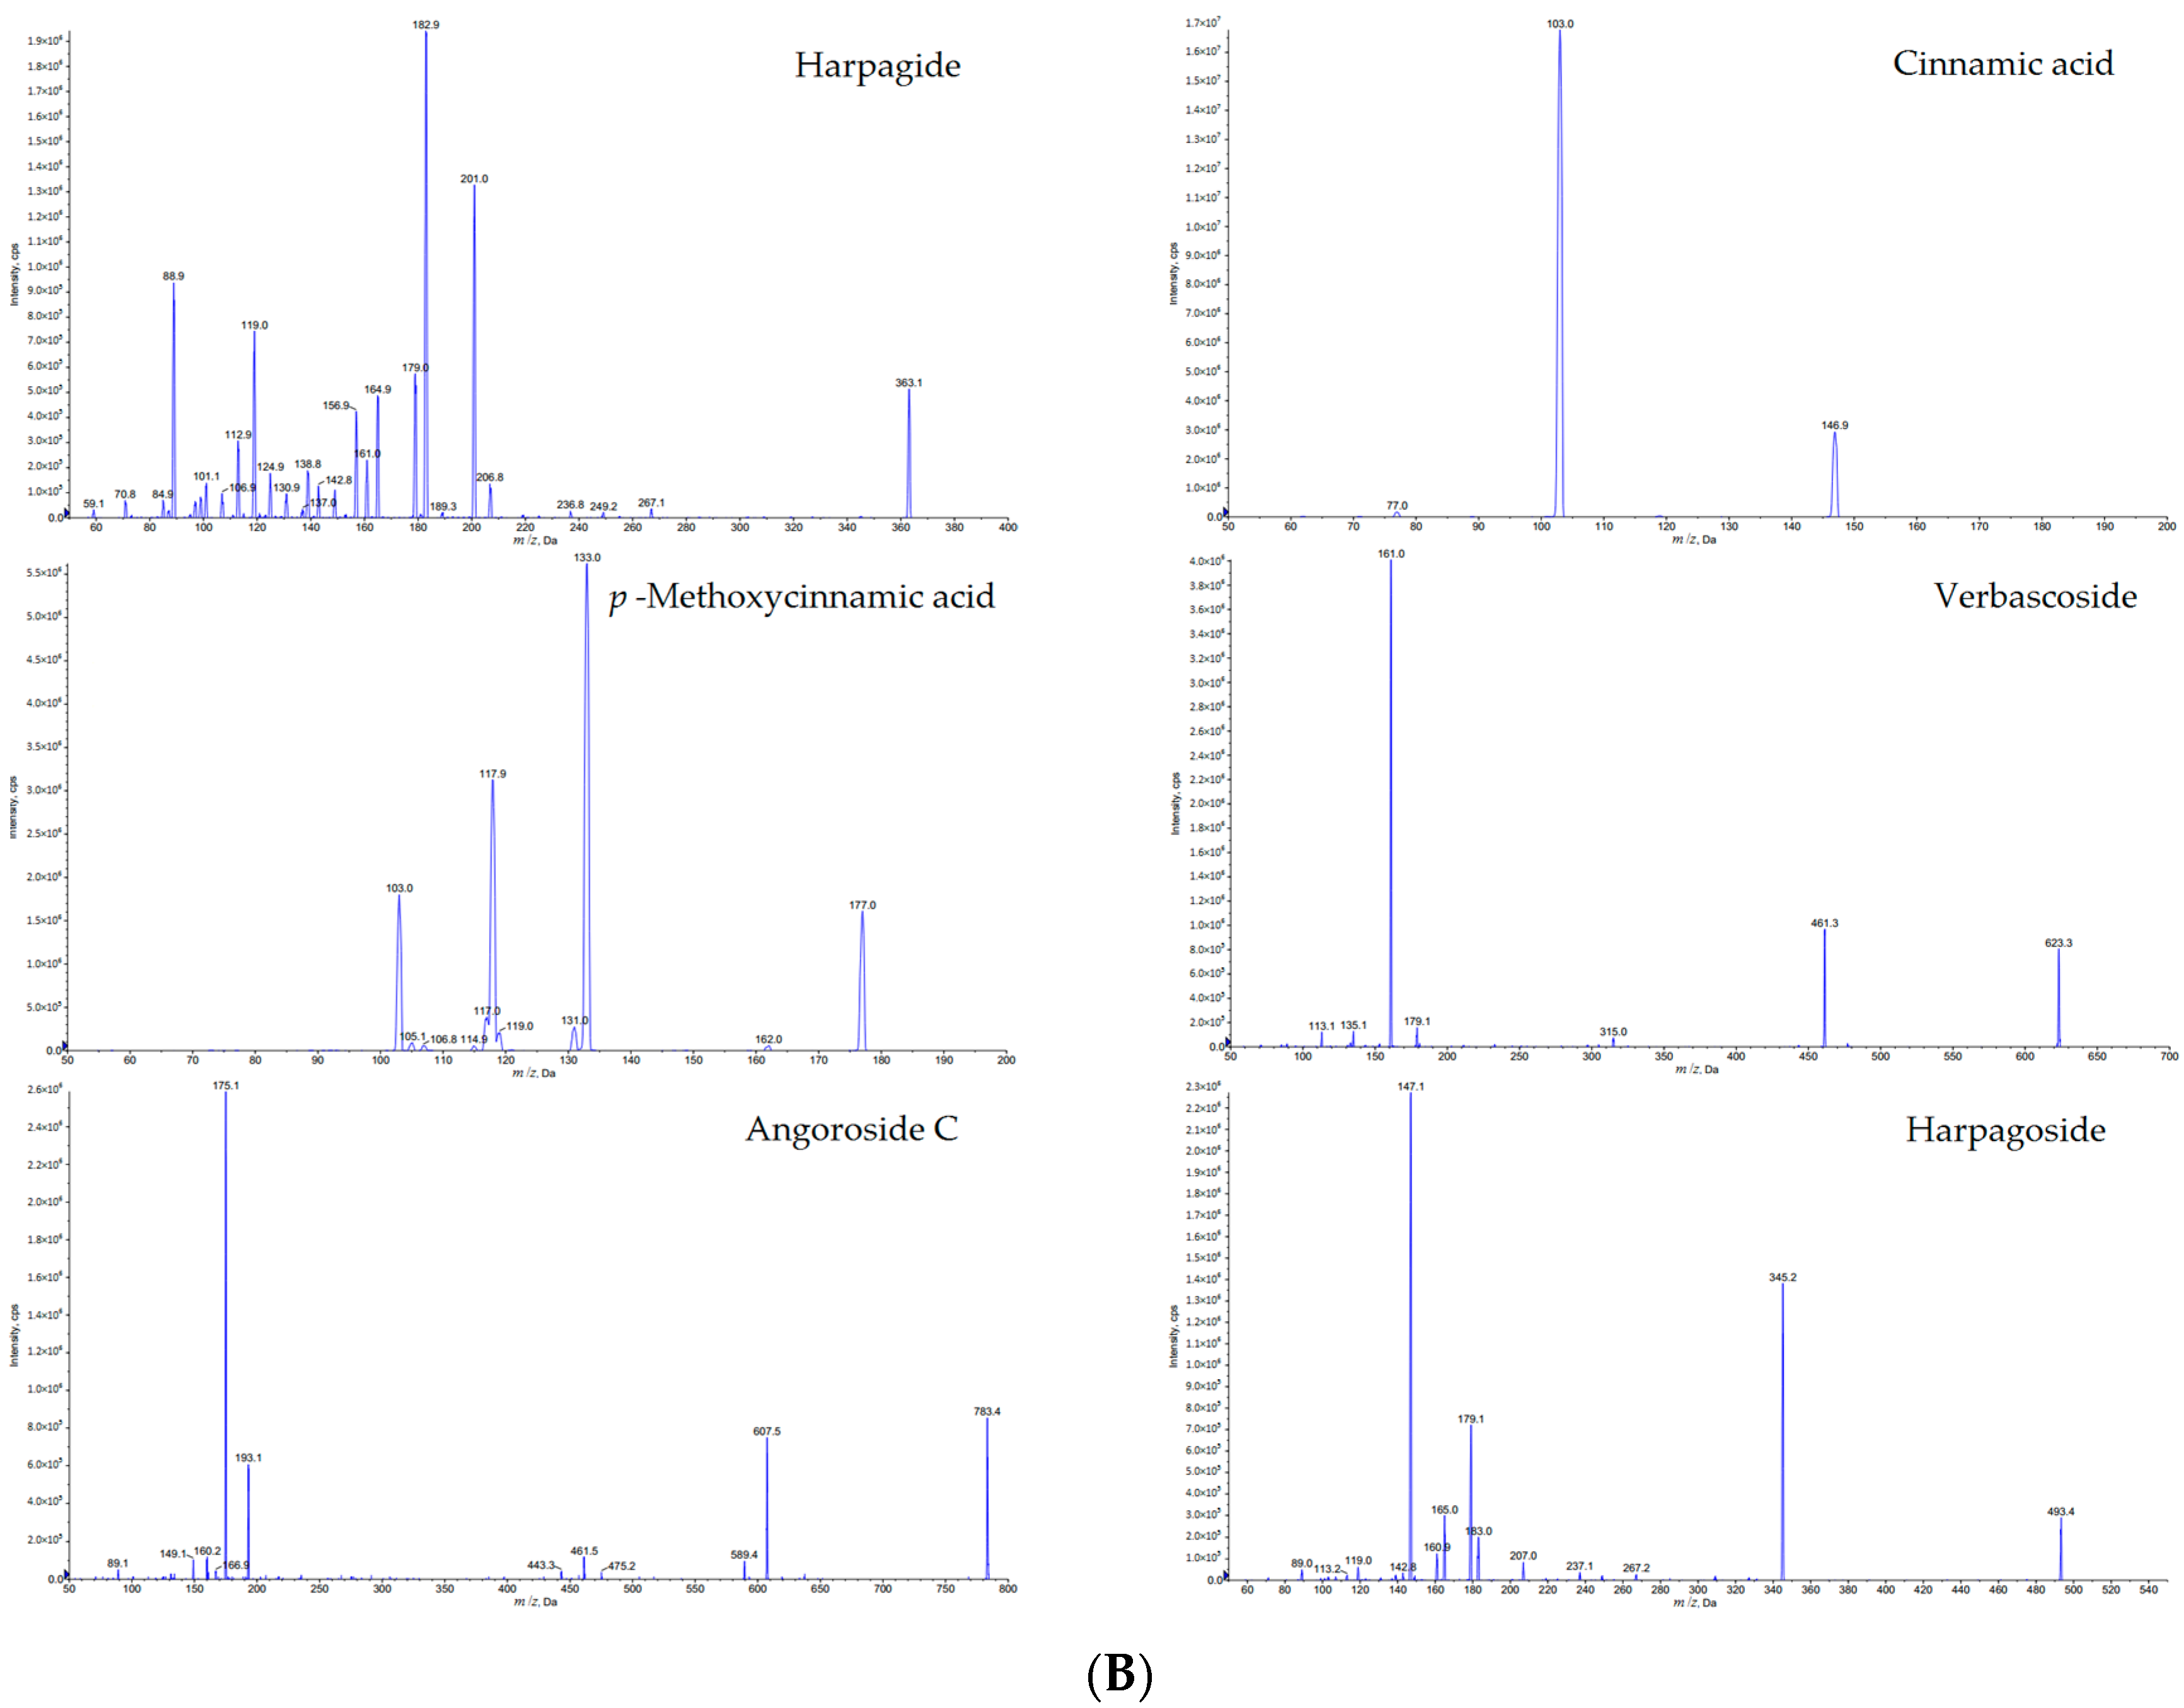
The aim of this paper was to evaluate the quality of Scrophulariae Radix processed by different ‘sweating’ methods based on simultaneous determination of iridoid glycosides (harpagide, harpagoside, catalpol, and aucubin), phenylpropanoid glycosides (angoroside C, verbascoside), and organic acids (fumaric acid, caffeic acid, p-coumaric acid, ferulic acid, cinnamic acid, and p-methoxycinnamic acid) in this TCM. Combined with grey relational analysis. UPLC-QTRAP-MS/MS was successfully applied to analyze twelve samples processed by different ‘sweating’ methods. Furthermore, grey relational analysis (GRA) was performed to evaluate the ‘sweating’ processed samples according to the contents of twelve constituents.
3. Materials and Methods
3.1. Chemicals and Reagents
The chemical standards harpagide (
1), harpagoside (
2), ferulic acid (
3), catalpol (
4), aucubin (
5), cinnamic acid (
6) , and caffeic acid (
7) were purchased from the Chinese National Institute of Control of Pharmaceutical and Biologiceal Products (Beijing, China); angoroside C (
8) was purchased from Chengdu Chroma-Biotechnology Co., Ltd. (Chengdu, China); verbascoside (
9) was purchased from Shanghai Yongye-Biotechnology Co., Ltd. (Shanghai, China);
p-Coumaric acid (
10) and
p-methoxycinnamic acid (
11) were purchased from Shanghai Yuanye-Biotechnology Co., Ltd. (Shanghai, China); fumaric acid (
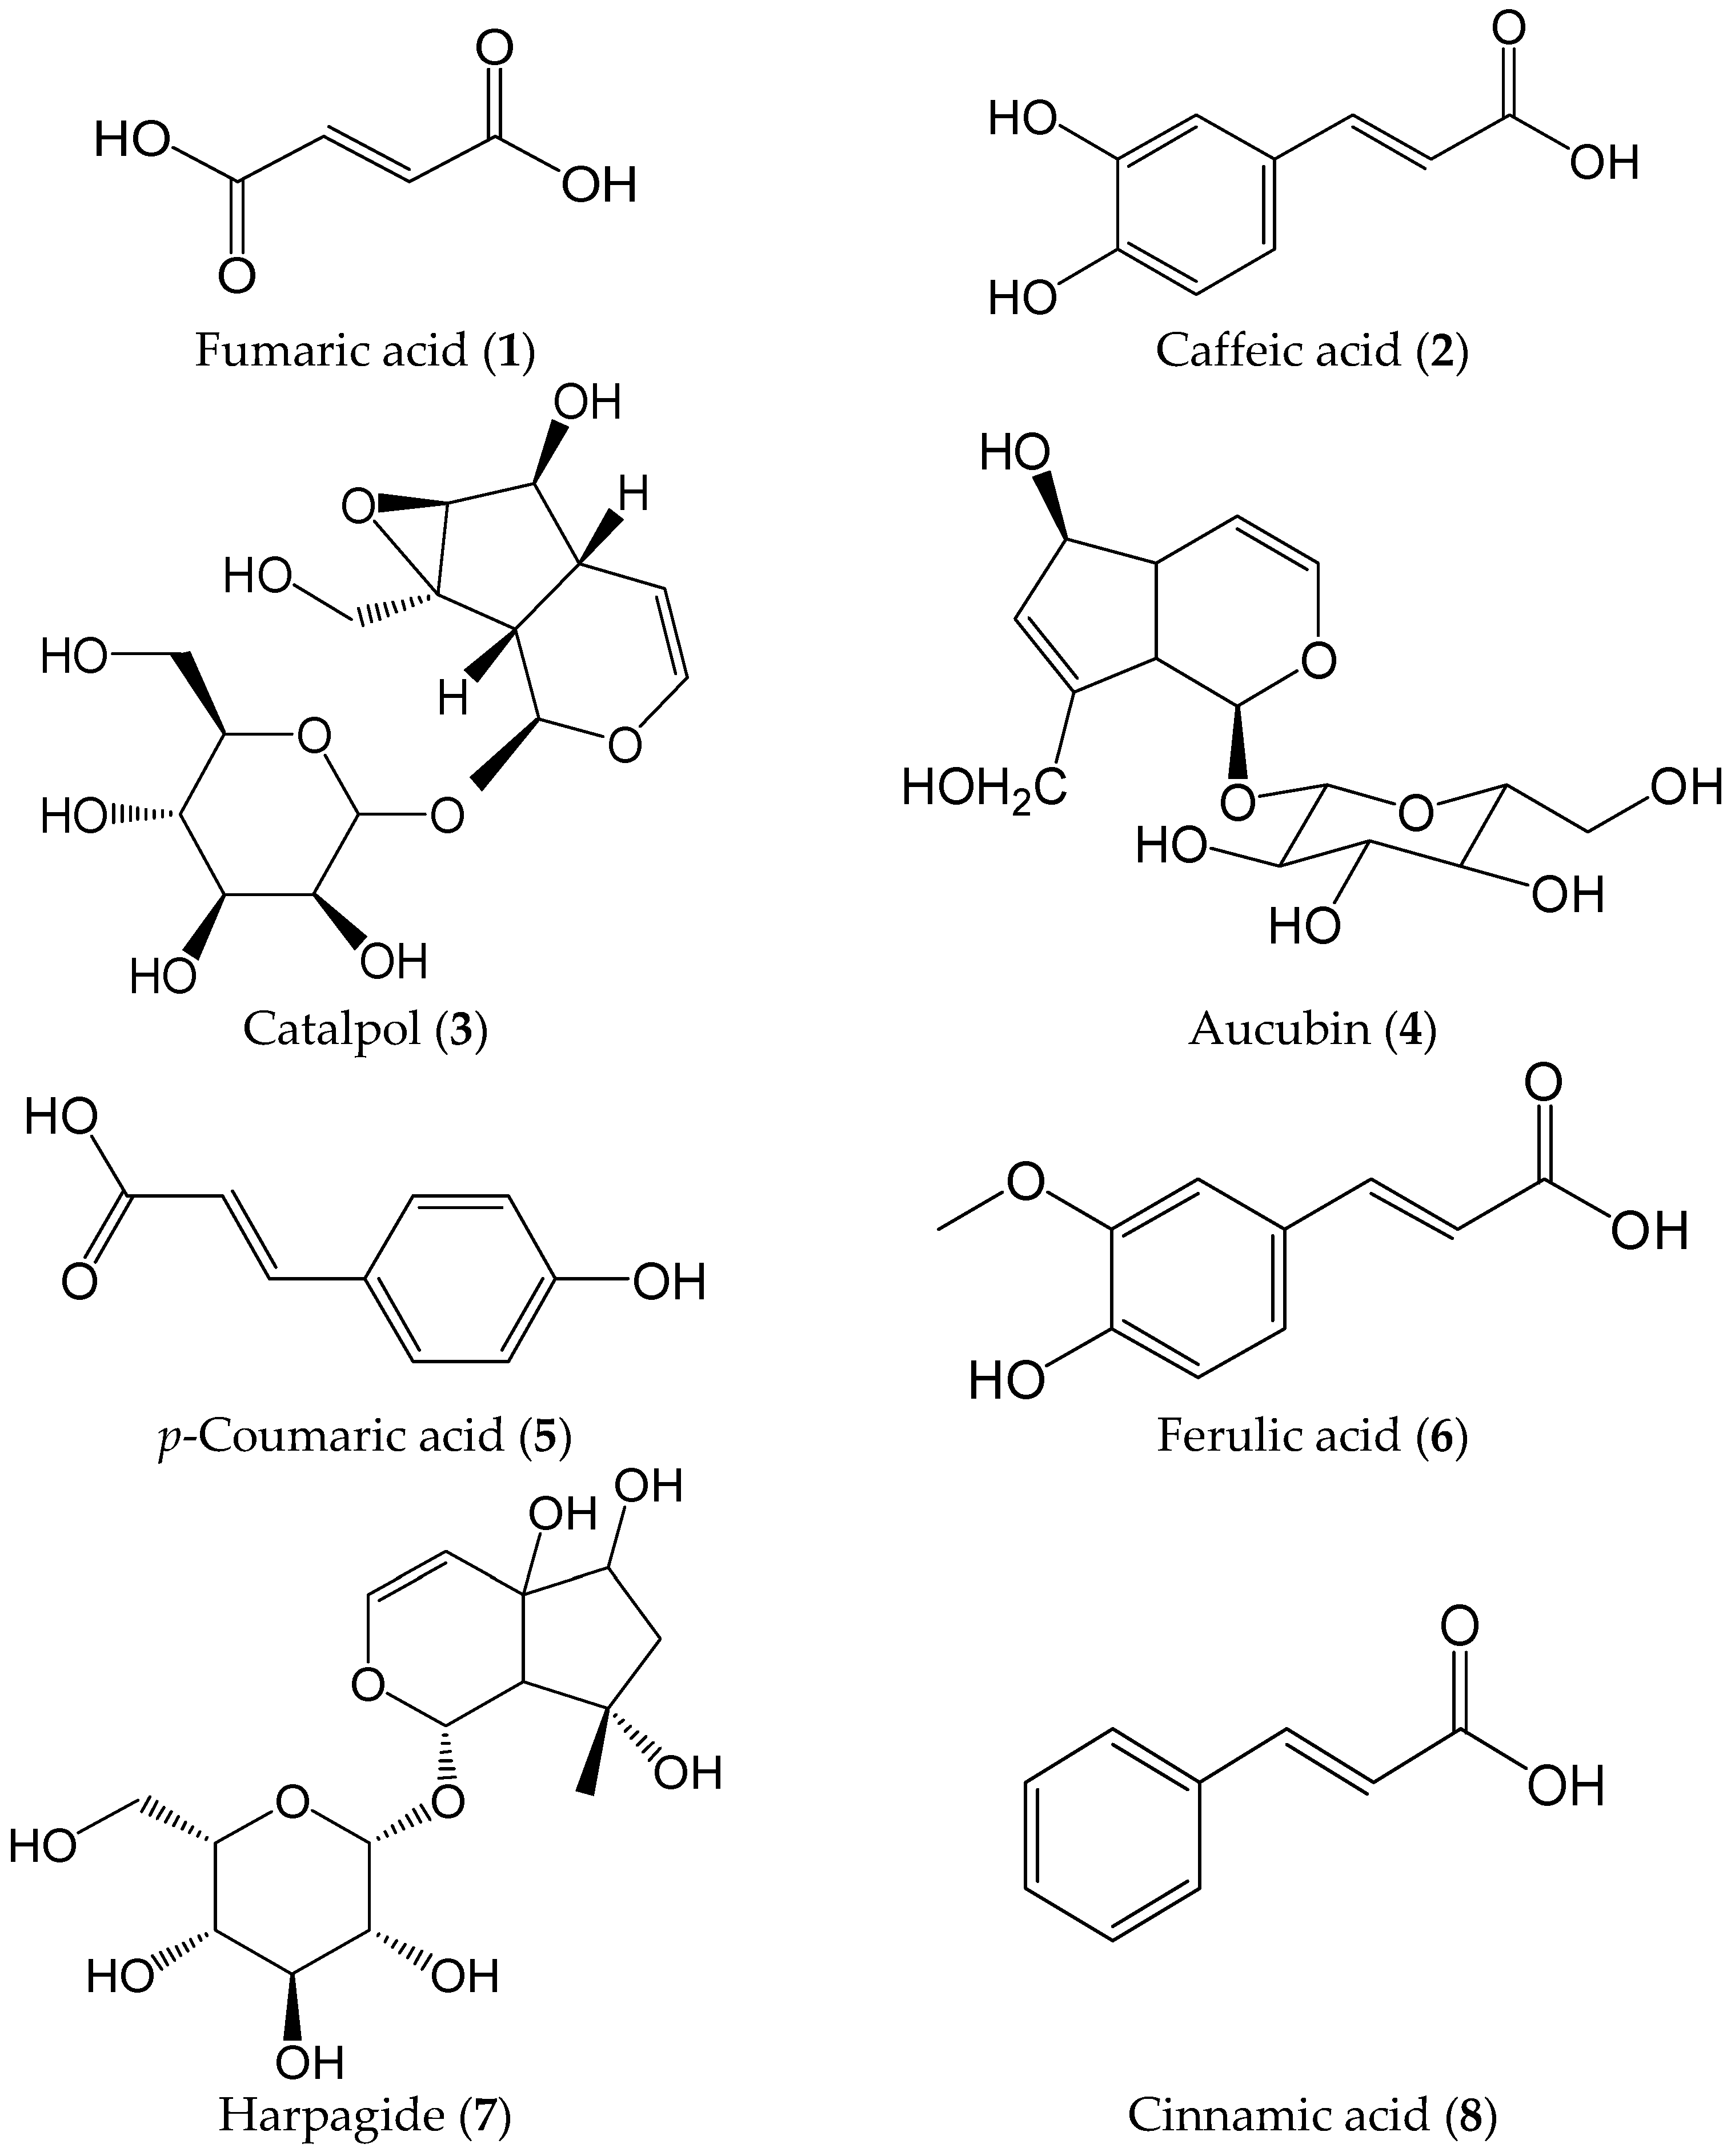
12) was purchased from Sinopharm chemical reagent Co., Ltd. (Nanjing, China). The purity of all chemical standards is greater than 99% (
Figure 2). Methanol and acetonitrile of HPLC grade were purchased from Merck (Damstadt, Germany). Ultrapure water was prepared using a Milli-Q purifying system (Millipore, Bedford, MA, USA) under a resistivity of 18.2 MΩ/cm, other reagent solutions were analytical grade (Sinopharm Chemical Reagent Co., Ltd., Shanghai, China).
3.2. Plant Materials
The roots of
Scrophularia ningpoensis were collected from Jinyun in Zhejiang Province, China in November 2014. The botanical origin of the materials was identified by Professor Xunhong Liu (Department for Authentication of Chinese Medicines, Nanjing University of Chinese Medicine, China), and the voucher specimens were deposited at the Herbarium in Nanjing University of Chinese Medicine, China. The procedure of ‘sweating’ is as follows: remove the rhizome, germ, fibrous root, and sediment from the fresh herb, dry to semi-dry the product, put the Scrophulariae Radix into the black bag for several days as the first ‘sweating’; then take out the Scrophulariae Radix from the black bag, dry to semi-dry the product, put the Scrophulariae Radix into the black bag for several days as the second ‘sweating’; then take out the Scrophulariae Radix from the black bag, dry to semi-dry the product, put the Scrophulariae Radix into the black bag for several days as the third ‘sweating’; then take out the Scrophulariae Radix from the black bag, dry to totally dry the final product. The detailed information of twelve samples processed by different ‘sweating’ methods was summarized in
Table 7.
3.3. Preparation of Standard Solutions
A mixed standard stock solution containing the twelve reference compounds 1–12 was prepared by dissolving them in methanol and their concentrations were as follows: 1, 709.00 μg/mL; 2, 22.25 μg/mL; 3, 175.50 μg/mL; 4, 914.00 μg/mL; 5, 53.00 μg/mL; 6, 128.00 μg/mL; 7, 569.00 μg/mL; 8, 126.80 μg/mL; 9, 426.00 μg/mL; 10, 1744.00 μg/mL; 11, 470.00 μg/mL; and 12, 198.00 μg/mL. This solution was then diluted with methanol to a series of appropriate concentrations for construction of calibration curves. All of the solutions were stored at 4 °C and were filtered through a 0.22 μm membrane (Jinteng laboratory equipment Co., Ltd., Tianjing, China) prior to injection.
3.4. Preparation of Sample Solutions
One gram of Scrophulariae Radix powder, after passing through a 40 mesh sieve, was weighed accurately and ultrasonically extracted with 20 mL 70% (v/v) methanol for 60 min. The extract solution was cooled at room temperature and subsequently centrifuged at 12,000 rpm for 10 min. All of the solutions were stored at 4 °C and filtered through a 0.22 μm membrane prior to injection.
3.5. Chromatographic and Mass Spectrometric Conditions
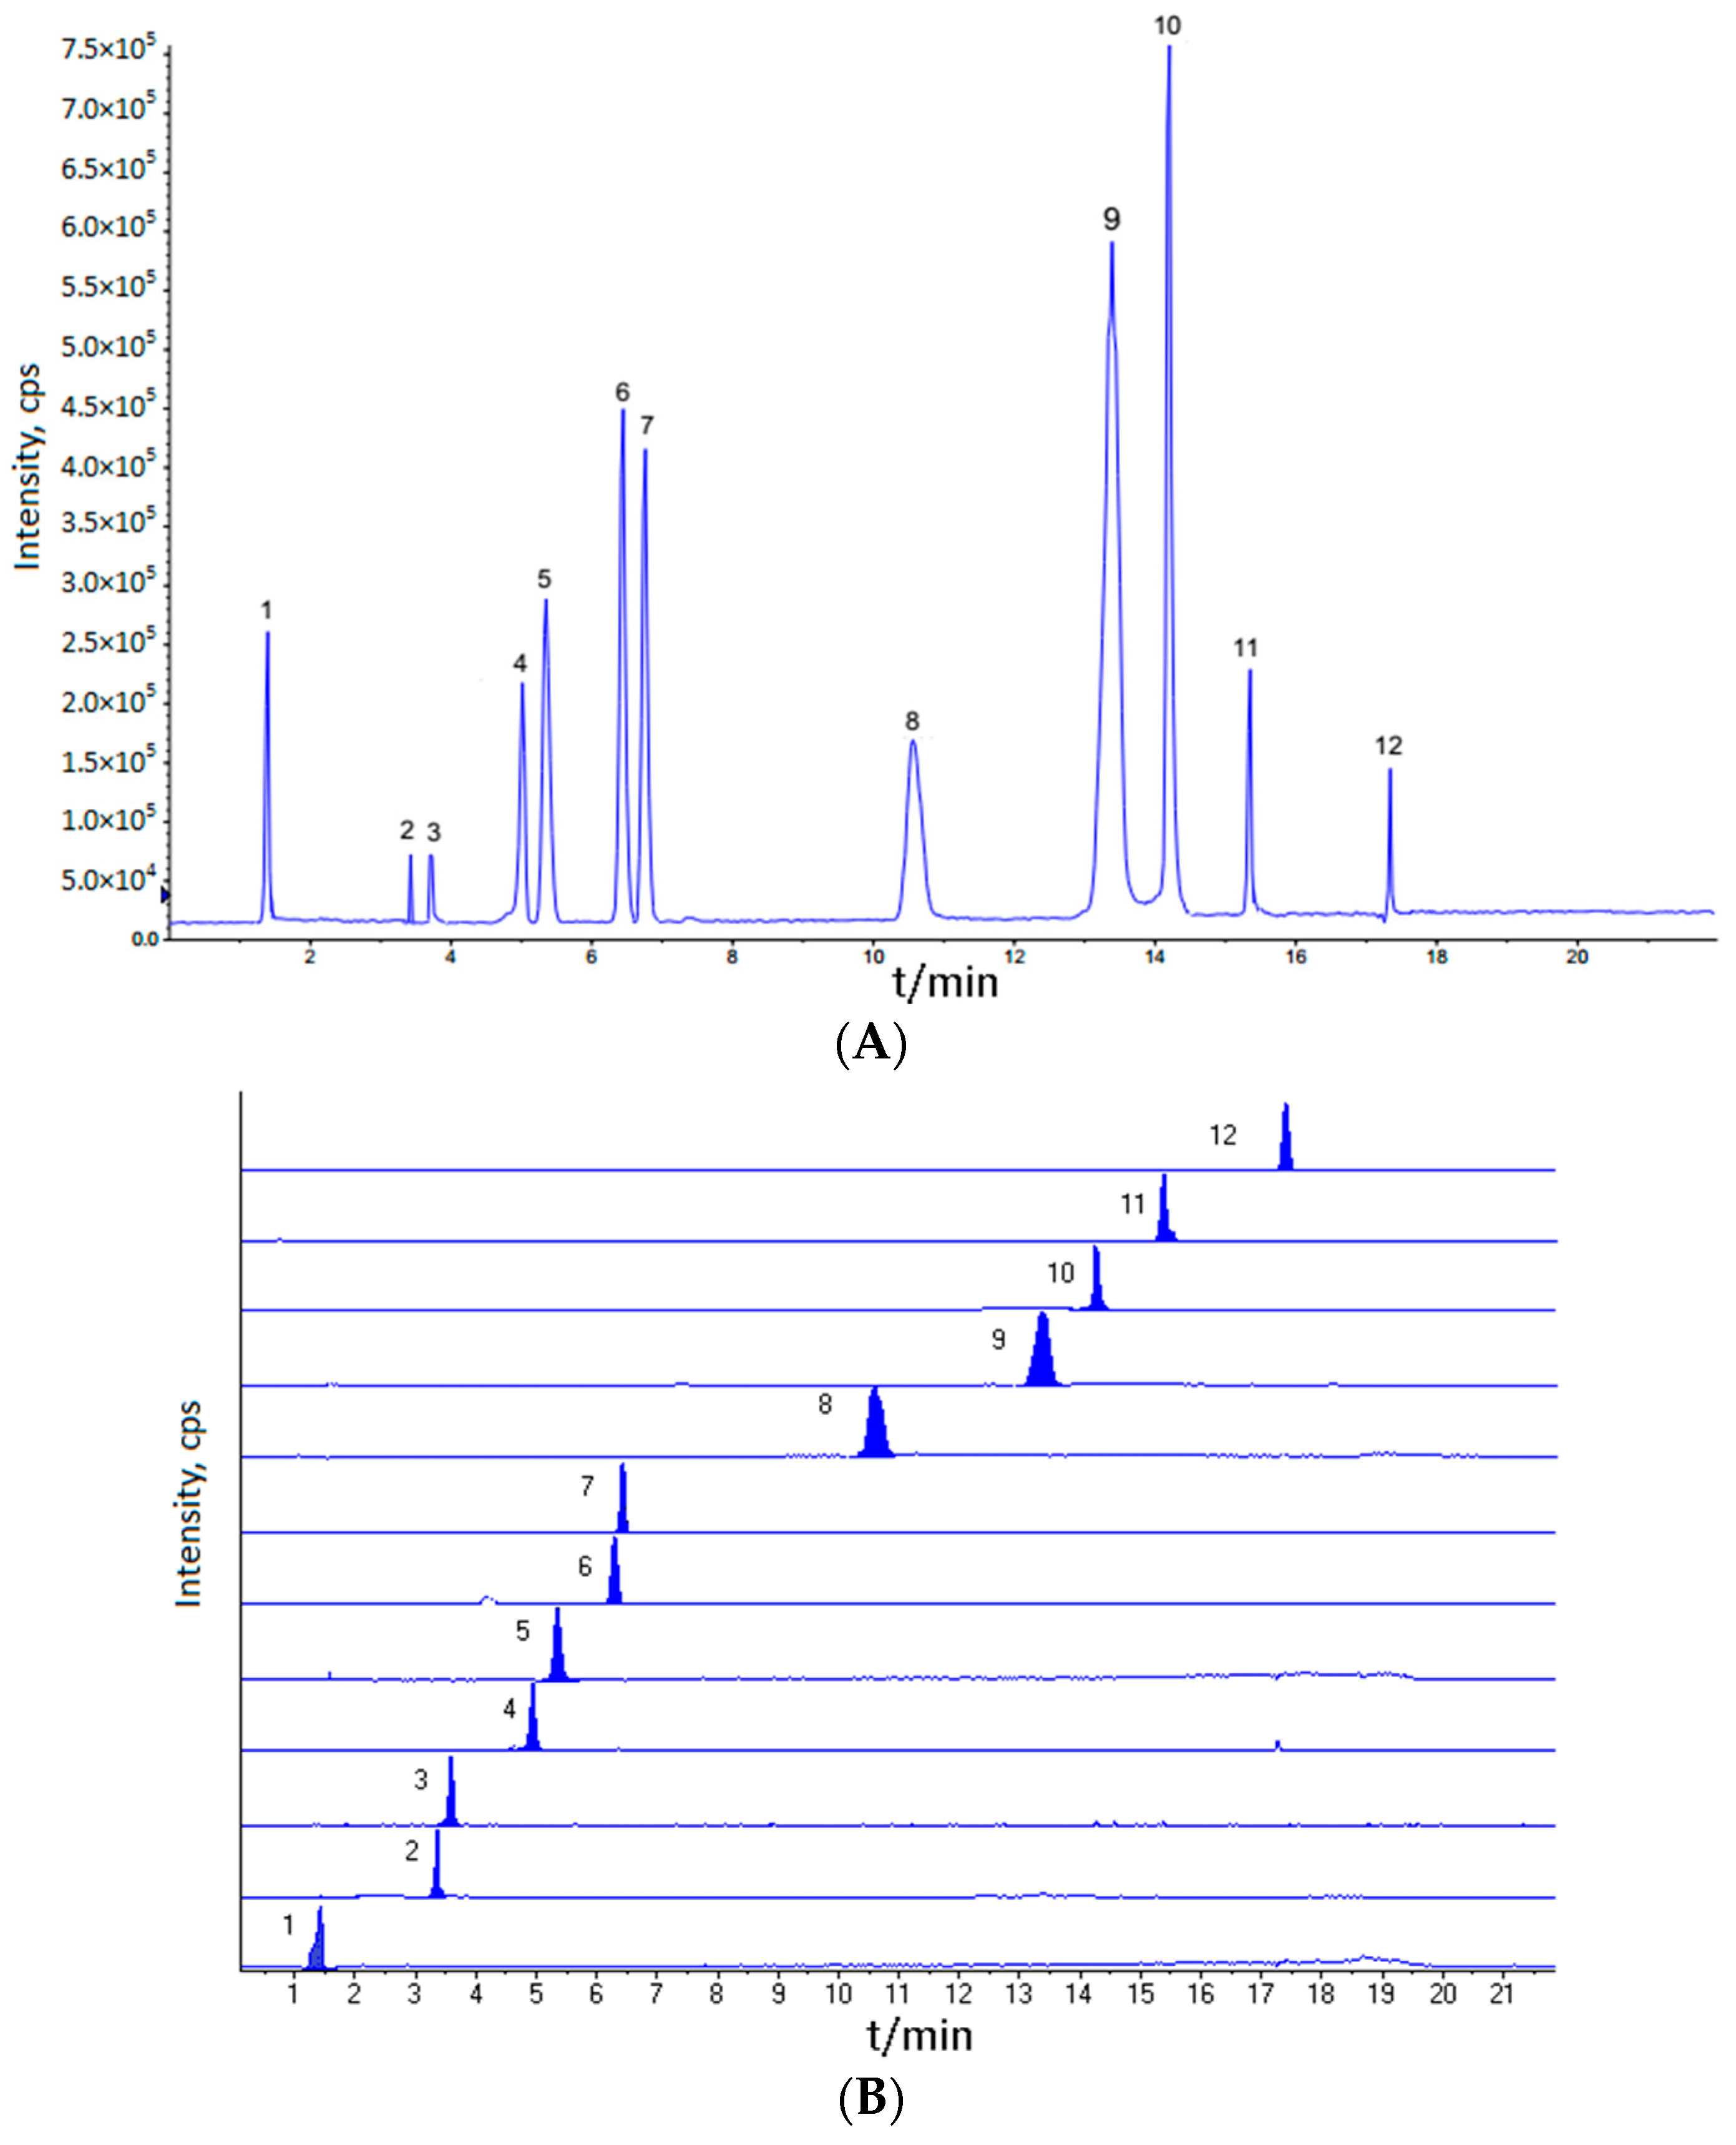
UPLC was performed by using a Shimadzu UPLC-20ADXR system (Shimadzu, Kyoto, Japan). All separations were carried out on a BDS HYPERSIL C18 (250 mm × 4.6 mm i.d., 5 μm). The mobile phase consisted of A (water) and B (acetonitrile) with a gradient elution: 0–1 min, 5% B; 1–10 min, 5%–20% B; 10–14 min, 20%–35% B; 14–16 min, 35%–75% B; 16–18.1 min, 75%–5% B; and the re-equilibration time was 4 min. The flow rate of the mobile phase was 1.0 mL/min, and the column temperature was maintained at 35 °C. The injection volume was 2 μL.
Mass spectrometry was performed on an API 4000 triple quadrupole mass spectrometer (AB SCIEX, Framingham, MA, USA) equipped with an electrospray ionization (ESI) source operating in the negative ion mode. The parameters in the source were set as follows: GS1 flow 65 L/min, GS2 flow 65 L/min, CUR flow 30 L/min; gas temperature 650 °C; pressure of nebulizer of MS −4500 V. The analyte detection was performed by using multiple reaction monitoring (MRM).
3.6. Validation of the Method
A series of analyses such as the linearity, stability, precision, and LOD and LOQ were conducted to validate the performance of the method. The standard solution containing 12 markers was prepared and diluted with methanol to appropriate concentrations for the construction of calibration curves. Calibration curves were developed by plotting the peak areas versus the corresponding concentrations of each analyte. The precision of the method was evaluated by analyzing the 12 standard compounds. The RSD of the peak area was used to evaluate the precision of the developed method. The LOD and LOQ of 12 analytes were measured at signal-to-noise ratios of 3 and 10, respectively. The recovery test was performed by adding the corresponding index compounds with high (120%), middle (100%), and low (80%) levels into accurately-weighed samples. The spiked samples were then extracted and analyzed using the aforementioned method, and triplicate experiments were performed at each level.
3.7. Grey Relational Analysis (GRA)
In order to evaluate quality of Scrophulariae Radix processed by different ‘sweating’ methods, GRA was carried out by the following steps.
3.7.1. The Establishment of Sample Dataset
Determination of the contents of twelve bioactive constituents in Scrophulariae Radix processed by different ‘sweating’ methods was conducted. A grey pattern recognition dataset of the quality of Scrophulariae Radix according to the contents of twelve bioactive constituents was established.
3.7.2. Normalization Treatment of Raw Data
Assume that there were
n samples; each sample had
m indexes. Compose the evaluation unit sequence as {
Xik}, (i = 1, 2, 3,…
n; k = 1,2,3,…
m;
n = 12,
m = 12 in this experiment). Normalize the raw data according to the formula due to the difference of unified measuring unit.
Note: Yik is the data after normalization treatment, Xik is the raw data, Xk is the mean value of the k-th index of the n-th sample.
3.7.3. The Establishment of the Optimal Reference Sequence and the Worst Reference Sequence
With grey relational analysis, we should choose the reference sequence. Set the optimum reference sequence and worst reference sequence as {Xsk} and {Xtk}, respectively (k = 1, 2, 3,... m). Each index of the optimum reference sequence is the maximum value of the corresponding index of the n-th sample, namely {Xsk}; each index of the worst reference sequence is the minimum value of the corresponding index of the n-th sample, namely {Xtk}. Calculate the D-value of each assessment unit relative to the optimal (poor) reference sequence.
For the optimal reference sequence, the correlation coefficient is:
For the worst reference sequence, the correlation coefficient is:
3.7.4. Calculation of Correlation Coefficient and Correlative Degree
Calculate the correlation coefficient and correlative degree of each assessment unit relative to optimal (poor) reference sequence:
3.7.5. Calculation of Relative Correlative Degree
Calculate the relative correlative degree of each sample:


