
Expression Profiling of Glucosinolate Biosynthetic Genes in Brassica oleracea L. var. capitata Inbred Lines Reveals Their Association with Glucosinolate Content

 ,
, 
Abstract
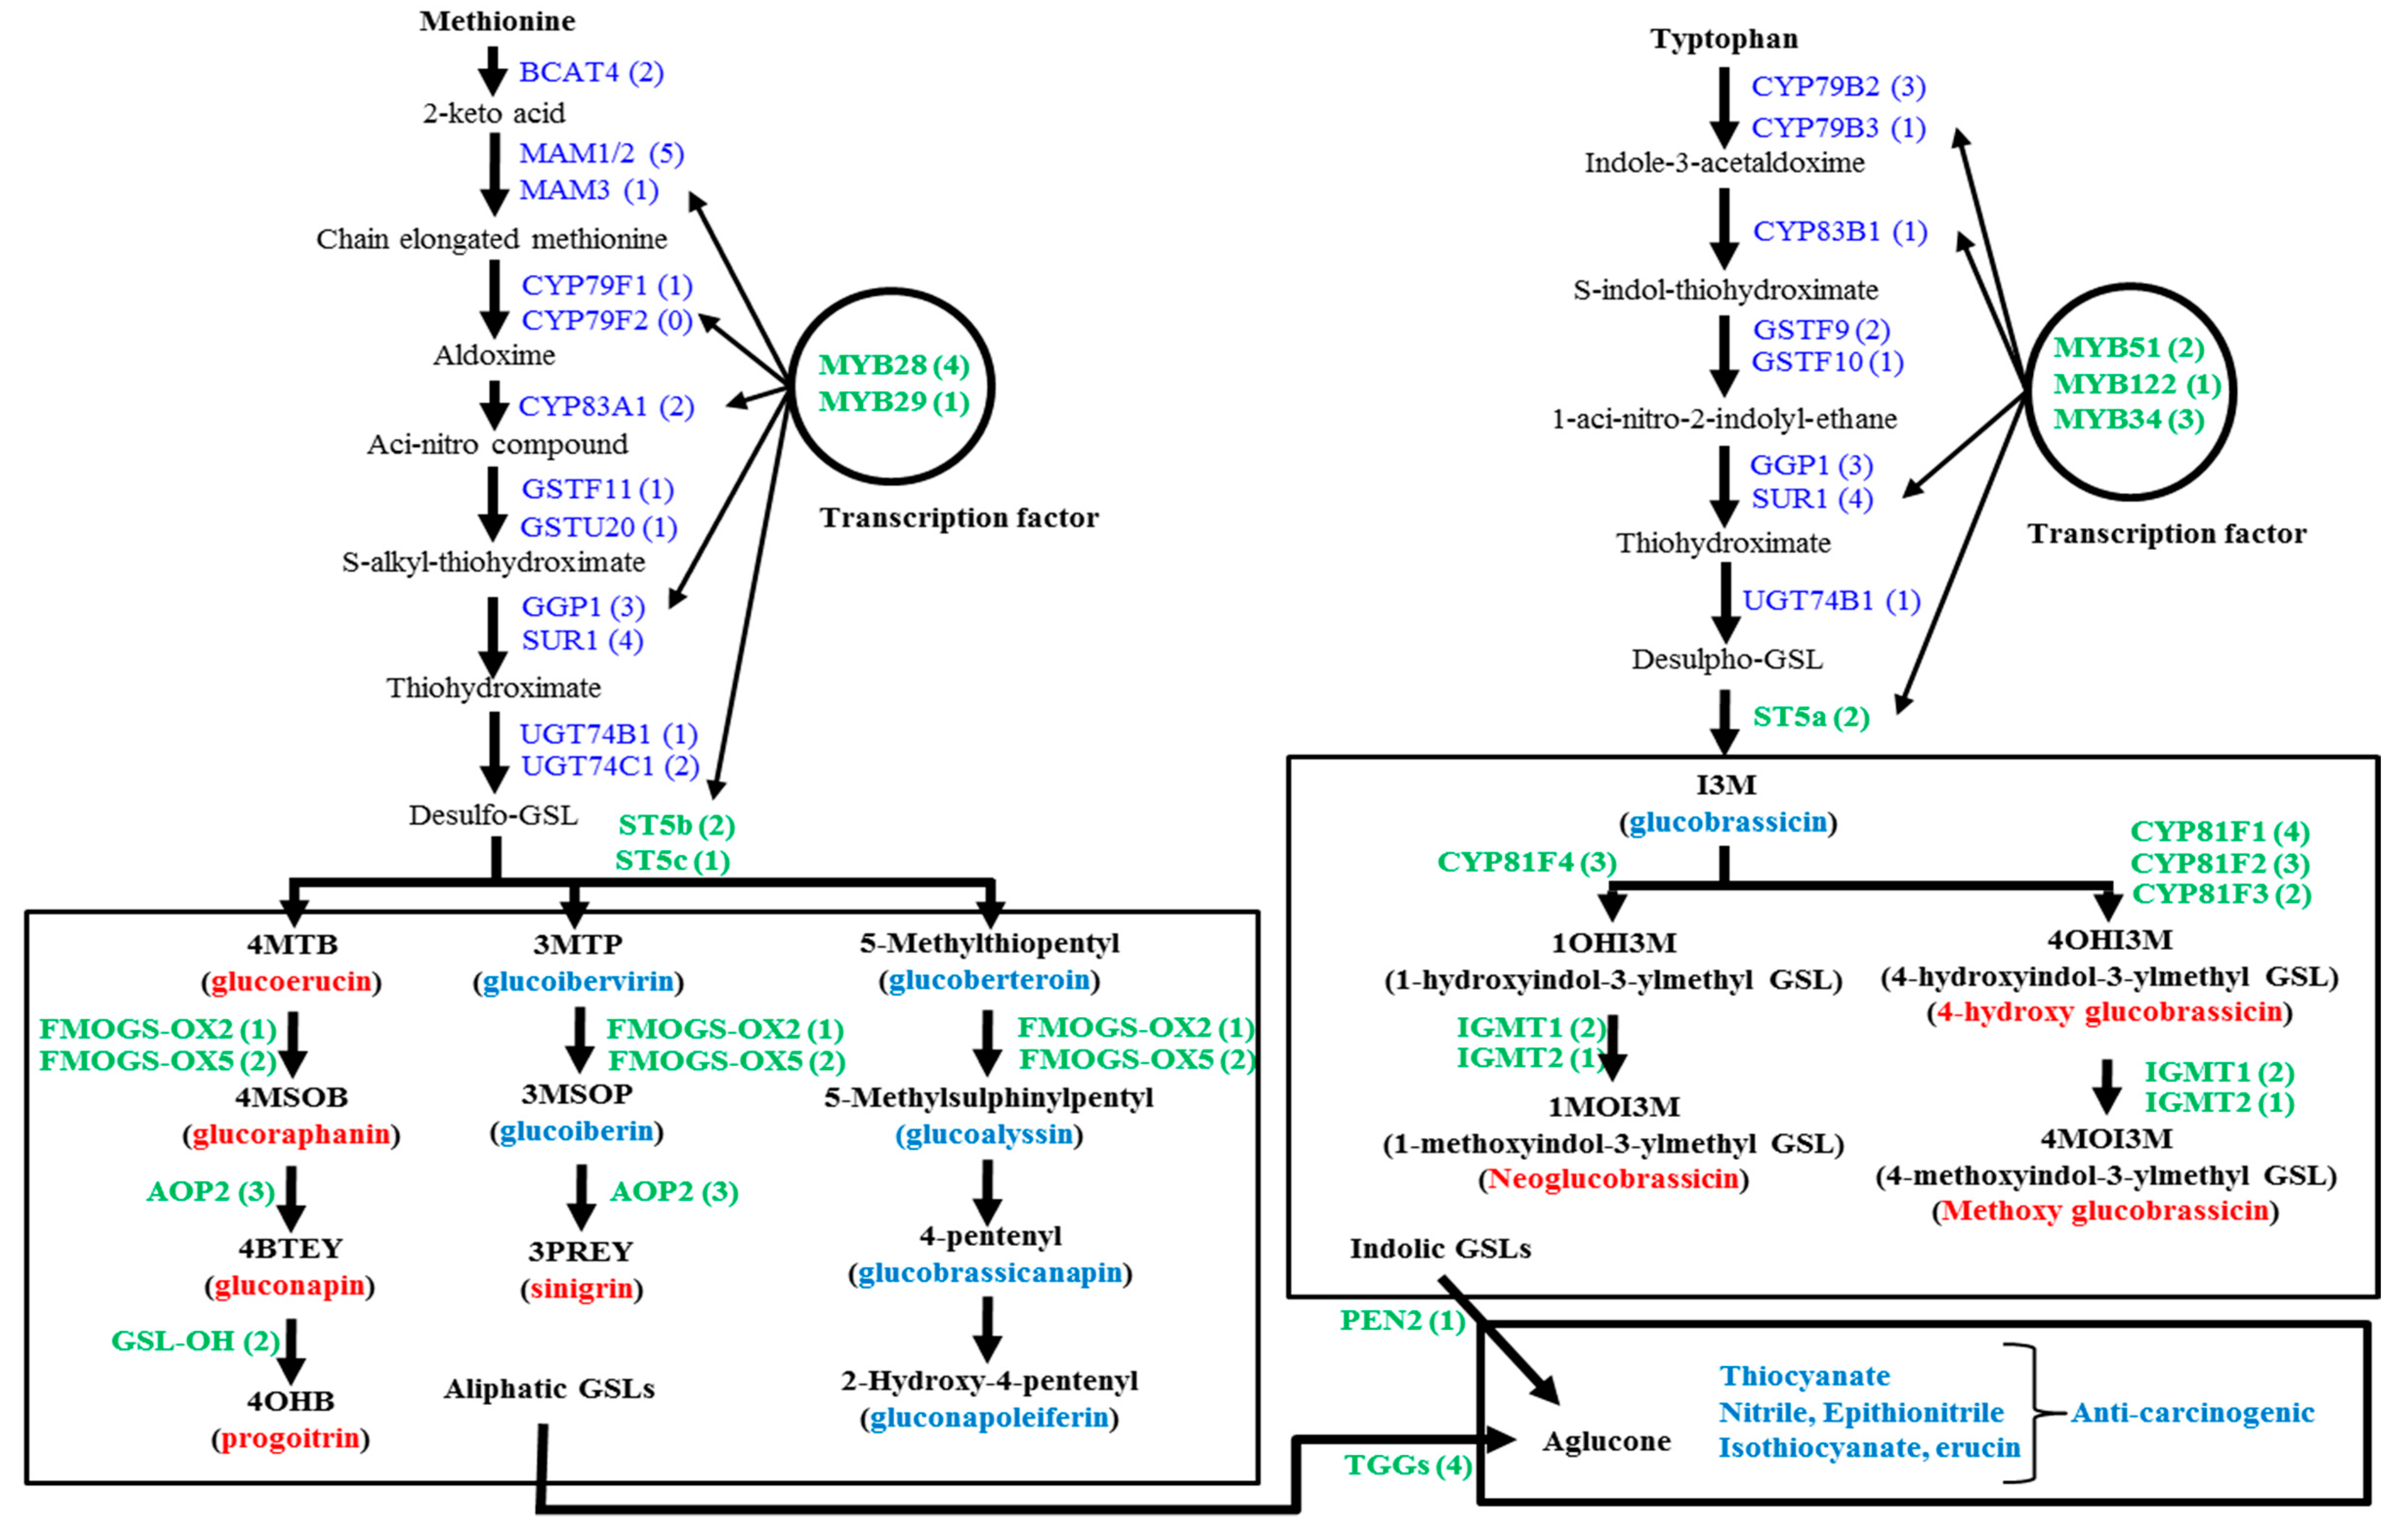
:1. Introduction
2. Results and Discussion
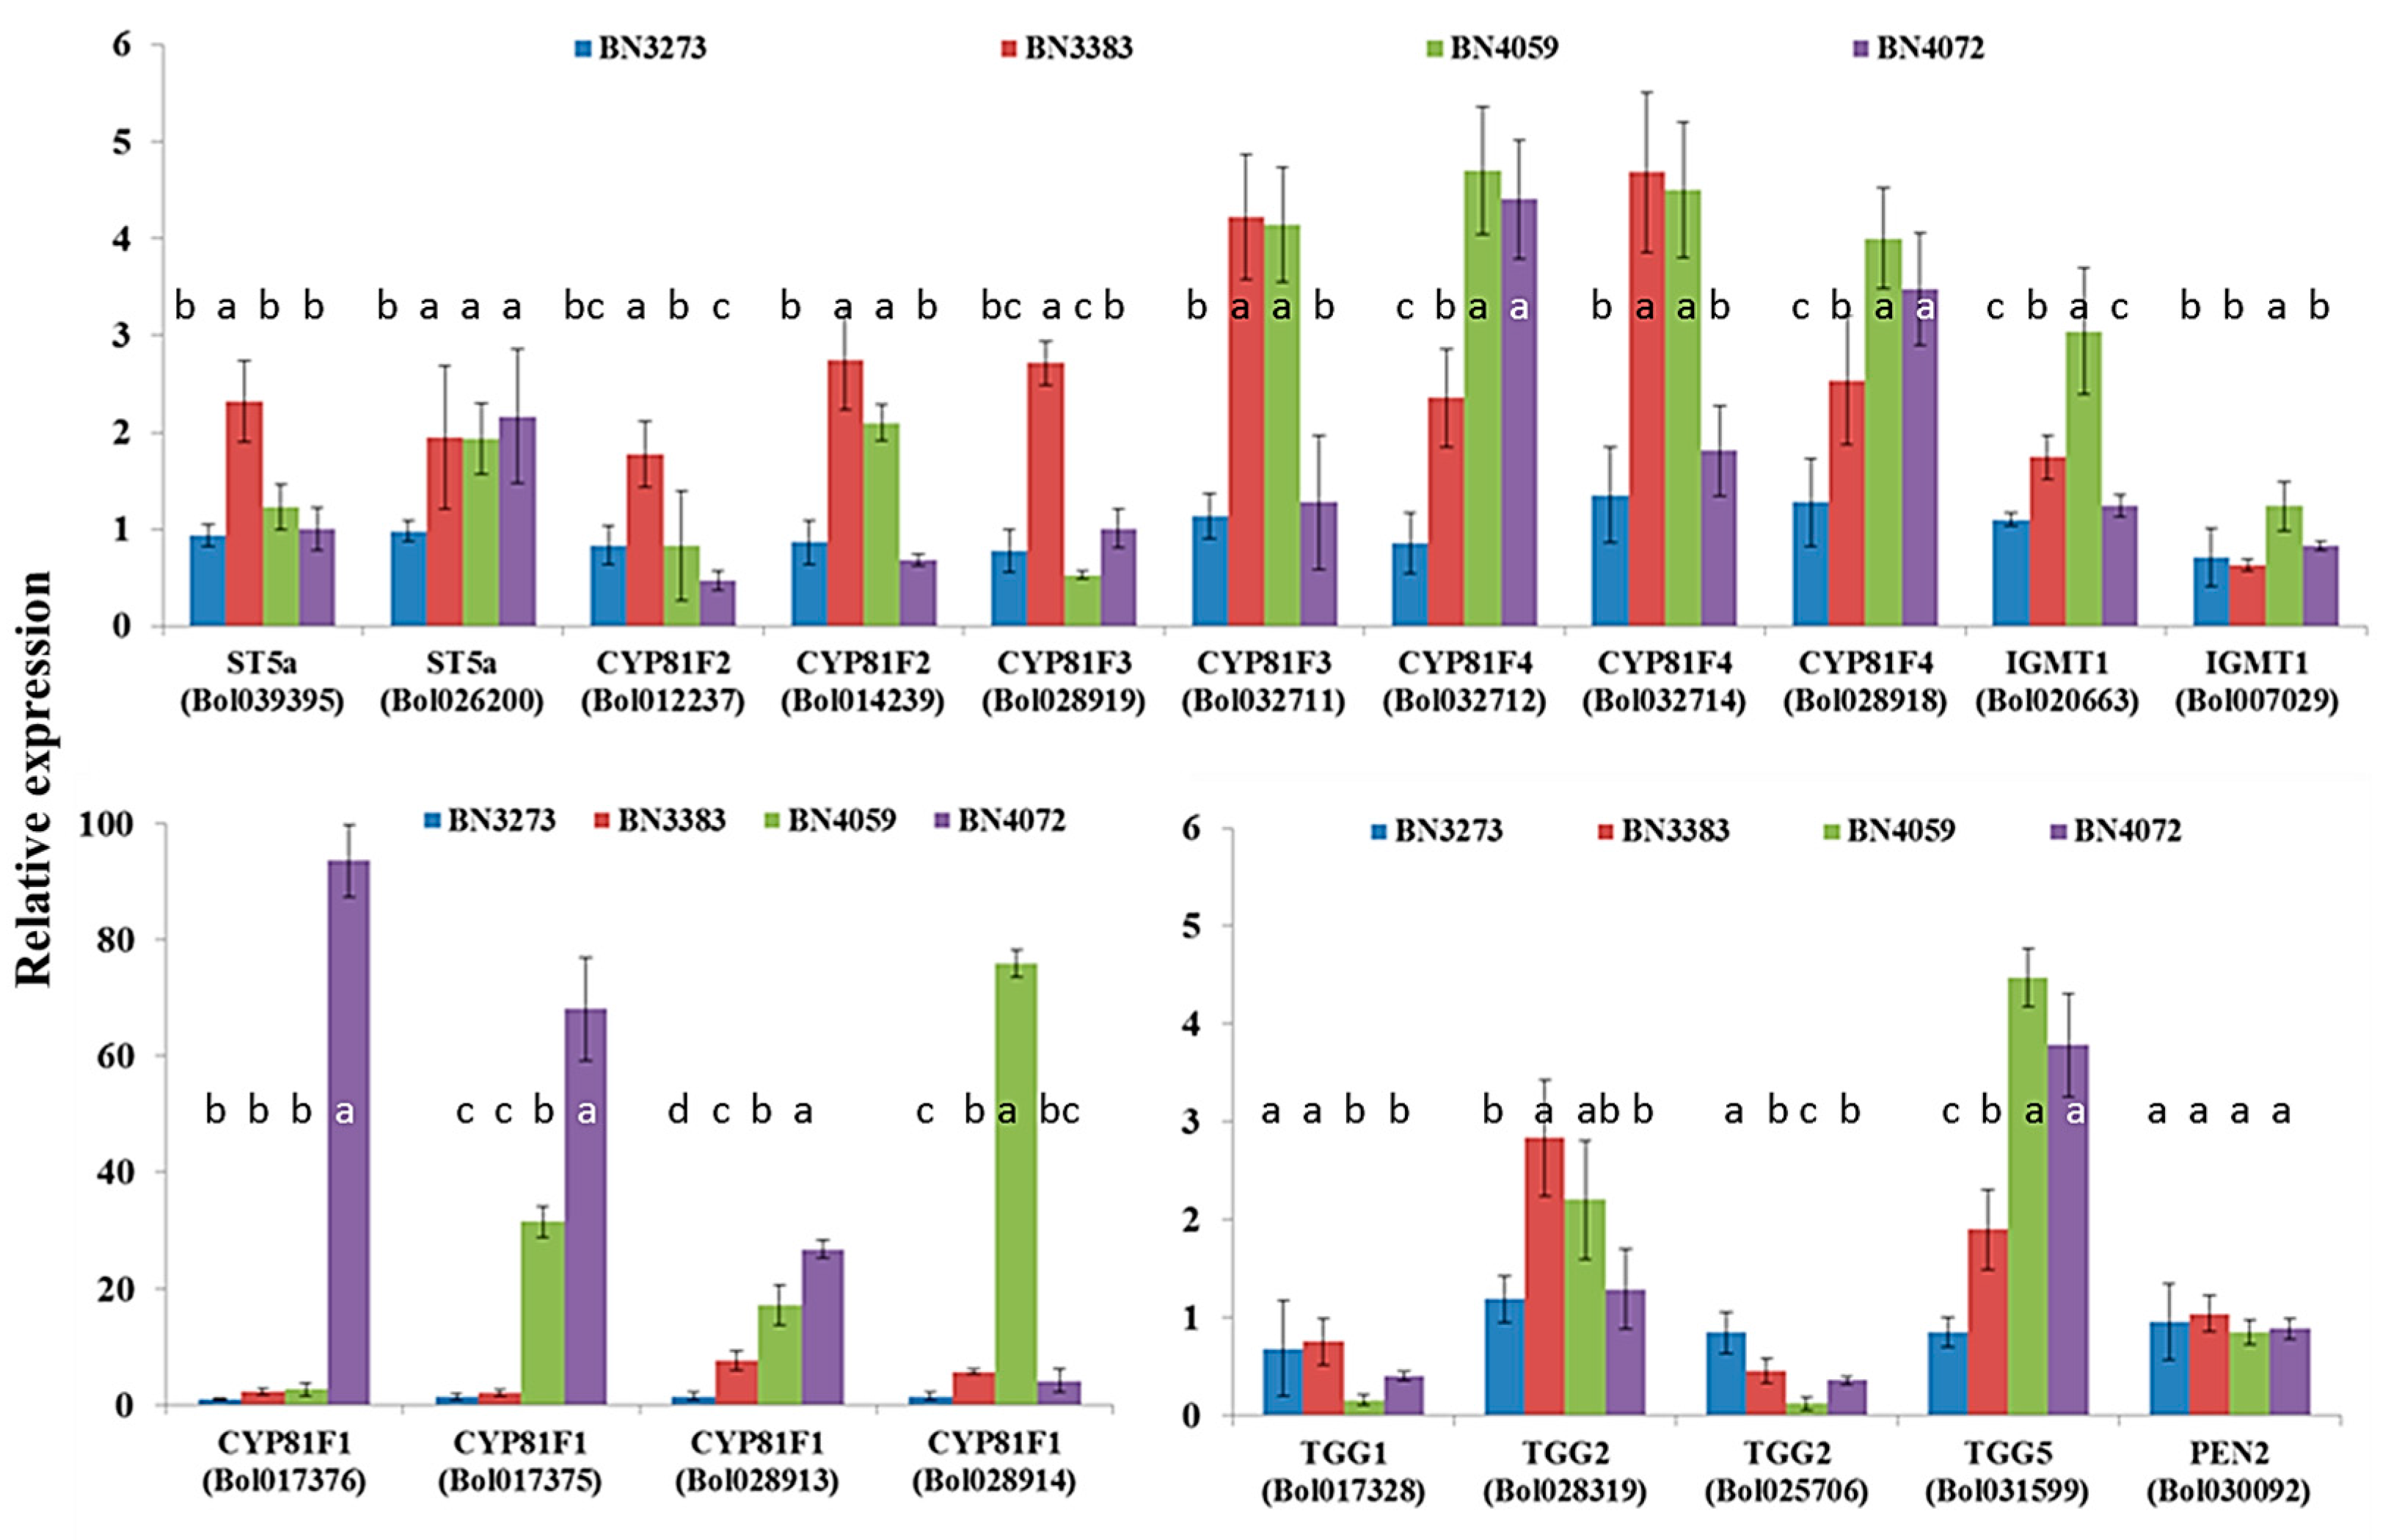
2.1. Genotypic Variation in the Relative Expression Profiling of Glucosinolate Biosynthesis Genes
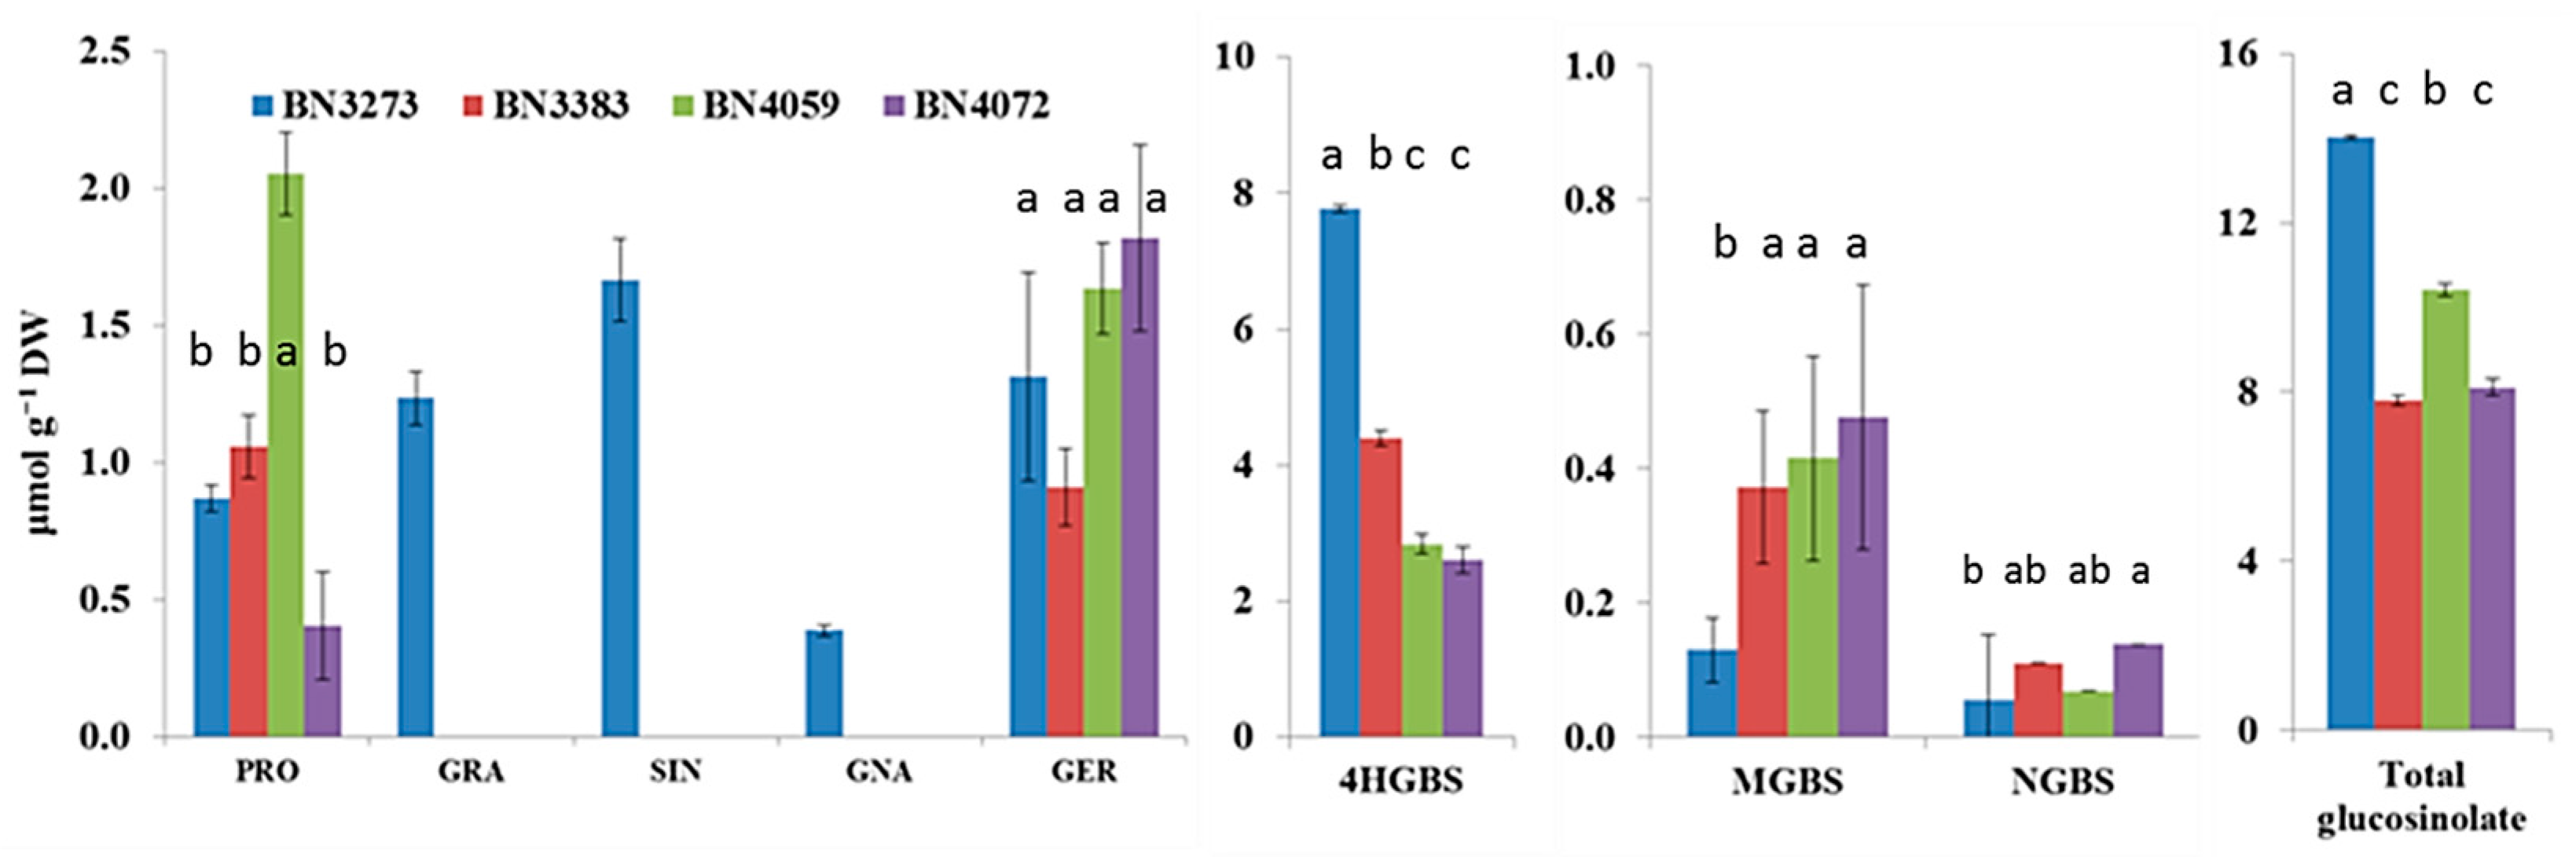
2.2. Genotypic Variation in Glucosinolate Contents
2.3. Association between Glucosinolate Content and Gene Expression
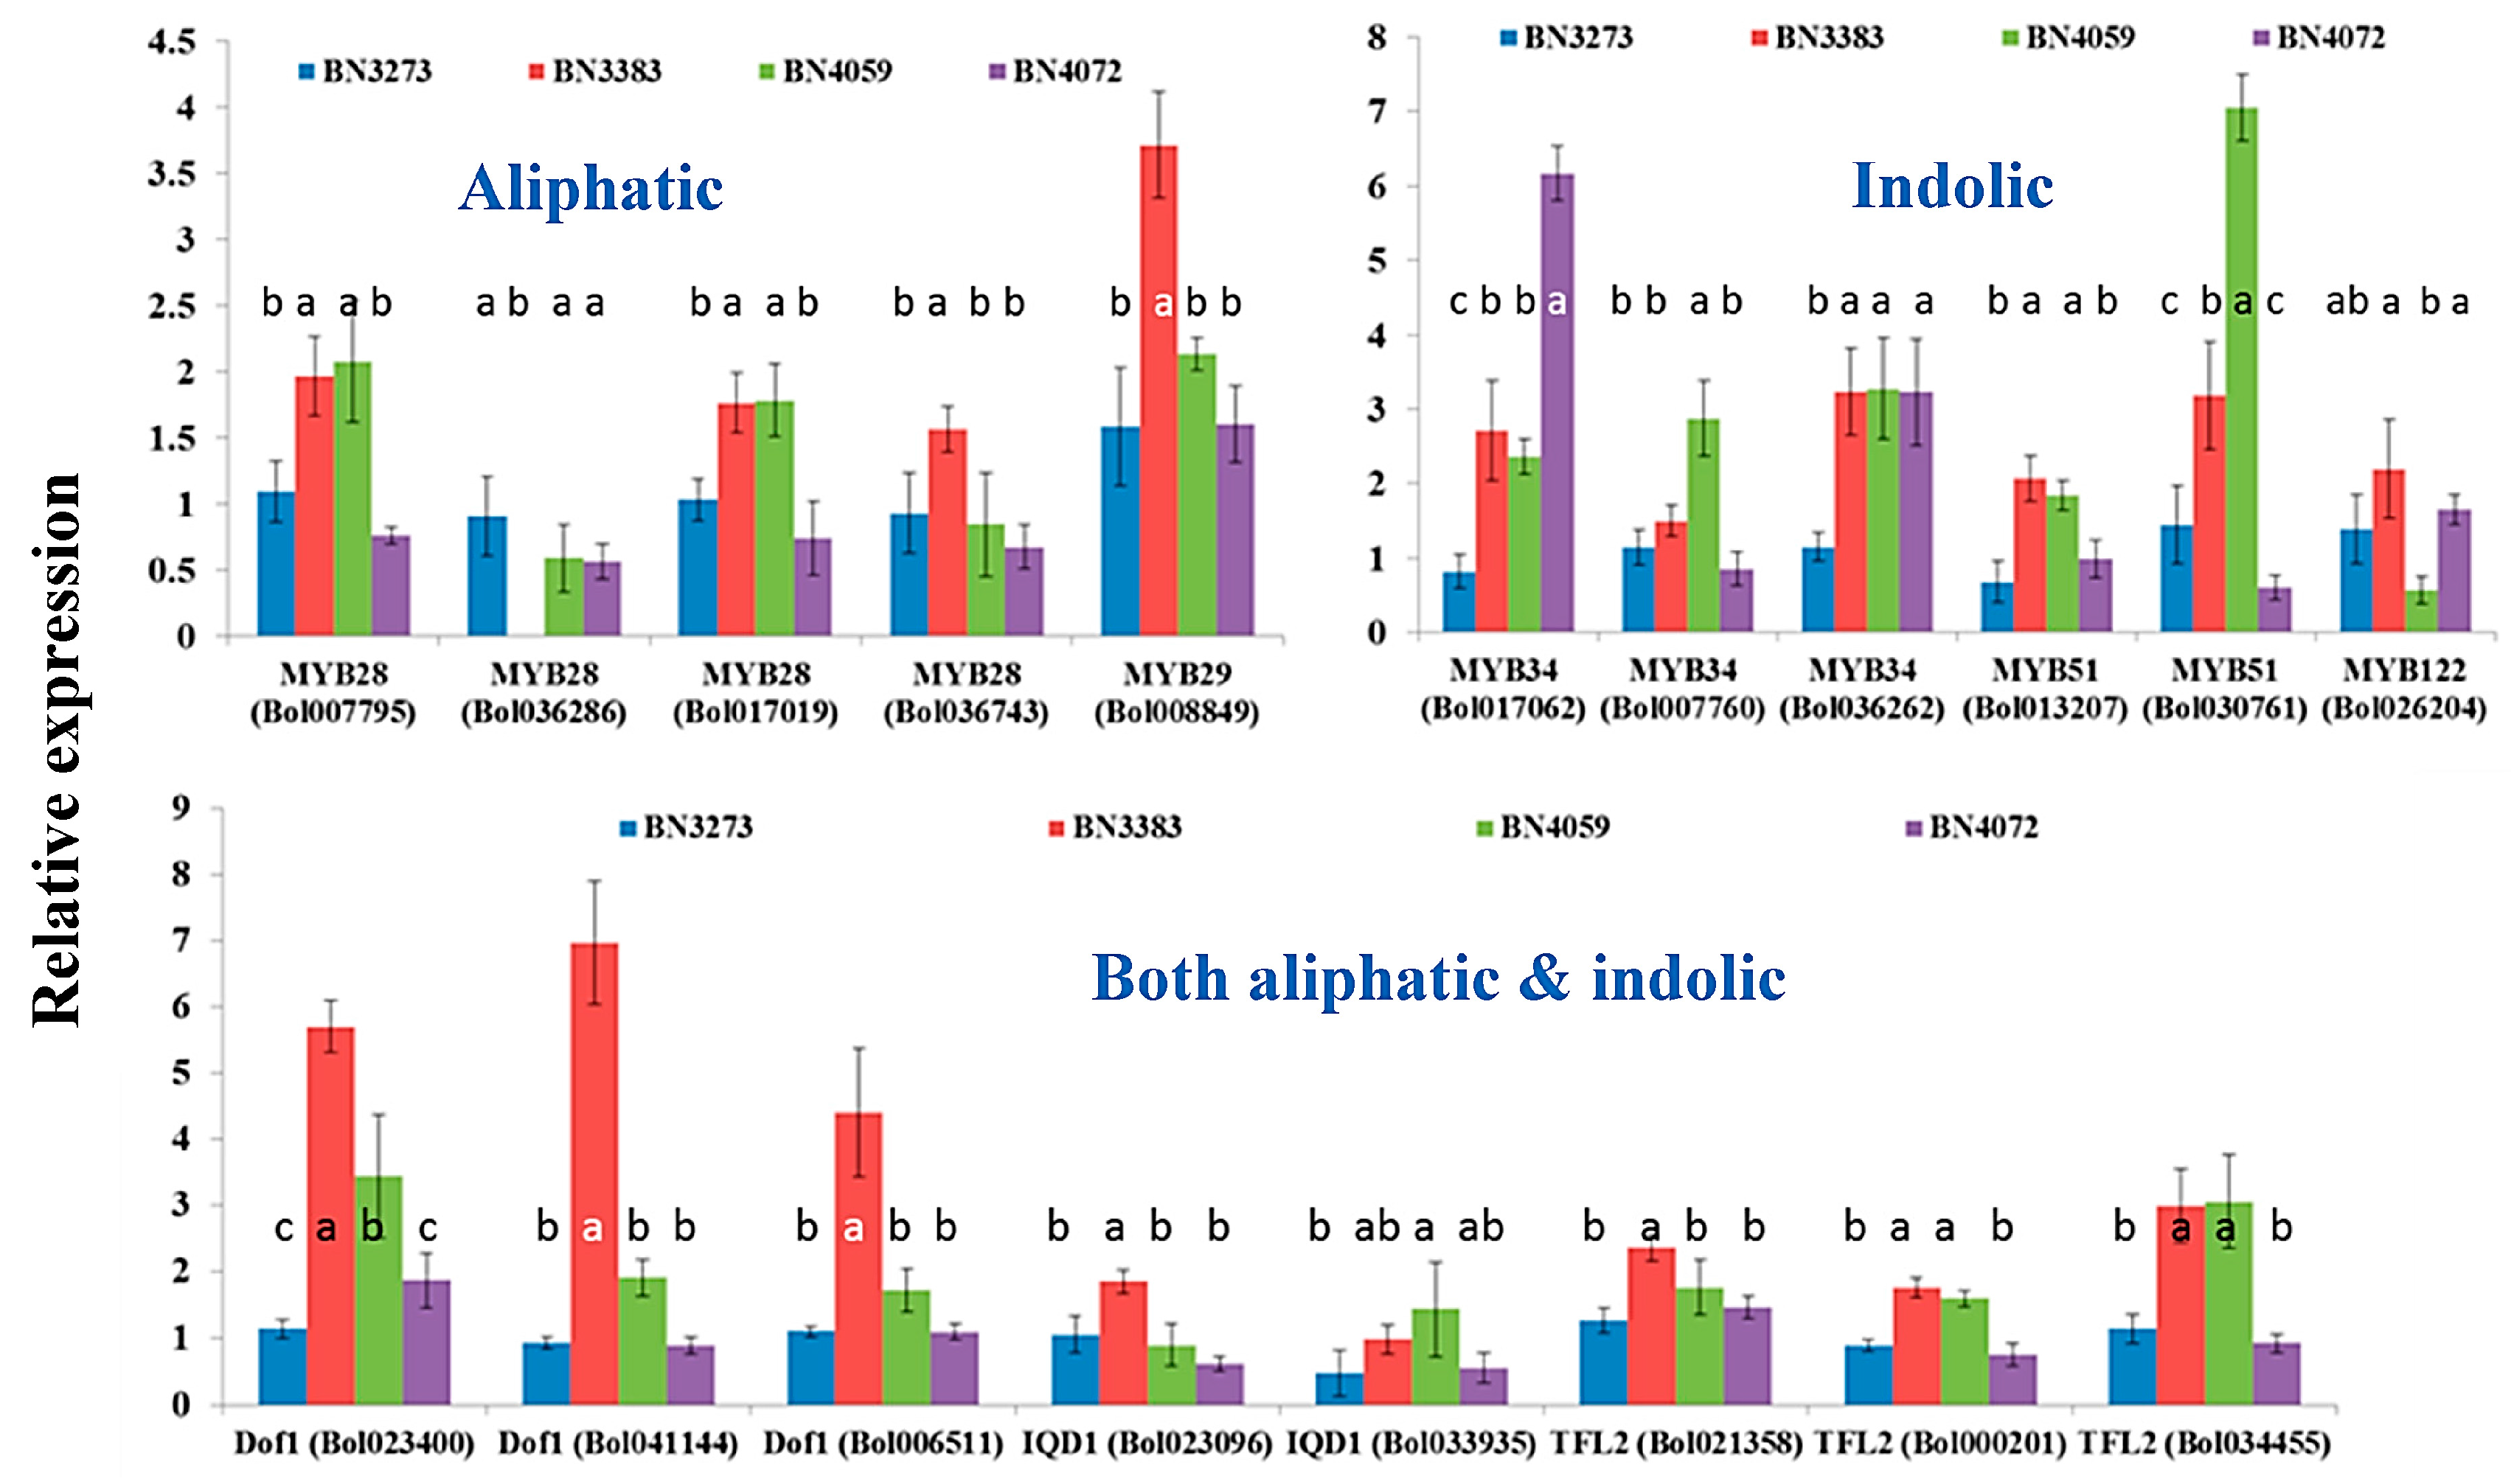
2.3.1. Association between Aliphatic Glucosinolate Content and Transcription Factor-Related Genes
2.3.2. Association between Indolic Glucosinolate Content and Transcription Factor-Related Genes
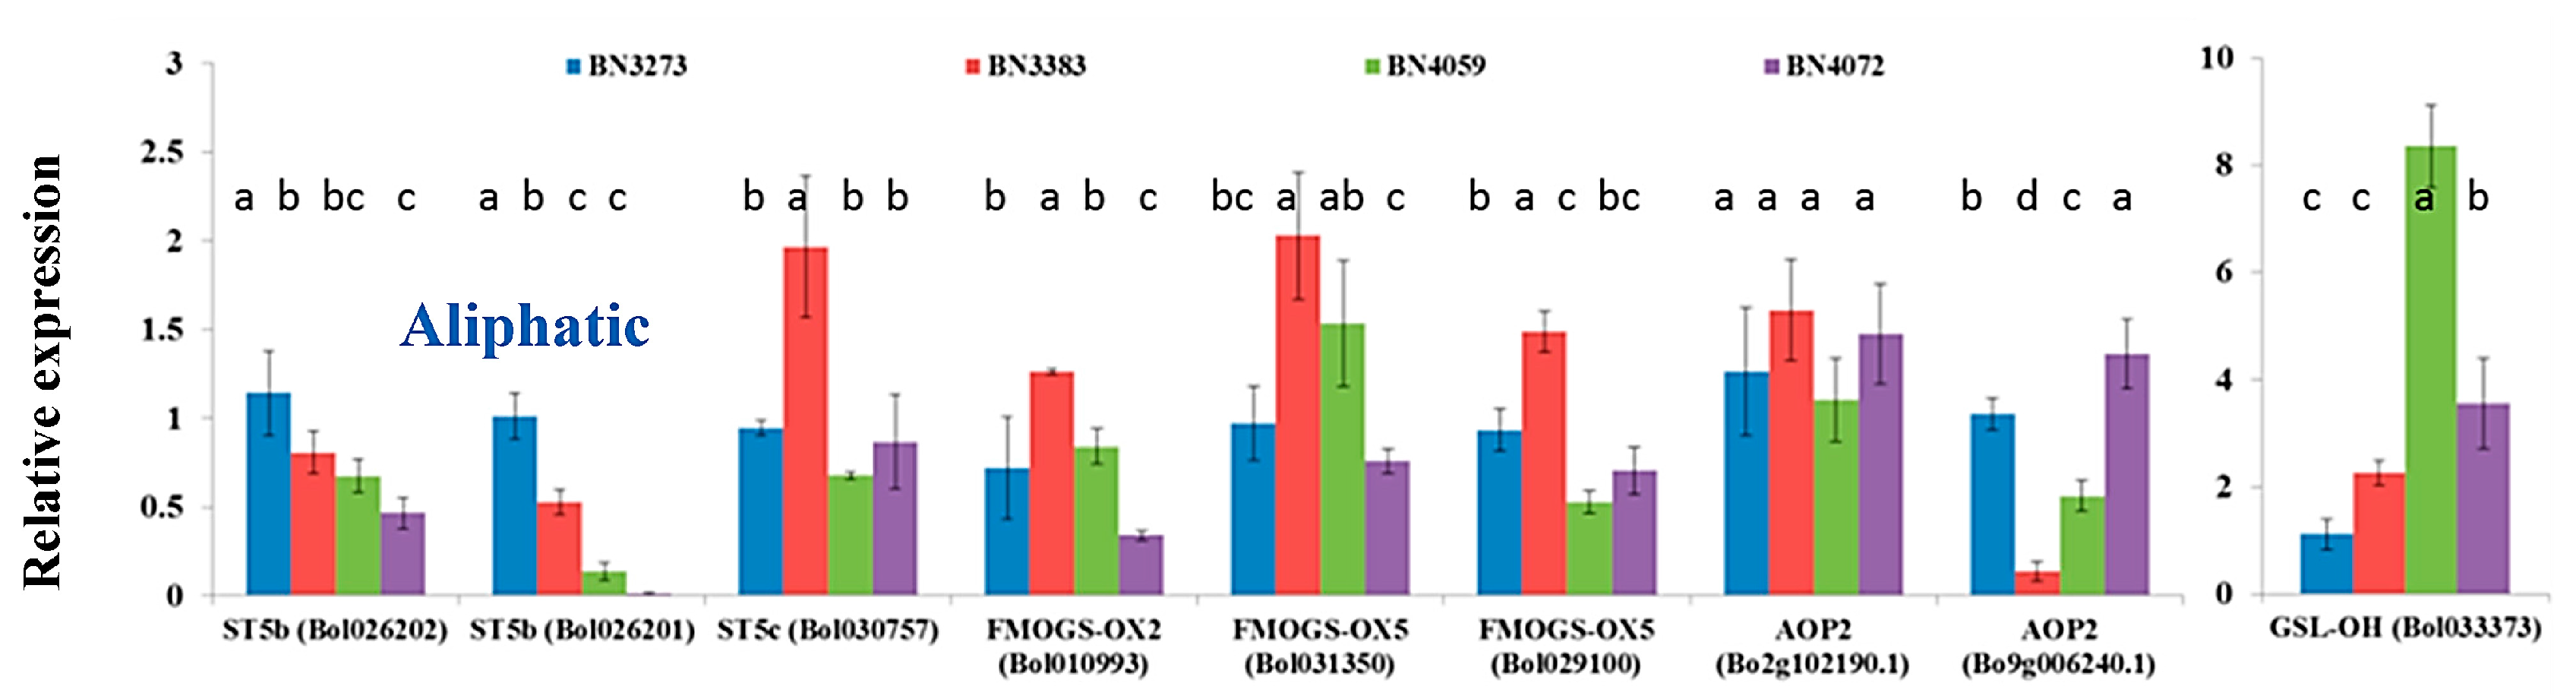
2.3.3. Association between Aliphatic Glucosinolate Content and Biosynthesis-Related Genes
2.3.4. Association between Indolic Glucosinolate Content and Biosynthesis-Related Genes
2.4. Discussion
3. Experimental Section
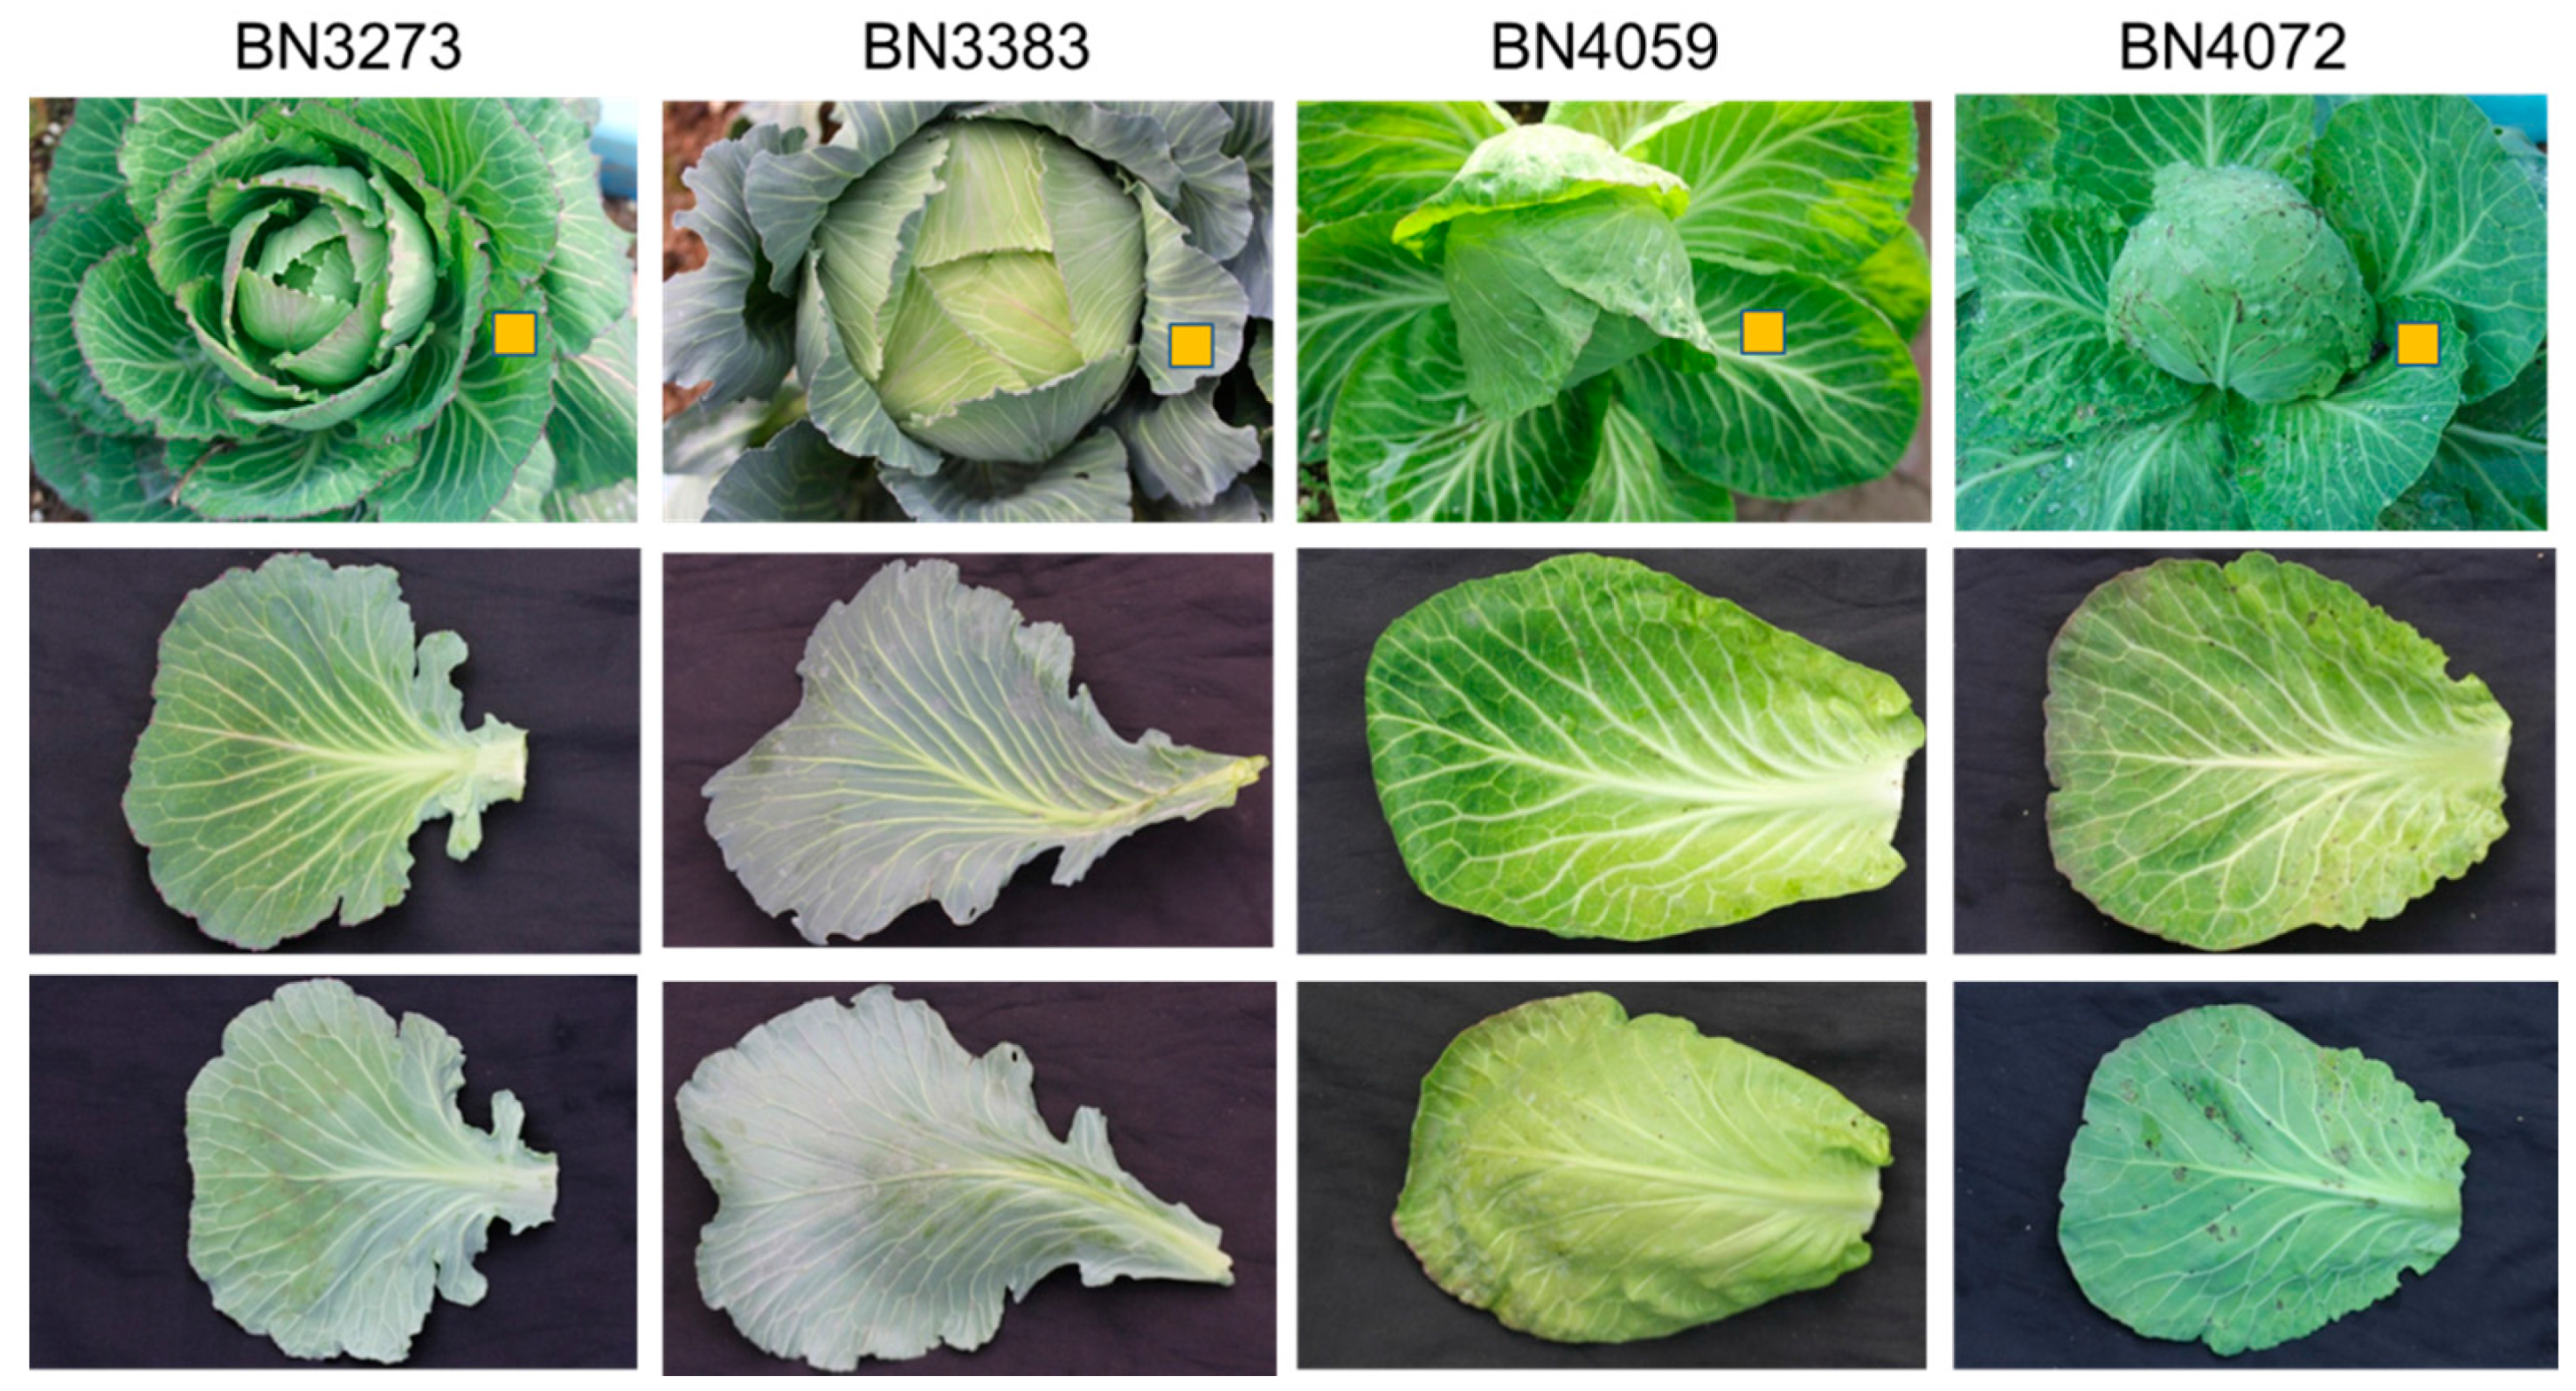
3.1. Plant Materials and Growth Conditions
3.2. Primer Design for Glucosinolate Biosynthesis Genes
3.3. cDNA Synthesis and Real-Time Quantitative PCR Analysis
3.4. Desulfoglucosinolate Extraction for HPLC Analysis
3.5. Statistical Analysis
4. Conclusions
Supplementary Materials
Acknowledgments
Author Contributions
Conflicts of Interest
Abbreviations
| 4HGBS | 4-hydroxyglucobrassicin |
| MGBS | methoxyglucobrassicin |
| NGBS | neoglucobrassicin |
References
- Van Etten, C.H.; Daxenbichler, M.E.; Williams, P.H.; Kwolek, W.F. Glucosinolates and derived products in cruciferous vegetables. Analysis of the edible part from twenty-two varieties of cabbage. J. Agric. Food Chem. 1976, 24, 452–455. [Google Scholar] [CrossRef]
- Cartea, M.E.; Velasco, P.; Obregón, S.; Padilla, G.; de Haro, A. Seasonal variation in glucosinolate content in Brassica oleracea crops grown in northwestern Spain. Phytochemistry 2008, 69, 403–410. [Google Scholar] [CrossRef] [PubMed]
- Kusznierewicz, B.; Bartoszek, A.; Wolska, L.; Drzewiecki, J.; Gorinstein, S.; Namieśnik, J. Partial characterization of white cabbages (Brassica oleracea var. capitata f. alba) from different regions by glucosinolates, bioactive compounds, total antioxidant activities and proteins. LWT–Food Sci. Technol. 2008, 41, 1–9. [Google Scholar]
- Kabouw, P.; Biere, A.; van der Putten, W.H.; van Dam, N.M. Intra-specific differences in root and shoot glucosinolate profiles among white cabbage (Brassica oleracea var. capitata) cultivars. J. Agric. Food Chem. 2009, 58, 411–417. [Google Scholar] [CrossRef] [PubMed] [Green Version]
- Yi, G.E.; Robin, A.H.K.; Yang, K.; Park, J.I.; Kang, J.G.; Yang, T.J.; Nou, I.S. Identification and Expression Analysis of Glucosinolate Biosynthetic Genes and Estimation of Glucosinolate Contents in Edible Organs of Brassica oleracea Subspecies. Molecules 2015, 20, 13089–13111. [Google Scholar] [CrossRef] [PubMed]
- Choi, S.H.; Park, S.; Lim, Y.P.; Kim, S.J.; Park, J.T.; An, G. Metabolite profiles of glucosinolates in cabbage varieties (Brassica oleracea var. capitata) by season, color, and tissue position. Hortic. Environ. Biotechnol. 2014, 55, 237–247. [Google Scholar]
- Sang, J.P.; Minchinton, I.R.; Johnstone, P.K.; Truscott, R.J.W. Glucosinolate profiles in the seed, root and leaf tissue of cabbage, mustard, rapeseed, radish and swede. Can. J. Plant Sci. 1984, 64, 77–93. [Google Scholar] [CrossRef]
- Bellostas, N.; Kachlicki, P.; Sørensen, J.C.; Sørensen, H. Glucosinolate profiling of seeds and sprouts of B. oleracea varieties used for food. Sci. Hort. 2007, 114, 234–242. [Google Scholar] [CrossRef]
- VanEtten, C.H.; Daxenbichler, M.E.; Tookey, H.L.; Kwolek, W.F.; Williams, P.H.; Yoder, O.C. Glucosinolates: Potential toxicants in cabbage cultivars. J. Am. Soc. Hort. Sci. 1980, 105, 710–714. [Google Scholar]
- Liu, S.; Liu, Y.; Yang, X.; Tong, C.; Edwards, D.; Parkin, I.A.; Waminal, N.E. The Brassica oleracea genome reveals the asymmetrical evolution of polyploid genomes. Nat. Commun. 2014, 5. [Google Scholar] [CrossRef] [PubMed]
- Sørensen, H. Glucosinolates: Structure-properties-function. In Canola and Rapeseed; Springer: New York, NY, USA, 1990; pp. 149–172. [Google Scholar]
- Mikkelsen, M.D.; Petersen, B.L.; Olsen, C.E.; Halkier, B.A. Biosynthesis and metabolic engineering of glucosinolates. Amino Acids 2002, 22, 279–295. [Google Scholar] [CrossRef] [PubMed]
- Sønderby, I.E.; Geu-Flores, F.; Halkier, B.A. Biosynthesis of glucosinolates-gene discovery and beyond. Trends Plant Sci. 2010, 15, 283–290. [Google Scholar] [CrossRef] [PubMed]
- Grubb, C.D.; Abel, S. Glucosinolate metabolism and its control. Trends Plant Sci. 2006, 11, 89–100. [Google Scholar] [CrossRef] [PubMed]
- Kroymann, J.; Textor, S.; Tokuhisa, J.G.; Falk, K.L.; Bartram, S.; Gershenzon, J.; Mitchell-Olds, T. A gene controlling variation in Arabidopsis glucosinolate composition is part of the methionine chain elongation pathway. Plant Physiol. 2001, 127, 1077–1088. [Google Scholar] [CrossRef] [PubMed]
- Textor, S.; de Kraker, J.W.; Hause, B.; Gershenzon, J.; Tokuhisa, J.G. MAM3 catalyzes the formation of all aliphatic glucosinolate chain lengths in Arabidopsis. Plant Physiol. 2007, 144, 60–71. [Google Scholar] [CrossRef] [PubMed]
- Gigolashvili, T.; Yatusevich, R.; Rollwitz, I.; Humphry, M.; Gershenzon, J.; Flügge, U.I. The plastidic bile acid transporter 5 is required for the biosynthesis of methionine-derived glucosinolates in Arabidopsis thaliana. Plant Cell. 2009, 21, 1813–1829. [Google Scholar] [CrossRef] [PubMed]
- Sawada, Y.; Toyooka, K.; Kuwahara, A.; Sakata, A.; Nagano, M.; Saito, K.; Hirai, M.Y. Arabidopsis bile acid: Sodium symporter family protein 5 is involved in methionine-derived glucosinolate biosynthesis. Plant Cell Physiol. 2009, 50, 1579–1586. [Google Scholar] [CrossRef] [PubMed]
- Wittstock, U.; Halkier, B.A. Glucosinolate research in the Arabidopsis era. Trends Plant Sci. 2002, 7, 263–270. [Google Scholar] [CrossRef]
- Brader, G.; Mikkelsen, M.D.; Halkier, B.A.; Tapio Palva, E. Altering glucosinolate profiles modulates disease resistance in plants. Plant J. 2006, 46, 758–767. [Google Scholar] [CrossRef] [PubMed]
- Celenza, J.L.; Quiel, J.A.; Smolen, G.A.; Merrikh, H.; Silvestro, A.R.; Normanly, J.; Bender, J. The Arabidopsis ATR1 Myb transcription factor controls indolic glucosinolate homeostasis. Plant Physiol. 2005, 137, 253–262. [Google Scholar] [CrossRef] [PubMed]
- Levy, M.; Wang, Q.; Kaspi, R.; Parrella, M.P.; Abel, S. Arabidopsis IQD1, a novel calmodulin-binding nuclear protein, stimulates glucosinolate accumulation and plant defense. Plant J. 2005, 43, 79–96. [Google Scholar] [CrossRef] [PubMed]
- Skirycz, A.; Reichelt, M.; Burow, M.; Birkemeyer, C.; Rolcik, J.; Kopka, J.; Witt, I. DOF transcription factor AtDof1. 1 (OBP2) is part of a regulatory network controlling glucosinolate biosynthesis in Arabidopsis. Plant J. 2006, 47, 10–24. [Google Scholar] [CrossRef] [PubMed]
- Gigolashvili, T.; Berger, B.; Mock, H.P.; Müller, C.; Weisshaar, B.; Flügge, U.I. The transcription factor HIG1/MYB51 regulates indolic glucosinolate biosynthesis in Arabidopsis thaliana. Plant J. 2007, 50, 886–901. [Google Scholar] [CrossRef] [PubMed]
- Gigolashvili, T.; Yatusevich, R.; Berger, B.; Müller, C.; Flügge, U.I. The R2R3-MYB transcription factor HAG1/MYB28 is a regulator of methionine-derived glucosinolate biosynthesis in Arabidopsis thaliana. Plant J. 2007, 51, 247–261. [Google Scholar] [CrossRef] [PubMed]
- Sønderby, I.E.; Hansen, B.G.; Bjarnholt, N.; Ticconi, C.; Halkier, B.A.; Kliebenstein, D.J. A systems biology approach identifies a R2R3 MYB gene subfamily with distinct and overlapping functions in regulation of aliphatic glucosinolates. PLoS ONE 2007, 2, e1322. [Google Scholar] [CrossRef] [PubMed]
- Gigolashvili, T.; Engqvist, M.; Yatusevich, R.; Müller, C.; Flügge, U.I. HAG2/MYB76 and HAG3/MYB29 exert a specific and coordinated control on the regulation of aliphatic glucosinolate biosynthesis in Arabidopsis thaliana. New Phytol. 2008, 177, 627–642. [Google Scholar] [CrossRef] [PubMed]
- Kliebenstein, D.; Pedersen, D.; Barker, B.; Mitchell-Olds, T. Comparative analysis of quantitative trait loci controlling glucosinolates, myrosinase and insect resistance in Arabidopsis thaliana. Genetics 2002, 161, 325–332. [Google Scholar] [PubMed]
- Mewis, I.; Appel, H.M.; Hom, A.; Raina, R.; Schultz, J.C. Major signaling pathways modulate Arabidopsis glucosinolate accumulation and response to both phloem-feeding and chewing insects. Plant Physiol. 2005, 138, 1149–1162. [Google Scholar] [CrossRef] [PubMed]
- Mikkelsen, M.D.; Petersen, B.L.; Glawischnig, E.; Jensen, A.B.; Andreasson, E. Modulation of CYP79 genes and glucosinolate profiles in Arabidopsis by defense signaling pathways. Plant Physiol. 2003, 131, 298–308. [Google Scholar] [CrossRef] [PubMed]
- Brader, G.; Tas, E.; Palva, E.T. Jasmonate-dependent induction of indole glucosinolates in Arabidopsis by culture filtrates of the nonspecific pathogen Erwinia carotovora. Plant Physiol. 2001, 126, 849–860. [Google Scholar] [CrossRef] [PubMed]
- European Economic Community (EEC). European Economic Community, Commission Regulation, EEC No 1864/90. Oilseeds—Determination of glucosinolates—High performance liquid chromatography. Off. J. Eur. Community L. 1990, 170, 27–34. [Google Scholar]
- International Standards Organization (ISO). Part 1: Method using high performance liquid chromatography. In ISO 9167-1 (E). Rapeseed: Determination of Glucosinolates Content; ISO: Geneva, Switzerland, 1992; pp. 1–9. [Google Scholar]
- American Oil Chemists Society (AOCS). Official Methods and Recommended Practices of the American Oil Chemists Society, 5th ed.; AOCS: Champaign, IL, USA, 1998. [Google Scholar]
- Variyar, P.S.; Banerjee, A.; Akkarakaran, J.J.; Suprasanna, P. Role of glucosinolates in plant stress tolerance. In Emerging Technologies and Management of Crop Stress Tolerance; Academic Press: San Diego, CA, USA, 2014; pp. 271–291. [Google Scholar]
- Hansen, B.G.; Kerwin, R.E.; Ober, J.A.; Lambrix, V.M.; Mitchell-Olds, T.; Gershenzon, J.; Kliebenstein, D.J. A novel 2-oxoacid-dependent dioxygenase involved in the formation of the goiterogenic 2-hydroxybut-3-enyl glucosinolate and generalist insect resistance in Arabidopsis. Plant Physiol. 2008, 148, 2096–2108. [Google Scholar] [CrossRef] [PubMed]
- Schlaeppi, K.; Bodenhausen, N.; Buchala, A.; Mauch, F.; Reymond, P. The glutathione-deficient mutant pad2-1 accumulates lower amounts of glucosinolates and is more susceptible to the insect herbivore Spodoptera littoralis. Plant J. 2008, 55, 774–786. [Google Scholar] [CrossRef] [PubMed]
- Neilson, E.H.; Goodger, J.Q.; Woodrow, I.E.; Møller, B.L. Plant chemical defense: At what cost? Trends Plant Sci. 2013, 18, 250–258. [Google Scholar] [CrossRef] [PubMed]
- Vicas, S.I.; Teusdea, A.C.; Carbunar, M.; Socaci, S.A.; Socaciu, C. Glucosinolates profile and antioxidant capacity of Romanian Brassica vegetables obtained by organic and conventional agricultural practices. Plant Foods Human Nutr. 2013, 68, 313–321. [Google Scholar] [CrossRef] [PubMed]
- Multiple Sequence Alignment by ClustalW. Available online: http://www.genome.jp/tools/clustalw/ (accessed on 15 April 2016).
- Livak, K.J.; Schmittgen, T.D. Analysis of relative gene expression data using real-time quantitative PCR and the 2−ΔΔCT method. Methods 2001, 25, 402–408. [Google Scholar] [CrossRef] [PubMed]
- Zhang, B.; Hu, Z.; Zhang, Y.; Li, Y.; Zhou, S.; Chen, G. A putative functional MYB transcription factor induced by low temperature regulates anthocyanin biosynthesis in purple kale (Brassica Oleracea var. acephala f. tricolor). Plant Cell Rep. 2012, 31, 281–289. [Google Scholar] [CrossRef] [PubMed]
- Nawaz, I.; Iqbal, M.; Hakvoort, H.W.; Bliek, M.; de Boer, B.; Schat, H. Expression levels and promoter activities of candidate salt tolerance genes in halophytic and glycophytic Brassicaceae. Environ. Exp. Bot. 2014, 99, 59–66. [Google Scholar] [CrossRef]
- Lee, J.; Yang, K.; Lee, M.; Kim, S.; Kim, J.; Lim, S.; Jang, Y.S. Differentiated cuticular wax content and expression patterns of cuticular wax biosynthetic genes in bloomed and bloomless broccoli (Brassica oleracea var. italica). Process Biochem. 2015, 50, 456–462. [Google Scholar] [CrossRef]
- Andersen, C.L.; Jensen, J.L.; Ørntoft, T.F. Normalization of real-time quantitative reverse transcription-PCR data: A model-based variance estimation approach to identify genes suited for normalization, applied to bladder and colon cancer data sets. Cancer Res. 2004, 64, 5245–5250. [Google Scholar] [CrossRef] [PubMed]
- Sample Availability: Seeds of the inbred lines are available from the authors.


| Variable | PC1 | PC2 | PC3 |
|---|---|---|---|
| Progoitrin | 0.18 | −0.16 | 0.69 |
| Glucoraphanin | −0.37 | −0.38 | −0.01 |
| Sinigrin | −0.37 | −0.38 | −0.01 |
| Gluconapin | −0.33 | −0.33 | −0.02 |
| Glucoerucin | −0.11 | 0.40 | 0.37 |
| MYB28 (Bol007795) | 0.34 | −0.29 | 0.36 |
| MYB28 (Bol036286) | −0.36 | −0.11 | 0.26 |
| MYB28 (Bol017019) | 0.33 | −0.31 | 0.19 |
| MYB28 (Bol036743) | 0.22 | −0.43 | −0.27 |
| MYB29 (Bol008849) | 0.37 | −0.20 | −0.27 |
| %variation explained | 47.2 | 23.3 | 15.3 |
| p (genotype) | <0.001 | <0.001 | 0.001 |
| Genotype | Mean PC Scores (±SD) | ||
| BN3273 | −2.92 ± 0.43 | −1.31 ± 1.32 | −0.03 ± 0.31 |
| BN3383 | 2.55 ± 0.16 | −0.85 ± 0.27 | −0.99 ± 0.49 |
| BN4059 | 1.24 ± 0.29 | 0.06 ± 0.52 | 1.66 ± 0.90 |
| BN4072 | −0.87 ± 0.16 | 2.01 ± 0.66 | −0.69 ± 0.91 |
| Variable | PC1 | PC2 |
|---|---|---|
| 4HGBS | −0.24 | −0.29 |
| MGBS | 0.13 | 0.26 |
| NGBS | −0.11 | 0.46 |
| MYB34 (Bol017062) | −0.06 | 0.53 |
| MYB34 (Bol007760) | 0.52 | −0.15 |
| MYB34 (Bol036262) | 0.31 | 0.43 |
| MYB51 (Bol013207) | 0.41 | 0.19 |
| MYB51 (Bol030761) | 0.54 | −0.14 |
| MYB122 (Bol015939) | −0.28 | 0.28 |
| %variation explained | 34.3 | 31.0 |
| p (genotype) | <0.001 | <0.001 |
| Genotype | Mean PC Scores (±SD) | |
| BN3273 | −1.71 ± 0.23 | −2.17 ± 0.38 |
| BN3383 | 0.25 ± 0.20 | 0.86 ± 0.51 |
| BN4059 | 2.64 ± 0.44 | −0.63 ± 0.23 |
| BN4072 | −1.17 ± 0.17 | 1.94 ± 0.81 |
| Variable | PC1 | PC2 | PC3 |
|---|---|---|---|
| Progoitrin | −0.16 | 0.09 | 0.55 |
| Glucoraphanin | 0.42 | −0.08 | 0.17 |
| Sinigrin | 0.42 | −0.07 | 0.17 |
| Gluconapin | 0.42 | −0.09 | 0.14 |
| Glucoerucin | −0.07 | −0.24 | 0.05 |
| ST5b (Bol026201) | 0.34 | 0.09 | 0.12 |
| ST5b (Bol026202) | 0.41 | 0.15 | 0.12 |
| ST5c (Bol030757) | 0.03 | 0.41 | −0.21 |
| FMOGS-OX2 (Bol010993) | 0.01 | 0.44 | 0.18 |
| FMOGS-OX5 (Bol029100) | −0.13 | 0.40 | 0.18 |
| FMOGS-OX5 (Bol031350) | 0.13 | 0.40 | −0.21 |
| AOP2 (Bo2g102190) | 0.01 | 0.10 | −0.52 |
| AOP2 (Bo9g006240) | 0.09 | −0.42 | −0.19 |
| GSL-OH (Bol033373) | −0.34 | −0.09 | 0.35 |
| %variation explained | 36.3 | 31.8 | 17.1 |
| p (genotype) | <0.001 | <0.001 | <0.001 |
| Genotype | Mean PC Scores (±SD) | ||
| BN3273 | 3.58 ± 0.41 | −0.69 ± 0.61 | 0.57 ± 0.74 |
| BN3383 | −0.32 ± 0.35 | 3.29 ± 0.55 | −0.80 ± 0.53 |
| BN4059 | −2.09 ± 0.38 | −0.46 ± 0.18 | 1.88 ± 0.75 |
| BN4072 | −1.17 ± 0.28 | −2.13 ± 0.18 | −1.65 ± 0.95 |
| Gene Name | Accession Number | cDNA Size (bp) | Forward Primer Sequence | Reverse Primer Sequence | Product Size (bp) |
|---|---|---|---|---|---|
| Transcription factor-related genes (19 genes) | |||||
| Aliphatic | |||||
| MYB28 | Bol007795 | 558 | CCACACCAGTTCAGAGAGGT | GGGAAATGGATCGAAGTCAGC | 221 |
| Bol036286 | 615 | GAAGGTAGCTTGAATGCTAATAC | ATTCATGTAGTGCTCCTCATTC | 249 | |
| Bol017019 | 426 | GTTGCGGCTAAGGTCACTTCT | CAGAAGTAGCGTTGATCTCATGC | 223 | |
| Bol036743 | 426 | CTTGGGCGCTGCTACATTAC | ATCGTTCTCCTCGTTGTGGT | 241 | |
| MYB29 | Bol008849 | 513 | CGCCCAAGACTTCTGAGTT | TGATATTGCCCATGGAAGCTG | 234 |
| Indolic | |||||
| MYB34 | Bol007760 | 843 | TGAAGGAGGATGGCGTACTC | CAGTTCGTCCCGCCAAATTA | 203 |
| Bol017062 | 951 | AAGGTGGATGGCGTACTCTC | TGTGAGTGGTTGGATCGACA | 279 | |
| Bol036262 | 294 | CCCCGAGTTCTTTAGCAACC | TCCAAGTCCAGATCGTCTTCT | 198 | |
| MYB51 | Bol013207 | 1002 | CCAGAGATTCCAGAGAAGC | CAAGTCACACTGCTACTACTAC | 233 |
| Bol030761 | 990 | CAGACAACTATATCGAGTAACG | TATCATTAACGGTCATCTGG | 274 | |
| MYB122 | Bol026204 | 981 | GACCATTCCGAGACATTGCC | GCATCGTGGATCATGTGGAG | 284 |
| Both aliphatic and indolic | |||||
| Dof1.1 | Bol023400 | 1005 | GACGAAACATAGCAGCTCCG | ACCGGGTTGTTCTTCCATCT | 227 |
| Dof1.1 | Bol041144 | TTGGTCACAGCCTACGAACT | ACTTGGTGATGAGGGAGTCG | 260 | |
| Dof1.1 | Bol006511 | ACCAACTTCCACCTTTCCCA | AAGCTGCTCTCATTCTCGGT | 163 | |
| IQD1 | Bol023096 | TGTCCTCGATGCAACTCCAT | ACCGAGAATGAGAGCAGCTT | 287 | |
| IQD1 | Bol033935 | AAGCTGCTCTCATTCTCGGT | CCTCTTTGGTTGCCTTGGTC | 195 | |
| TFL2 | Bol021358 | 1146 | ACGATGCTGCTGAGAAGTCT | CCTGGTCCCCTTAACTCGTT | 199 |
| TFL2 | Bol000201 | AGCGGGAAAAGAAGTGGAGA | GCCTTTCCTCTTTCCCTCCT | 166 | |
| TFL2 | Bol034455 | AAGAGGGAGAAGCAGCCATT | AACCTCCACTGGCTTGATGA | 239 | |
| Aliphatic biosynthesis-related genes (9 genes) | |||||
| ST5b | Bol026201 | 1035 | CCGAGCCGTCAGAATTCAAG | GCTATGGCGAAAGTGAGAGC | 247 |
| Bol026202 | 1035 | AAGCCTTGACTTTCGCCATC | ACTTCACAACTGAGTCCGGT | 204 | |
| ST5c | Bol030757 | 1014 | CCACGCCCAAAACTTCTTCA | TGAGTGGAGAAGAGCGTGTT | 246 |
| FMOGS-OX2 | Bol010993 | 1386 | GAGAAGGTATCCGAGCCACA | GTCCACTGCAAACAACGACT | 200 |
| FMOGS-OX5 | Bol029100 | 1347 | CTTGCTCCAACGCTTTCCTT | CCTCAGCTCTCCAGTGTTCA | 280 |
| Bol031350 | 1380 | GACACTACACAGAGCCTCGT | CCCCGGGAAGCTTCTCATAT | 234 | |
| AOP2 | Bo2g102190 | GGAACGTGTCTCCAAAACCC | TAGCACCATCACCAGCATCA | 354 | |
| Bo9g006240 | CCAGGAAGTGAGAAGTGGGT | TAGCACCATCACCAGCATCA | 517 | ||
| GSL-OH | Bol033373 | 243 | GATTGTGCAAAAGGCTTGT | AGAGCATTAGGATTAGGAGGA | 188 |
| Indolic biosynthesis-related genes (15 genes) | |||||
| ST5a | Bol026200 | 1017 | GTCCGGTTGCAAGATGGTTT | CCTCTCCGGGTTCTCTTTGT | 214 |
| Bol039395 | 1014 | TGCCGTTTGTGAAGAGGTTG | CCCAATCTCCAACCTTCCCT | 210 | |
| CYP81F4 | Bol032712 | 1506 | CGGTGGAGGAGAAGGAGAAA | CTGACACATGGCTCGTAACG | 226 |
| Bol032714 | 960 | ACCCTGGTGAATACTTGCCA | GAAACACACTGAAGCAGAAC | 239 | |
| Bol028918 | 1503 | GTTTGCGGCATCAGAGACAT | GAATAGTCCACGCGTTCACC | 299 | |
| CYP81F1 | Bol017375 | 369 | AAGCAGAGCGGTTCAAGAAG | GCGTGACCATTGTGTTACCA | 204 |
| Bol017376 | 246 | CCGTCTCCTTCAACGGTTCT | CGACGTATTTACCGGTGAGC | 170 | |
| Bol028913 | 1500 | GAGACCTCCGCAGTAACCTT | GTCCTCCGTCGGTCTTCTAG | 222 | |
| Bol028914 | 1497 | CTTTCCAACTGACGGCCAAA | CGTTAGGTCCGAGAAAAGCG | 257 | |
| CYP81F2 | Bol012237 | 933 | GCAGCCGTGACACTAGAATG | TCCGCCAATCTTGAGGTCTT | 231 |
| Bol014239 | 1482 | TTGTACCGCGTTCTCCTTCT | GACACCATCCTCTGACCCAA | 238 | |
| CYP81F3 | Bol028919 | 1500 | TAACAGCGGAGGAGAAGACG | CACCTTCTAACTGGGCCTGA | 260 |
| Bol032711 | 1492 | CCGTCTCACCAACTTCCTCT | CTTCTCAAAGCTCCCTCCCA | 292 | |
| IGMT1 | Bol007029 | 1119 | GTGTTCCTCTCACCTTCCGA | GTGTTGAGGAAGACGCTGTC | 260 |
| Bol020663 | 342 | AGATGCCATGATCTTGAAACGT | CCAGCAATGATAAGCCTGACA | 298 | |
| Glucosinolate break-down-related genes (5 genes) | |||||
| TGG1 | Bol017328 | 822 | TCTTAACGTGTGGGATGGCT | CCTCCTTTGTTCACTCCCCT | 210 |
| TGG2 | Bol028319 | 1179 | TCGTCTCAACAGTAGCAGCT | AGTAGCGTTGAGTTCGTCCA | 220 |
| Bol025706 | 663 | GGTGAGTAGGGGAGTGAACC | TTCCTCGGTGAAGTTGGGAA | 244 | |
| TGG5 | Bol031599 | 1326 | CCAGATCACAGTTCCGGAGA | ACTATACGCCGGCTCAAGAA | 293 |
| PEN2 | Bol030092 | 1299 | GCATCATCATCCAACAGCGT | ACGCCTTGATCAGTTCTCCA | 207 |
| House-keeping genes | |||||
| actin1 | AF044573 | TTCTCTCTTCCACACGCCAT | CTTGTCCTGCGGGTAATTCG | 235 | |
| cctin2 | JQ435879 | GTCGCTATTCAAGCTGTTCTCT | GAGAGCTTCTCCTTGATGTCTC | 251 | |
| actin3 | XM_013753106 | ATCACACTTTCTACAATGAGC | TCGTAGATTGGCACAGTGTGAG | 241 | |
© 2016 by the authors. Licensee MDPI, Basel, Switzerland. This article is an open access article distributed under the terms and conditions of the Creative Commons Attribution (CC-BY) license ( http://creativecommons.org/licenses/by/4.0/).
Share and Cite
Robin, A.H.K.; Yi, G.-E.; Laila, R.; Yang, K.; Park, J.-I.; Kim, H.R.; Nou, I.-S. Expression Profiling of Glucosinolate Biosynthetic Genes in Brassica oleracea L. var. capitata Inbred Lines Reveals Their Association with Glucosinolate Content. Molecules 2016, 21, 787. https://doi.org/10.3390/molecules21060787
Robin AHK, Yi G-E, Laila R, Yang K, Park J-I, Kim HR, Nou I-S. Expression Profiling of Glucosinolate Biosynthetic Genes in Brassica oleracea L. var. capitata Inbred Lines Reveals Their Association with Glucosinolate Content. Molecules. 2016; 21(6):787. https://doi.org/10.3390/molecules21060787
Chicago/Turabian StyleRobin, Arif Hasan Khan, Go-Eun Yi, Rawnak Laila, Kiwoung Yang, Jong-In Park, Hye Ran Kim, and Ill-Sup Nou. 2016. "Expression Profiling of Glucosinolate Biosynthetic Genes in Brassica oleracea L. var. capitata Inbred Lines Reveals Their Association with Glucosinolate Content" Molecules 21, no. 6: 787. https://doi.org/10.3390/molecules21060787