
Metabolic Profile Changes of CCl4-Liver Fibrosis and Inhibitory Effects of Jiaqi Ganxian Granule

Abstract
:
1. Introduction
2. Results and Discussion
2.1. Serum Markers Tests
2.2. Histological Changes Induced by CCl4
2.3. Collagen Change Induced by CCl4
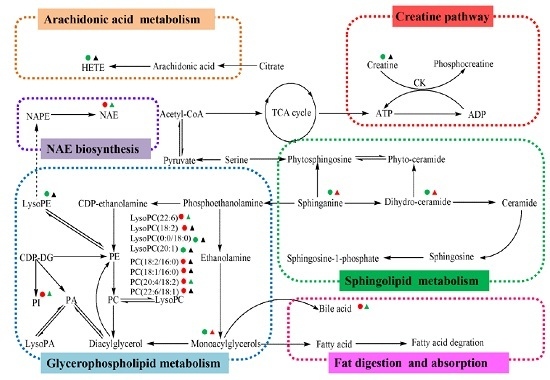
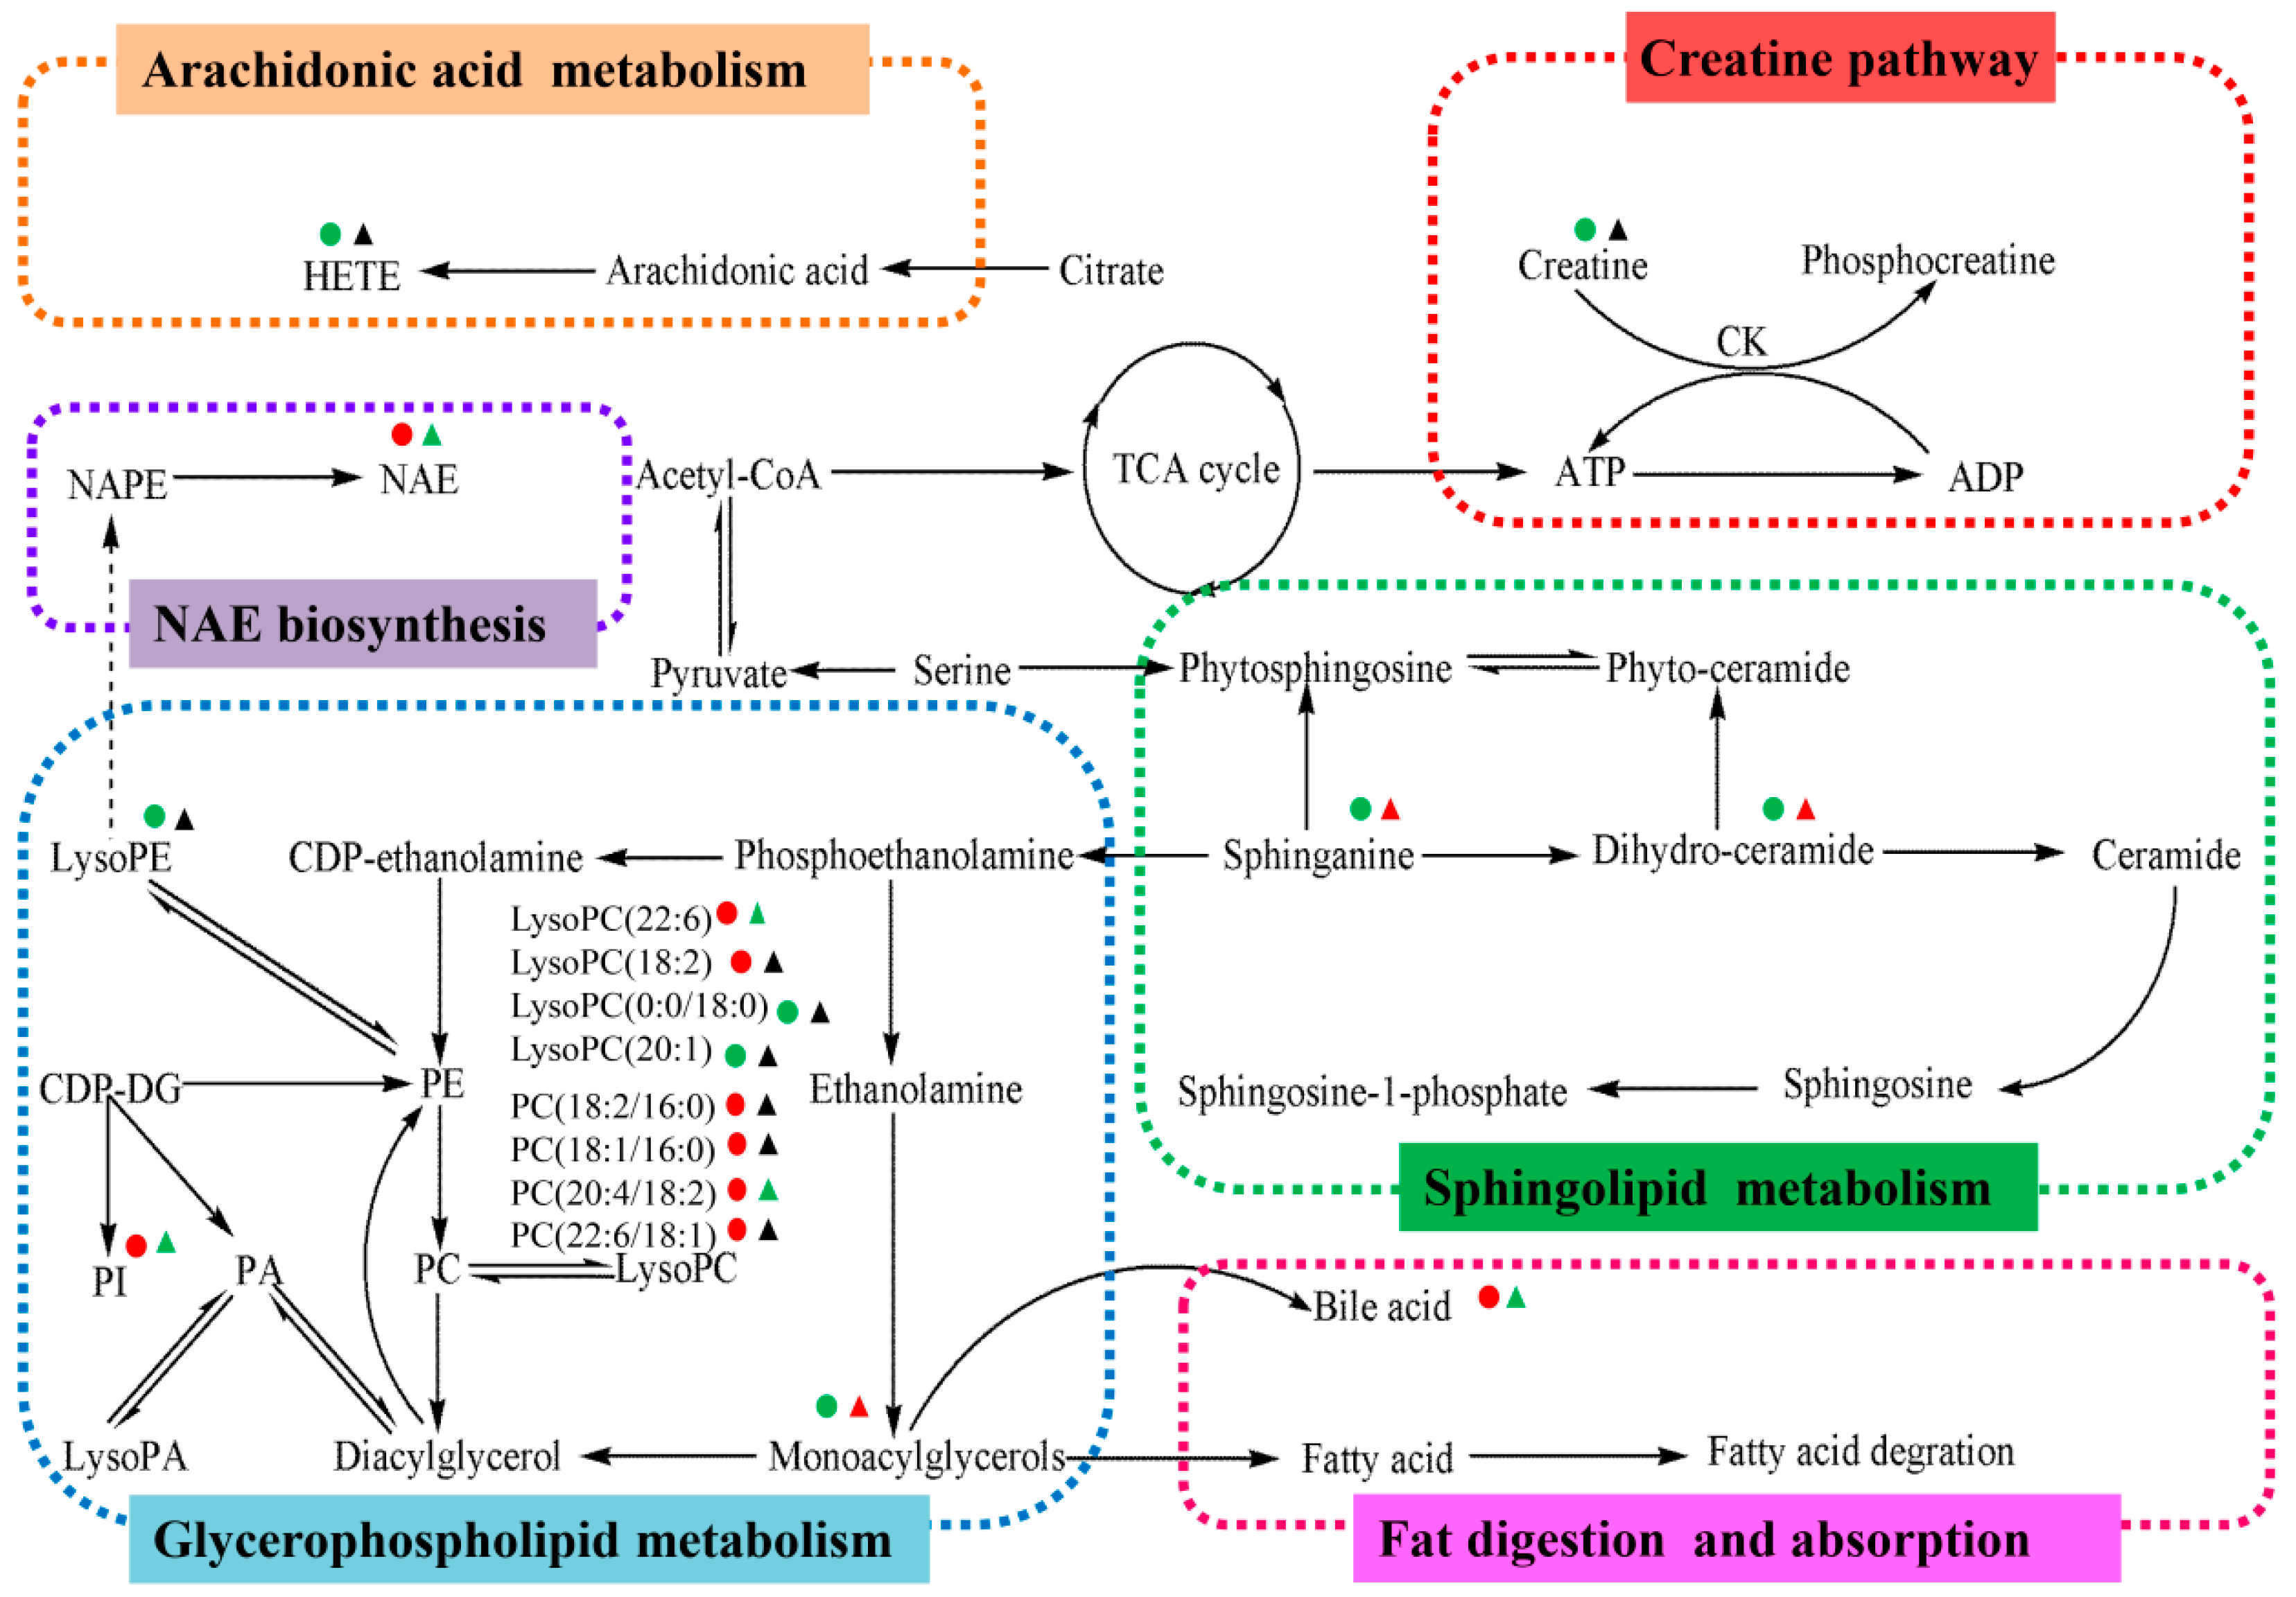
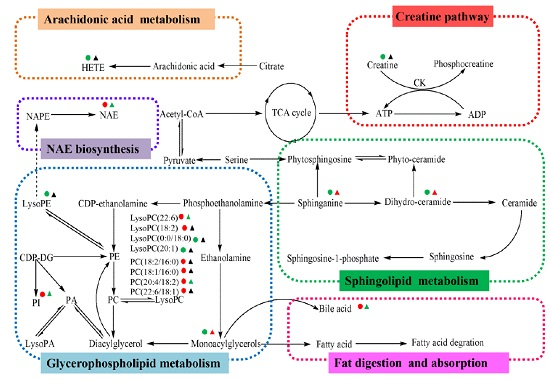
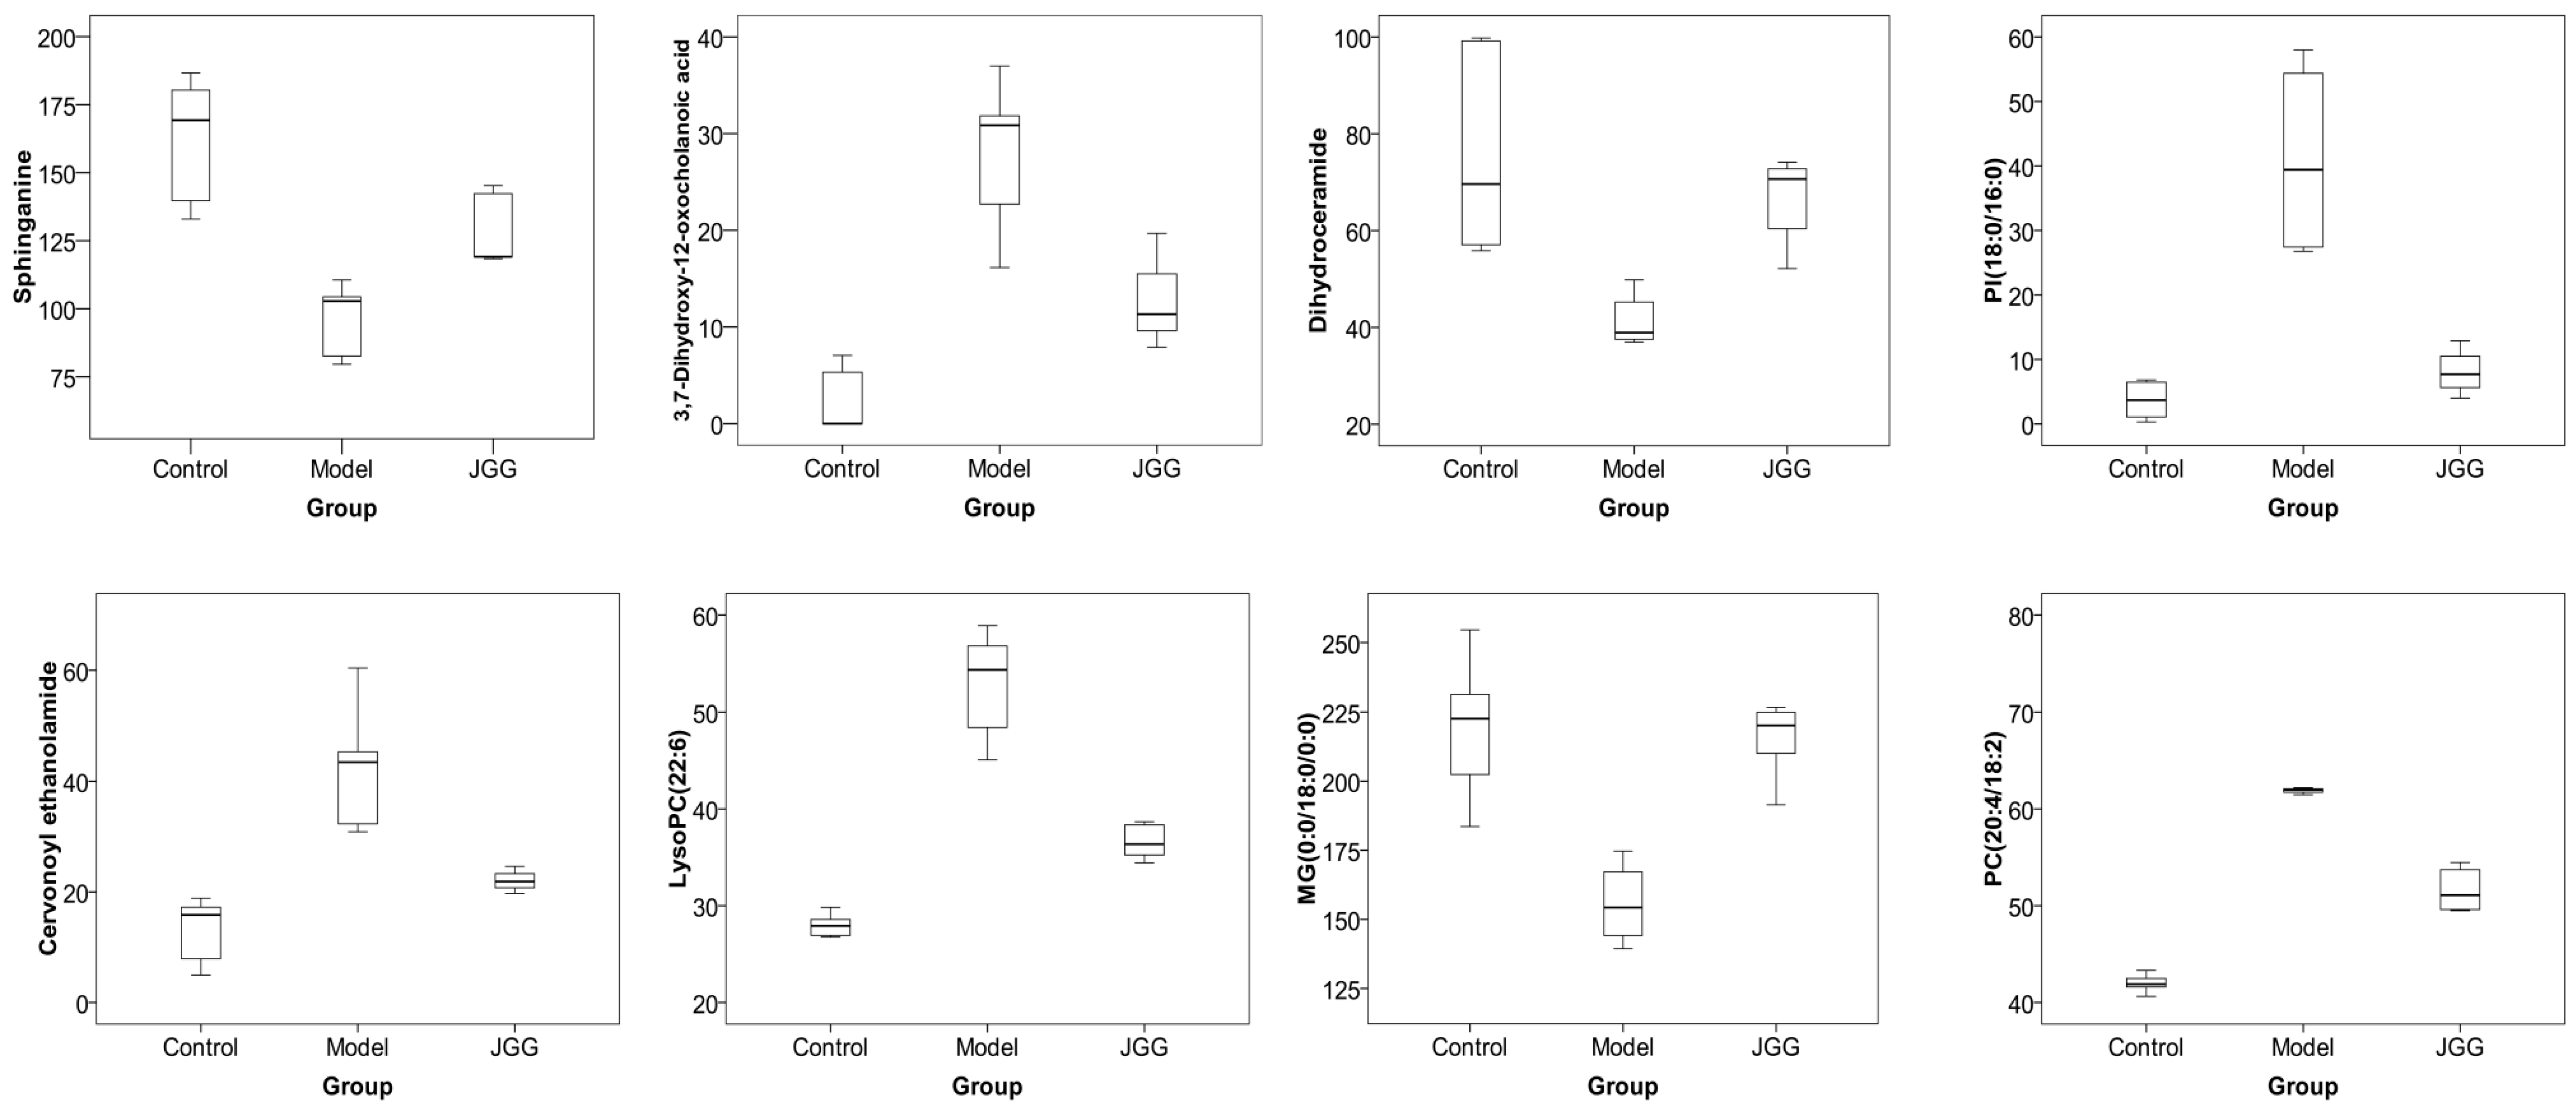
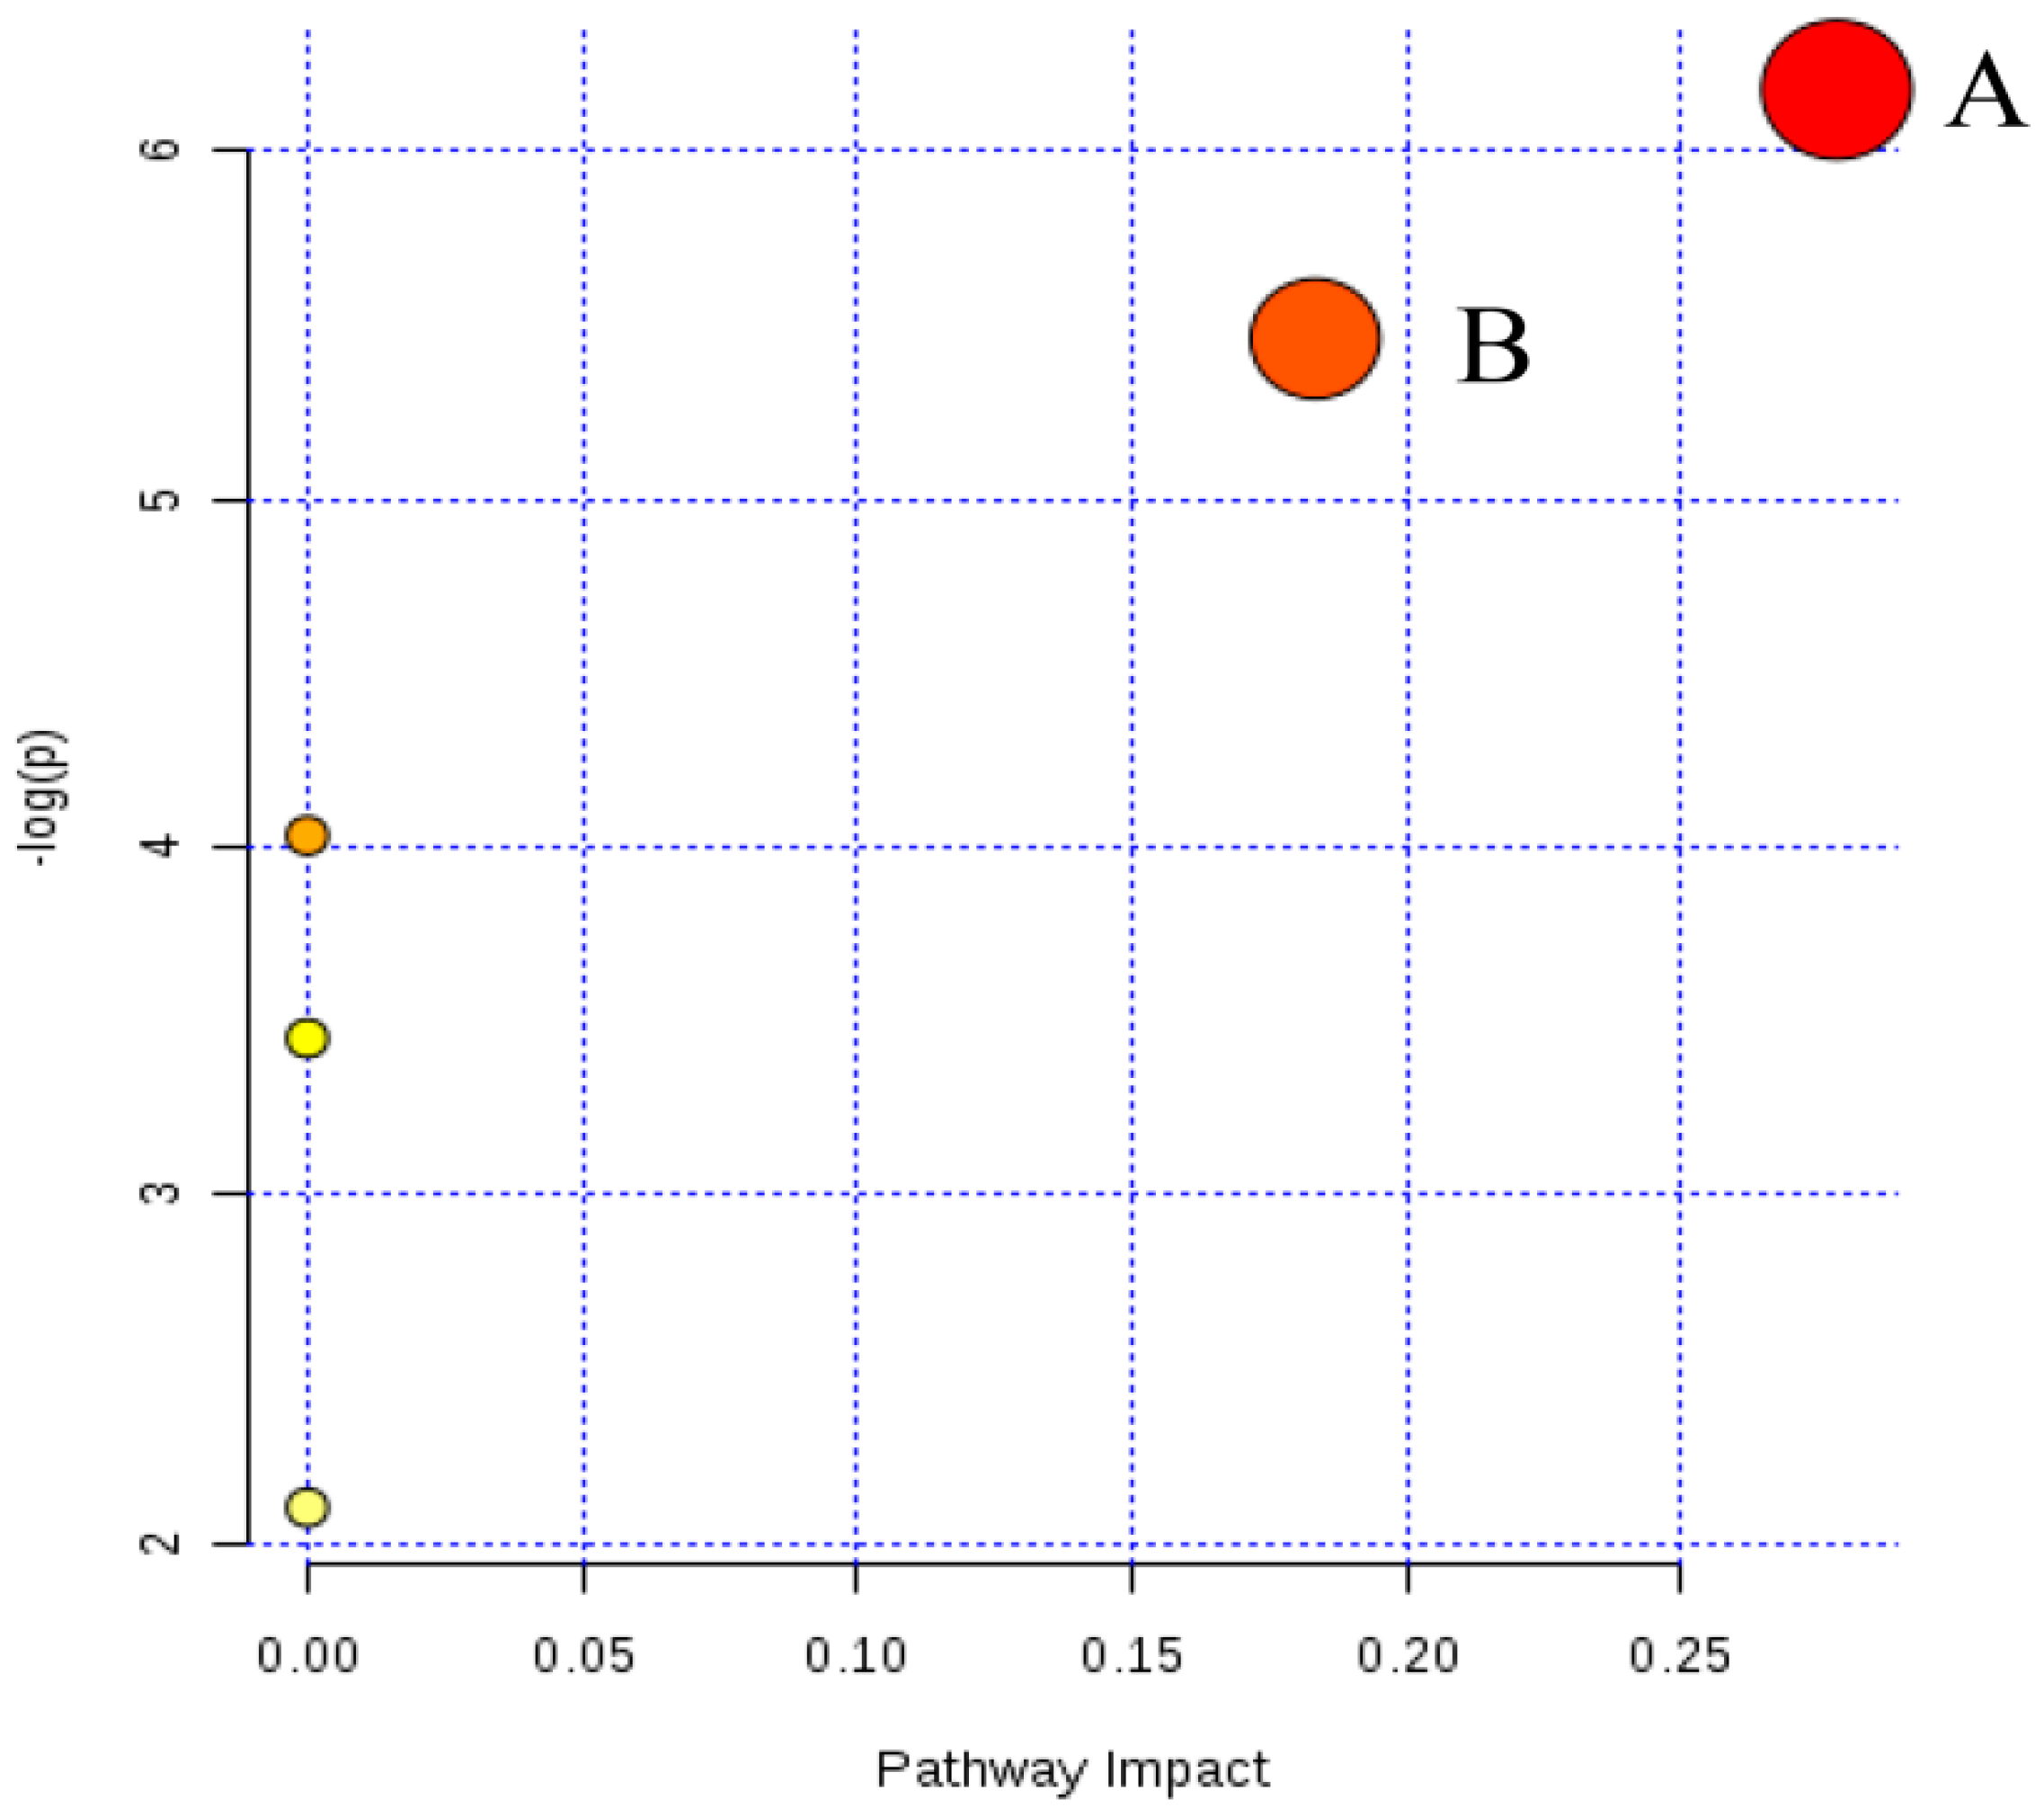
2.4. Metabolic Changes in the Model and Drug Intervention Groups
2.4.1. Creatine Pathway
2.4.2. Arachidonic Acid Metabolism
2.4.3. Glycerophospholipid Metabolism
2.4.4. Sphingolipid Metabolism
2.4.5. Fat Digestion and Absorption
2.4.6. N-Acylethanolamine Biosynthesis
3. Materials and Methods
3.1. Chemicals and Reagents
3.2. JGG Preparation
3.3. Animals and Grouping Design
3.4. Samples Collection
3.5. Analysis of Serum Markers
3.6. Histopathological Analysis
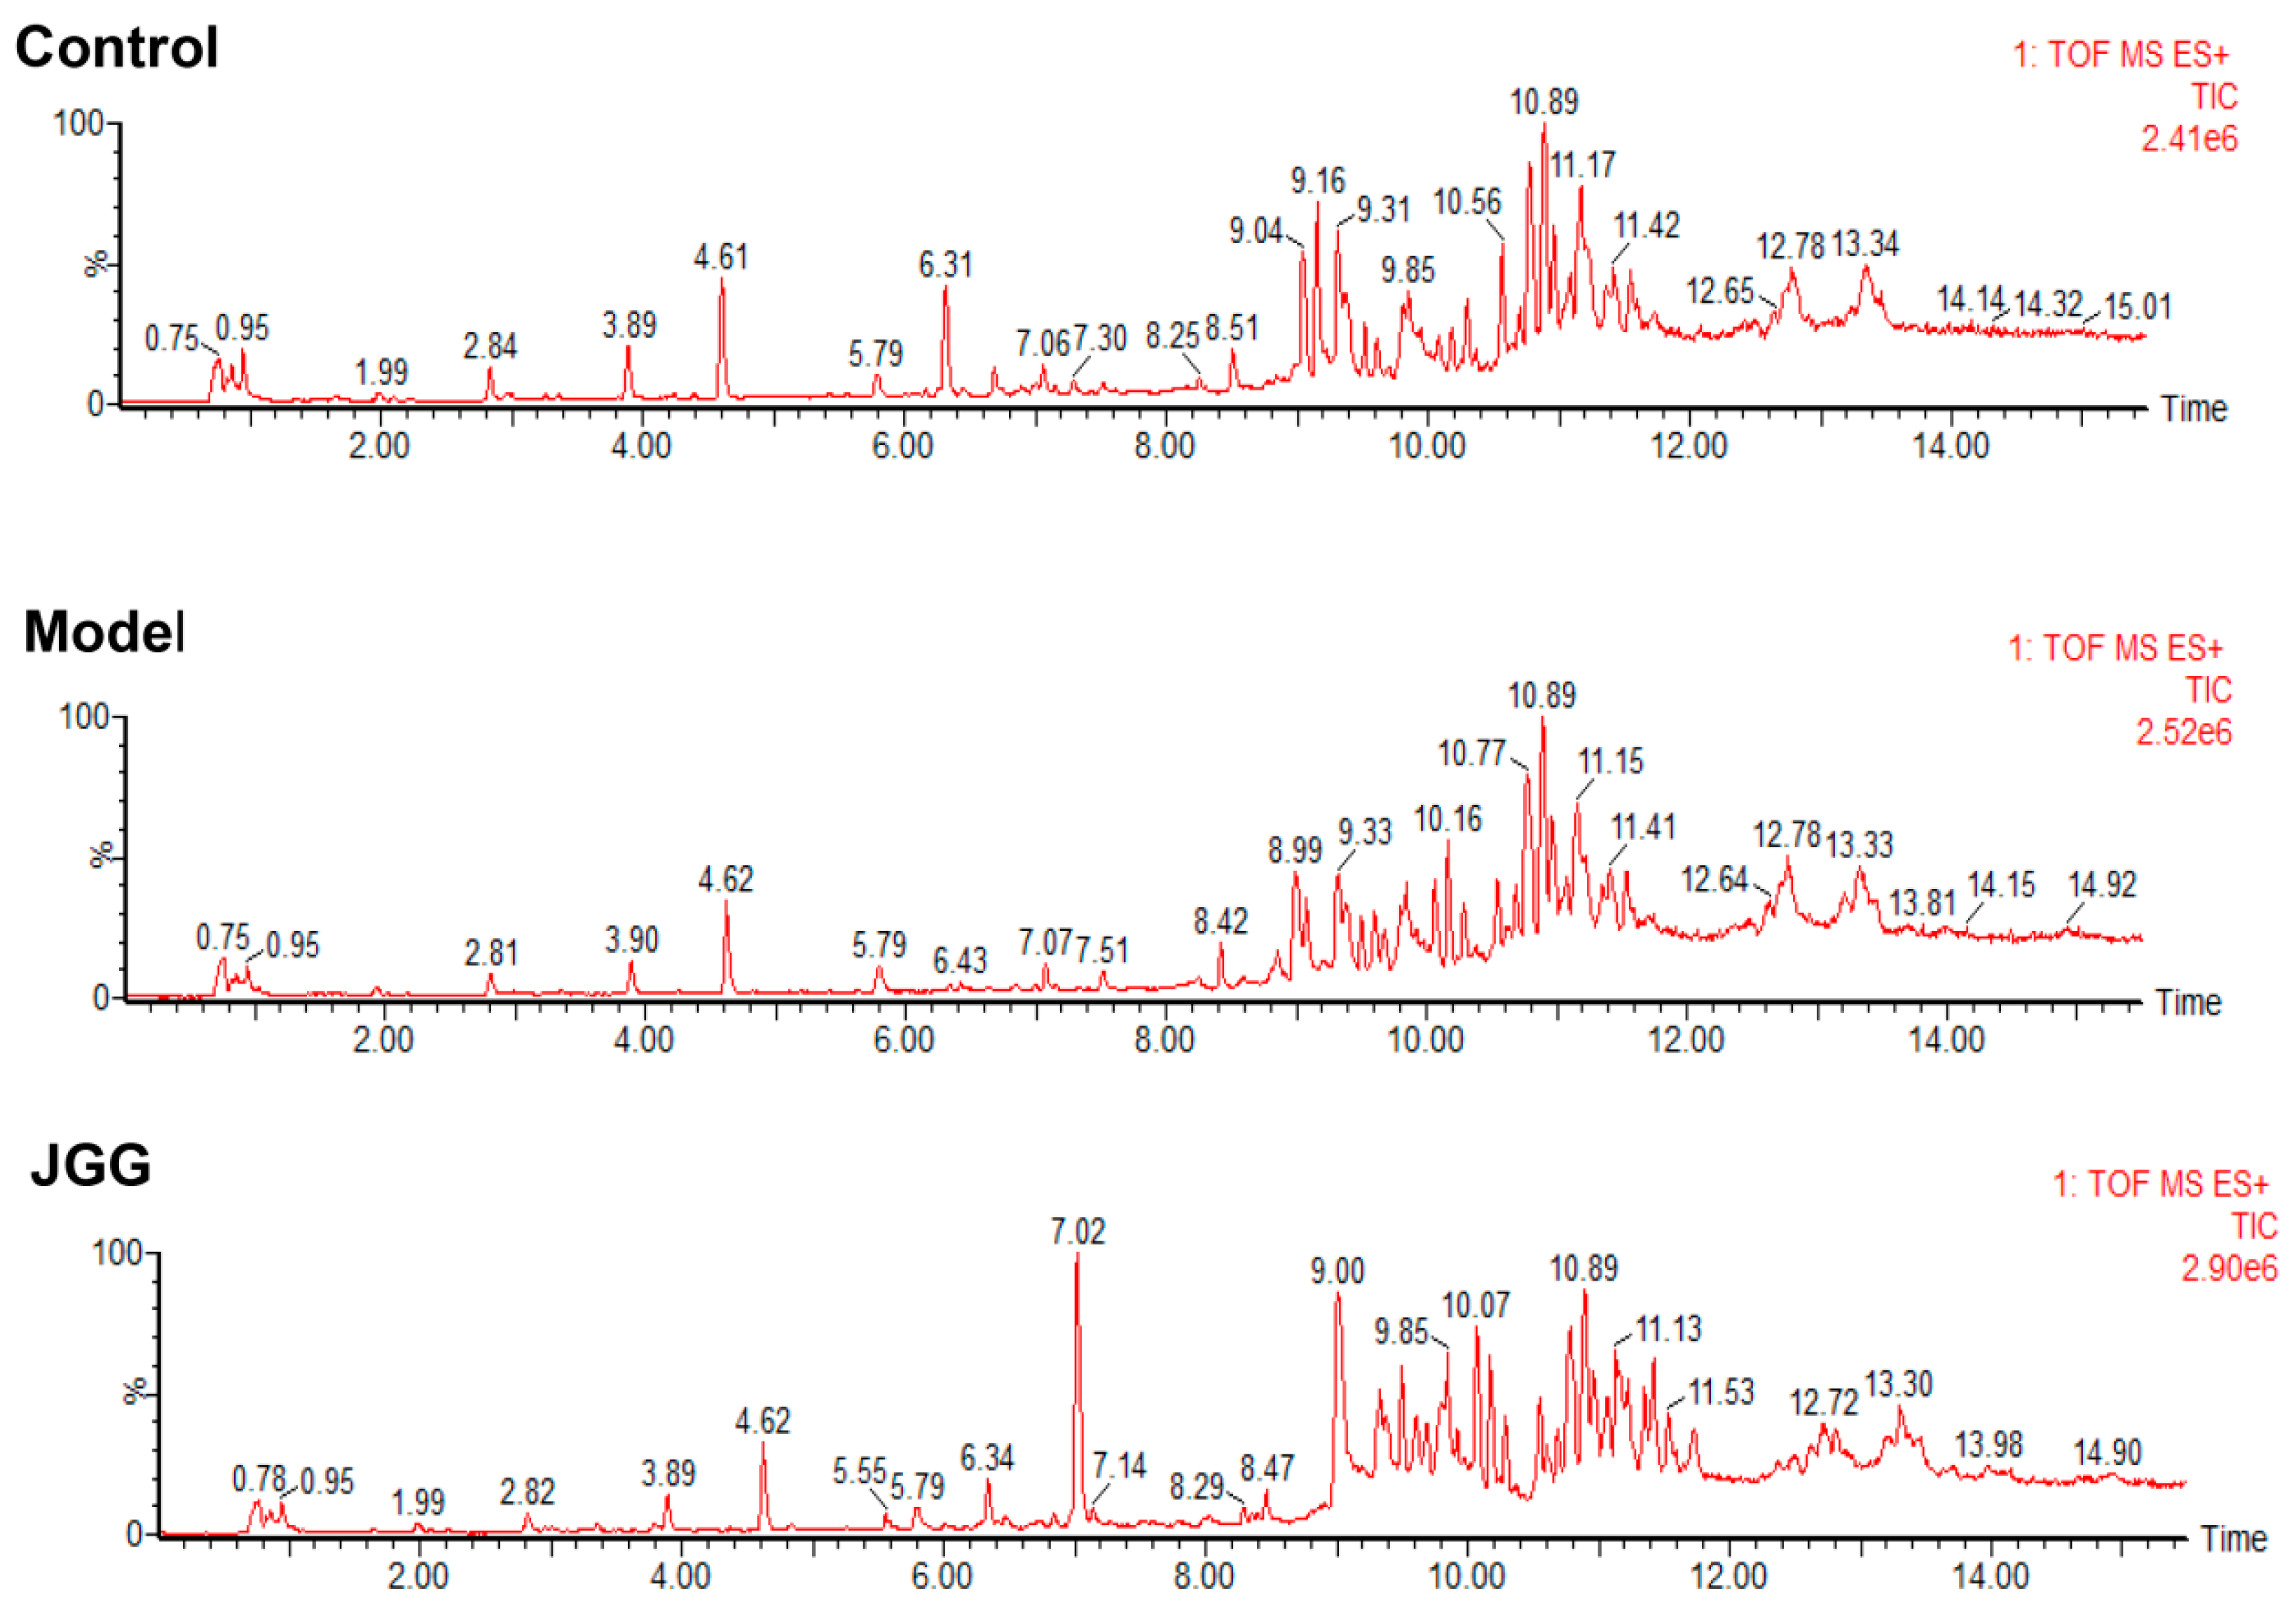
3.7. Metabolomics Analysis
3.7.1. Serum Sample Preparation
3.7.2. UPLC-MS Analysis
3.7.3. Analytical Method Validation
3.7.4. Data Analysis
4. Conclusions
Supplementary Materials
Acknowledgments
Author Contributions
Conflicts of Interest
Abbreviations
| Bas | Bile Acids |
| CDP-Etn | CDP-Ethanolamine |
| CDP-DG | CDP-Diacylglycerol |
| Cer | Ceramide |
| CIV | Collagen Type IV |
| Cr | Creatine |
| CK | Creatine Kinase |
| DG | Diacylglycerol |
| Dih-Cer | Dihydro-Ceramide |
| ECM | Extracellular Matrix |
| Etn | Ethanolamine |
| FA | Fatty Acid |
| GPs | Glycerophospholipids |
| HA | Hyaluronic Acid |
| HE | Hematoxylin and Eosin |
| HETEs | Hydroxyeicosatetraenoic Acids |
| LPCAT | Lysophosphatidylcholine Acyltransferase |
| LN | Laminin |
| LysoPA | Lysophosphatidic Acids |
| LysoPC | Lysophosphatidylcholine |
| LysoPE | Lysophosphatidyl Ethanolamine |
| NAFLD | Non-Alcoholic Fatty Liver Disease |
| NAEs | N-Acylethanolamines |
| NAPEs | N-Acylphosphatidyl Ethanolamines |
| MGs | Monoacylglycerols |
| PA | Phosphatidic Acid |
| PC | Phosphatidylcholine |
| PCIII | Procollagen Type III |
| PCr | Phosphocreatine |
| PE | Phosphatidylethanolamine |
| p-Etn | Phosphoethanolamine |
| Phyto-Cer | Phyto-Ceramide |
| PhytoSPH | Phytosphingosine |
| PI | Phosphoinositides |
| PLA2 | Phospholipase A2 |
| PS | Phosphatidylserine |
| Q-TOF | Quadrupole-Time-Of-Flight |
| QC | Quality Control |
| Sa | Sphinganine |
| Ser | Serine |
| So | Sphingosine |
| S1P | Sphingosine-1-Phosphate |
| TCMs | Traditional Chinese Medicines |
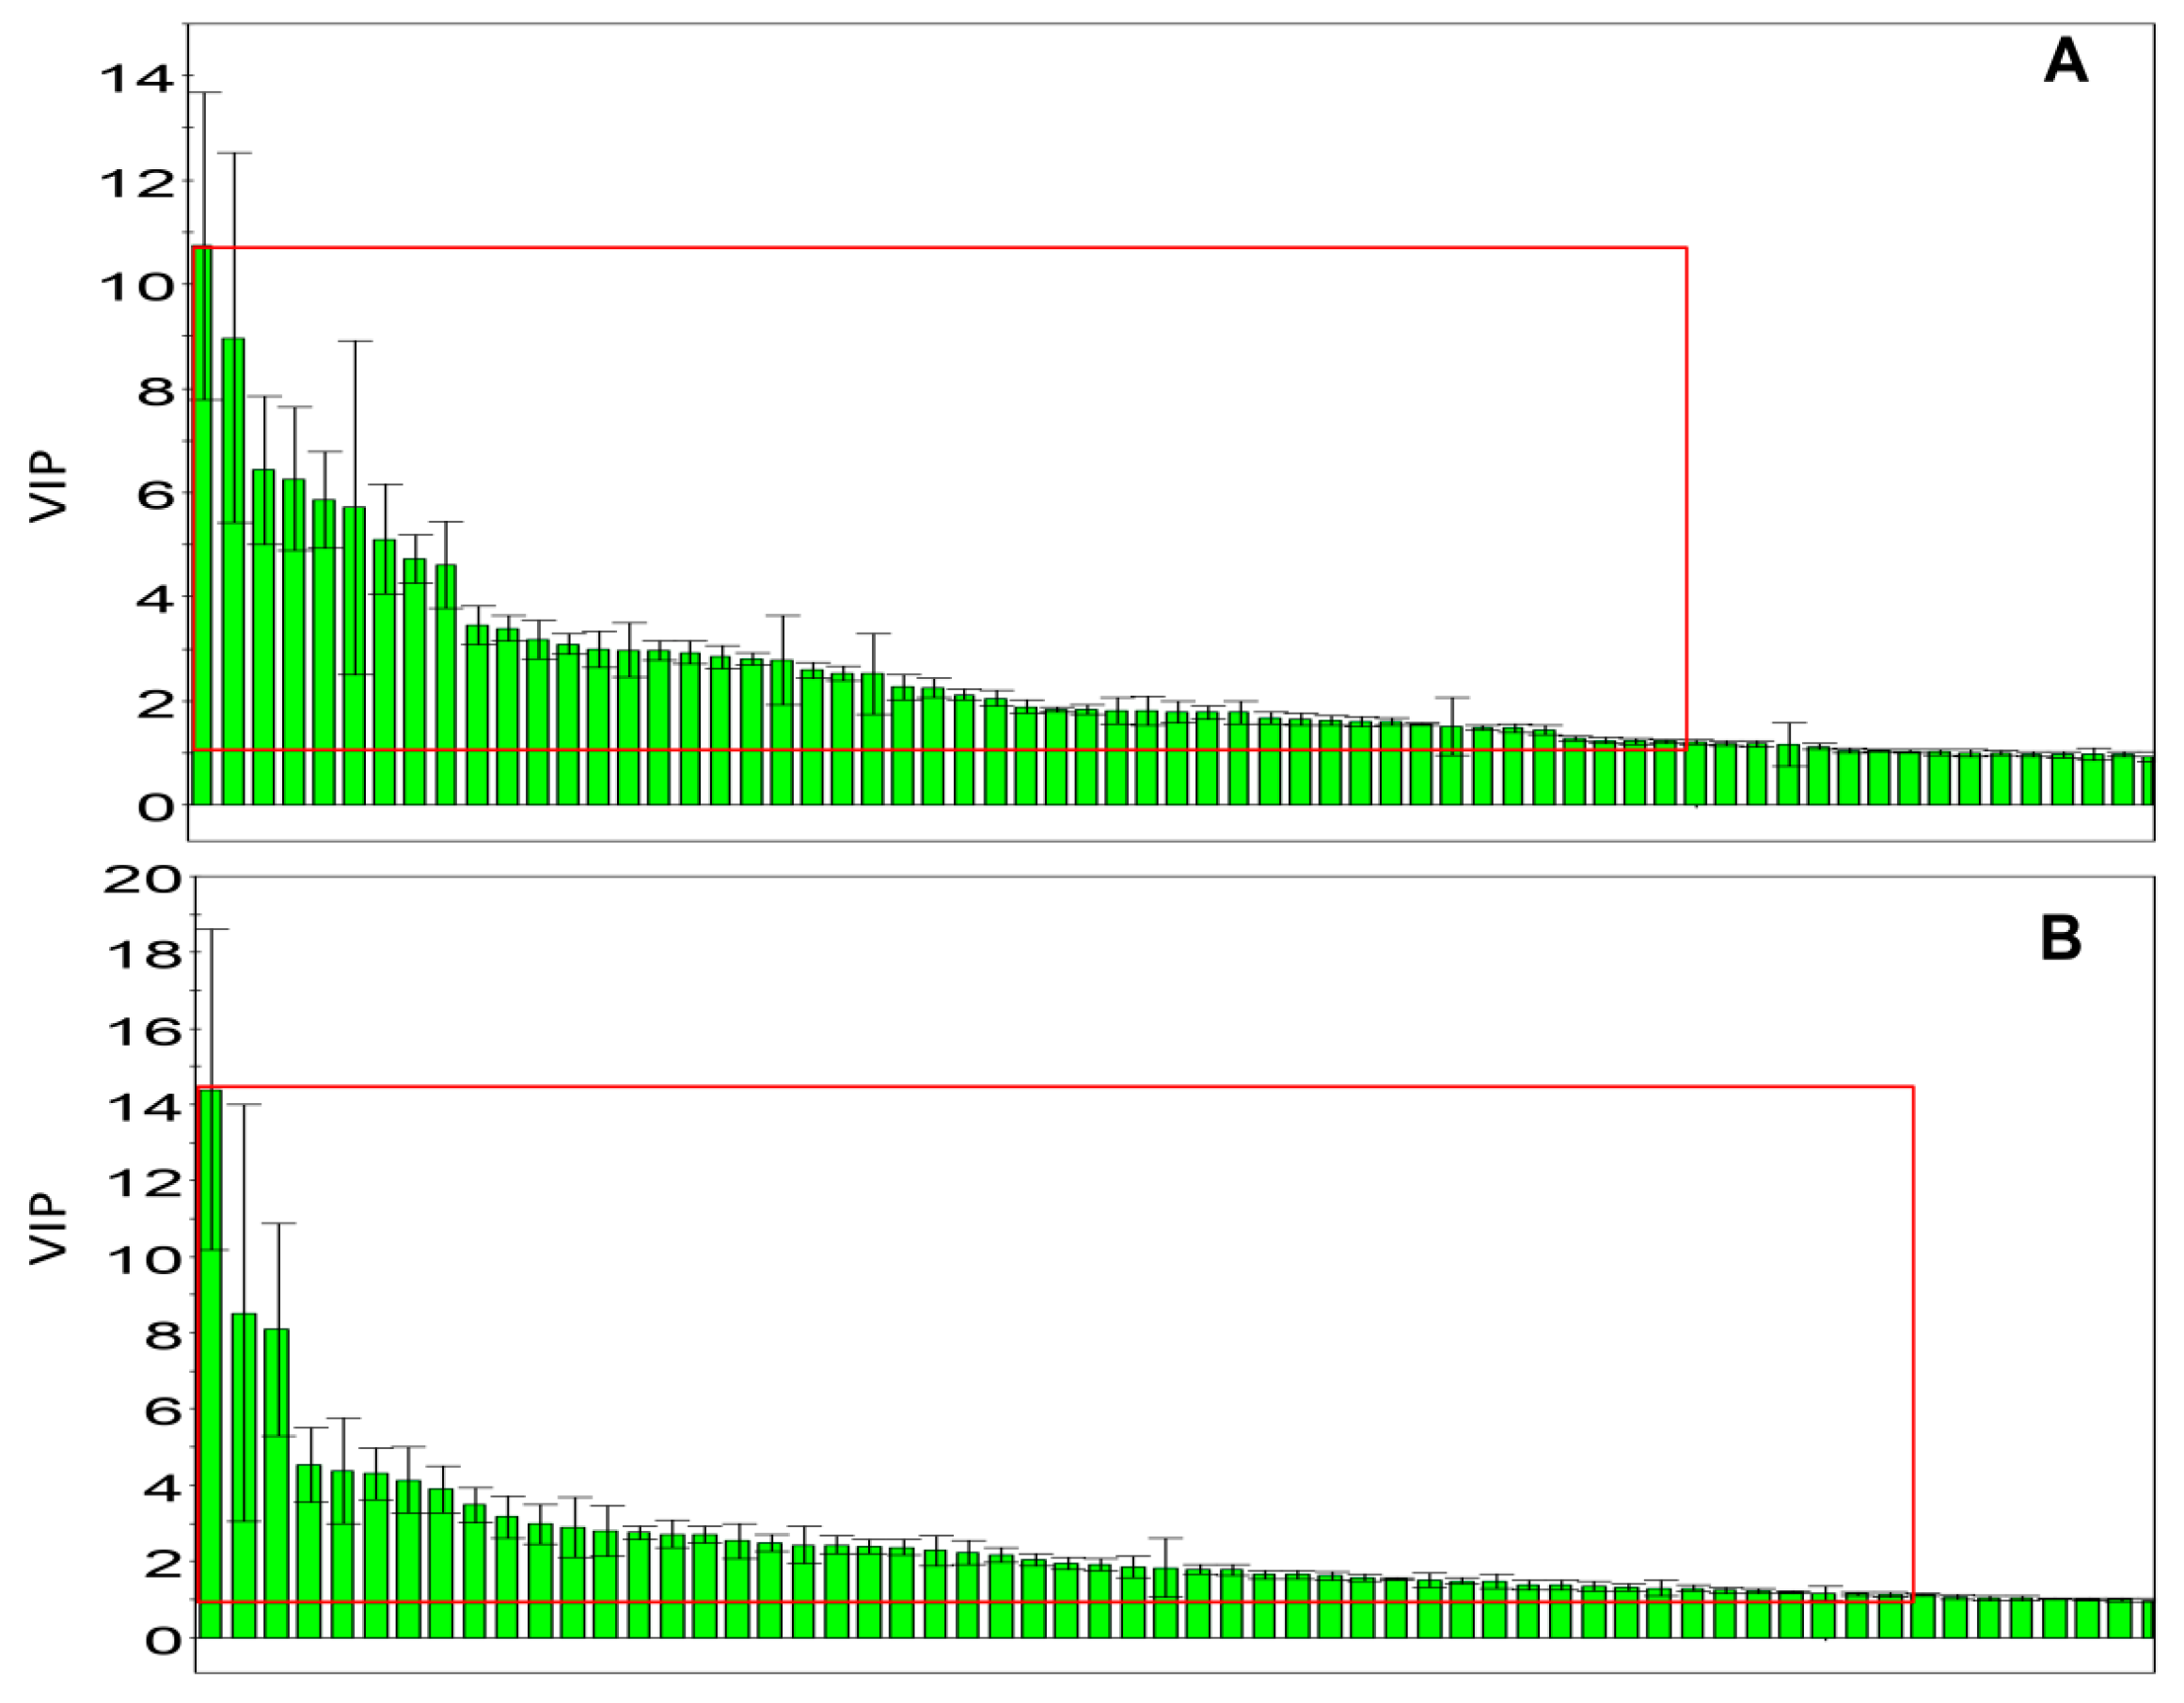
| VIP | Variable Importance Projection |
References
- Wang, P.; Liang, Y.Z. Chemical composition and inhibitory effect on hepatic fibrosis of Danggui Buxue Decoction. Fitoterapia 2010, 81, 793–798. [Google Scholar] [CrossRef] [PubMed]
- Kisseleva, T.; Brenner, D.A. Hepatic stellate cells and the reversal of fibrosis. J. Gastroenterol. Hepatol. 2006, 21, S84–S87. [Google Scholar] [CrossRef] [PubMed]
- Wang, L.; Cheng, D.; Wang, H.; Di, L.; Zhou, X.; Xu, T.; Yang, X.; Liu, Y. The hepatoprotective and antifibrotic effects of Saururus chinensis against carbon tetrachloride induced hepatic fibrosis in rats. J. Ethnopharmacol. 2009, 126, 487–491. [Google Scholar] [CrossRef] [PubMed]
- Schuppan, D.; Kim, Y.O. Evolving therapies for liver fibrosis. J. Clin. Investig. 2013, 123, 1887–1901. [Google Scholar] [CrossRef] [PubMed]
- Vercelino, R.; Crespo, I.; de Souza, G.F.; Cuevas, M.J.; de Oliveira, M.G.; Marroni, N.P.; Gonzalez-Gallego, J.; Tunon, M.J. S-nitroso-N-acetylcysteine attenuates liver fibrosis in cirrhotic rats. J. Mol. Med. 2010, 88, 401–411. [Google Scholar] [CrossRef] [PubMed]
- Scott, S.; Thompson, J. Adverse drug reactions. Anaesth. Intensive Care Med. 2014, 15. [Google Scholar] [CrossRef]
- Lin, X.; Zhang, S.; Huang, Q.; Wei, L.; Zheng, L.; Chen, Z.; Jiao, Y.; Huang, J.; Fu, S.; Huang, R. Protective effect of Fufang-Liu-Yue-Qing, a traditional Chinese herbal formula, on CCl4 induced liver fibrosis in rats. J. Ethnopharmacol. 2012, 142, 548–556. [Google Scholar] [CrossRef] [PubMed]
- Murakami, N.; Saka, M.; Shimada, H.; Matsuda, H.; Yamahara, J.; Yoshikawa, M. New bioactive monoterpene glycosides from Paeoniae Radix. Chem. Pharm. Bull. 1996, 44, 1279–1281. [Google Scholar] [CrossRef] [PubMed]
- Nishizawa, M.; Yamagishi, T.; Nonaka, G.; Nishioka, I.; Nagasawa, T.; Oura, H. Tannins and related compounds. XII. Isolation and characterization of galloylglucoses from Paeoniae Radix and their effects on urea-nitrogen concentration in rat serum. Chem. Pharm. Bull. 1983, 31, 2593–2600. [Google Scholar] [CrossRef] [PubMed]
- Kohei, K.; Kazuko, Y.; Yasushisa, S.; Akira, I.; Toshiko, S. Triterpenoids and floavonoids from Paeonia lactiflor. Phytochemistry 1997, 44, 141–144. [Google Scholar]
- He, C.; Peng, Y.; Feng, Y.; Peng, B.; Wang, Z.; Xiao, P. Quick comparison of Radix Paeonia Alba, Radix Paeonia Rubra, and Cortex Moutan by high performance liquid chromatography coupled with monolithic columns and their chemical pattern recognition. Pharmacogn. Mag. 2012, 8, 237–243. [Google Scholar]
- Zhang, J.; Yang, X.D.; Song, G.C. The protect effect of achyranthes bidentata blume polysaccharides on cerebrum tissue of diabetic rats and its mechanism. Zhong Yi Yao Tong Bao 2010, 5, 58–59. [Google Scholar]
- Zheng, Y.Z.; Liu, B. Progress in study on phytosterones in radix achyranthes bidentata. Ke Ji Tong Bao 2008, 24, 820–826. [Google Scholar]
- Li, J.; Qi, H.; Qi, L.W.; Yi, L.; Li, P. Simultaneous determination of main phytoecdysones and triterpenoids in radix achyranthis bidentatae by high-performance liquid chromatography with diode array-evaporative light scattering detectors and mass spectrometry. Anal. Chim. Acta 2007, 596, 264–272. [Google Scholar] [CrossRef] [PubMed]
- Cuella, M.J.; Giner, R.M.; Recio, M.C.; Just, M.J.; Manez, S.; Rios, J.L. Two fungal lanostane derivatives as phospholipase A2 inhibitors. J. Nat. Prod. 1996, 59, 977–979. [Google Scholar] [CrossRef] [PubMed]
- Lee, K.Y.; You, H.J.; Jeong, H.G.; Kang, J.S.; Kim, H.M.; Rhee, S.D.; Jeon, Y.J. Polysaccharide isolated from Poria cocos sclerotium induces NF-κB/Rel activation and iNOS expression through the activation of p38 kinase in murine macrophages. Int. Immunopharmacol. 2004, 4, 1029–1038. [Google Scholar] [CrossRef] [PubMed]
- Jin, Y.; Zhang, L.; Zhang, M.; Chen, L.; Cheung, P.C.; Oi, V.E.; Lin, Y. Antitumor activities of heteropolysaccharides of Poria cocos mycelia from different strains and culture media. Carbohydr. Res. 2003, 338, 1517–1521. [Google Scholar] [CrossRef]
- Yang, C.; Zhao, J.; Cheng, Y.; Li, X.; Rong, J. Bioactivity-guided fractionation identifies amygdalin as a potent neurotrophic agent from herbal medicine Semen Persicae extract. Biomed. Res. Int. 2014, 2014. [Google Scholar] [CrossRef] [PubMed]
- Yang, N.Y.; Liu, L.; Tao, W.W.; Duan, J.A.; Liu, X.H.; Huang, S.P. Antithrombotic lipids from Semen Persicae. Nat. Prod. Res. 2011, 25, 1650–1656. [Google Scholar] [CrossRef] [PubMed]
- Guo, Z.; Cai, R.; Su, H.; Li, Y. Alkaloids in Processed Rhizoma Corydalis and Crude Rhizoma Corydalis Analyzed by GC/MS. J. Anal. Methods Chem. 2014, 2014. [Google Scholar] [CrossRef] [PubMed]
- Zhao, Y.; Hellum, B.H.; Liang, A.; Nilsen, O.G. The in vitro inhibition of human CYP1A2, CYP2D6 and CYP3A4 by tetrahydropalmatine, neferine and berberine. Phytother. Res. 2012, 26, 277–283. [Google Scholar] [CrossRef] [PubMed]
- Chan, L.W.; Cheah, E.L.; Saw, C.L.; Weng, W.; Heng, P.W. Antimicrobial and antioxidant activities of Cortex Magnoliae Officinalis and some other medicinal plants commonly used in South-East Asia. Chin. Med. 2008, 3. [Google Scholar] [CrossRef] [PubMed]
- Lo, Y.C.; Teng, C.M.; Chen, C.F.; Chen, C.C.; Hong, C.Y. Magnolol and honokiol isolated from Magnolia officinalis protect rat heart mitochondria against lipid peroxidation. Biochem. Pharmacol. 1994, 47, 549–553. [Google Scholar] [PubMed]
- Xu, F.; Zhang, Y.; Xiao, S.; Lu, X.; Yang, D.; Yang, X.; Li, C.; Shang, M.; Tu, P.; Cai, S. Absorption and metabolism of Astragali radix decoction: in silico, in vitro, and a case study in vivo. Drug Metab. Dispos. 2006, 34, 913–924. [Google Scholar] [CrossRef] [PubMed]
- Ullah, H.M.; Zaman, S.; Juhara, F.; Akter, L.; Tareq, S.M.; Masum, E.H.; Bhattacharjee, R. Evaluation of antinociceptive, in vivo & in vitro anti-inflammatory activity of ethanolic extract of Curcuma zedoaria rhizome. BMC Complement. Altern. Med. 2014, 14. [Google Scholar] [CrossRef]
- Jang, M.K.; Lee, H.J.; Kim, J.S.; Ryu, J.H. A curcuminoid and two sesquiterpenoids from Curcuma zedoaria as inhibitors of nitric oxide synthesis in activated macrophages. Arch. Pharm. Res. 2004, 27, 1220–1225. [Google Scholar] [CrossRef] [PubMed]
- Tang, Y.; Hu, C.; Liu, Y. Effect of bioactive peptide of Carapax Trionycis on TGF-β1-induced intracellular events in hepatic stellate cells. J. Ethnopharmacol. 2013, 148, 69–73. [Google Scholar] [CrossRef] [PubMed]
- Tang, Q.; Dai, Y.; Liu, X. Immunomodulatory effects of orally administered aqueous extract from Eupolyphaga sinensis Walker. Afr. J. Biotechnol. 2010, 9, 8682–8686. [Google Scholar]
- Jiang, H.L.; Luo, X.H.; Wang, X.Z.; Yang, J.L.; Yao, X.J.; Crews, P.; Valeriote, F.A.; Wu, Q.X. New isocoumarins and alkaloid from Chinese insect medicine, Eupolyphaga sinensis Walker. Fitoterapia 2012, 83, 1275–1280. [Google Scholar] [CrossRef] [PubMed]
- Kim, I.D.; Ha, B.J. The effects of paeoniflorin on LPS-induced liver inflammatory reactions. Arch. Pharm. Res. 2010, 33, 959–966. [Google Scholar] [CrossRef] [PubMed]
- Liu, C.H.; Wang, X.L.; Liu, P.; Gu, H.T.; Hu, Y.Y. A study on Fu Zheng Hua Yu Fang and its ingredients on production of collagen in the liver. J. Tradit. Chin. Med. 2000, 41. [Google Scholar] [CrossRef]
- Pan, T.L.; Wang, P.W. Explore the Molecular Mechanism of Apoptosis Induced by Tanshinone IIA on Activated Rat Hepatic Stellate Cells. Evid. Based Complement. Altern. Med. 2012, 2012. [Google Scholar] [CrossRef] [PubMed]
- Li, X.; Wang, X.; Han, C.; Xing, G.; Zhou, L.; Li, G.; Niu, Y. Astragaloside IV suppresses collagen production of activated hepatic stellate cells via oxidative stress-mediated p38 MAPK pathway. Free Radic. Biol. Med. 2013, 60, 168–176. [Google Scholar] [CrossRef] [PubMed]
- Ji, G.; Liu, P.; Hu, Y.Y.; Hong, J.H.; Liu, H.C.; Liu, W. Hepatocyte function changes during acute injury by CC14 fumingating and regulation of Fuzhenghuayu decoction serum. Chin. J. Integr. Tradit. West. Med. Liver Dis. 1998, 8, 215–218. [Google Scholar]
- Becker, S.; Kortz, L.; Helmschrodt, C.; Thiery, J.; Ceglarek, U. LC-MS-based metabolomics in the clinical laboratory. J. Chromatogr. B Anal. Technol. Biomed. Life Sci. 2012, 883–884, 68–75. [Google Scholar] [CrossRef] [PubMed]
- Peng, J.B.; Jia, H.M.; Liu, Y.T.; Zhang, H.W.; Dong, S.; Zou, Z.M. Qualitative and quantitative characterization of chemical constituents in Xin-Ke-Shu preparations by liquid chromatography coupled with a LTQ Orbitrap mass spectrometer. J. Pharm. Biomed. 2011, 55, 984–995. [Google Scholar] [CrossRef] [PubMed]
- Sun, H.; Zhang, A.H.; Zou, D.X.; Sun, W.J.; Wu, X.H.; Wang, X.J. Metabolomics coupled with pattern recognition and pathway analysis on potential biomarkers in liver injury and hepatoprotective effects of yinchenhao. Appl. Biochem. Biotechnol. 2014, 173, 857–869. [Google Scholar] [CrossRef] [PubMed]
- Zhang, A.; Sun, H.; Wang, X. Urinary metabolic profiling of rat models revealed protective function of scoparone against alcohol induced hepatotoxicity. Sci. Rep. 2014, 4. [Google Scholar] [CrossRef] [PubMed]
- McCuskey, R.S.; Ito, Y.; Robertson, G.R.; McCuskey, M.K.; Perry, M.; Farrell, G.C. Hepatic microvascular dysfunction during evolution of dietary steatohepatitis in mice. Hepatology 2004, 40, 386–393. [Google Scholar] [CrossRef] [PubMed]
- Rinella, M.E.; Green, R.M. The methionine-choline deficient dietary model of steatohepatitis does not exhibit insulin resistance. J. Hepatol. 2004, 40, 47–51. [Google Scholar] [CrossRef] [PubMed]
- Palmes, D.; Spiegel, H.U. Animal models of liver regeneration. Biomaterials 2004, 25, 1601–1611. [Google Scholar] [CrossRef]
- Shaker, M.E.; Zalata, K.R.; Mehal, W.Z.; Shiha, G.E.; Ibrahim, T.M. Comparison of imatinib, nilotinib and silymarin in the treatment of carbon tetrachloride-induced hepatic oxidative stress, injury and fibrosis. Toxicol. Appl. Pharmacol. 2011, 252, 165–175. [Google Scholar] [CrossRef] [PubMed]
- Ueberham, E.; Low, R.; Ueberham, U.; Schonig, K.; Bujard, H.; Gebhardt, R. Conditional tetracycline-regulated expression of TGF-beta1 in liver of transgenic mice leads to reversible intermediary fibrosis. Hepatology 2003, 37, 1067–1078. [Google Scholar] [CrossRef] [PubMed]
- Bessman, S.P.; Carpenter, C.L. The creatine-creatine phosphate energy shuttle. Annu. Rev. Biochem. 1985, 54, 831–862. [Google Scholar] [CrossRef] [PubMed]
- Powell, W.S.; Rokach, J. Biosynthesis, biological effects, and receptors of hydroxyeicosatetraenoic acids (HETEs) and oxoeicosatetraenoic acids (oxo-ETEs) derived from arachidonic acid. Biochim. Biophys. Acta 2015, 1851, 340–355. [Google Scholar] [CrossRef] [PubMed]
- Fruchart, J.C. Peroxisome proliferator-activated receptor-alpha (PPARα): At the crossroads of obesity, diabetes and cardiovascular disease. Atherosclerosis 2009, 205. [Google Scholar] [CrossRef] [PubMed]
- Farooqui, A.A.; Ong, W.Y.; Farooqui, T. Lipid mediators in the nucleus: Their potential contribution to Alzheimer’s disease. Biochim. Biophys. Acta 2010, 1801, 906–916. [Google Scholar] [CrossRef] [PubMed]
- Faas, F.H.; Dang, A.Q.; Pollard, M.; Hong, X.M.; Fan, K.; Luckert, P.H.; Schutz, M. Increased phospholipid fatty acid remodeling in human and rat prostatic adenocarcinoma tissues. J. Urol. 1996, 156, 243–248. [Google Scholar] [CrossRef]
- Lieber, C.S.; Robins, S.J.; Li, J.; DeCarli, L.M.; Mak, K.M.; Fasulo, J.M.; Leo, M.A. Phosphatidylcholine protects against fibrosis and cirrhosis in the baboon. Gastroenterology 1994, 106, 152–159. [Google Scholar] [PubMed]
- Farooqui, A.A.; Horrocks, L.A.; Farooqui, T. Glycerophospholipids in brain: Their metabolism, incorporation into membranes, functions, and involvement in neurological disorders. Chem. Phys. Lipids 2000, 106, 1–29. [Google Scholar] [CrossRef]
- Li, S.; Liu, H.; Jin, Y.; Lin, S.; Cai, Z.; Jiang, Y. Metabolomics study of alcohol-induced liver injury and hepatocellular carcinoma xenografts in mice. J. Chromatogr. B Anal. Technol. Biomed. Life Sci. 2011, 879, 2369–2375. [Google Scholar] [CrossRef] [PubMed]
- Yamashita, S.; Ogawa, M.; Sakamoto, K.; Abe, T.; Arakawa, H.; Yamashita, J. Elevation of serum group II phospholipase A2 levels in patients with advanced cancer. Clin. Chim. Acta 1994, 228, 91–99. [Google Scholar] [CrossRef]
- Angelini, R.; Vortmeier, G.; Corcelli, A.; Fuchs, B. A fast method for the determination of the PC/LPC ratio in intact serum by MALDI-TOF MS: An easy-to-follow lipid biomarker of inflammation. Chem. Phys. Lipids 2014, 183, 169–175. [Google Scholar] [CrossRef] [PubMed]
- Garcia-Canaveras, J.C.; Donato, M.T.; Castell, J.V.; Lahoz, A. A comprehensive untargeted metabonomic analysis of human steatotic liver tissue by RP and HILIC chromatography coupled to mass spectrometry reveals important metabolic alterations. J. Proteome Res. 2011, 10, 4825–4834. [Google Scholar] [CrossRef] [PubMed]
- Kuo, W.L.; Chung, C.Y.; Hwang, T.L.; Chen, J.J. Biphenyl-type neolignans from Magnolia officinalis and their anti-inflammatory activities. Phytochemistry 2013, 85, 153–160. [Google Scholar] [CrossRef] [PubMed]
- Watanabe, N.; Ikeda, H.; Nakamura, K.; Ohkawa, R.; Kume, Y.; Tomiya, T.; Tejima, K.; Nishikawa, T.; Arai, M.; Yanase, M.; et al. Plasma lysophosphatidic acid level and serum autotaxin activity are increased in liver injury in rats in relation to its severity. Life Sci. 2007, 81, 1009–1015. [Google Scholar] [CrossRef] [PubMed]
- Van Meer, G. Cellular lipidomics. EMBO J. 2005, 24, 3159–3165. [Google Scholar] [CrossRef] [PubMed]
- Merrill, A.H., Jr. Sphingolipid and glycosphingolipid metabolic pathways in the era of sphingolipidomics. Chem. Rev. 2011, 111, 6387–6422. [Google Scholar] [CrossRef] [PubMed]
- Hla, T.; Dannenberg, A.J. Sphingolipid signaling in metabolic disorders. Cell Metab. 2012, 16, 420–434. [Google Scholar] [CrossRef] [PubMed]
- Morad, S.A.; Cabot, M.C. Ceramide-orchestrated signalling in cancer cells. Nat. Rev. Cancer 2013, 13, 51–65. [Google Scholar] [CrossRef] [PubMed]
- Park, J.J.; Lee, J.H.; Li, Q.; Diaz, K.; Chang, Y.T.; Chung, S.K. Divergent syntheses of all stereoisomers of phytosphingosine and their use in the construction of a ceramide library. Bioorg. Chem. 2008, 36, 220–228. [Google Scholar] [CrossRef] [PubMed]
- Wang, Q.; Chen, S.; Han, L.; Lian, M.; Wen, Z.; Jiayinaguli, T.; Liu, L.; Sun, R.; Cao, Y. Antioxidant activity of carboxymethyl (1→3)-β-d-glucan (from the sclerotium of Poria cocos) sulfate (in vitro). Int. J. Biol. Macromol. 2014, 69, 229–235. [Google Scholar] [CrossRef] [PubMed]
- Makabe, H.; Maru, N.; Kuwabara, A.; Kamo, T.; Hirota, M. Anti-inflammatory sesquiterpenes from Curcuma zedoaria. Nat. Prod. Res. 2006, 20, 680–685. [Google Scholar] [CrossRef] [PubMed]
- Hsu, L.S.; Ho, H.H.; Lin, M.C.; Chyau, C.C.; Peng, J.S.; Wang, C.J. Mulberry water extracts (MWEs) ameliorated carbon tetrachloride-induced liver damages in rat. Food Chem. Toxicol. 2012, 50, 3086–3093. [Google Scholar] [CrossRef] [PubMed]
- Li, T.; Chiang, J.Y. Bile Acid signaling in liver metabolism and diseases. J. Lipids 2012, 2012. [Google Scholar] [CrossRef] [PubMed]
- Kalhan, S.C.; Guo, L.; Edmison, J.; Dasarathy, S.; McCullough, A.J.; Hanson, R.W.; Milburn, M. Plasma metabolomic profile in nonalcoholic fatty liver disease. Metabolism 2011, 60, 404–413. [Google Scholar] [CrossRef] [PubMed]
- Matsuzawa, Y.; Hostetler, K.Y. Properties of phospholipase C isolated from rat liver lysosomes. J. Biol. Chem. 1980, 255, 646–652. [Google Scholar] [PubMed]
- Bisogno, T. Endogenous cannabinoids: structure and metabolism. J. Neuroendocrinol. 2008, 20. [Google Scholar] [CrossRef] [PubMed]
- De Petrocellis, L.; Melck, D.; Bisogno, T.; Di Marzo, V. Endocannabinoids and fatty acid amides in cancer, inflammation and related disorders. Chem. Phys. Lipids 2000, 108, 191–209. [Google Scholar] [CrossRef]
- Hansen, H.S.; Moesgaard, B.; Hansen, H.H.; Petersen, G. N-Acylethanolamines and precursor phospholipids—Relation to cell injury. Chem. Phys. Lipids 2000, 108, 135–150. [Google Scholar] [CrossRef]
- Sample Availability: No available.
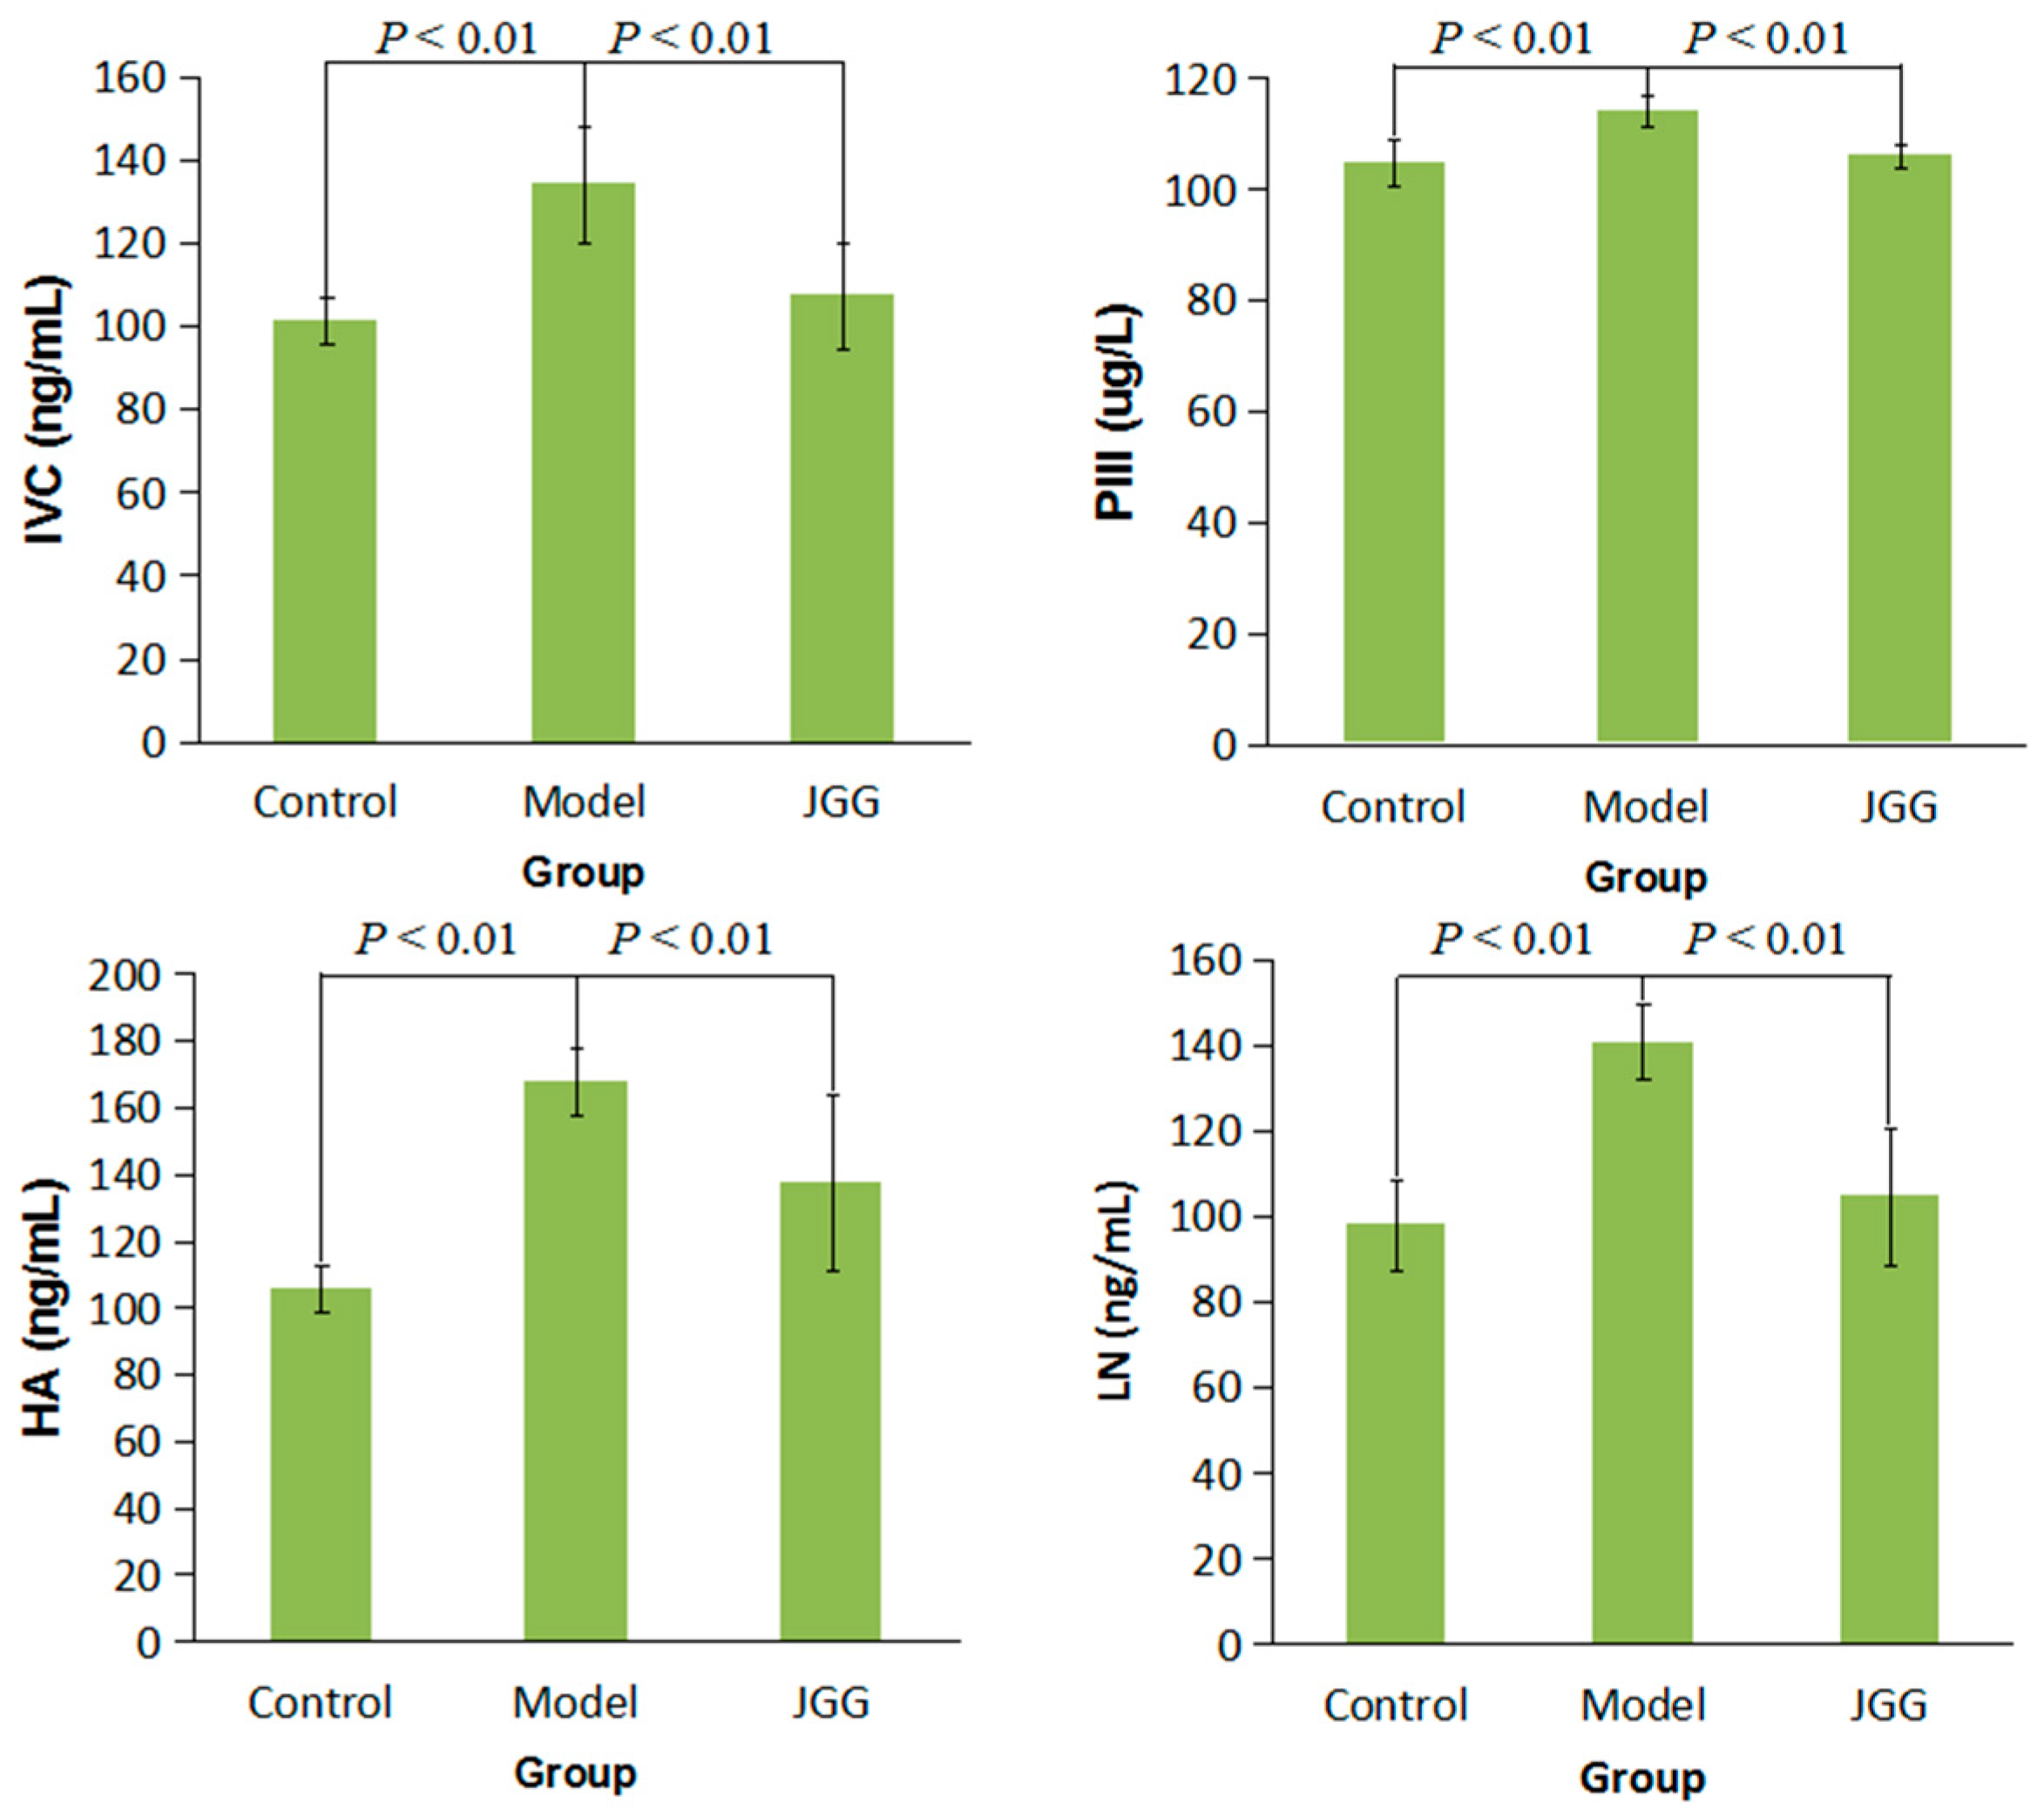


 : control;
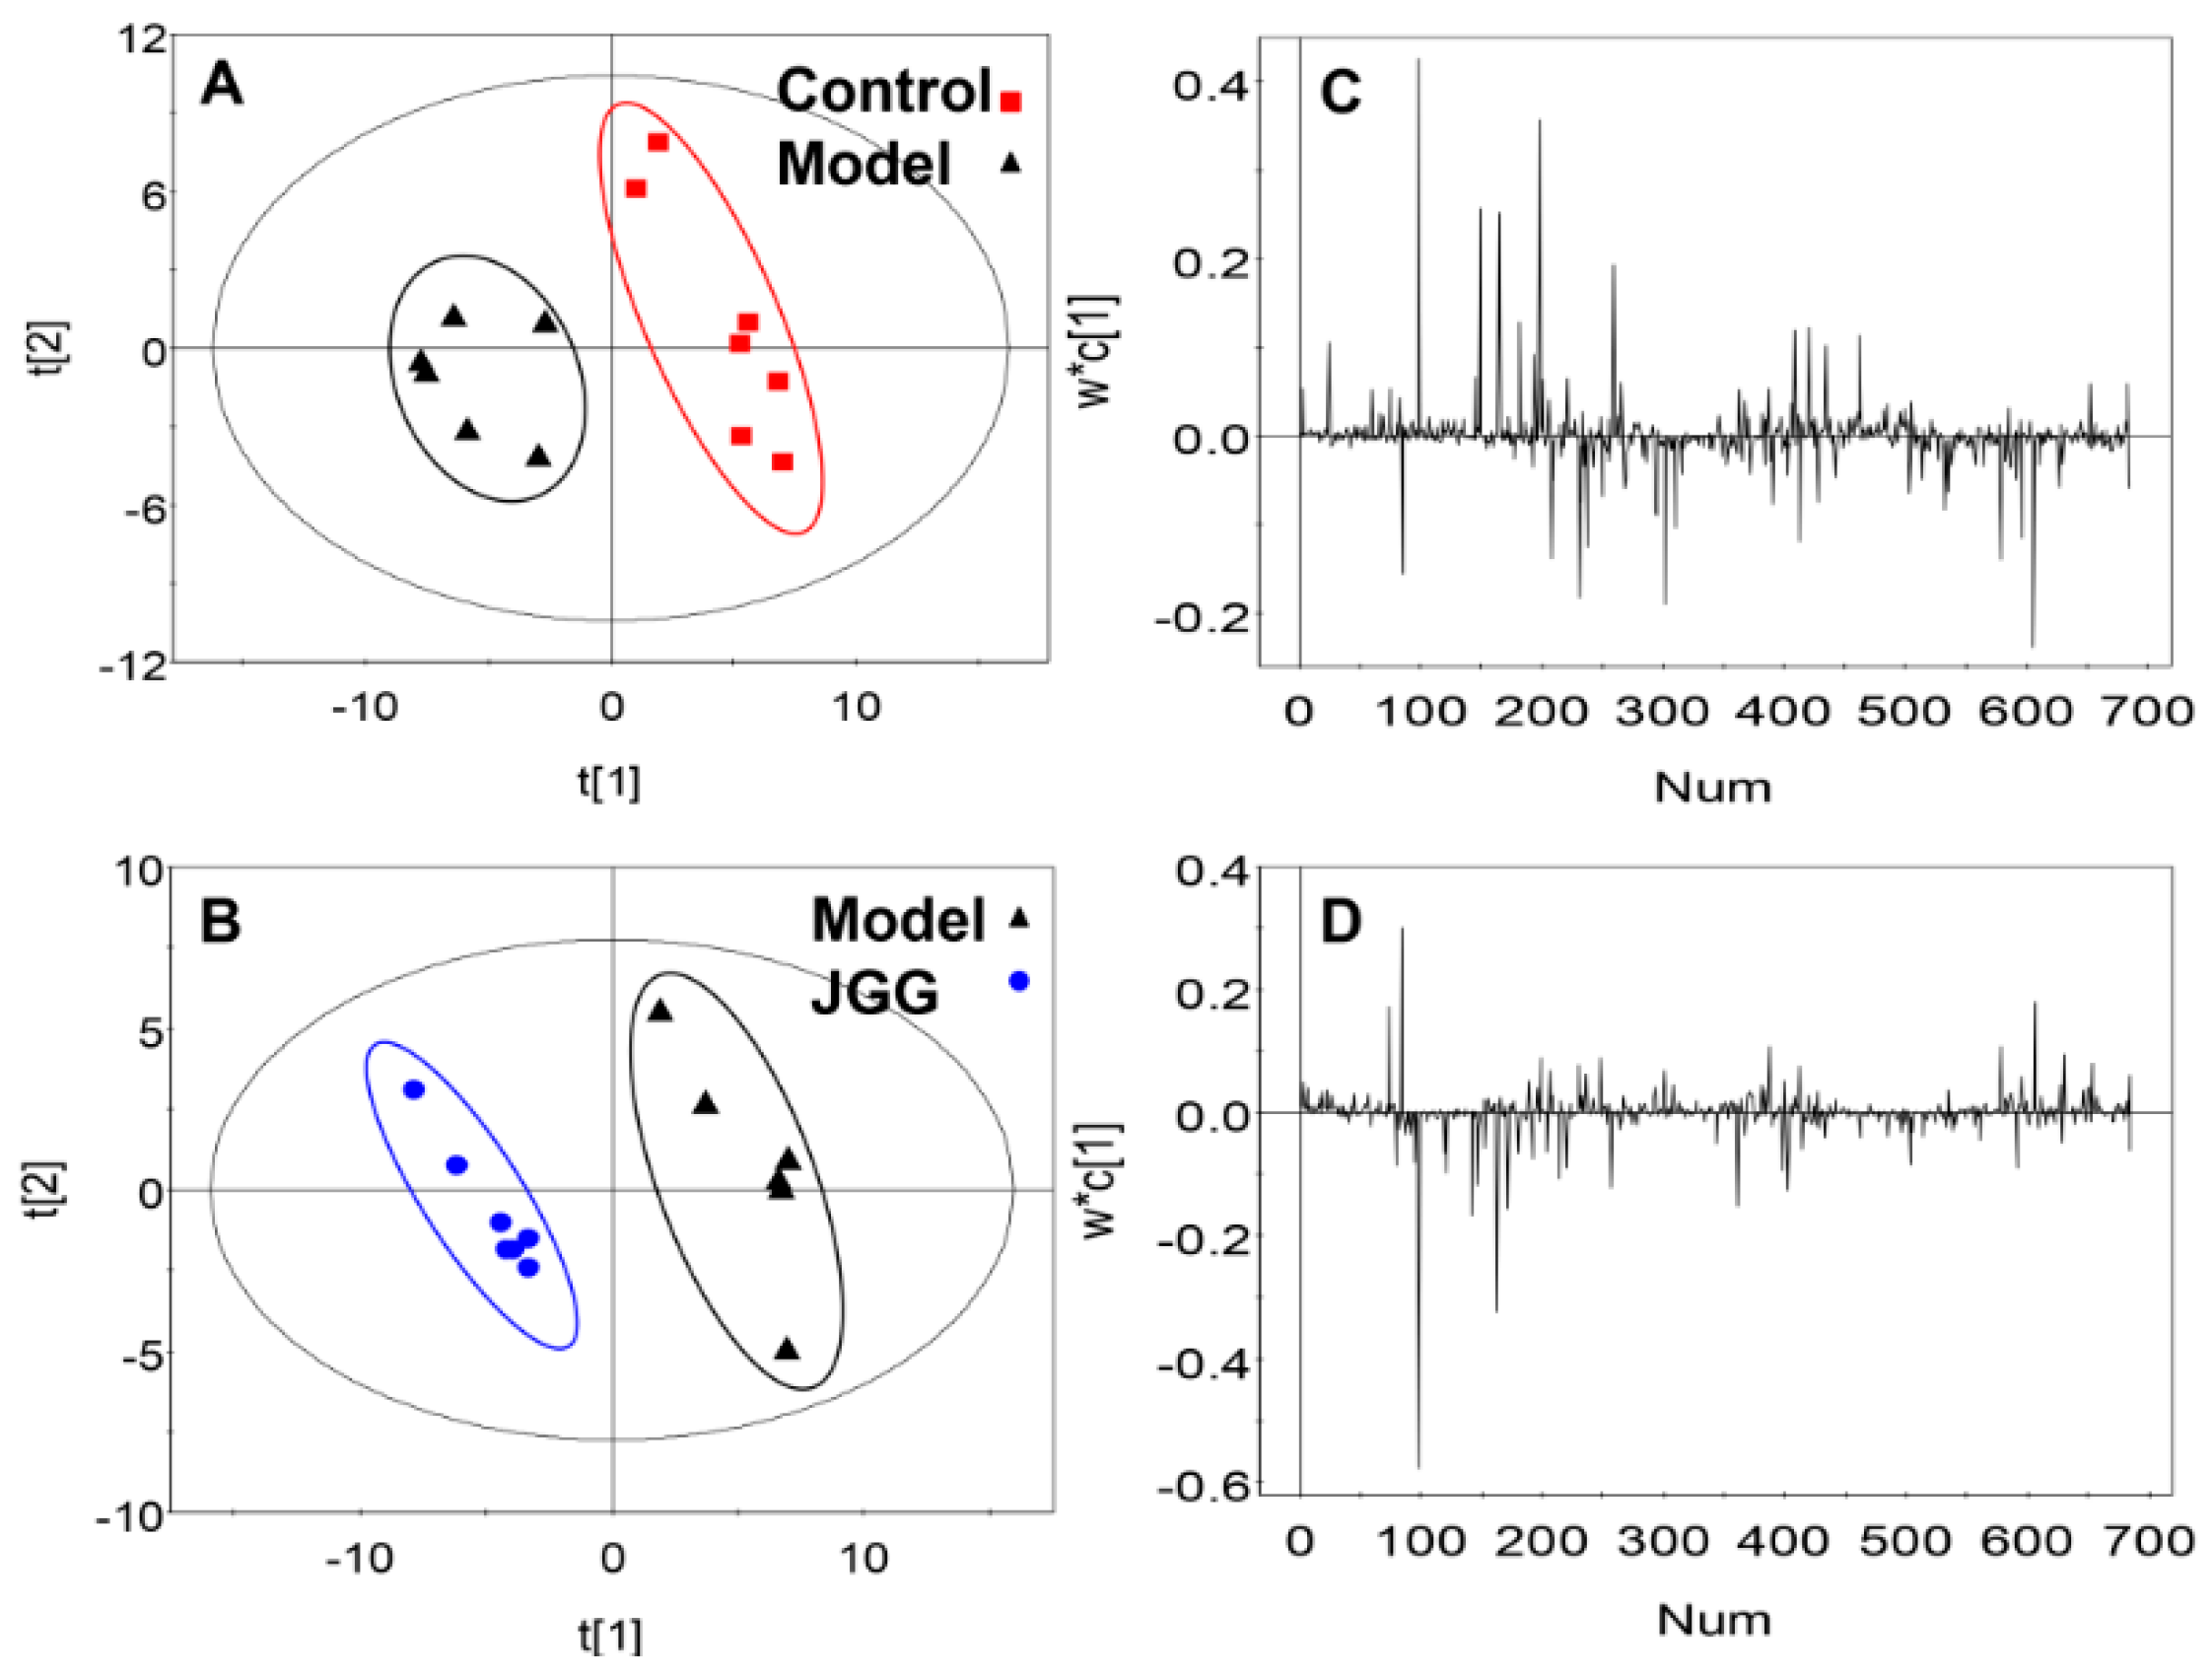
  : model;
  : JGG. The ellipses are only for easier data visualization.
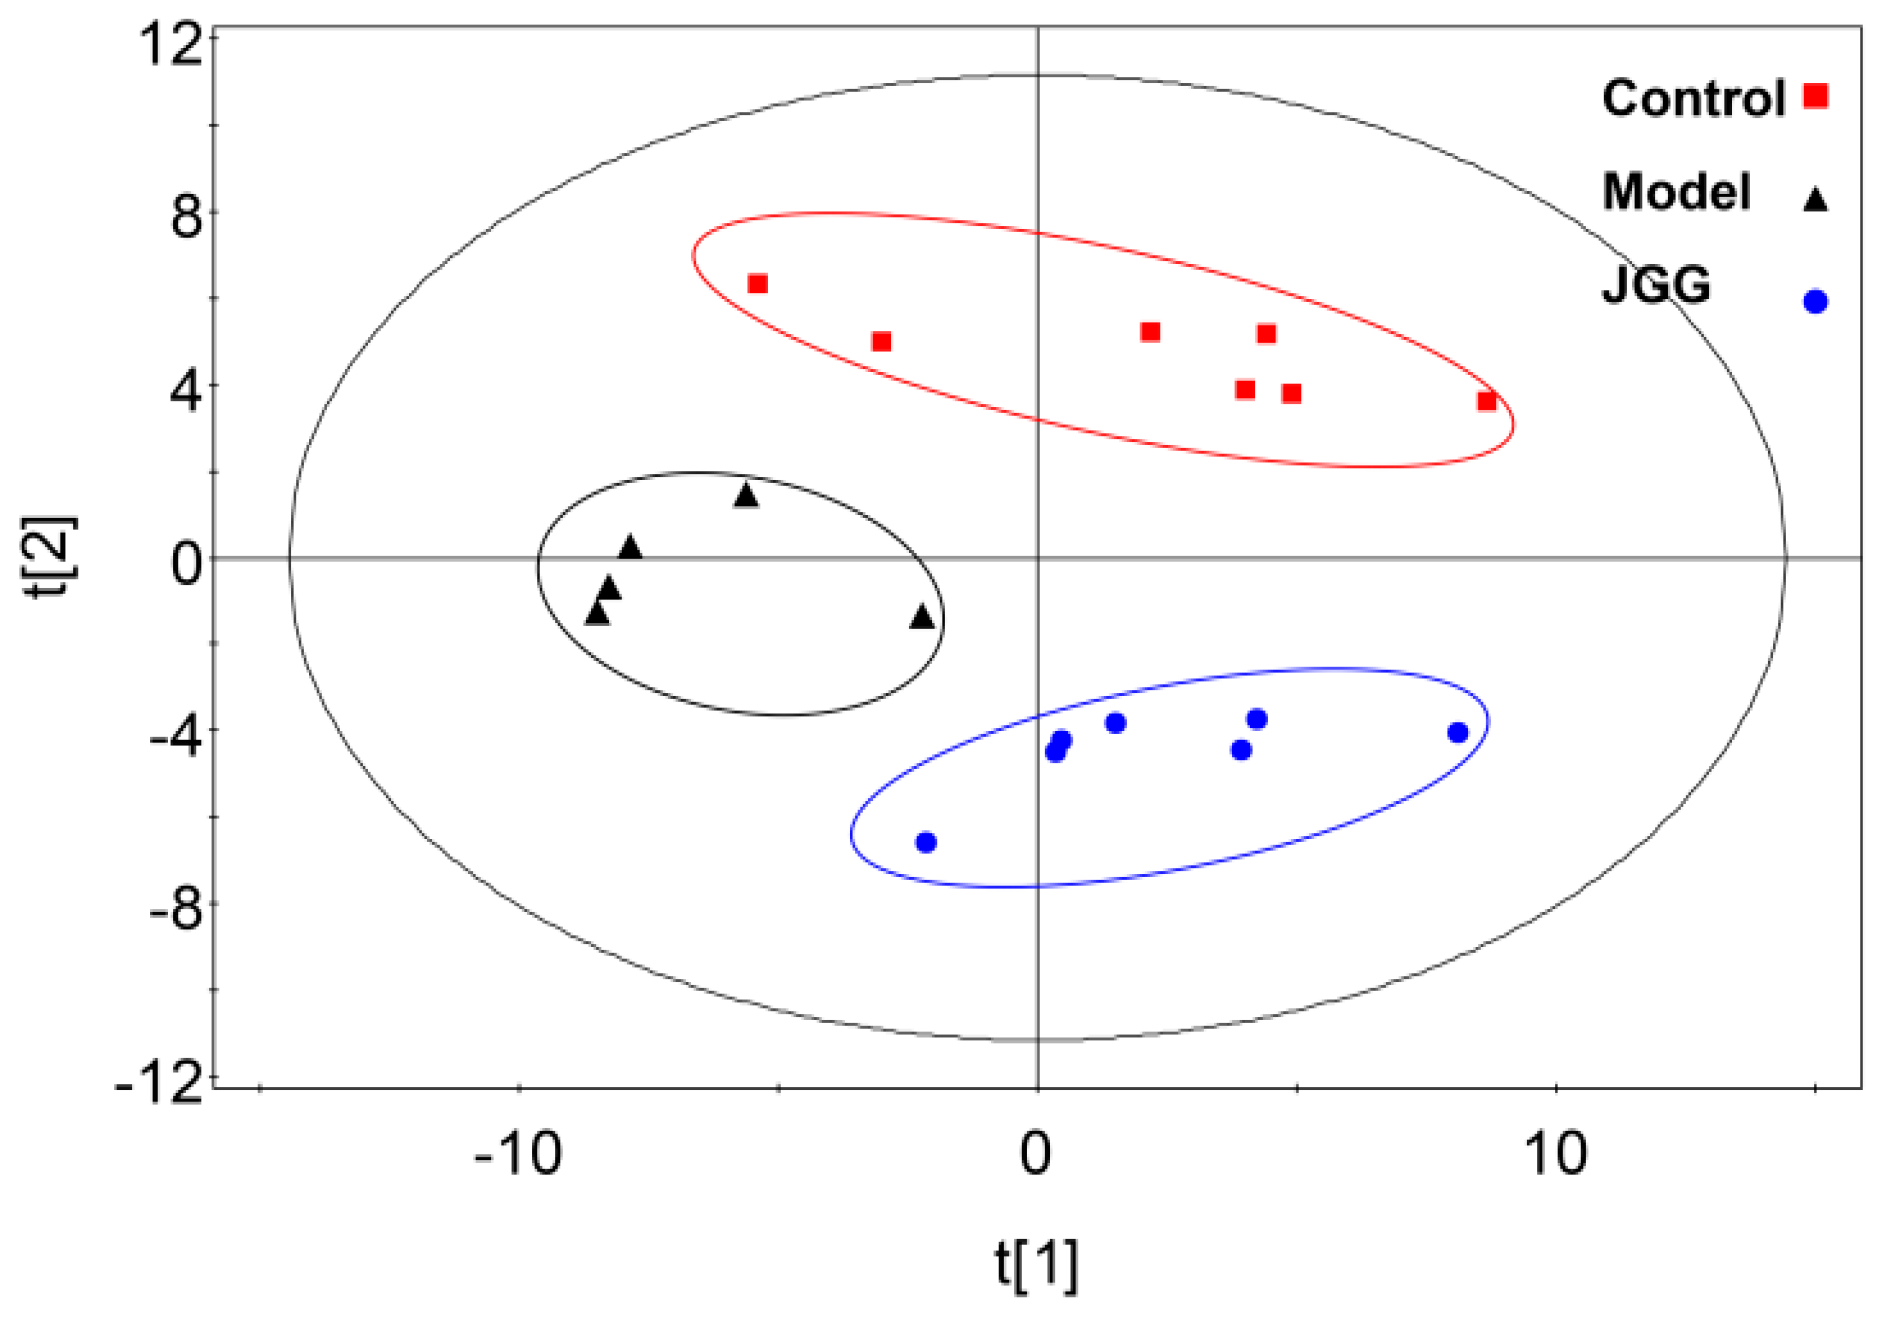
: control; : model; : JGG. The ellipses are only for easier data visualization.
: JGG. The ellipses are only for easier data visualization.
: control; : model; : JGG. The ellipses are only for easier data visualization.


| Herb | Active Component | Ref. |
|---|---|---|
| Radix Paeoniae Rubra | Paeoniflorin, Albiflorin, Benzoic Acid, Tannins, Triterpenoids, Flavonoids, Phenolic Acids | [8,9,10,11] |
| Radix Achyranthis Bidentatae | Polysaccharides, Ketosteroids, Triterpenoids | [12,13,14] |
| Poria cocos | Pachymic acid, Eburicoic acid, Dehydrotumulosic Acid, Polysaccharide, Heteropolysaccharides | [15,16,17] |
| Semen Persicae | Amygdalin, Botanical, Glycoside, Amygdalin, Lipids | [18,19] |
| Rhizoma Corydalis | Corydaline, Glaucine, Canadine, Protopine, Tetrahydropalmatine | [20,21] |
| Cortex Magnoliae Officinalis | Biphenols, Polyphenols, Tannins, Magnolol, Honokiol, Neolignans | [22,23,24] |
| Radix Astragali seu Hedysari | Isoflavonoids, Astragalosides, Saponins, Polysaccharides | [25] |
| Rhizoma Curcumae | Tannins, Saponins, Flavonoids, Steroids, Alkaloids, Terpenoids, Curcuminoid, Sesquiterpenoids, Furanodiene | [26,27,28] |
| Carapax Trionycis | Peptide | [29,30] |
| Eupolyphaga sinensis Walker | Vitamins, Essential Amino Acids, Essential Fatty Acids, Isocoumarins, Alkaloid | [31,32] |
| No. | RT (min) | Measured MS (m/z) | Adduct | Error (mDa) | Metabolites | HMDB Formula | Major Metabolic Pathway | Model | |
|---|---|---|---|---|---|---|---|---|---|
| Positive | Negative | ||||||||
| 1 | 0.95 | 132.0777 | 130.0623 | [M + H]+ | 0.9 | Creatine | C4H9N3O2 | Creatine pathway | ↓ b |
| 2 | 9.51 | 302.3050 | -- | [M + H]+ | 0.4 | Sphinganine | C18H39NO2 | Sphingolipid metabolism | ↓ c |
| 3 | 9.66 | 429.2609 | 405.2629 | [M + Na]+ | 0.2 | 3,7-Dihydroxy-12-oxocholanoic acid | C24H38O5 | Fat digestion and absorption | ↑ b |
| 4 | 9.85 | 330.2968 | 328.2448 | [M + H]+ | 3.4 | Dihydroceramide | C19H39NO3 | Sphingolipid metabolism | ↓ b |
| 5 | 10.17 | 839.5669 | 837.5508 | [M + H]+ | 2.5 | PI (18:0/16:0) | C43H83O13P | Glycerophospholipid metabolism | ↑ a |
| 6 | 10.18 | 373.2743 | -- | [M + H]+ | 0.6 | Cervonoyl ethanolamide | C24H36O3 | N-acylethanolamine biosynthesis | ↑ c |
| 7 | 10.56 | 343.2252 | 319.2274 | [M + Na]+ | 0.8 | 8-HETE | C20H32O3 | Arachidonic acid metabolism | ↓ a |
| 8 | 10.75 | 568.3404 | 612.3293 | [M + H]+ | 0.6 | LysoPC (22:6) | C30H50NO7P | Glycerophospholipid metabolism | ↑ c |
| 9 | 10.77 | 520.3398 | 518.2407 | [M + H]+ | 0.0 | LysoPC (18:2) | C26H50NO7P | Glycerophospholipid metabolism | ↑ c |
| 10 | 11.16 | 1047.7383 | 568.3617 | [2M + H]+ | 3.4 | LysoPC (0:0/18:0) | C26H54NO7P | Glycerophospholipid metabolism | ↓ a |
| 11 | 11.21 | 572.3705 | 594.3704 | [M + Na]+ | 1.8 | LysoPC (20:1) | C28H56NO7P | Glycerophospholipid metabolism | ↓ b |
| 12 | 11.25 | 560.3708 | 582.3624 | [M + Na]+ | 2.1 | LysoPC (22:0/0:0) | C27H56NO7P | Glycerophospholipid metabolism | ↓ b |
| 13 | 11.41 | 381.2979 | -- | [M + Na]+ | 0.4 | MG (0:0/18:0/0:0) | C21H42O4 | Glycerophospholipid metabolism | ↓ b |
| 14 | 12.79 | 758.5696 | 802.5616 | [M + H]+ | 0.2 | PC (18:2/16:0) | C42H80NO8P | Glycerophospholipid metabolism | ↑ b |
| 780.5525 | [M + Na]+ | 1.1 | PC (18:2/16:0) | C42H80NO8P | Glycerophospholipid metabolism | ↑ b | |||
| 15 | 13.20 | 760.5880 | 804.5800 | [M + H]+ | 2.9 | PC (18:1/16:0) | C42H82NO8P | Glycerophospholipid metabolism | ↑ c |
| 782.5699 | [M + Na]+ | 2.9 | PC (18:1/16:0) | C42H82NO8P | Glycerophospholipid metabolism | ↑ c | |||
| 16 | 12.63 | 806.5737 | 850.5636 | [M + H]+ | 4.3 | PC (20:4/18:2) | C46H80NO8P | Glycerophospholipid metabolism | ↑ c |
| 828.5555 | [M + Na]+ | 4.1 | PC (20:4/18:2) | C46H80NO9P | Glycerophospholipid metabolism | ↑ c | |||
| 17 | 13.35 | 832.5839 | 830.5999 | [M + H]+ | 1.2 | PC (22:6/18:1) | C46H84NO8P | Glycerophospholipid metabolism | ↑ a |
| No. | Metabolites | Metabolic Pathway | Trend | |
|---|---|---|---|---|
| B/A | C/B | |||
| 1 | Sphinganine | Sphingolipid metabolism | ↓ c | ↑ b |
| 2 | 3,7-Dihydroxy-12-oxocholan-oic acid | Fat digestion and absorption | ↑ b | ↓ a |
| 3 | Dihydroceramide | Sphingolipid metabolism | ↓ b | ↑ c |
| 4 | PI (18:0/16:0) | Glycerophospholipid metabolism | ↑ a | ↓ a |
| 5 | Cervonoyl ethanolamide | N-acylethanolamine biosynthesis | ↑ c | ↓ a |
| 6 | LysoPC (22:6) | Glycerophospholipid metabolism | ↑ c | ↓ c |
| 7 | MG (0:0/18:0/0:0) | Fat digestion and absorption | ↓ b | ↑ c |
| 8 | PC (20:4/18:2) | Glycerophospholipid metabolism | ↑ c | ↓ c |
© 2016 by the authors. Licensee MDPI, Basel, Switzerland. This article is an open access article distributed under the terms and conditions of the Creative Commons Attribution (CC-BY) license ( http://creativecommons.org/licenses/by/4.0/).
Share and Cite
Wang, G.; Li, Z.; Li, H.; Li, L.; Li, J.; Yu, C. Metabolic Profile Changes of CCl4-Liver Fibrosis and Inhibitory Effects of Jiaqi Ganxian Granule. Molecules 2016, 21, 698. https://doi.org/10.3390/molecules21060698
Wang G, Li Z, Li H, Li L, Li J, Yu C. Metabolic Profile Changes of CCl4-Liver Fibrosis and Inhibitory Effects of Jiaqi Ganxian Granule. Molecules. 2016; 21(6):698. https://doi.org/10.3390/molecules21060698
Chicago/Turabian StyleWang, Ge, Zehao Li, Hao Li, Lidan Li, Jian Li, and Changyuan Yu. 2016. "Metabolic Profile Changes of CCl4-Liver Fibrosis and Inhibitory Effects of Jiaqi Ganxian Granule" Molecules 21, no. 6: 698. https://doi.org/10.3390/molecules21060698