Article

The Mechanism by Which Amentoflavone Improves Insulin Resistance in HepG2 Cells

1
School of Pharmacy, Henan University of Traditional Chinese Medicine, Zhengzhou 450046, China
2
Center for Artery Atheroscerosis Research, Havana University of Medical Sciences, Havana 999075, Cuba
3
Collaborative Innovation Center for Respiratory Disease Diagnosis and Treatment and Chinese Medicine Development of Henan Province, Henan University of Traditional Chinese Medicine, Zhengzhou 450046, China
*
Author to whom correspondence should be addressed.
Molecules 2016, 21(5), 624; https://doi.org/10.3390/molecules21050624
Submission received: 21 January 2016 / Revised: 5 May 2016 / Accepted: 6 May 2016 / Published: 13 May 2016
(This article belongs to the Section Natural Products Chemistry)

Abstract

:
Background: The aim of this study was to explore the mechanism by which amentoflavone (AME) improves insulin resistance in a human hepatocellular liver carcinoma cell line (HepG2). Methods: A model of insulin resistant cells was established in HepG2 by treatment with high glucose and insulin. The glucose oxidase method was used to detect the glucose consumption in each group. To determine the mechanism by which AME improves insulin resistance in HepG2 cells, enzyme-linked immunosorbent assay (ELISA) and western blotting were used to detect the expression of phosphatidyl inositol 3-kinase (PI3K), Akt, and pAkt; the activity of the enzymes involved in glucose metabolism; and the levels of inflammatory cytokines. Results: Insulin resistance was successfully induced in HepG2 cells. After treatment with AME, the glucose consumption increased significantly in HepG2 cells compared with the model group (MG). The expression of PI3K, Akt, and pAkt and the activity of 6-phosphofructokinas (PFK-1), glucokinase (GCK), and pyruvate kinase (PK) increased, while the activity of glycogen synthase kinase-3 (GSK-3), phosphoenolpyruvate carboxylase kinase (PEPCK), and glucose-6-phosphatase (G-6-Pase) as well as the levels of interleukin-6 (IL-6), interleukin-8 (IL-8), tumor necrosis factor-α (TNF-α), and C reactive protein (CRP) decreased. Conclusions: The mechanism by which treatment with AME improves insulin resistance in HepG2 cells may involve the PI3K-Akt signaling pathway, the processes of glucose oxygenolysis, glycogen synthesis, gluconeogenesis and inflammatory cytokine expression.

1. Introduction

With the rapid development of the social economy, the incidence of metabolic diseases such as obesity, diabetes, and metabolic syndrome has increased. To date, many studies have investigated the pathogenesis of these diseases in which insulin resistance plays an important role [1].
Insulin is the only hypoglycemic hormone in the body. Defects in insulin signal transduction lead to insulin resistance, which is the main cause of metabolic diseases [2,3]. The liver is the main tissue that supplies energy to the body. Insulin resistance in the liver will induce substance and energy dysmetabolism. Glucose metabolism is especially affected. Liver sensitivity to insulin is important for the stabilization of blood sugar levels. Under normal circumstances, the main sources and consumers of blood glucose exist in a dynamic balance to ensure the stability of blood glucose levels. In the event of insulin resistance in the liver, the liver sensitivity to insulin becomes low and blood glucose increases. Under these circumstances, the PI3K-Akt signal transduction pathway inhibits glucose metabolism. Other downstream metabolic and inflammatory pathways are also inhibited [4]. During glucose metabolism, PFK-1, GCK, and PK play vital roles in glucose oxidation. The main function of PFK-1 is the catalytic conversion of 6-phosphoric acid fructose to 1,6-diphosphate fructose; the primary function of GCK is the metabolism of glucose to 6-phosphoric acid and glucose; and the role of PK is to convert phosphoenolpyruvic acid to pyruvic acid and ATP. GSK-3 phosphorylates glycogen synthase to inhibit its activity; PEPCK plays an important role in the catalysis of oxaloacetic acid to phosphoenolpyruvate; and G-6-Pase is the rate-limiting enzyme in the metabolism of glucose 6-phosphate for the production of glucose [5]. If there are dysfunctions in the activities of these glucose metabolic enzymes, the body will fail to regulate increased blood glucose levels [6].
Many studies suggested that insulin resistance is also a process of chronic inflammation and that interactions exist between the inflammation and insulin signaling pathways. Inflammatory cytokines such as IL-6, IL-8, TNF-α, and CRP can impact processes downstream of the insulin signal transduction pathway. For example, when TNF-α interacts with its receptors, a series of processes are activated to interfere with the ability of insulin to interact with the IRS. The PI3K-Akt pathway inhibits the activity of the glucose transporter, and glycogen synthesis decreases. In contrast, once the inflammatory pathways are suppressed, the inhibition of the PI3K-Akt pathway is reversed, thus promoting glucose metabolism. In addition, the inflammatory pathways are activated, and the levels of IL-6, IL-8, TNF-α, and CRP increase significantly [7,8]. As a result, the body secretes more insulin to maintain stable blood glucose levels. This in turn stimulates the liver to increase the body’s insulin resistance and decreases the ability of the body to regulate its blood glucose levels.
Selaginella Tamariscina (Beauv.) Spring, which was first recorded in ‘Shen Nong Ben Cao Jing’ (a classical traditional Chinese medicine book) approximately 1700 years ago, is used in folk medicine for the treatment of various diseases including amenorrhoea, dysmenorrhea, and chronic hepatitis. It was found in our previous study that the ethyl alcohol (EtOH) extract from S. tamariscina had a hypoglycemic effect. Further analysis revealed that the active compounds of the extract were total flavonoids [9,10,11]. Twelve compounds were isolated from the extract, and 10 of them were identified. AME was found to be the main component of the total flavonoids [12,13]. A review of the literature revealed that AME has PTP1B and alpha-glucosidase inhibitory activity [14]. The identification of the anti-hypoglycemic properties of AME prompted us to evaluate the mechanism by which AME improves insulin resistance in HepG2 cells.

2. Results

2.1. Subsection

2.1.1. Glucose Consumption in Each Group of Cells

As shown in Table 1, the glucose consumption was significantly decreased in the model group (MG) compared with the normal control group (NC) (p < 0.05). The glucose consumption was significantly increased in the metformin group (MF) and in the AMEI, AMEII, and AMEIII groups compared with the MG (p < 0.01 or p < 0.05). There was no difference between the MF and AME groups (p > 0.05).

2.1.2. The Impact of AME on PFK-1, GCK, and PK Activity

As shown in Table 2, the activities of PFK-1, GCK, and PK were significantly decreased in the MG compared with the NC group (p < 0.01 or p < 0.05). The activities of PFK-1, GCK, and PK were significantly increased in the MF, AMEI, AMEII, and AMEIII groups compared with the MG (p < 0.01 or p < 0.05). The activity of GCK was significantly increased in the AMEII group compared with the MF group (p < 0.05), but there was no significant increase in the AMEI and AMEIII groups compared with the MF group (p > 0.05). The activities of PFK-1 and PK were not significantly increased compared with the MF group (p > 0.05).

2.1.3. The Impact of AME on the Activity of GSK-3

As shown in Table 3, the activity of GSK-3 was significantly increased in the MG group compared with the NC group (p < 0.01). The activity of GSK-3 was significantly reduced in the MF, AMEI, AMEII, and AMEIII groups compared with the MG (p < 0.01 or p < 0.05). There was no difference between the MF and AME groups (p > 0.05).

2.1.4. The Impact of AME on the Activities of PEPCK and G-6-Pase

As shown in Table 4, the activities of PEPCK and G-6-Pase were significantly increased in the MG compared with the NC group (p < 0.01 or p < 0.05).
The activities of PEPCK and G-6-Pase were significantly reduced in the MF, AMEI, AMEII, and AMEIII groups compared with the MG (p < 0.05). There was no difference between the MF and AME groups (p > 0.05).

2.1.5. The Impact of AME on the Levels of IL-6, IL-8, TNF-α, and CRP

As shown in Table 5, the levels of IL-6, IL-8, TNF-α, and CRP were significantly elevated in the MG compared with the NC group (p < 0.01). The levels of IL-6, IL-8, TNF-α, and CRP were significantly reduced in the MF, AMEI, AMEII, and AMEIII groups compared with the MG (p < 0.01 or p < 0.05). The levels of IL-6, IL-8, TNF-α, and CRP were significantly increased in the AMEI and AMEIII groups compared with the MF group (p < 0.05), but there was no significant increase in the AMEII group compared with the MF group (p > 0.05).

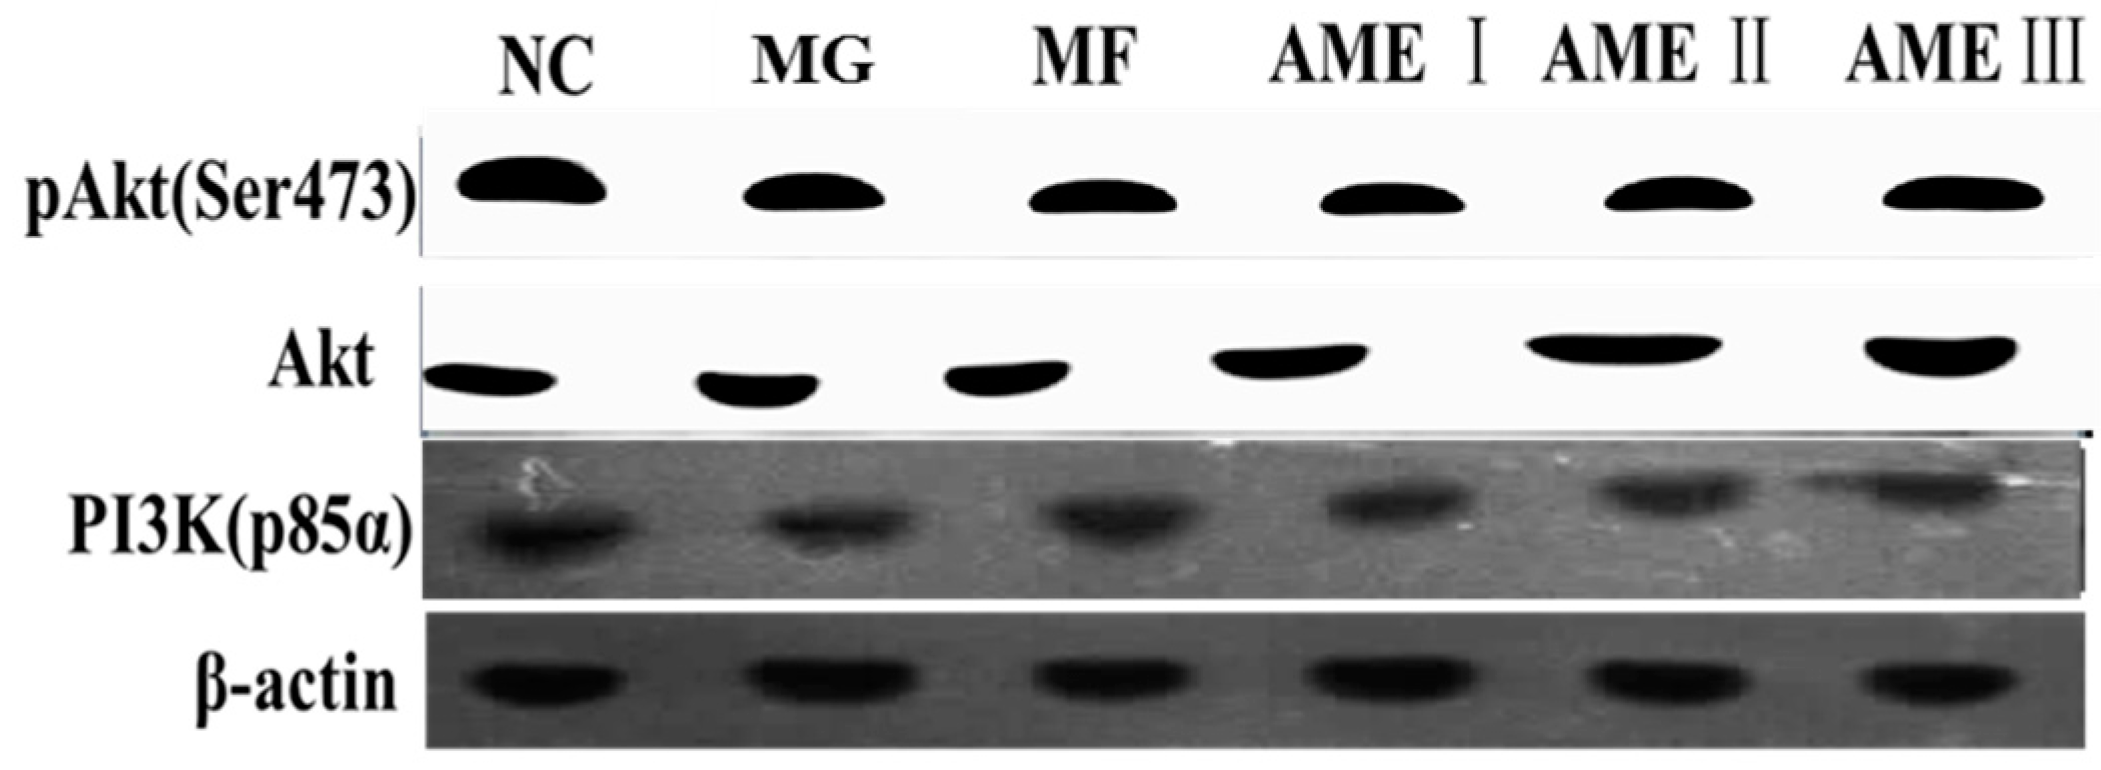
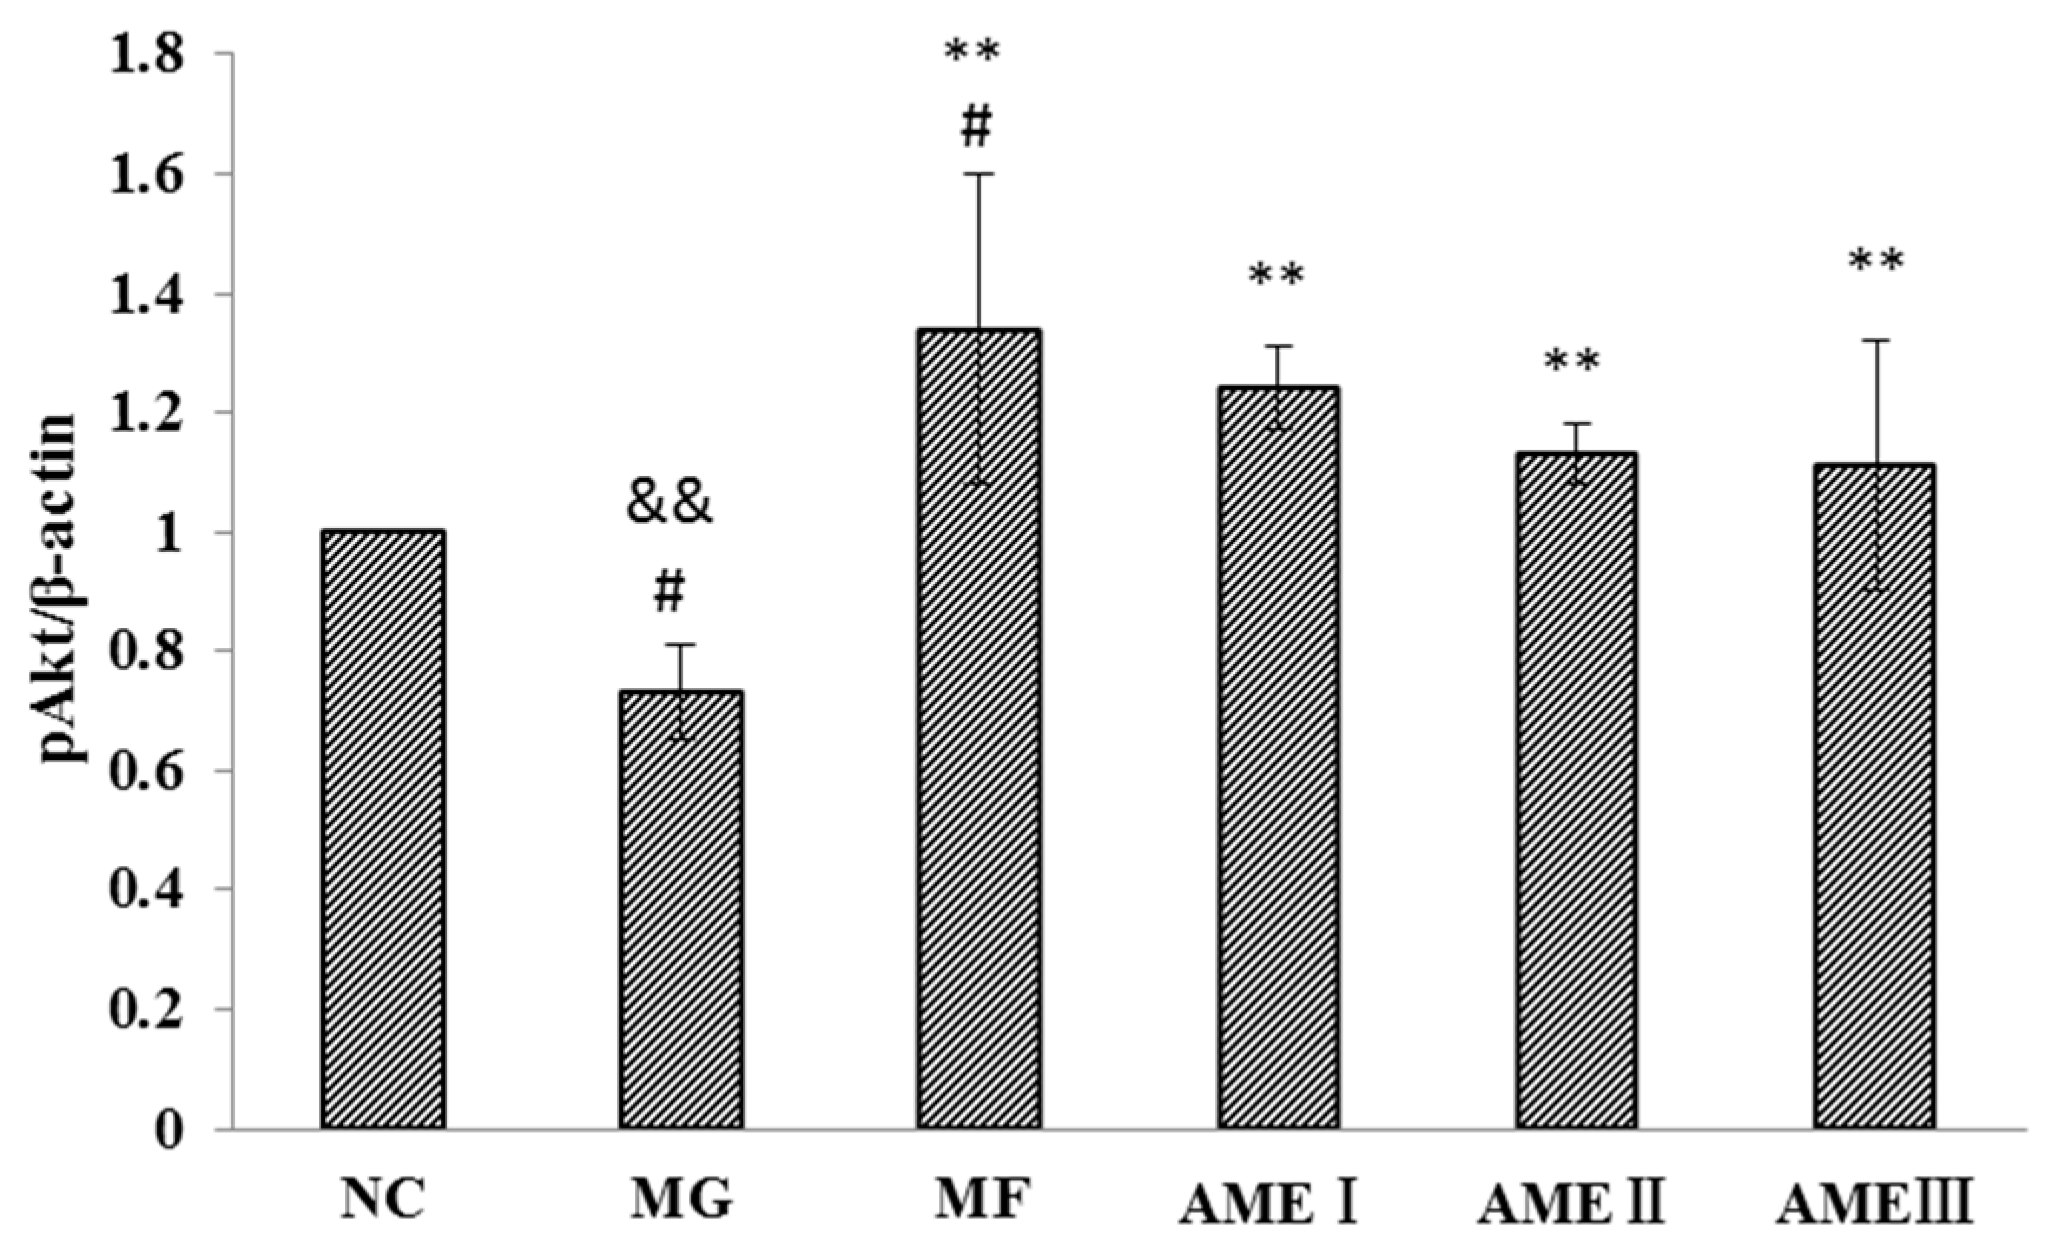
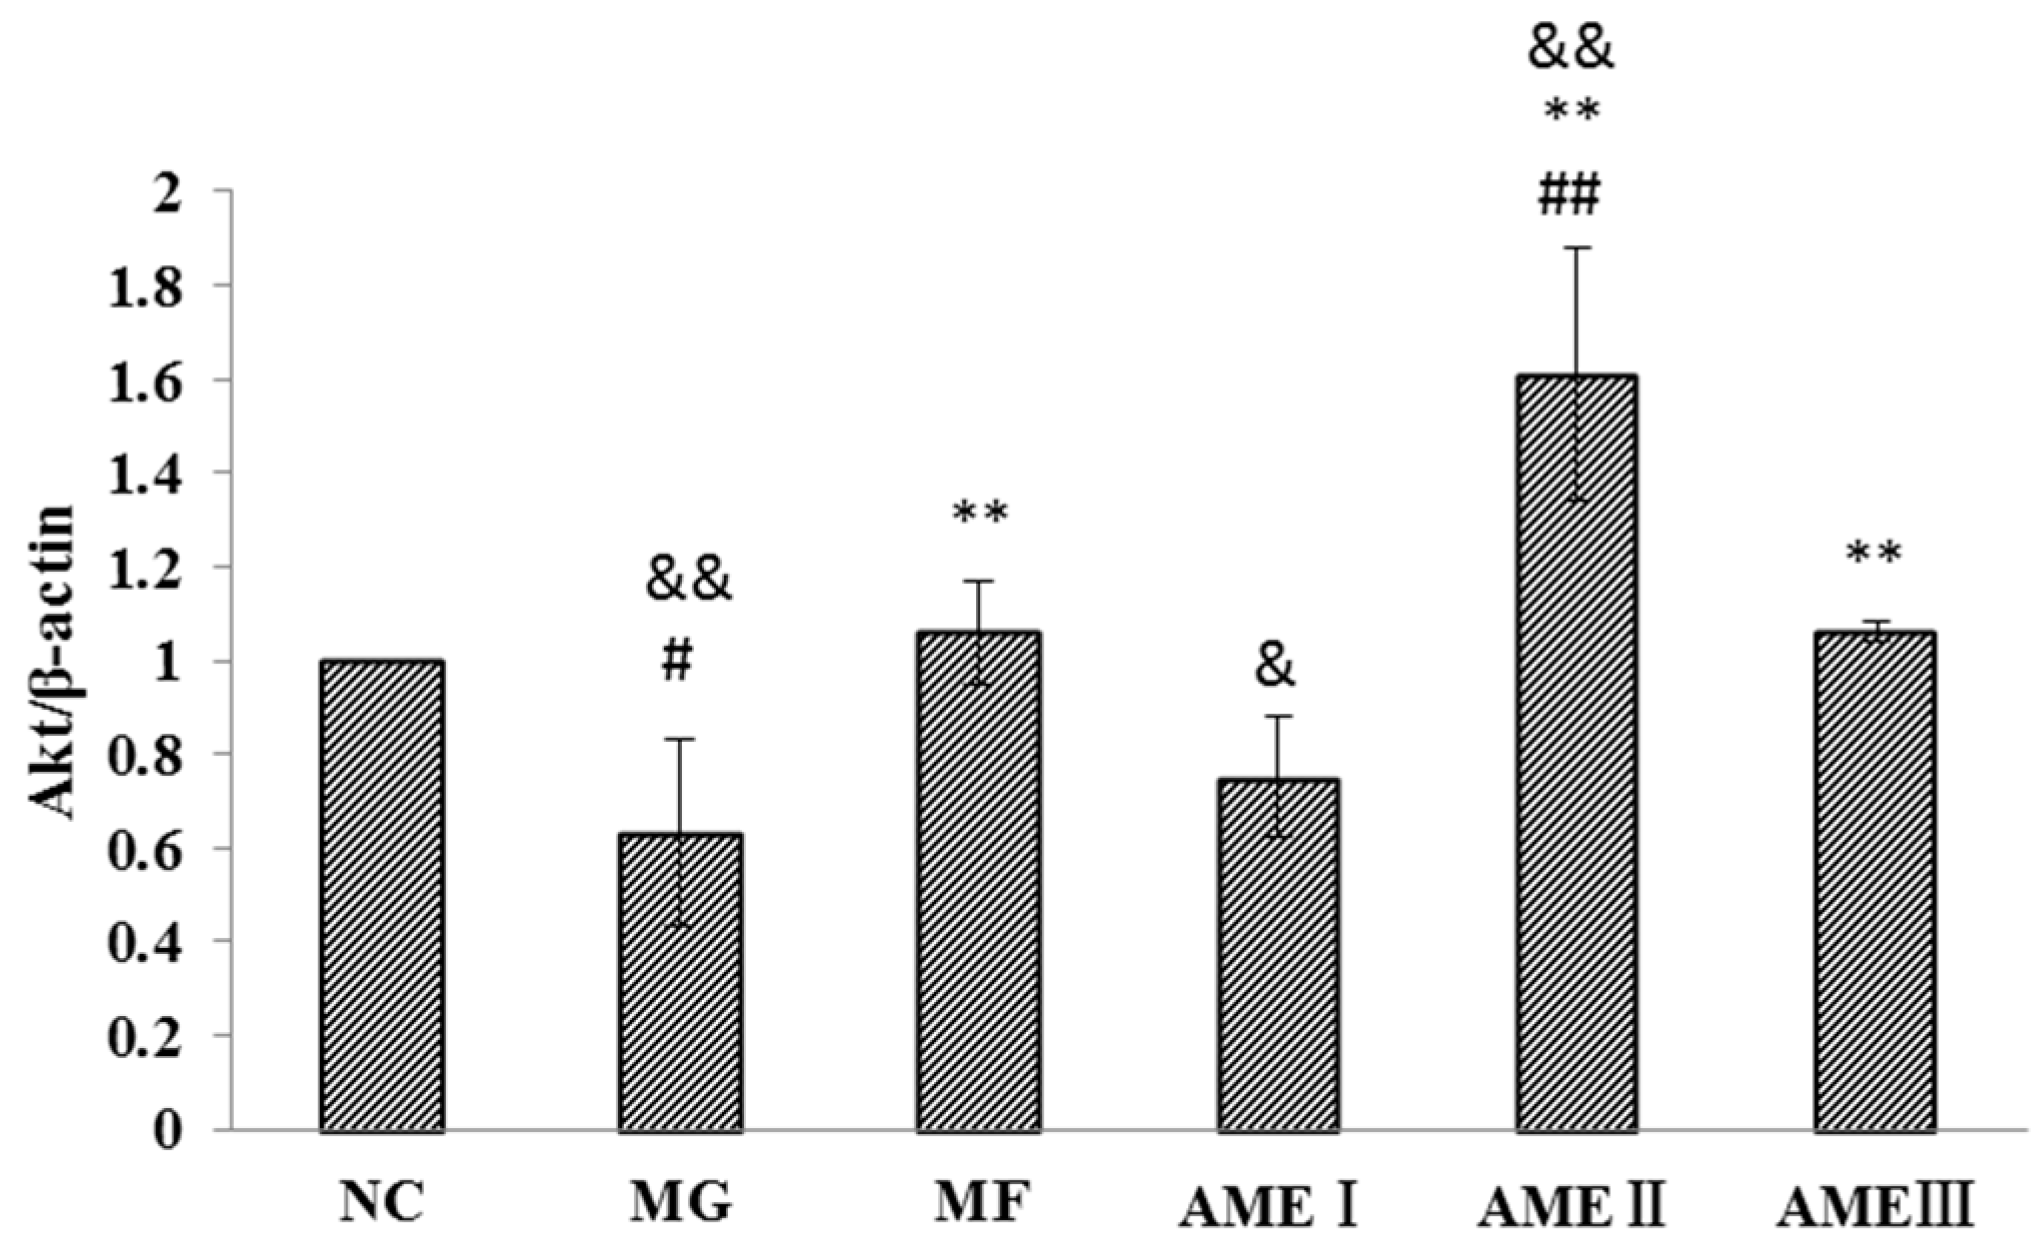
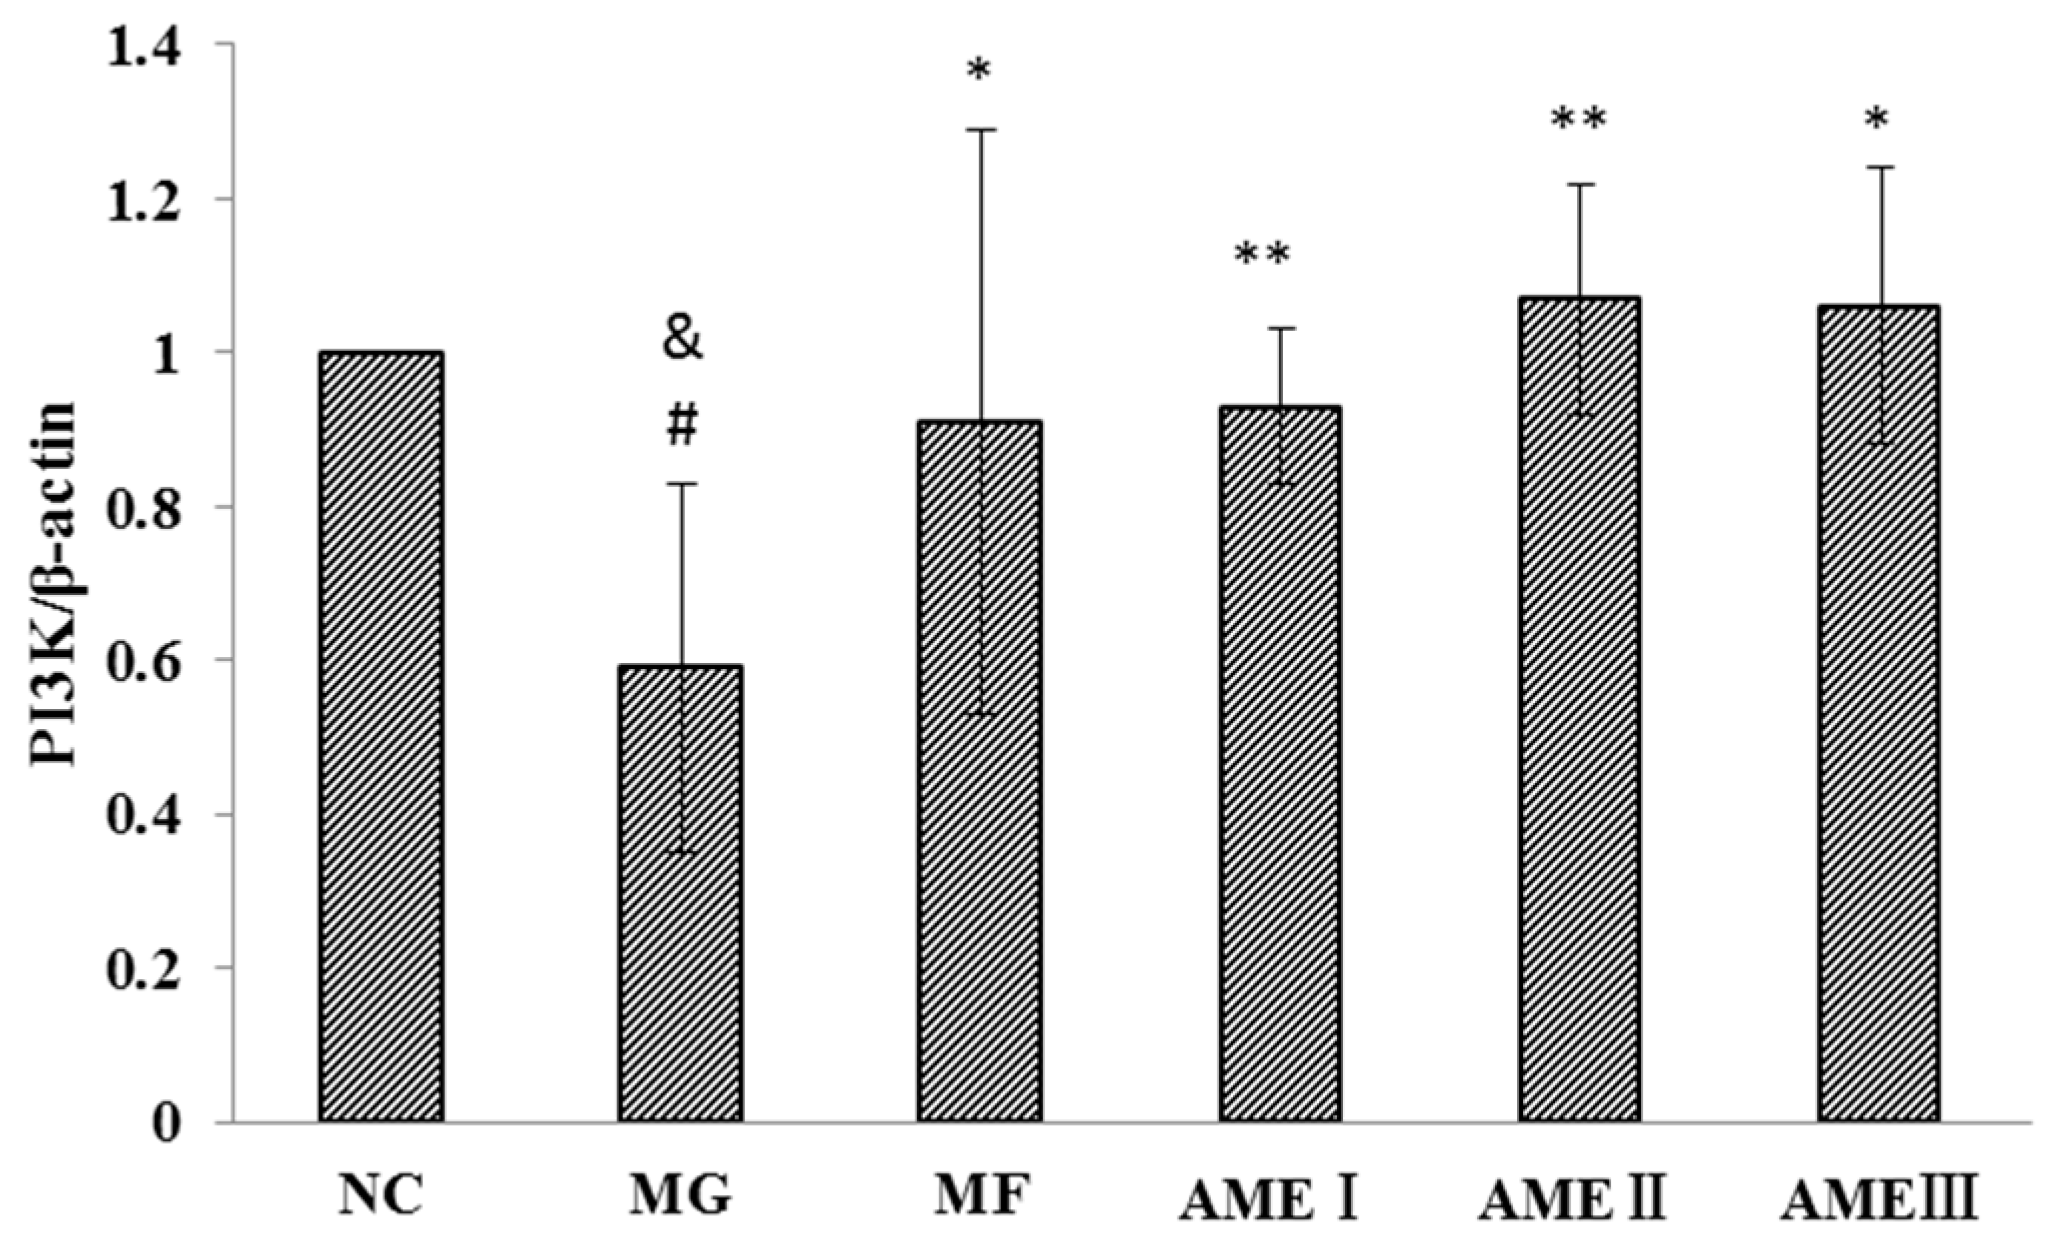
2.1.6. The Effect of AME on the PI3K, Akt, and pAkt Proteins

As shown in Figure 1, Figure 2, Figure 3 and Figure 4, the expression of the PI3K, Akt, and pAkt proteins was significantly decreased in the MG compared with the NC group (p < 0.05). The expression of the PI3K, Akt, and pAkt proteins was significantly increased in the MF, AMEI, AMEII, and AMEIII groups compared with the MG (p < 0.01 or p < 0.05). The expression of PI3K and pAkt was not significantly changed in the AME groups compared with the MF group (p > 0.05). The expression of Akt was significantly increased in the AMEII group compared with the MF group (p < 0.05).

3. Discussion

Insulin is the only hormone that can reduce blood sugar levels in the body. Normally, insulin plays a vital role in lowering blood sugar levels by activating the PI3K-Akt insulin signal transduction pathway [15]. Insulin and insulin receptor form an insulin-insulin receptor complex to activate PI3K. Activated PI3K can catalyze the hydroxylation of phosphatidylinositol-4,5-bisphosphate (PIP2) to form phosphatidylinositol-3,4,5-trisphosphate (PIP3). Upon interacting with the PH domain of Akt, the PIP3-Akt complex localizes to the membrane where cytoplasmic protein kinase B1 (PKB1) interacts with PIP3 through its PH domain. Upon activation of PKB1, Akt is phosphorylated on Thr308. Akt is also phosphorylated on Ser473 by protein kinase B2 (PKB2). Akt becomes activated through these two processes. Activated Akt promotes the translocation of glucose transporter (GLUT) to the cell membrane where it facilitates the entry of extracellular glucose into the cell. At the same time, the activated PI3K-Akt signal transduction pathway activates glucose metabolism and inhibits inflammatory processes [16]. Once insulin resistance begins, the insulin sensitivity of target cells decreases, and the insulin signal transduction pathway becomes disordered [17]. The effect of insulin is reduced, and the regulation of the body’s blood sugar levels is hindered. The body secretes more insulin to regulate blood sugar levels, and excess insulin stimulates the liver, making it less sensitive to insulin. This study aimed to investigate the mechanism by which AME improves insulin resistance in HepG2 cells.
The glucose consumption rate (GC/MTT) indicates the ability of cells to uptake glucose. The glucose oxidase method was used to measure the glucose concentration in each group. The results showed that the GC/MTT ratio decreased in the MG compared with the NC group. After treatment with AME, the GC/MTT ratio was significantly increased in the MF, AMEI, AMEII, and AMEIII groups compared with the MG. There was no difference between the MF and AME groups. Previous studies conducted in our laboratory showed that AME can significantly improve the glucose processing capacity and the insulin resistance of HepG2 cells [18]. The results of our present study are consistent with these earlier observations.
The extract and monomeric compounds of Selaginella Tamariscina (Beauv.) Spring have been studied in our laboratory. Investigating the impact of AME on insulin resistance in HepG2 cells is the current focus of our lab. Liu found that amentoflavone protects vascular endothelial cells and down-regulates downstream inflammation and oxidative damage factors through the NF-κB signaling pathway [19]. The doses of AME tested were 2, 4, 6, and 8 μg/mL, and the optimal dose of AME was 6 μg/mL. We took this information into account before we started our research. Because of the differences between our study and that of Liu, we also tested the effect of AME on insulin resistance. The results showed that 13.94 × 10⁻³ mmol/L was the best dose. The doses of AME and MF were selected because they improved insulin resistance in HepG2 cells to the greatest extent. We compared the results generated by the optimum doses of AME and MF. We found differences between AME and commonly used clinical drugs. This provided the basis for further research.
As mentioned previously, the PI3K-Akt signaling pathway plays an important role in improving insulin resistance [20,21]. The impairment of PI3K-Akt-mediated insulin signaling induces insulin resistance [22]. Kang found that the expression of PI3K was decreased in a diabetes model. A gold capsule could improve the expression of PI-3K and GLUT4 [23]. Dai found that the expression of Akt mRNA was significantly decreased in the adipose tissue of diabetic rats. Liuweidihuang tang and alcohol extract could improve the PI3K/Akt signaling pathway-mediated regulation of blood glucose in type 2 diabetic rats [24]. Liu found that the expression of p-Akt was decreased in a model of insulin resistance. Jinlida could effectively reduce insulin resistance and improve glucose and lipid metabolic disorders in rats fed high-fat diets. The possible molecular mechanism might involve the regulation of the PI3K/AKT signaling pathway [25]. In our research, the expression of PI3K, Akt, and pAkt was decreased in the MG. After treatment with MF and AME, the expression of PI3K, Akt, and pAkt was significantly reduced. The experimental results showed that the expression of PI3K, Akt, and pAkt proteins in the MG was significantly decreased compared with the NC group, and the expression of the PI3K, Akt, and pAkt proteins was significantly increased in the MF, AMEI, AMEII, and AMEIII groups compared with the MG after treatment with AME. The results conclusively show that that AME can improve insulin resistance in HepG2 cells and that its mechanism may be related to the regulation of the PI3K-Akt signal transduction pathway. In the analysis of the experimental data, the first thing we considered was the difference between the normal group and the model group. We found that the expression of PI3K and Akt was decreased in the model group. We then focused on the effects of AME and found that the expression of PI3K and Akt increased. The results also showed that the total levels of Akt in the AMEII-treated cells were almost double in comparison to the control cells, whereas the PI3K values in the AMEII-exposed cells were similar to those in untreated cells. We hypothesized that the PI3K/Akt signaling pathway is the target of AME, but that AME is more inclined to promote Akt protein expression. Variations in total AKT values were higher than the variations in pAKT levels. This may be because AME can not only improve the expression of Akt, but can also promote the phosphorylation of Akt. In agreement with this, we only detected Akt1; the other subtypes were not detected. Much anticipated future studies will measure the level of Akt mRNA.
The stability of the body’s blood glucose levels is closely related to the insulin signal transduction pathway [26]. Glucose metabolism is a large and complex system. PFK-1, GCK, PK, GSK-3, PEPCK, and G-6-Pase play vital roles in glucose metabolism. Our previous research did not investigate the enzymes involved in the process of glucose oxidation decomposition. We searched the relevant literature and found that there is no system for detecting these enzymes. During glucose oxidation [27], there are a few rate-limiting, irreversible reactions in which catalytic enzymes such as PFK-1, GCK, and PK play vital roles. The experimental results showed that the activities of PFK-1, GCK, and PK were significantly decreased in the MG compared to the NC group. After treatment with AME, the activities of PFK-1, GCK, and PK were significantly increased in the MF, AMEI, AMEII, and AMEIII groups compared with the MG.
Glycogen synthesis plays a key role in reducing postprandial hyperglycemia. Glycogen synthase is the rate-limiting enzyme in this process. The main role of GSK-3 is to phosphorylate glycogen synthase to inhibit its ability to synthesize glycogen [28]. Gong found that low-power laser irradiation (LPLI) could promote glucose uptake and glycogen synthesis and improve the insulin resistance of skeletal muscle by activating the PI3-K/Akt2/GLUT4 signaling pathway [29]. The experimental results showed that the expression of GSK-3 protein in the MG was significantly increased compared with the NC group and that after treatment with AME, GSK-3 protein was significantly increased in the MF, AMEI, AMEII, and AMEIII groups compared with the MG.
Gluconeogenesis is the process by which non-sugar substances are transformed into glucose. Gluconeogenesis provides supplemental glucose under starvation conditions. PEPCK plays an important role in the catalysis of oxaloacetic acid to phosphoenolpyruvate [30]. With regard to gluconeogenesis, Zhang found that the activity of PEPCK was significantly increased in the HepG2 model of insulin resistance. Gegen Qinlian Tang-containing serum reduced the activity of PEPCK and improved gluconeogenesis [31]. G-6-Pase is the rate-limiting enzyme in the metabolism of glucose 6-phosphate to glucose [32]. The experimental results showed that the expression of PEPCK and G-6-Pase was significantly increased in the MG and that they were significantly reduced after treatment with AME.
Many studies suggested that insulin resistance is a process of chronic inflammation and that the inflammatory and PI3K-Akt signaling pathways interact to some degree [33]. In vivo, the presence of normal amounts of inflammatory cytokines does not cause damage. However, once insulin resistance arises, the inflammatory pathways are activated, and the levels of IL-6, IL-8, TNF-α, and CRP increase significantly and produce different degrees of injury in the body [34]. Inflammatory cytokines can impact the processes of the insulin signal transduction pathway. With the induction of inflammatory cytokines, insulin resistance is induced and aggravated [35]. Inflammatory cytokines such as IL-6, IL-8, TNF-α, and CRP can impact the processes of the insulin signal transduction pathway. After TNF-α interacts with its receptors, a series of processes are activated that interfere with the ability of insulin to interact with the IRS. The PI3K-Akt pathway is inhibited along with the activity of the glucose transporter and glycogen synthesis. However, once the inflammatory pathways are suppressed, the inhibition of the PI3K-Akt pathway is reversed, and the related processes of glucose metabolism are promoted. Lin found that type 2 diabetes mellitus is a chronic low-grade inflammatory disease. It is often accompanied by higher levels of inflammatory markers that are important for the regulation of the inflammatory process [36]. From the experimental results, we found that the levels of IL-6, IL-8, TNF-α, and CRP were significantly higher in the MG compared with the NC group and that the levels of IL-6, IL-8, TNF-α, and CRP were significantly reduced in the MF, AMEI, AMEII, and AMEIII groups compared with the MG. The effects of AMEI, AMEII, and AMEIII were not dose-dependent. Overall, the effects were the greatest in the AMEII group. Why was the AMEII dose more effective than the AMEI and AMEIII doses in the reduction of pro-inflammatory protein levels? The studies regarding the PI3K-Akt signaling pathway revealed that the expression of PI3K and Akt in the AMEII group was higher than in the AMEI and AMEIII groups. We can surmise that AMEII has a more pronounced effect on the PI3K-Akt signaling pathway than AMEI and AMEIII and that this improves the effect on the inflammatory pathways. Thus, the AMEII dose was more effective than AMEI and AMEIII in reducing pro-inflammatory protein levels.
In a preliminary study conducted in our laboratory, Li found that the total flavonoids of Selaginella tamariscina (Beauv.) Spring (TFST) have potent anti-hypoglycemic effects [11]. Zhang proved that TFST promotes the long-term stabilization of blood glucose levels and controls lipids and lipoproteins by regulating the secretion of insulin and glucagon in the pancreas. The mechanism might involve its ability to improve liver structure and increase the protein expression of PPAR-γ and IRS-1 [12]. Wang found that TFST reduces high blood glucose levels but has no effect on normal blood glucose levels. Lipidosis and hepatic steatosis were ameliorated by TFST via a mechanism involving the expression of visfatin in adipose tissue [13]. Further studies showed that the main component of TFST is AME. Su demonstrated that AME can ameliorate glucose and lipid metabolism disorders without causing significant injury to the liver and kidney. AME can regulate the activities of the enzymes involved in glucose metabolism. AME can activate the PI3K-Akt pathway; this is probably one of the underlying mechanisms responsible for its antidiabetic effect [14]. Combined with the previous results, our research put the focus on the PI3K-Akt pathway. The results showed that the mechanism by which AME improves insulin resistance in HepG2 cells may be related to the PI3K-Akt signaling pathway, which promotes glucose oxygenolysis and glycogen synthesis and inhibits gluconeogenesis and the level of inflammatory cytokines.

4. Materials and Methods

4.1. Preparation of AME

Dried Selaginella was purchased from the Ben Cao Guo Yao Tang LLC (Zhengzhou, China) and identified by Chen Sui-qing of the Henan University of Traditional Chinese Medicine. The purity of the AME prepared in our laboratory is more than 98% as determined by UV spectrophotometry. AME (1.00 mg) was dissolved in 10 μL DMSO and added to 10 mL DMEM containing 0.2% BSA. The solution was stored in the 4 °C refrigerator.

4.2. Cell Culture

HepG2 (human hepatocellular liver carcinoma) cells were a gift from Qiujun Lv of the Radiation Academy of Military Medical Sciences (Beijing, China). The cells were cultured in Dulbecco’s modified Eagle medium (DMEM, Gibco, Pittsburgh, PA, USA, 4.5 g/L) supplemented with 10% fetal bovine serum, 100 kU/L penicillin, and 100 kU/L streptomycin at 37 °C in an atmosphere of 5% CO2.

4.3. Reagents and Instruments

DMEM (Gibco); bovine serum albumin (BSA) (Gibco); trypsin (Gibco); fetal bovine serum (Gibco); insulin (American Sigma Company, Santa Clara, CA, USA); glucose detection reagent box (Biosino Biotechnology Co., Ltd., Beijing, China); glucokinase (GCK), 6-phosphofructokinase (PFK-1), pyruvate kinase (PK), glycogen synthase kinase-3 (GSK-3), phosphoenolpyruvate carboxylase kinase (PEPCK), glucose-6-phosphatase (G-6-Pase), IL-6, IL-8, TNF-α, and CRPELISA kits (all purchased from R & D Systems, Minneapolis, MN, USA); total protein extraction and BCA protein assay kits (Applygen Technologies, Inc., Beijing, China); PI3K, Akt, and pAkt polyclonal antibodies (Abcam Inc., Cambridge, UK); rabbit anti-mouse β-actin (ab75186, Abcam Inc.); pre-stained marker (J114, H30315, FERMENTAS Inc., Burlington, MA, USA); enhanced chemiluminescence (ECL) kit (Beijing Kang Century Biotech Co., Ltd., Beijing, China); methanol (Tianjin four chemical reagent company, Tianjin, China); ultra-pure water (611VF Sartorius, Gottingen, Germany); PBS buffer; other commercially available chemical reagents.
Carbon dioxide incubator (Shanghai STIK, Shanghai, China); clean bench (Jiangsu Sujing Group Co., Ltd., Suzhou, China); iMARK TM microplate reader (Bio-Rad, Hercules, CA, USA); Arium VF 611 super combination ultrapure water (Sartorius AG, Germany); 5804R small, high-speed, low-temperature refrigerated centrifuge (Eppendorf AG, Hamburg, Germany); AB204-N millionth precision analytical balance (Mettler Toledo International Co., Ltd., Zurich, Switzerland); DYY-24DN electrophoresis apparatus (Beijing, China); DYCZ-24DN-type vertical slab electrophoresis apparatus; semi transmembrane instrument (GE); G:BOX gel imager (Syngene, Cambridge, MA, USA); inverted microscope (Nikon, Tokyo, Japan); PB-10 pH meter (Sartorius AG, Germany); dishes, 96-well culture plates, and cryopreservation tubes (Corning, Inc., New York, NY, USA).

4.4. Methods

4.4.1. Generation of an Insulin Resistance Model

HepG2 cells were seeded in 96-well plates. The density of the cells in each plate was 2 × 10⁴ cells/mL. The cells were cultured at 37 °C in an atmosphere of 5% CO2. After the cells became adherent, we removed the original medium and washed the cells twice with DMEM. The medium of the normal control group was replaced with DMEM containing 10% FBS. The medium of the model group was replaced with DMEM containing 10% FBS and 10−7 mol/L insulin. After the cells were cultured for 48 h, we detected the glucose consumption rate in each group to validate the model [37].

4.4.2. The Experimental Groups

There were six groups in our study: the normal control group (NC), the model group (MG) (treated with 10−7 mol/L insulin and cultivated for 48 h), the metformin group (MF) (treated with 0.1 mmol/L metformin), and three amentoflavone groups (AMEI, AMEII, and AMEIII, which were treated with 9.30 × 10⁻³ mmol/L, 13.94 × 10⁻³ mmol/L, and 18.59 × 10⁻³ mmol/L AME, respectively). The AME groups were treated with AME for 36 h following culture for 48 h in DMEM containing a high dose of insulin.

4.4.3. Measurement of the Glucose Consumption Rate

HepG2 cells were seeded in 96-well plates in DMEM supplemented with 10% (V/V) FBS. The density of the cells in each plate was 2 × 10⁴ cells/mL. We removed the original medium when the cells became adherent and replaced it with DMEM containing 10−7 mol/L insulin. The model of insulin resistance was established after 48 h [37]. We added drug-free or drug-containing DMEM containing 0.2% BSA and then divided the cells into the normal group, the model group, and the different AME-administered groups. We then used the glucose oxidase method to detect glucose consumption (GC) levels after 36 h. The glucose oxidase method was used to detect the glucose concentration in each group. Glucose oxidase catalyzes the breakdown of glucose to glucose acid and hydrogen peroxide. Peroxidase then catalyzes the formation of red quinone imide in a reaction involving hydrogen peroxide, 4-aminoantipyrine, and phenol. The absorbance of red quinone imide at a wavelength of 490 nm is proportional to the concentration of glucose [37]. Finally, we added 20 μL MTT solution (12.08 × 10⁻³ mmol/L) to each well and cultured the cells for 4 h in the incubator. After removing the medium from each well, we added 150 μL DMSO and shocked the cells for 10 min to dissolve the crystals. The absorbance (A) was measured at a wavelength of 490 nm using a microplate reader. The glucose consumption rate was calculated using the equation GC/MTT.

4.4.4. ELISA

For the ELISA assay, a 100 mm × 20 mm Petri dish was used. The density of cells in each dish was 2 × 10⁵ cells/mL. After treatment with AME for 36 h, we collected the culture medium from each petri dish and centrifuged it. The supernatants were collected and used to detect the levels of IL-6, IL-8, TNF-α, and CRP according to the respective manufacturer’s instructions. The cells in each group were also collected to extract total protein according to the manufacturer’s instructions. The cells were collected in 2 mL centrifuge tubes, and 10 mL protease inhibitor and 10 mL protein phosphatase inhibitor were added. Then, 0.5 mL lysis buffer was added to the centrifuge tube. The cells were resuspended and placed at 4 °C for 2 min. Then, 1 mL extraction reagent was added. The mixture was blended and placed at 4 °C for 10 min. The solution was divided into two phases after centrifuging at 10,000× g for 10 min. The solid between the two phases was total protein. One milliliter ethanol was added to the centrifuge tube. Total protein was purified after centrifuging at 10,000× g for 3 min. The solid precipitate was the total protein. The solid protein was dissolved in a 2% SDS buffer solution and boiled at 95 °C for 10 min. The precipitate was dissolved at room temperature for 20–60 min. The supernatant, which was the protein solution, was collected after centrifugation. The protein solution was used in western blotting experiments after its concentration was determined using the BCA protein assay kit. After dissolving the protein and measuring its concentration, we used the extract to determine the activities of PFK-1, GCK, PK, GSK-3, PEPCK, and G-6-Pase.

4.4.5. Western Blot Analysis

In the western blotting experiments, total protein was extracted according to the manufacturer’s instructions. The extraction method for total protein was same as that described above for the ELISA. The protein samples were separated by SDS-PAGE. Forty micrograms of each protein sample, an amount that was chosen in a preliminary experiment, was loaded into the gel and transferred to a PVDF membrane. Then, we used non-fat milk to block the membrane for 2 h at room temperature and to blot with a primary antibody overnight at 4 °C. After being washed in TBST buffer, the bound proteins were detected with a secondary antibody for 1 h at room temperature. The intensity of the target proteins and the reference protein was quantified using Gene Tools.

4.5. Statistical Analyses

All of the data are expressed as the mean ± standard deviation. Statistical significance was assessed in comparison with the respective control for each experiment using one-way ANOVA. p values < 0.05 were regarded as statistically significant.

5. Conclusions

The mechanism by which treatment with AME improves insulin resistance in HepG2 cells may involve the PI3K-Akt signaling pathway, the processes of glucose oxygenolysis, glycogen synthesis, gluconeogenesis and inflammatory cytokine expression.

Acknowledgments

The author of this article wants to take this opportunity to thank the NSFC (National Natural Science Foundation of China, 81073034) and the National Science and Technology Major Project (2013ZX09102-022) for financial support.

Author Contributions

Xiaoke Zheng designed the experiments. Yingying Ke performed the experiments, analyzed the raw data, and wrote the manuscript. Aozi Feng and Peipei Yuan assisted with the experiments. Jing Zhou and Yang Yu assisted in the culturing of the cells. Xiaolan Wang contributed reagents. Weisheng Feng supervised the project.

Conflicts of Interest

The authors declare no conflict of interest.

Abbreviations

The following abbreviations are used in this manuscript:
AME
Amentoflavone
ELISA
Enzyme-linked immunosorbent assay
PI3K
Phosphatidyl inositol 3-kinase
PFK-1
6-Phosphofructokinase
GCK
Glucokinase
PK
Pyruvate kinase
GSK-3
Glycogen synthase kinase-3
PEPCK
Phosphoenolpyruvate carboxylase kinase
G-6-Pase
Glucose-6-phosphatase
IL-6
Interleukin-6
IL-8
Interleukin-8
TNF-α
Tumor necrosis factor-α
CRP
C reactive protein
NC group
Normal control group
MG
Model group
MF
Metformin group
GC
Glucose consumption
MTT
3-(4, 5-Dimethylthiazol-2-yl)-2,5-diphenyltetrazolium bromide
GLUT
Glucose transporter
DMSO
Dimethyl sulfoxide
BSA
Bovine serum albumin
PIP2
Phosphatidylinositol-4,5-bisphosphate
PIP3
Hydroxyl to form phosphatidylinositol-3,4,5-trisphosphate
PKB1
Protein kinase B1
PKB2
Protein kinase B2
TFST
Total Flavonoids of Selaginella tamariscina (Beauv.) Spring

References

  1. Boden, G.; Merali, S. Measurement of the increase in endoplasmic reticulum stress-related proteins and genes in adipose tissue of obese insulin-resistant individuals. Methods Enzymol. 2011, 489, 67–82. [Google Scholar] [PubMed]
  2. Rungapamestry, V.; Mc Monagle, J. Inter-organ proteomic analysis reveals insights into the molecular mechanisms underlying the anti-diabetic effects of cis-9, trans-11-conjugated linoleic acid in ob/ob mice. Proteomics 2012, 12, 461–476. [Google Scholar] [CrossRef] [PubMed]
  3. Milburn, M.V.; Lawton, K.A. Application of metabolomics to diagnosis of insulin resistance. Annu. Rev. Med. 2013, 64, 291–305. [Google Scholar] [CrossRef] [PubMed]
  4. Li, H.-Y.; Cui, G.-Z.; Zhang, Y. The insulin signal transduction pathway in type 2 diabetes. J. Changchun Univ. Chin. Med. 2008, 24, 325–326. [Google Scholar]
  5. Alessi, D.R.; James, S.R.; Downes, C.P. Characterization of a 3-phosphoinositide-dependent protein kinase which phosphorylates and activates protein kinase Bα. Curr. Biol. 1997, 7, 261–269. [Google Scholar] [CrossRef]
  6. Choia, Y.J.; Sung, E. Involvement of visfatin in palmitate-induced upregulation of inflammatory cytokines in hepatocytes. Metab. Clin. Exp. 2011, 5, 1–9. [Google Scholar] [CrossRef] [PubMed]
  7. Leguisamo, N.M.; Alexandre M Lehnen, A.M. GLUT4 content decreases along with insulin resistance and high levels of inflammatory markers in rats with metabolic syndrome. Cardiovasc. Diabetol. 2012, 11, 1–10. [Google Scholar] [CrossRef] [PubMed] [Green Version]
  8. Liu, K.; Luo, T.; Zhang, Z.; Wang, T.; Kou, J.; Liu, B.; Huang, F. Modified Si-Miao-San extract inhibits inflammatory response and modulates insulin sensitivity in hepatocytes through an IKKβ/IRS-1/Akt-dependent pathway. J. Ethnopharmacol. 2011, 136, 473–479. [Google Scholar] [CrossRef] [PubMed]
  9. Zheng, X.-K.; Li, Y.-J. Antihyperglycemic activity of Selaginella tamariscina (Beauv.) Spring. J. Ethnopharmacol. 2011, 133, 531–537. [Google Scholar] [CrossRef] [PubMed]
  10. Zhao, X.M. Studies on the Extracting and Purifying Technology and Chemical Constituents of the Flavone Fraction in Selaginellatamariscina. Master’s Thesis, Henan University of Traditional Chinese Medicine, Zhengzhou, China, 2009. [Google Scholar]
  11. Zheng, X.-K.; Li, Y.-J.; Zhang, L. Experimental study of Selaginella on the glucose metabolism in rat model of type 2 diabetes. J. Prev. Med. 2009, 36, 1918–1922. [Google Scholar]
  12. Zheng, X.-K.; Zhang, L.; Wang, W.-W. Anti-diabetic activity and potential mechanism of total flavonoids of Selaginella tamariscina (Beauv.) Spring in rats induced by high fat diet and low dose STZ. J. Ethnopharmacol. 2011, 137, 662–668. [Google Scholar] [CrossRef] [PubMed]
  13. Zheng, X.-K.; Wang, W.-W.; Zhang, L. Antihyperlipidaemic and antioxidant effect of the total flavonoids in Selaginella tamariscina (Beauv.) Spring in diabetic mice. J. Pharm. Pharmacol. 2013, 65, 757–766. [Google Scholar] [CrossRef] [PubMed]
  14. Zheng, X.-K.; Su, C.-F.; Zhang, L. The hypoglycemic effect of Amentotaxus in Selaginella. Chin. J. Exp. Tradit. Med. Formulae 2013, 19, 198–202. [Google Scholar]
  15. Maris, M.; Overbergh, L.; Mathieu, C. Type 2 diabetes: Gaining insight into the disease process using proteomics. Proteom. Clin. Appl. 2008, 2, 312–326. [Google Scholar] [CrossRef] [PubMed]
  16. Zhu, S.; Sun, F. Apelin stimulates glucose uptake through the PI3K/Akt pathway and improves insulin resistance in 3T3-L1 adipocytes. Mol. Cell. Biochem. 2011, 353, 305–313. [Google Scholar] [CrossRef] [PubMed]
  17. Liu, S.; Wang, X.-J. PI3K/AKT/mTOR signaling is involved in (−)-epigallocatechin-3-gallate-induced apoptosis of human pancreatic carcinoma cells. Am. J. Chin. Med. 2013, 41, 629–642. [Google Scholar] [CrossRef] [PubMed]
  18. Li, Y. Antihyperglycemic Activity of Selaginella tamariscina. Master’s Thesis, Henan University of Traditional Chinese Medicine, Zhengzhou, China, 2009. [Google Scholar]
  19. Zheng, X.-K.; Liu, C.-X.; Zhai, Y.-Y.; Eli, L.L.; Wang, X.L.; Feng, W.S. Protection effect of amentoflavone in Selaginella tamariscina against TNF-α-induced vascular injure of endothelial cells. Acta Pharm. Sin. 2013, 48, 1503–1509. [Google Scholar]
  20. Chakraborty, C.; Roy, S.S.; Hsu, M.J. Landscape mapping of functional proteins in insulin signal transduction and insulin resistance: A network-based protein-protein interaction analysis. PLoS ONE 2011, 6, e16388. [Google Scholar] [CrossRef] [PubMed]
  21. Lee, H.-H.; Kim, K.-J. Effect of Pycnogenol® on glucose transport in mature 3T3-L1 adipocytes. Phytother. Res. 2010, 24, 1242–1249. [Google Scholar] [CrossRef] [PubMed]
  22. Liu, Y.; Mei, C. The PI3K-Akt pathway regulates calpain 6 expression, proliferation, and apoptosis. Cell. Signal. 2011, 23, 827–836. [Google Scholar] [CrossRef] [PubMed]
  23. Kang, X.; Zhang, H.; Yu, C. Effects of gold capsule on the blood glucose and expression of PI-3K, GLUT-4 of diabetic rats. J. Tradit. Chin. Med. 2016, 29, 50–54. [Google Scholar]
  24. Dai, B.; Wu, Q.; Xiao, Z.; Zeng, C.; Cao, L.; Ouyang, L.; Yang, M. Effects of Liuweidihuangtang and alcohol extraction on the PI3K/Akt signal pathway in the adipose tissue of diabetic rats. Chin. Tradit. Pat. Med. 2016, 38, 428–430. [Google Scholar]
  25. Liu, Y.; Zang, S.; Song, G.; Wang, C.; Ren, L.P.; Wang, Y. Effect of Jinlida on PI3K/AKT signal pathway in liver tissue of insulin resistant rats. Chin. J. Exp. Tradit. Med. Formulae 2015, 21, 72–76. [Google Scholar]
  26. Li, Y.-G.; Ji, D.-F.; Zhong, S. 1-Deoxynojirimycin inhibits glucose absorption and accelerates glucose metabolism in streptozotocin-induced diabetic mice. Sci. Rep. 2013, 28, 1–12. [Google Scholar] [CrossRef] [PubMed]
  27. Xiong, X.; Tao, R.; DePinho, R.A. Deletion of hepatic FoxO1/3/4 genes in mice significantly impacts on glucose metabolism through downregulation of gluconeogenesis and upregulation of glycolysis. PLoS ONE 2013, 8, e74340. [Google Scholar] [CrossRef] [PubMed]
  28. Skepner, J.E.; Shelly, L.D.; Ji, C.; Reidich, B.; Luo, Y. Chronic treatment with epoxyeicosatrienoic acids modulates insulin signaling and prevent sinsulin resistance in hepatocytes. Prostaglandins Other Lipid Mediat. 2011, 94, 3–8. [Google Scholar] [CrossRef]
  29. Gong, L.; Jiang, X.; Huang, L.; Xing, D. Low-power laser irradiation (LPLI) can improve the insulin resistance of skeletal muscle and promote the glucose uptake and glycogen synthesis by activating the PI3-K/Akt2/GLUT4 signal pathway. In Proceedings of the 2013 Conference on Biophysical Society of Guangdong Province, Guangzhou, China, 10 December 2013; p. 98.
  30. Frayn, K.N.; Kingman, S.M. Dietary sugars and lipid metabolism in humans. Am. Soc. Clin. Nutr. 1995, 62, 250S–261S. [Google Scholar]
  31. Zhang, C.; Deng, K.; Yu, M.; Wei, X.; Qu, F.; Xu, G.; Sheng, J. Effects of Gegen Qinlian Tang-containing serum on glycometabolism in insulin-resistance HepG2 cell line. Chin. J. Exp. Tradit. Med. Formulae 2015, 21, 120–123. [Google Scholar]
  32. Esposito, D.; Kizelsztein, P.; Komarnytsky, S. Hypoglycemic effects of brassinosteroid in diet-induced obese mice. Am. J. Physiol. Endocrinol. Metab. 2012, 303, 652–658. [Google Scholar] [CrossRef] [PubMed]
  33. Wallerstedt, E.; Sandqvist, M. Anti-inflammatory effect of insulin in the human hepatoma cell line HepG2 involves decreased transcription of IL-6 target genes and nuclear exclusion of FOXO1. Mol. Cell. Biochem. 2011, 352, 47–55. [Google Scholar] [CrossRef] [PubMed]
  34. Guzel1, S.; Seven, A. Osteoprotegerin, leptin and IL-6: Association with silent myocardial ischemia in type 2 diabetes mellitus. Diabetes Vasc. Dis. Res. 2014, 10, 25–31. [Google Scholar] [CrossRef] [PubMed]
  35. Miao, H.; Zhang, Y. FOXO1 involvement in insulin resistance-related pro-inflammatory cytokine production in hepatocytes. Inflamm. Res. 2012, 61, 349–358. [Google Scholar] [CrossRef] [PubMed]
  36. Lin, Y.; Wei, K.; Fu, L. Heat-clearing detoxifying method and inflammatory factors in type 2 diabetes interwention study. Shanxi J. Tradit. Chin. Med. 2016, 37, 89–91. [Google Scholar]
  37. Wei, Y. Experimental Study on Screening of Hypoglycemic Effect of Selaginella tamariscina and the Main Effective Component on Insulin Resistance. Master’s Thesis, Henan University of Traditional Chinese Medicine, Zhengzhou, China, 2008. [Google Scholar]
  • Sample Availability: Sample of Amentoflavone is available from the authors.
Figure 1. The effect of AME on pAkt, Akt, PI3K proteins (n = 3).
Molecules 21 00624 g001
Figure 2. The effect of AME on pAkt (n = 3). #: p < 0.05 vs. the NC; **: p < 0.01 vs. the MG; &&: p < 0.01 vs. the MF.
Molecules 21 00624 g002
Figure 3. The effect of AME on Akt (n = 3). #: p < 0.05 vs. the NC; ##: p < 0.01 vs. the NC; **: p < 0.01 vs. the MG; &: p < 0.05 vs. the MF; &&: p < 0.01 vs. the MF.
Molecules 21 00624 g003
Figure 4. The effect of AME on PI3K (n = 3). #: p < 0.05 vs. the NC; *: p < 0.05 vs. the MG; **: p < 0.01 vs. the MG; &: p < 0.05 vs. the MF.
Molecules 21 00624 g004
Table 1. Glucose consumption ( x ¯ ± s, n = 3).
GroupGlucose Consumption (GC/MTT)
NC3.85 ± 0.75
MG2.67 ± 0.94 #,&&
MF3.96 ± 0.53 **
AMEI3.70 ± 0.34 *
AMEII3.81 ± 0.07 *
AMEIII3.66 ± 0.41 *
#: p < 0.05 vs. the NC; *: p < 0.05 vs. the MG; **: p < 0.01 vs. the MG; &&: p < 0.01 vs. the MF.
Table 2. The impact of AME on PFK-1, GCK, and PK activity o ( x ¯ ± s, n = 3).
GroupPFK-1 (U·L−1)GCK (U·L−1)PK (mU·L−1)
NC1485.91 ± 97.55230.9 ± 5.69221.94 ± 8.36
MG1111.60 ± 122.67 ##,&&154.48 ± 29.00 ##,&&189.10 ± 5.50 #
MF1464.34 ± 134.67 **221.52 ± 16.74 **216.53 ± 18.26 *
AMEI1458.57 ± 171.74 *259.05 ± 22.75 **218.09 ± 19.26 *
AMEII1562.65 ± 171.74 **267.10 ± 11.38 **,&218.05 ± 23.86 *
AMEIII1441.22 ± 196.27 *238.94 ± 5.69 **217.58 ± 18.49 *
#: p < 0.05 vs. the NC; ##: p < 0.01 vs. the NC; *: p < 0.05 vs. the MG; **: p < 0.01 vs. the MG; &: p < 0.05 vs. the MF; &&: p < 0.01 vs. the MF.
Table 3. The impact of AME on the activity of GSK-3 ( x ¯ ± s, n = 3).
GroupGSK-3 (U·L−1)
NC131.69 ± 1.24
MG142.43 ± 6.20 ##
MF134.55 ± 3.72 *
AMEI131.09 ± 3.14 **
AMEII131.80 ± 6.11 **
AMEIII134.66 ± 3.63 *
##: p < 0.01 vs. the NC; *: p < 0.05 vs. the MG; **: p < 0.01 vs. the MG.
Table 4. The impact of AME on the activities of PEPCK and G-6-Pase ( x ¯ ± s, n = 3).
GroupPEPCK (IU·L−1)G-6-Pase (mIU·mL−1)
NC38.50 ± 2.40994.99 ± 62.15
MG49.22 ± 3.34 ##,&1412.45 ± 93.22 #
MF41.27 ± 2.75 *1082.87 ± 62.15
AMEI40.92 ± 6.25 *1024.28 ± 207.67 *
AMEII39.19 ± 4.52 *1060.90 ± 93.22 *
AMEIII40.57 ± 4.19 *1068.23 ± 166.37 *
#: p < 0.05 vs. the NC; ##: p < 0.01 vs. the NC; *: p < 0.05 vs. the MG; &: p < 0.05 vs. the MF.
Table 5. The impact of AME on the levels of IL-6, IL-8 and TNF-α, CRP ( x ¯ ± s, n = 3).
GroupIL-6(ng·L−1)IL-8(ng·L−1)TNF-α (pg·mL−1)CRP (μg·L−1)
NC6.24 ± 4.05247.06 ± 53.08331518.25 ± 24999.24494.72 ± 91.22
MG36.48 ± 8.01 ##,&&707.00 ± 45.07 ##,&&492280.22 ± 68203.98 ##,&&1461.54 ± 249.72 ##,&&
MF11.03 ± 2.54 **247.06 ± 45.07 **333865.14 ± 19046.96 **540.45 ± 203.65 **
AMEI34.83 ± 5.21 ##,&&694.31 ± 125.63 ##,&&433216.82 ± 28692.27 ##,*,&&1161.04 ± 133.35 ##,*,&&
AMEII12.91 ± 9.08 **283.27 ± 99.23 **371806.53 ± 26416.85 **622.10 ± 129.63 **
AMEIII28.66 ± 2.44 ##*&&524.61 ± 82.33 ##,**,&&436815.38 ± 37085.32 ##,*,&&1185.54 ± 161.40 ##,*,&&
##: p < 0.01 vs. the NC; *: p < 0.05 vs. the MG; **: p < 0.01 vs. the MG; &&: p < 0.01 vs. the MF.

