Article

The Unusual Acid-Accumulating Behavior during Ripening of Cherimoya (Annona cherimola Mill.) is Linked to Changes in Transcription and Enzyme Activity Related to Citric and Malic Acid Metabolism

by
Mauricio González-Agüero
1,*,
Luis Tejerina Pardo
2,
María Sofía Zamudio
1,
Carolina Contreras
1,
Pedro Undurraga
3 and
Bruno G. Defilippi
1
1
Instituto de Investigaciones Agropecuarias, INIA La Platina, Santa Rosa 11610, Santiago 8831314, Chile
2
Facultad Ciencias Biológicas, Escuela de Ingeniería en Biotecnología, Universidad Andrés Bello, República 217, Santiago 8370146, Chile
3
Facultad de Agronomía, Pontificia Universidad Católica de Valparaíso, Calle San Francisco s/n, Casilla 4-D, Quillota 2260000, Chile
*
Author to whom correspondence should be addressed.
Molecules 2016, 21(5), 398; https://doi.org/10.3390/molecules21050398
Submission received: 11 February 2016 / Revised: 18 March 2016 / Accepted: 21 March 2016 / Published: 25 April 2016
(This article belongs to the Section Medicinal Chemistry)

Abstract

:
Cherimoya (Annona cherimola Mill.) is a subtropical fruit characterized by a significant increase in organic acid levels during ripening, making it an interesting model for studying the relationship between acidity and fruit flavor. In this work, we focused on understanding the balance between the concentration of organic acids and the gene expression and activity of enzymes involved in the synthesis and degradation of these metabolites during the development and ripening of cherimoya cv. “Concha Lisa”. Our results showed an early accumulation of citric acid and other changes associated with the accumulation of transcripts encoding citrate catabolism enzymes. During ripening, a 2-fold increase in malic acid and a 6-fold increase in citric acid were detected. By comparing the contents of these compounds with gene expression and enzymatic activity levels, we determined that cytoplasmic NAD-dependent malate dehydrogenase (cyNAD-MDH) and mitochondrial citrate synthase (mCS) play important regulatory roles in the malic and citric acid biosynthetic pathways.

1. Introduction

During ripening, fruits are transformed into palatable consumer products, and consumer preference for a specific fruit or variety is determined by its organoleptic attributes. These attributes depend on many factors, such as the genotype, growing conditions, harvest time and storage conditions. Moreover, organoleptic qualities are related to many other characteristics such as firmness, color, aroma, sweetness and acidity, which are associated with specific metabolic pathways that are coordinated during fruit development and ripening [1]. Throughout this process, a series of changes in fruit composition occur, including the synthesis and degradation of pigments, volatile compound accumulation, and changes in the concentration of sugars and organic acids [2].
Flavor, one of the most important traits affecting fruit quality, is a complicated attribute that is mainly controlled by the level and ratio of different sugars and organic acids [3]. In fruits, these components are involved in both primary metabolism and in the biosynthesis of secondary metabolites, including amino acids, vitamins and aroma volatiles, which further influence quality [4]. Sugars and organic acids, the traits most commonly associated with fruit taste, are mainly measured as total soluble solids (TSS) and titratable acidity (TA), respectively [5], and the relationship between TSS and TA plays an important role in consumer acceptance of several species, such as citrus [6], table grapes [7] and cherries [8].
In fruit species such as apples, grapes and tomatoes, acidity has long been considered one of the most important quality attributes [9,10]. Several organic acids contribute to the acidity levels in fruit, though citric (or its conjugate base citrate) and malic acids (or malate) are the major contributors [11]. Organic acids accumulate during fruit development and are consumed as respiratory substrates in glycolysis and the tricarboxylic acid (TCA) cycle; these acids also serve as gluconeogenesis substrates during fruit ripening [10].
Inside the cell, malic acid is formed from phosphoenolpyruvate (PEP) through the activities of phosphoenolpyruvate carboxylase (PEPC) and malate dehydrogenase (MDH) [9], and cytosolic malate is transported to and sequestered in the vacuole [12]. Malate can be degraded by the reversible reaction of MDH and NADP-malic enzyme (NADP-ME).
Citric acid synthesis is thought to occur in the mitochondria via the TCA cycle. Mitochondrial citrate synthase (mCS) is proposed to catalyze the controlling step of citrate synthesis, with aconitase (ACON) and NAD-dependent isocitrate dehydrogenase (NAD-IDH) controlling citrate degradation [10]. Although mCS activity has been positively correlated with citrate accumulation in citrus and strawberries [13,14], the lower activity of ACON, which catalyzes the conversion of citrate into isocitrate, could be responsible for the increase in citrate concentration during fruit growth in sour lemons [15]. NAD-IDH is present in mitochondria but rarely identified in fruits, and no links with citrate accumulation have been found [16]. Therefore, the molecular mechanism responsible for citrate degradation remains largely unknown.
In general, fruit ripening is accompanied by organic acid degradation and therefore a decrease in acidity, as has been described in such fruits such as pears [16], peaches [17], and apples [18]. However, some fruit species exhibit different acidity patterns during ripening. For example, an increase in TA has been described during ripening in “mangaba” (Hancornia speciosa), a tropical plant native of Brazil, “soursop” (Annona muricata) and cherimoya [19,20,21]. In particular, the rise in acidity in cherimoya is attributed to the production of organic acids during ripening [22,23] and to higher malic acid accumulation caused by the action of MDH as the fruit ripens [24]. However, little is known about the reason for this particular trend in cherimoya and the pathways responsible for the synthesis, regulation and accumulation of organic acids during development and ripening.
In this study, we focused on understanding the balance between organic acid levels during cherimoya development and ripening and enzymatic activity/gene expression related to the synthesis and degradation of these metabolites. For this purpose, cherimoya cv. “Concha Lisa” was collected at different growth stages, and mature samples were ripened at 20 °C. Standard fruit quality parameters, the organic acid content, enzymatic activity and the expression of several key genes encoding putative enzymes related to citric and malic acid metabolism were evaluated. Our results are expected to provide baseline information for elucidating the mechanisms involved in organic acid metabolism in ripening A. cherimola fruit.

2. Results and Discussion

2.1. Changes in Organic Acid Content during Growth of Cherimoya

Fruits of cherimoya cv. “Concha Lisa” at nine different growth stages were collected between January and November 2013 (Table 1); the fruits were classified by phenological stage using the Biologische Bundesanstalt, Bundessortenamt und Chemische Industrie (BBCH) scale, according to Cautín and Agustí [25]. For example, the initial state collected (S1) corresponds to growth stage 71 at the beginning of ovary growth, a time when the green ovary is surrounded by the dying petal crown. An intermediate stage of development (S5) corresponds to stage 75, at which the fruit has reached half of its final size [25]. Other developmental stages and their equivalence in the BBCH-scale are described in Table 1. As development progresses, both fruit weight and diameter (data not shown) exhibit a double sigmoid curve with a short latency period (stage II), which is typical growth for this fruit during a season with predominantly low temperatures [26]. Although a series of studies have examined the composition of organic acids during cherimoya ripening [21,23,24,27], there is no evidence to date on what occurs during the development of this fruit.
Our analysis showed the predominance of citric acid in the early stages of development, decreasing to very low levels (0.20 mg/g of fresh weight [FW]) when the fruits reached the commercial harvest stage. In contrast, the malic acid levels remained constant throughout the development, becoming the predominant acid at nearly 64% of the total acids analyzed at harvest. This is consistent with the reports of Paull et al. [20] and Alique et al. [27], who found that malic acid is the major organic acid contributing to the increase in TA in soursop and cherimoya, respectively. Levels of both malate and citrate were also highly correlated with many important regulators of ripening in an independent study focused on early tomato fruit development [28]. As opposed to the observations for cherimoya, malic acid increases in other fruits such as grape (Vitis vinifera) at earlier stages and then decreases during ripening [29]. In early stages of development, malic acid primarily accumulates through the metabolism of sugars, whereas malate acts as a vital source of carbon for different pathways, mainly the TCA cycle, respiration, gluconeogenesis and secondary compound production, during ripening [30].
With regard to the other acids analyzed, such as tartaric, succinic and ascorbic, the general trend was a decrease in content as the fruits developed, showing no major changes from 17 weeks after blooming (WAB) until harvest. It is noteworthy that the high levels of succinic acid in the early stages of development decreased to below 0.4 mg/g FW at harvest. Similar results were reported by Fortes et al. [31] in grapes, in which succinic acid may serve as a substrate for the synthesis of primary sugars and other metabolites. Tartaric acid accumulated during the early fruit stages and remained unchanged for most of cherimoya development. Other authors have reported this pattern, whereby tartaric acid remains low during ripening because it is not metabolized in the fruit [32].

2.2. Sequence Analysis of Organic Acid-Related Genes from Cherimoya

Full-length cDNAs encoding cytoplasmic NAD-dependent malate dehydrogenase (cyNAD-MDH), NADP-dependent malic enzyme (NADP-ME), NAD-dependent malic enzyme (NAD-ME), ATP citrate synthase (ATP-CS) also called ATP-citrate lyase, NADP-dependent isocitrate dehydrogenase (NADP-IDH) and mitochondrial citrate synthase (mCS) were identified, as were partial-length transcripts sequences encoding phosphoenol pyruvate carboxylase (PEPC), aconitate hydratase 1 (ACON). BLASTp was used to confirm homology, and the protein products were designated Ac-cyNAD-MDH (332 amino acids—aa), AcNADP-ME (587 aa), AcNAD-ME (606 aa), AcATP-CS (423 aa), AcNADP-IDH (416 aa), Ac-mCS (473 aa), AcPEPC (164 aa), and AcACON (473 aa). The data provided in Table 2 indicate high identity of cherimoya malic and citric acid-related genes with orthologous genes.

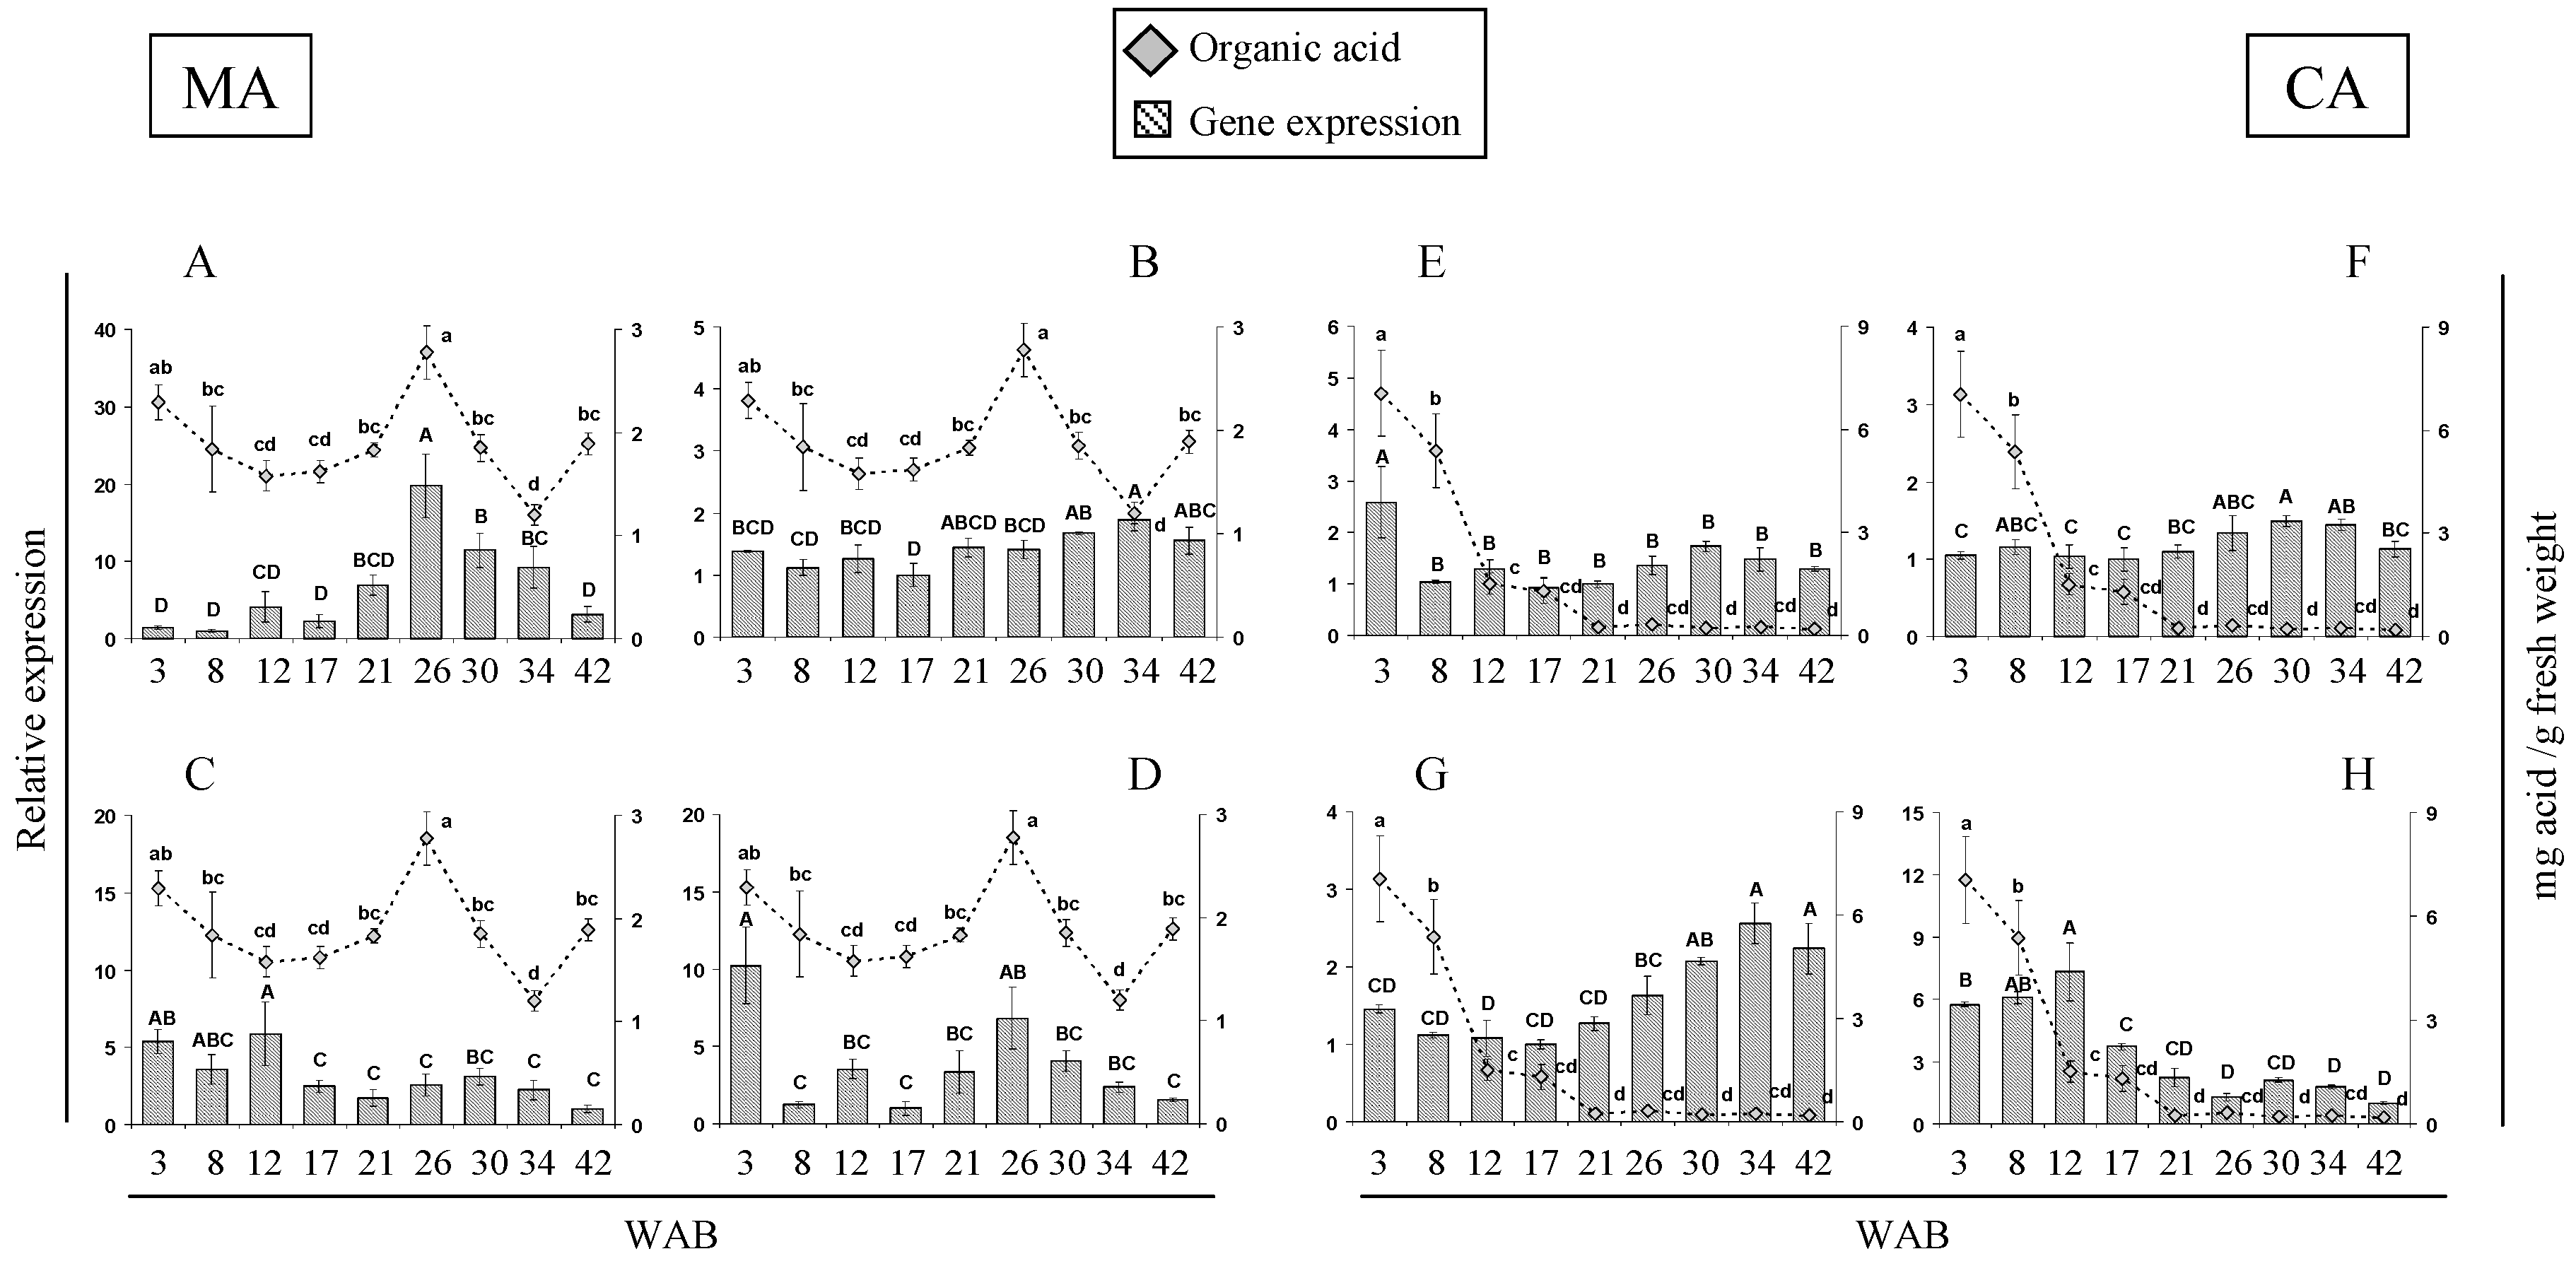
2.3. Expression of Citric and Malic Acid-Related Genes during A. cherimola Fruit Growth

The expression of four genes related to malic acid metabolism and four citric acid-related genes was analyzed by real-time quantitative PCR (qPCR) in developing fruits at nine stages (Figure 1). Expression patterns for these organic acid-related genes or the activities of key enzymes differ among species, such as peach [17], strawberry [14], apple [15], pear [16], and melon [34]. Although no major changes in malic acid were found during cherimoya fruit development, the expression patterns of genes related to its synthesis and degradation do not necessarily correlate with the timing of the observed changes in organic acid content (Figure 1). AcPEPC, which codes for the enzyme responsible for producing oxaloacetate (OAA) at the beginning of the malate synthetic pathway, showed the highest expression at 26 WAB and then declined (Figure 1A). This expression pattern correlates with the malate concentration. Another gene involved in the synthesis of malate, Ac-cyNAD-MDH, did not exhibit significant changes in expression, except for a slight increase in the last stages of fruit development (Figure 1B). The profiles of the AcPEPC and Ac-cyNAD-MDH genes might explain the pattern of a low malate exchange rate; similarly, decreases in the expression of genes, AcNADP-ME (Figure 1C) and AcNAD-ME (Figure 1D), responsible for the degradation of this metabolite may also explain this behavior during cherimoya development.
Regarding citric acid metabolism, the expression patterns of Ac-mCS (Figure 1E), which is implicated in citrate synthesis, AcACON (Figure 1F) and AcNADP-IDH (Figure 1G), both related to citrate degradation, may account for the high accumulation of this acid at the initial stages and their rapid decline as cherimoya development progresses. Interestingly, a relationship between Ac-mCS and the citric acid pattern was found in cherimoya; this is different from that observed by Iannetta et al. [14] in strawberry, where Fa-mCS1 expression did not correlate with either enzyme activity or citric acid accumulation. In the case of AcATP-CS (Figure 1H), a gene possibly related to citrate degradation, the expression pattern showed no relationship with the accumulation of this organic acid.

2.4. Changes In Quality Parameters and Organic Acid Patterns during Cherimoya cv. “Concha Lisa” Ripening

As expected, firmness was very high at harvest, reaching values of 18 kgf and remaining constant until day 2, at which a rapid softening was observed at 20 °C (Table 3). This change in pulp firmness coincided with a significant increase in ethylene production after 5 days, with a peak observed at 8 days at 20 °C. Importantly, we observed the particular behavior of cherimoya as a climacteric fruit that shows a double peak in respiratory rate [27,35]. Moreover, an increase in TSS and TA was observed during cherimoya ripening (Table 3), similar to the results reported by Manríquez et al. [23]. The TA increases coincidently with the respiratory rate, and after 5 days at 20 °C the TA shows an increase (2.4 fold) immediately after the first CO2 peak. This result is similar to that reported in soursop, with the authors suggesting that the increase might be a consequence of the glycolysis induced by harvest, with intense glucose oxidation and starch hydrolysis [36].
In relation to the organic acid content, our analysis revealed almost no changes in ascorbic, tartaric and succinic acid levels during cherimoya ripening (Table 3); this was similar to what was found by Manríquez et al. [23] in “Concha Lisa” and “Bronceada” (another cherimoya cv.), where the tartaric acid concentration was very low from harvest to the last stages of ripening. In contrast, malic and citric acids were predominant and increased significantly as the fruits ripened; indeed, the ripening of “Concha Lisa” cherimoya fruit was accompanied by a 2-fold increase in malic acid and a 6-fold increase in citric acid. Both acids peaked at 5 days after harvest, declining thereafter and remaining constant (Table 3). Interestingly, the increase in malic and citric acids at 20 °C parallels the increase in TA, suggesting that both acids may be responsible for the changes in TA during cherimoya ripening.

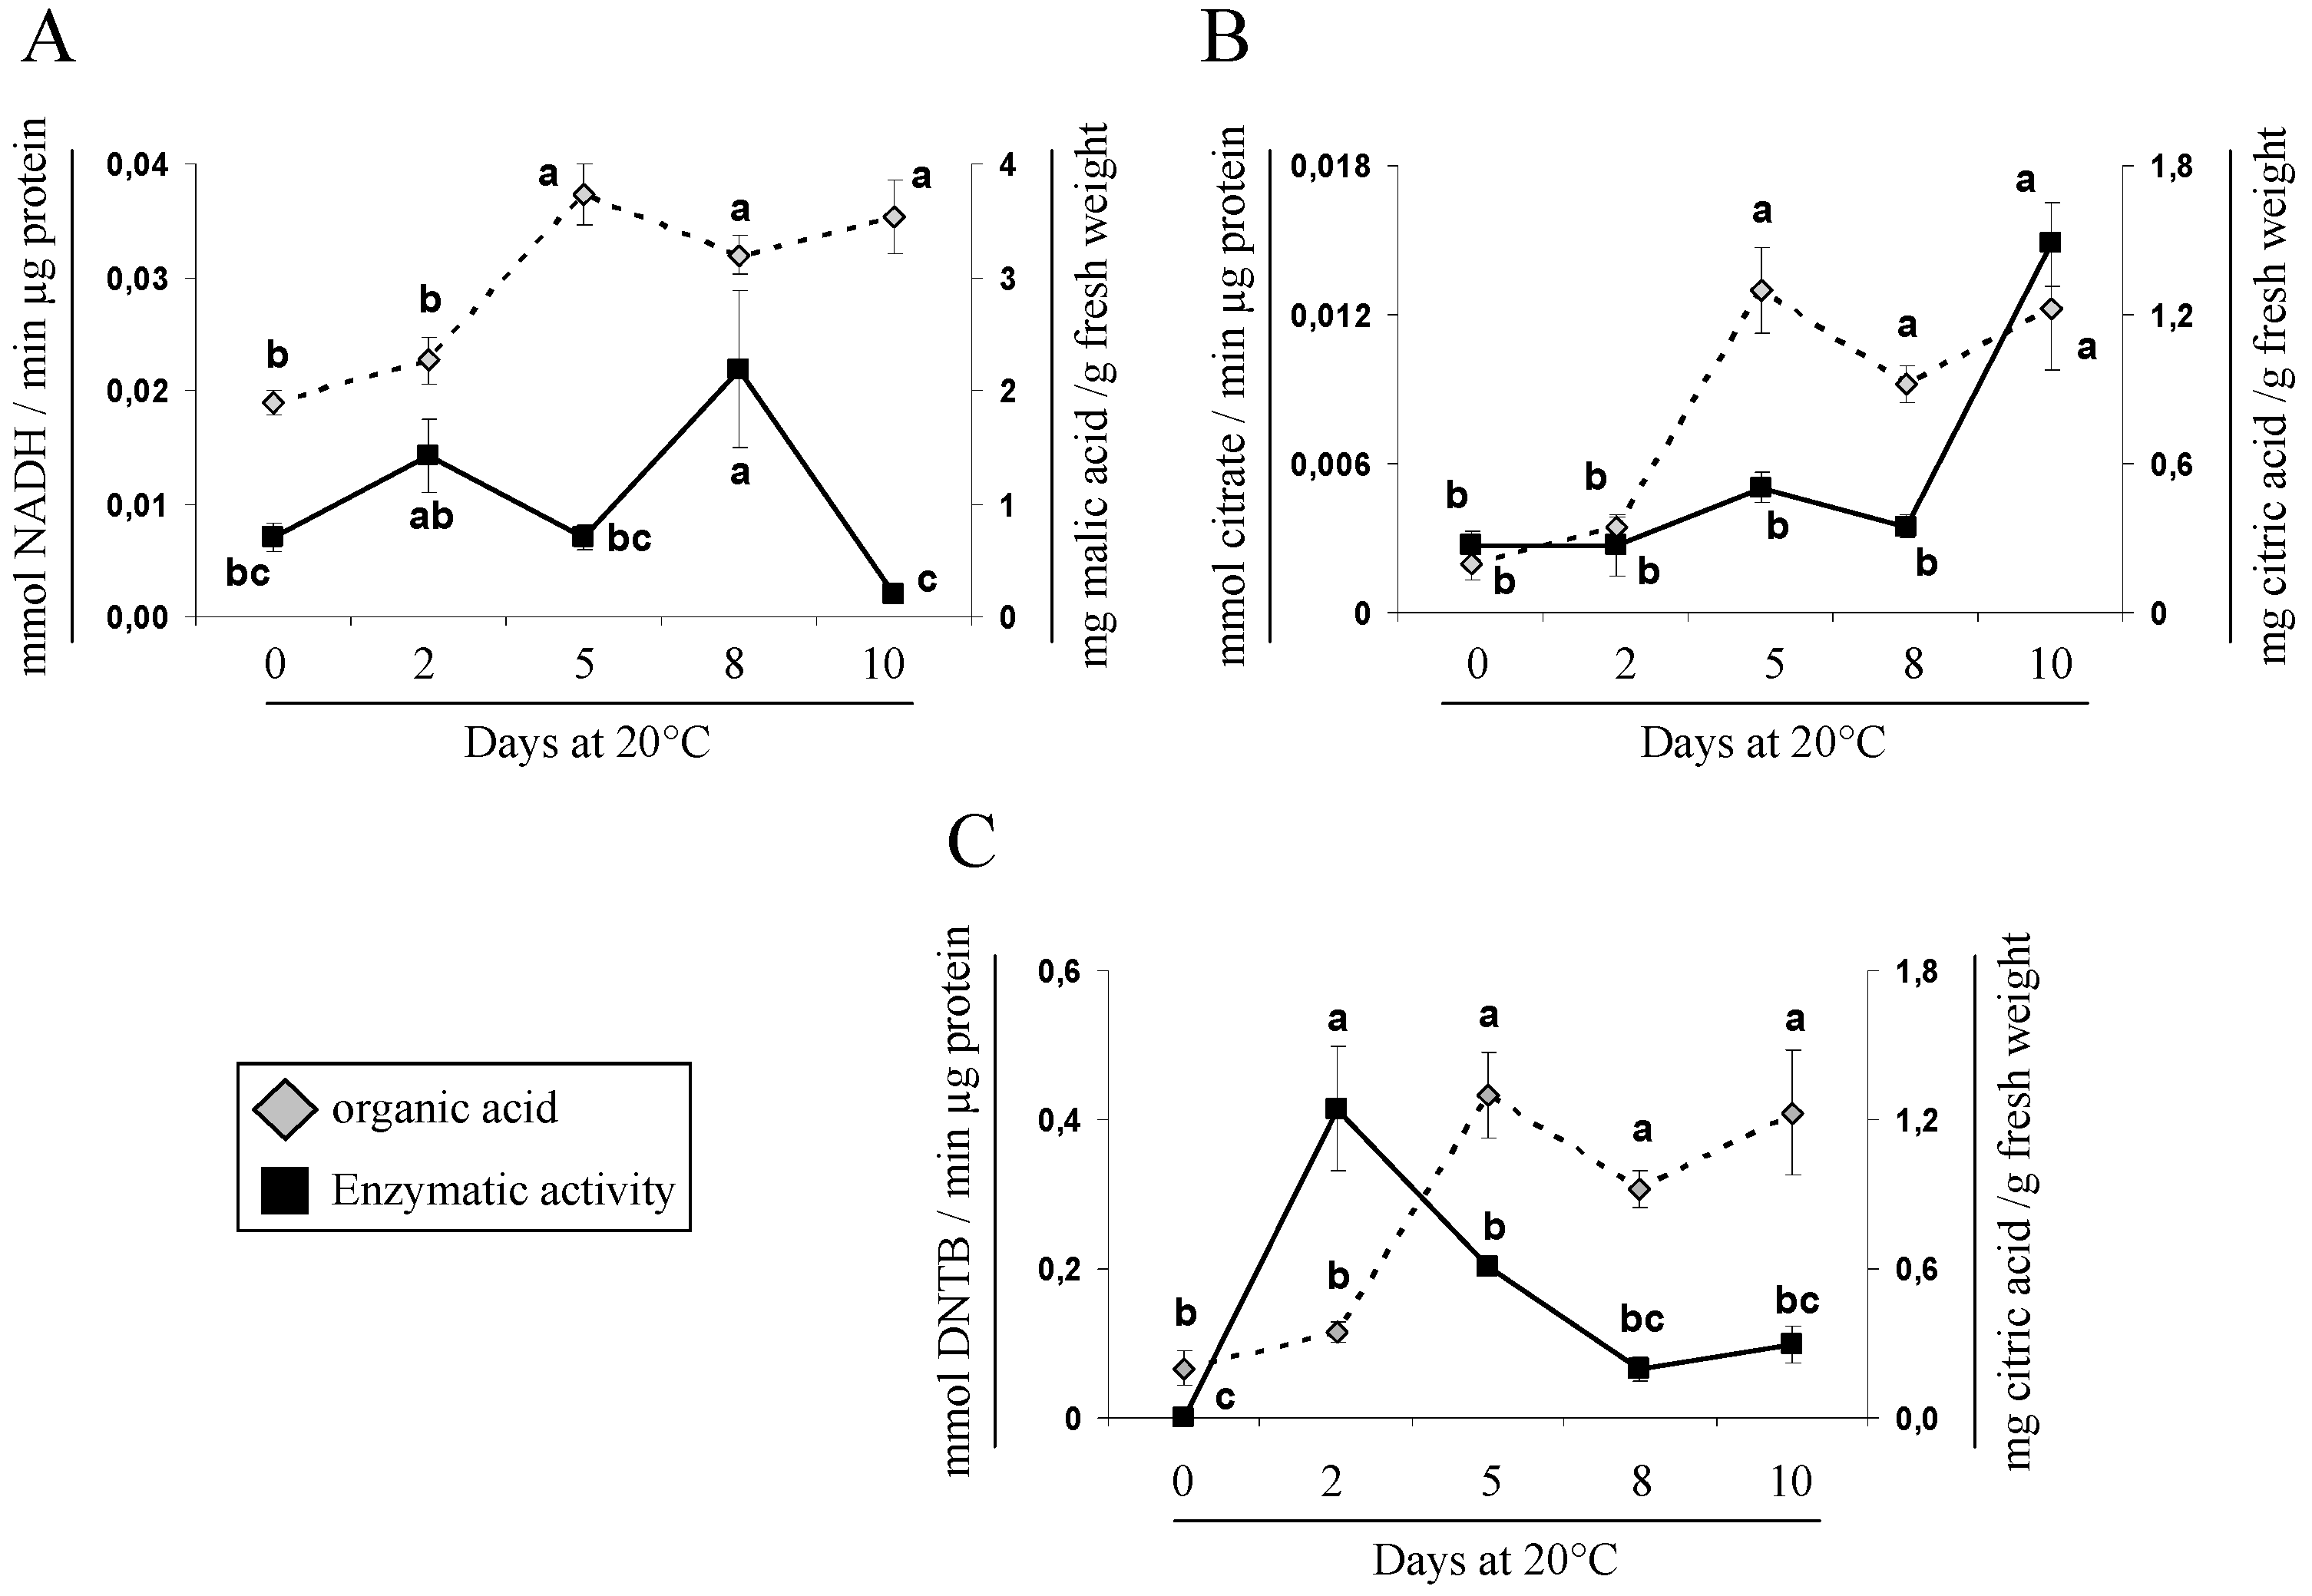
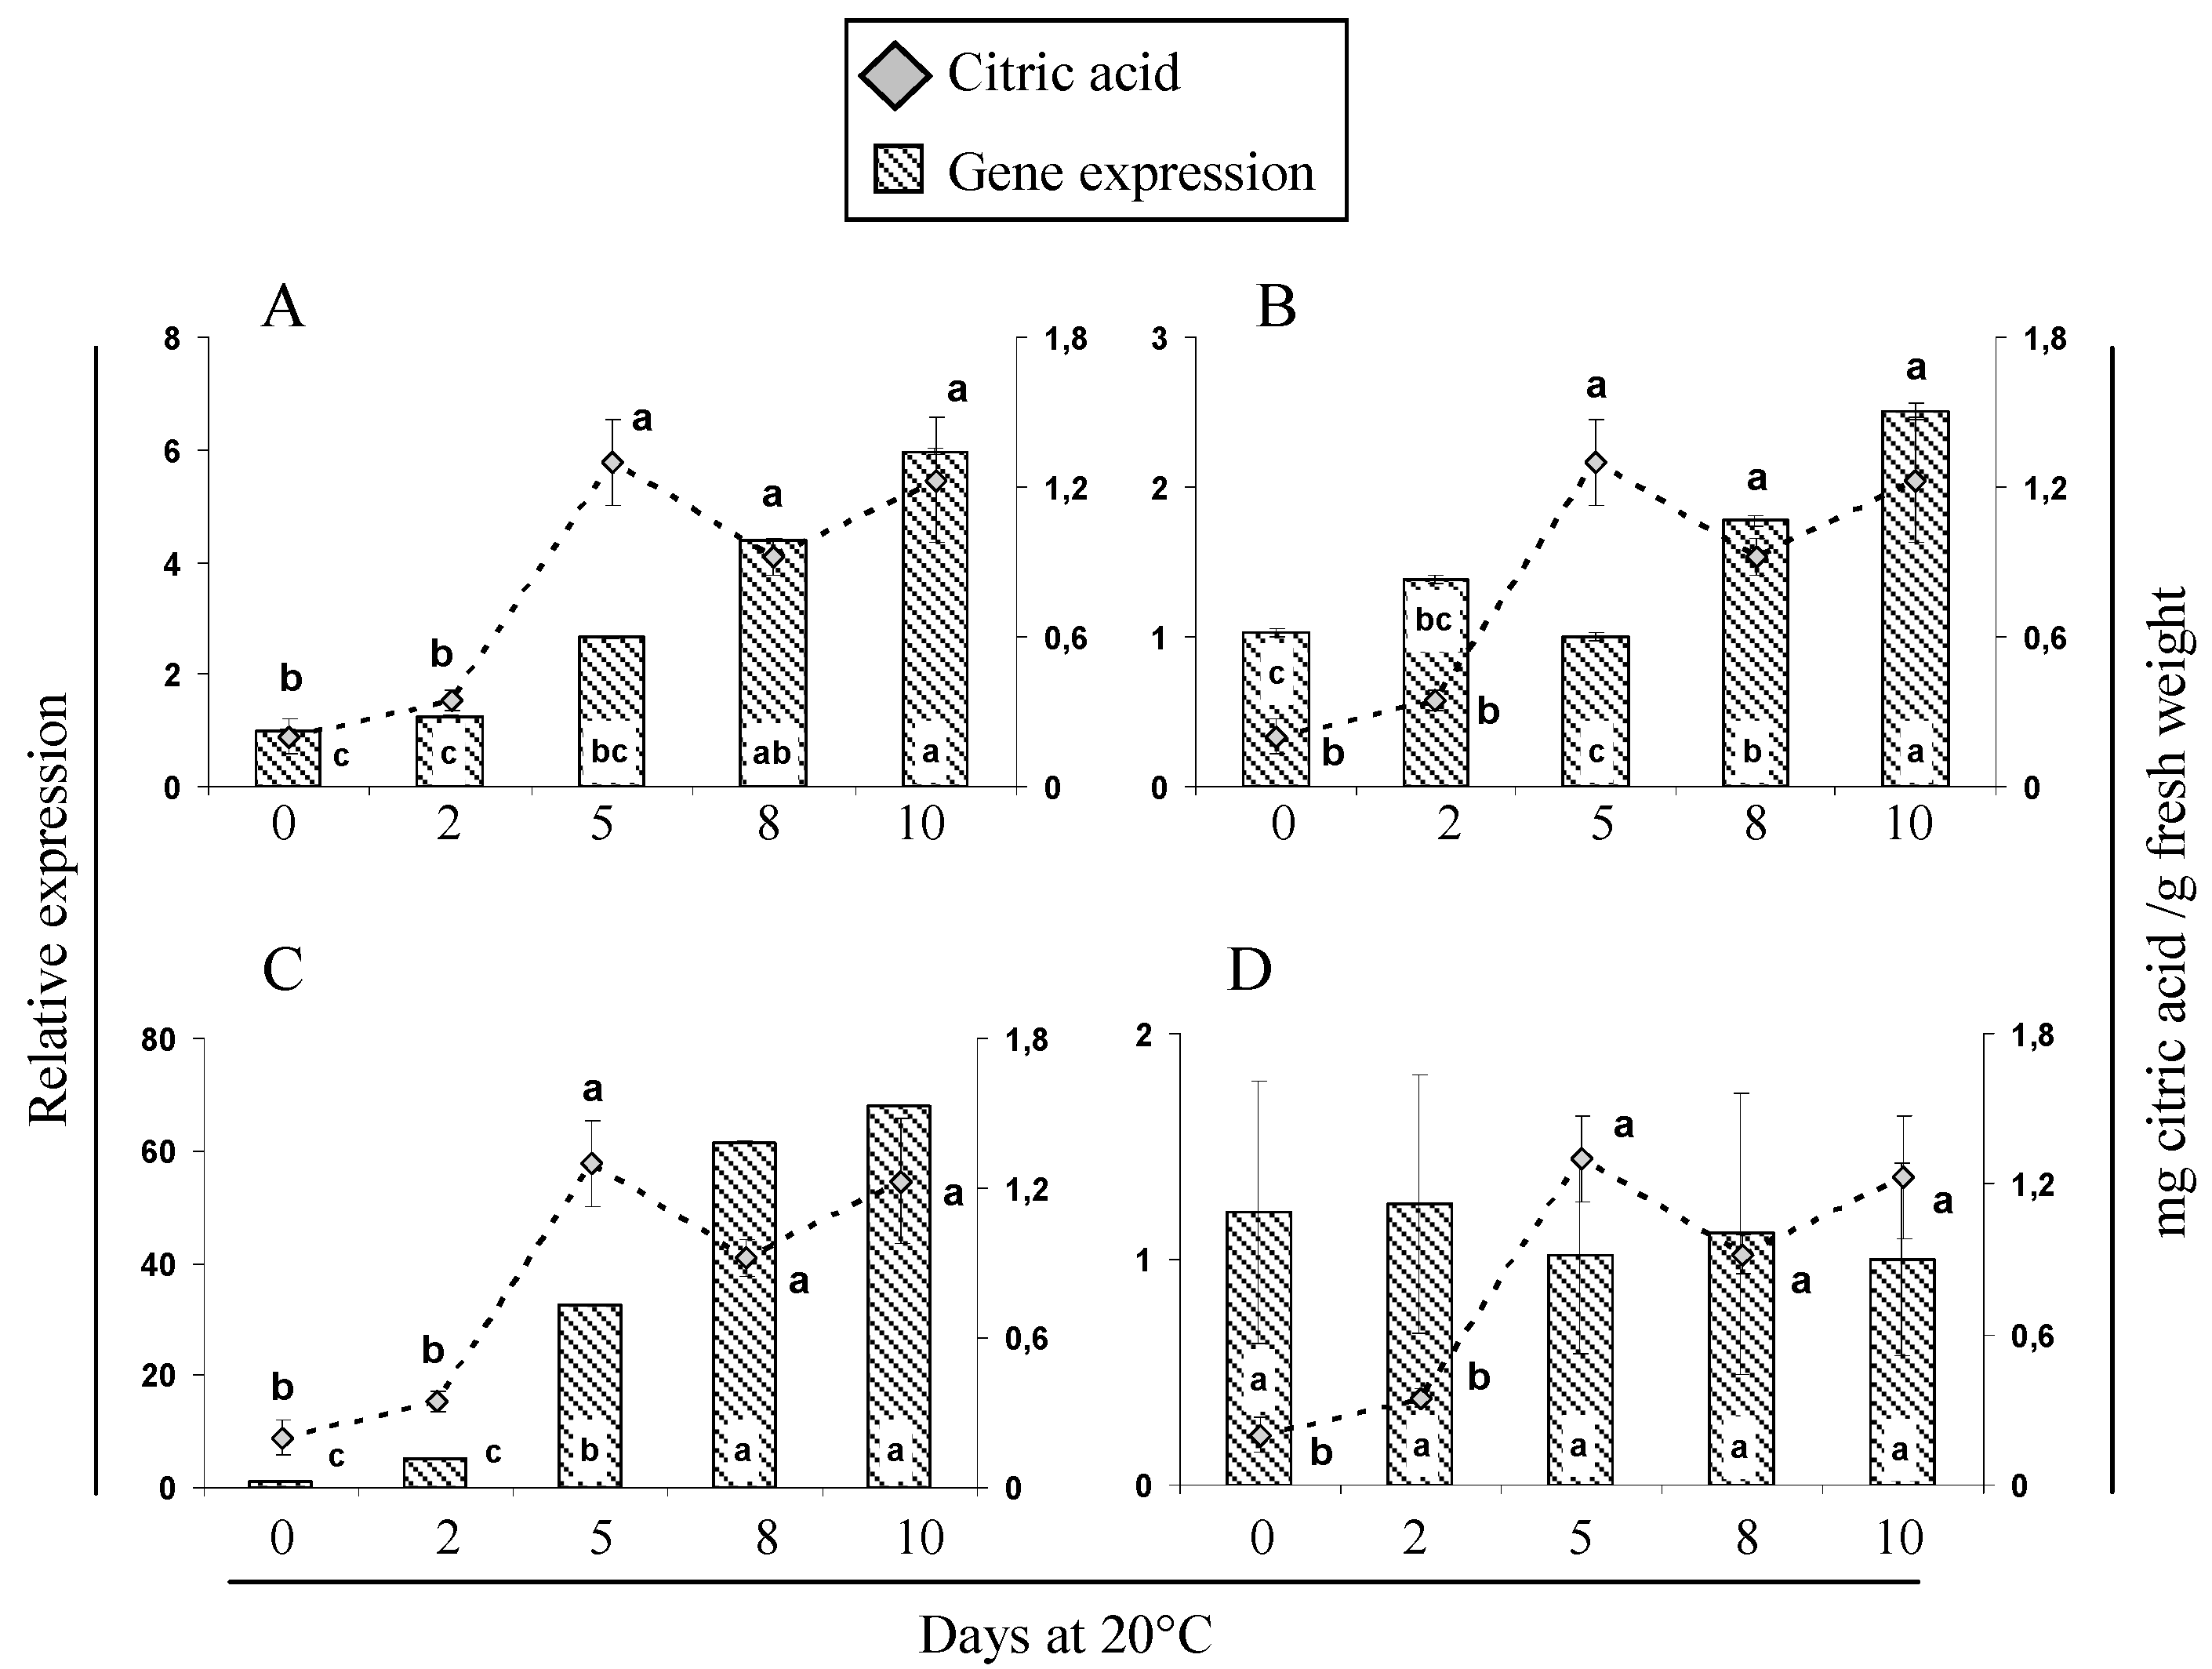
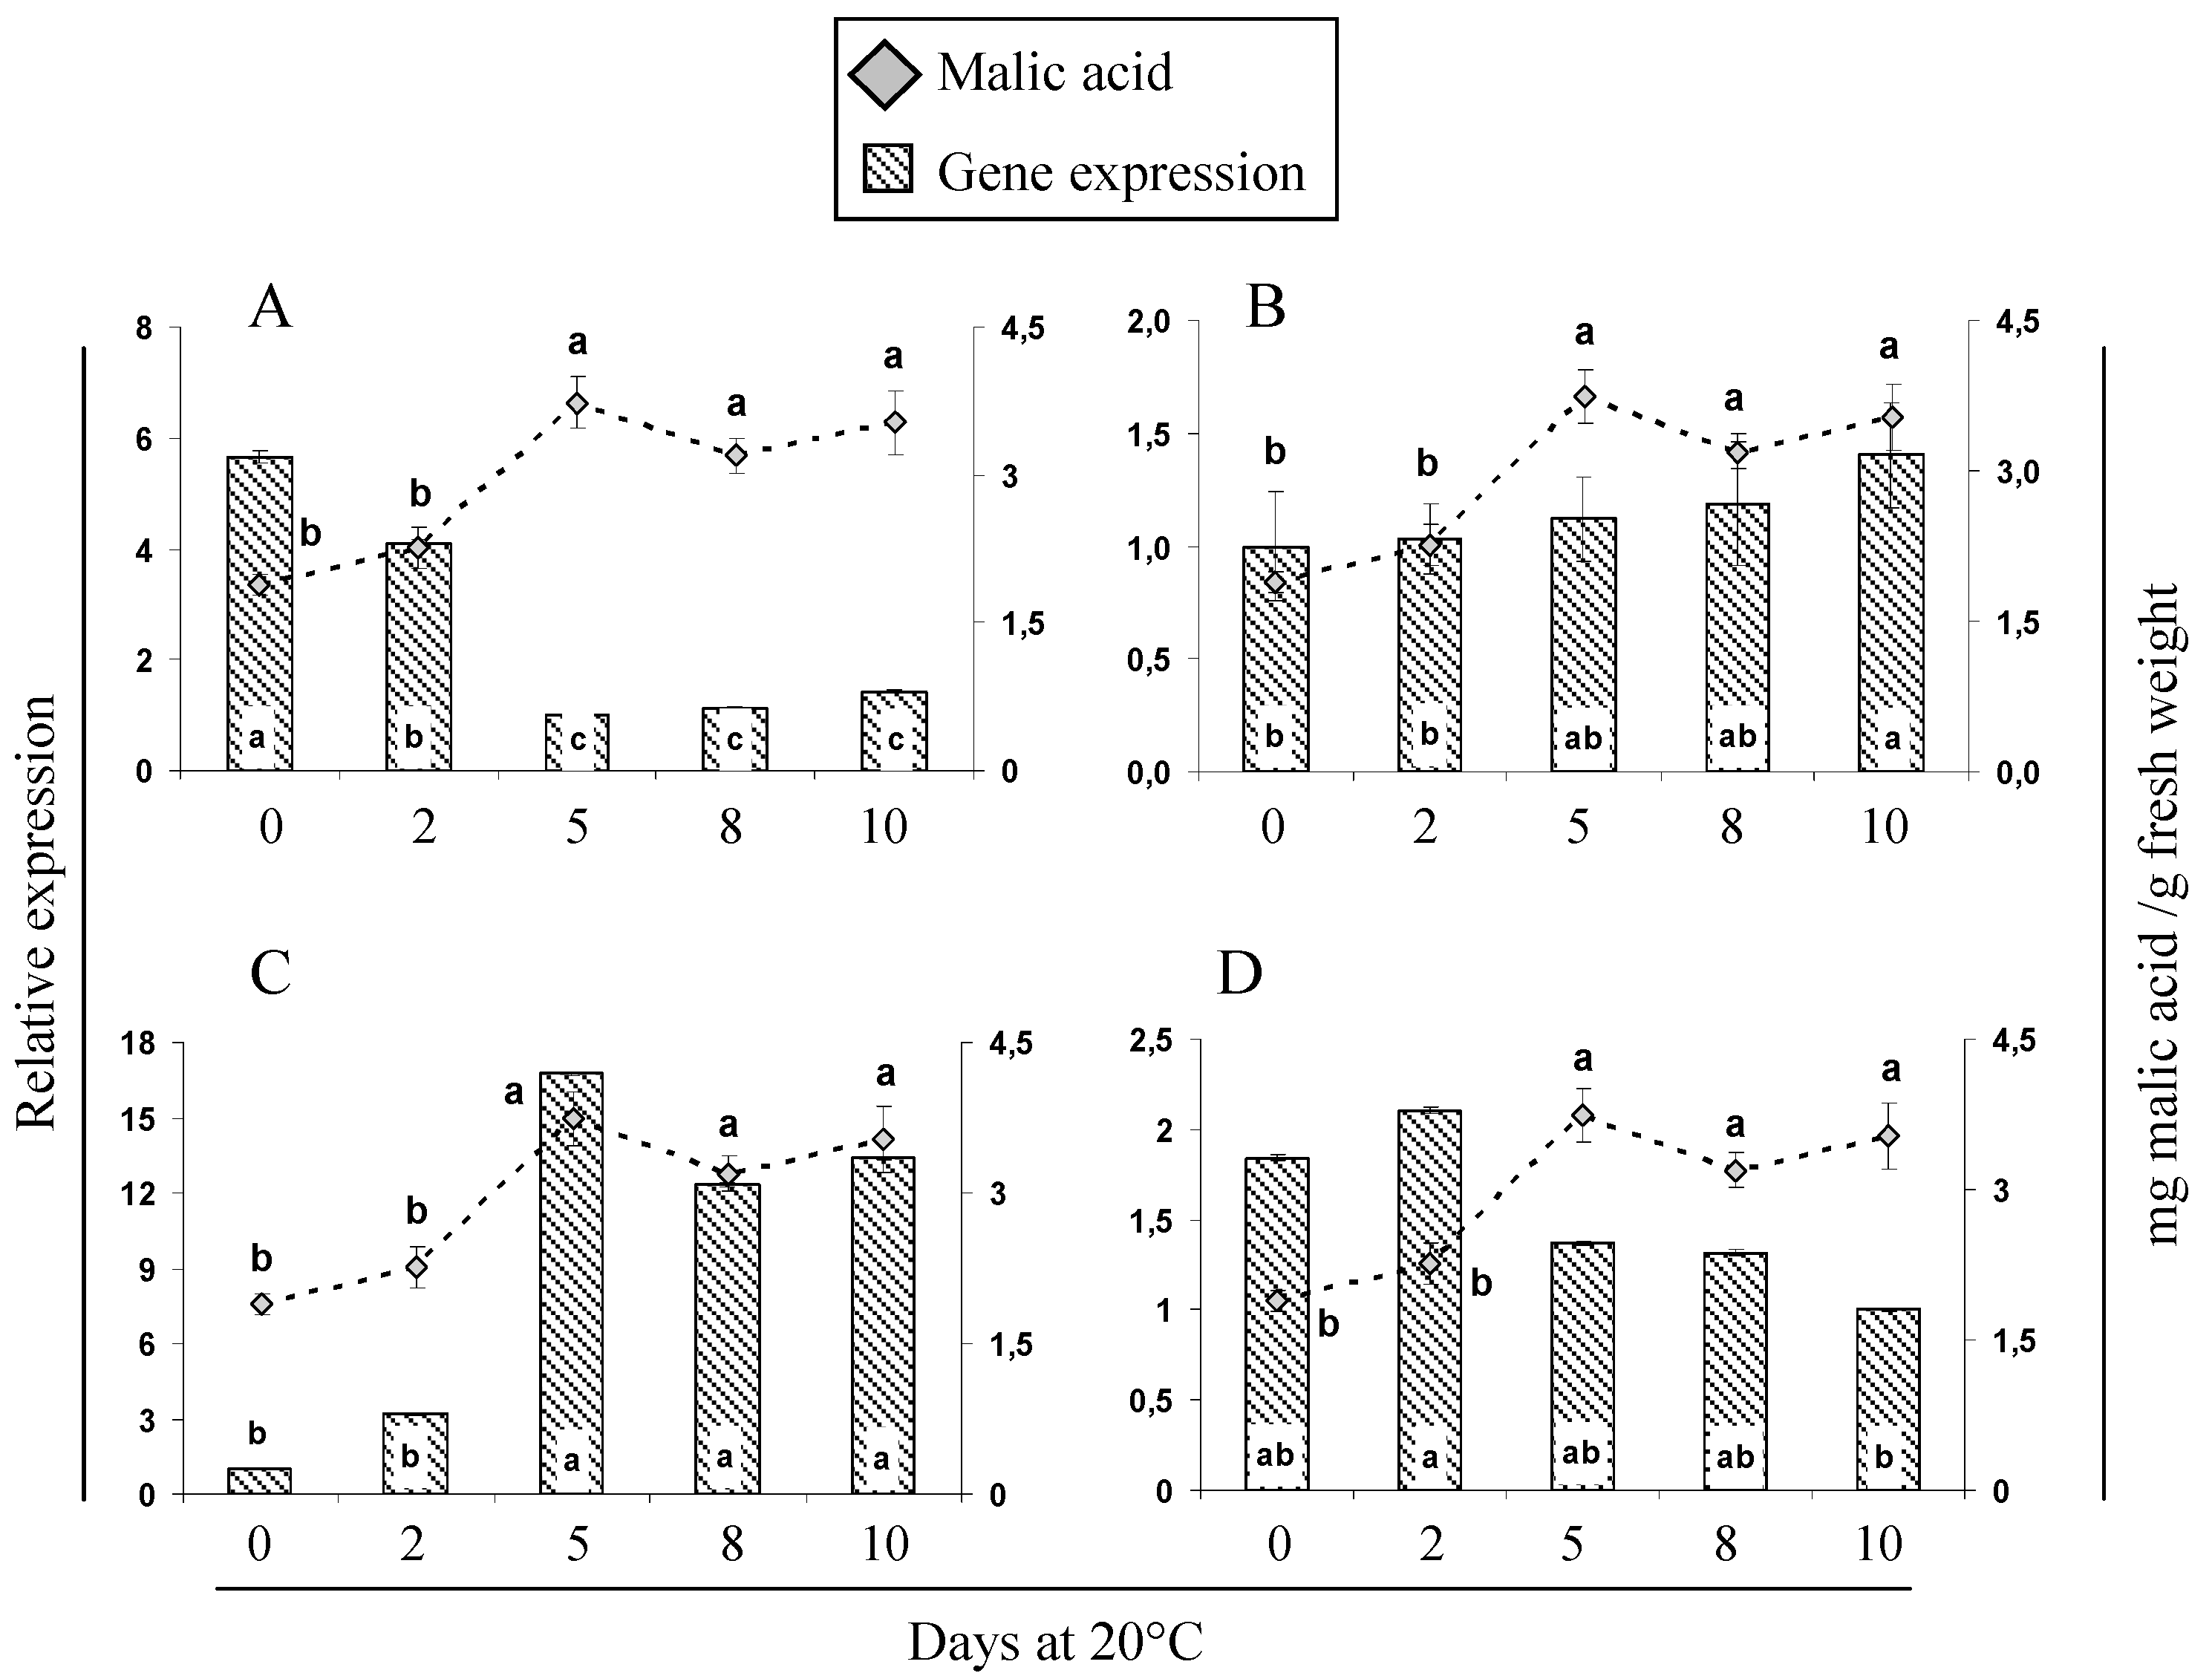
2.5. Gene Expression and Activity Analysis of Key Enzymes Related to Malic and Citric Metabolism during Cherimoya Ripening

The expression of eight genes and the activity of three enzymes were analyzed and compared to the increase in the respective organic acids during cherimoya ripening. Four genes related to malic acid metabolism (Figure 2) were analyzed by qPCR. One of them, AcPEPC (Figure 2A) showed high expression in the first days of ripening and then decreased; however, this could not explain the increase in malic acid detected during cherimoya ripening. Rises in malic acid concentration increases the availability of OAA during the first days of ripening, and this OAA is subsequently metabolized in other fruit species such as melon [34] and loquat [37]. PEPC activity increased during the early stages and then decreased, revealing a relationship between PEPC activity and organic acid concentration [34].
In the case of Ac-cyNAD-MDH (Figure 2B), which is responsible for the synthesis of malate from OAA in the cytoplasm, a slight increase in expression was found when the fruits ripened (10 days at 20 °C), and this could be related to the increase in malic acid concentration. Likewise, an increase in the NAD-MDH activity (8 days at 20 °C) was observed (Figure 3A). NAD-MDH activity represents a combination of cytosolic and mitochondrial activities; therefore it is not uncommon to find some divergence between activity data and the expression of this cytoplasmic gene. While, there is no temporal coincidence between the perceived rise on Ac-cyNAD-MDH expression and NAD-MDH activity; both, gene expression and protein activity increase and may be related with the high accumulation of malic acid. These results are consistent with and support the observations of Muñoz et al. [24], who suggested that the in vitro properties of these enzymes and the fact that the activity of NAD-MDH is higher than the activity of NADP-ME account for the particularly high titratable acidity of “Fino de Jete” cherimoyas during ripening.
Although we did not measure the activity of NADP-ME, the enzyme responsible for malic acid degradation, we did analyze expression of the AcNADP-ME gene (Figure 2C). We found increased ME transcript abundance, which was not correlated with the malate behavior. Both, the decrease in expression of Ac-PEPC and the increase in AcNADP-ME, may suggest that the biosynthesis of malate that normally occurs via PEPC and NAD-MDH, switches to pyruvate kinase and NADP-ME activities during ripening, similar to what has been found in other fruits, including non-climacteric fruits such as grapes [9]. Moreover, the AcNAD-ME gene, encoding the enzyme responsible for the conversion of malic acid to pyruvate, showed a decrease in expression at the end of ripening (Figure 2D).
Chen et al. [37] reported that ME may play a significant role in decreasing malic acid concentrations during the ripening of loquats, which is different from the observations of Saradhuldhat and Paull [38], who described no correlation with malic acid in pineapples. These different results show how interesting it would to learn more about the activity of this enzyme and its intracellular environment in different species.
With regard to citric acid metabolism, the first step in the TCA cycle is catalyzed by mCS. Our results showed that the increase in citric acid concentration was accompanied with enhanced CS activity (Figure 3B) and Ac-mCS gene expression (Figure 4A). These findings suggest that mCS may play a significant role in citric acid biosynthesis during ripening of “Concha Lisa” cherimoyas, similar to what has been reported in melons by Tang et al. [34]. Nonetheless, as citric acid is degraded by ACON in the TCA cycle, the citric acid concentration is expected to increase as ACON activity decreases.
Figure 4B shows that the citric acid concentration in cherimoya increased linearly, with a significant rise in AcACON expression, at the final stages of ripening. However, ACON activity increased rapidly after harvest but declined after 2 days at 20 °C (Figure 3C), consistent with previous findings in lemon, whereby reductions in ACON activity were found to play a role in citric acid accumulation [15,39]. Morgan et al. [39] report an increase in citrate proportional to the decrease in aconitase during ripening of transgenic and introgression lines of tomatoes, suggesting that aconitase activity is a major determinant, which affects not only the citrate levels, but also led to a substantial increase in malate and a decrease in succinate and fumarate concentrations on ripe fruits. Otherwise, similarly to the observations for AcNADP-ME in malate metabolism, expression of the AcATP-CS gene, which is also involved in the degradation of citric acid, surprisingly increased to approximately 60 times higher than the minimum value expressed during cherimoya ripening (Figure 4C); this was opposite to the citric acid content measured. However, this significant increase in AcATP-CS expression could be related to an increase in activity of this enzyme, which has been reported during ripening of mango fruit [40]. The increase of ATP-CS activity could switch the citrate metabolism away from the TCA cycle towards the supply of acetyl-CoA and OAA for other metabolically active pathways (e.g., flavonoids and isoprenoids) during fruit ripening [2]. Importantly, the malate and citrate metabolism are intimately connected, and the net synthesis of malate by ATP-CS has yet to be demonstrated in fruits [9], but to the best of our knowledge, this is the first report about it fact. Finally, AcNADP-IDH (Figure 4D), which is indirectly involved in the degradation of citrate, remained unchanged during ripening. Previous studies in peach [17] and melon [34] have shown that the expression patterns of genes involved in organic acid metabolism are not necessarily correlated with changes in organic acid content.

3. Materials and Methods

3.1. Plant Materials

Samples of developing cherimoya cv. “Concha Lisa” fruits were obtained from trees located at the La Palma experimental station at the Pontificia Universidad Católica de Valparaíso, Quillota (Chile), latitude −32.898574°, longitude −71.210712° and elevation 200 m. Samples were collected at nine stages of development between January and November 2013, and the phenological stage was classified according to Cautín and Agustí [25] using the BBCH-scale. The samples were transported to the Postharvest Laboratory facility at INIA to record the total fruit weight and equatorial diameter and were subsequently stored at −80 °C until use. Harvest-mature (November) samples were collected considering ground color as a harvesting index and then ripened at 20 °C for up to 10 days until the ready-to-eat stage was reached.

3.2. Fruit Parameters

Quality parameters were determined for each sample point during ripening from six fruits as biological replicates, and the results were expressed as the mean ± standard error (SE). Ethylene production and the respiration rate were determined using intact fruits with a static system. Briefly, fruits from each ripening stage were weighed and placed in 1.56-L jars, which were sealed and kept at 20 °C for 30 min prior to measurements. The concentrations of carbon dioxide (mL CO2 kg−1·h−1) and ethylene (µL C2H4 kg−1·h−1) in the jar headspace were then determined using a gas analyzer (PBI-Dansensor Checkmate 9900, Ringsted, Denmark) and a gas chromatograph (Shimadzu 8A, Tokyo, Japan) equipped with a flame ionization detector (FID). Fruit firmness was assessed by two measurements performed on opposite sheets of peeled fruit using a penetrometer (Effegi, Milan, Italy) equipped with a 4-mm (at harvest) or 8-mm (when fruits were nearly ripe) plunger; the values are expressed in kgf. Each fruit was subsequently halved, and one half was immediately frozen in liquid nitrogen and stored at −80 °C until further analysis. From the other half, a sample of 10 g was homogenized in a mortar, and the juice was analyzed for TSS and TA. TSS was measured using a temperature-compensated refractometer (ATC-1e, Atago, Tokyo, Japan), and the value is expressed as a percentage. TA measurements were performed by titration with 0.2 N NaOH until pH 8.2 was reached; the values were expressed as a percentage of malic acid.

3.3. Organic Acid Extraction and Measurement

Samples from each developmental stage and ripening point were prepared from 5 g of frozen homogeneous tissue sample from each fruit; six replicates at each sampling time were considered. Organic acids were extracted and analyzed by HPLC according to the methodology described by Manríquez et al. [23]. Organic acids were analyzed in a chromatography system with an L-4250A UV-VIS ultraviolet detector (Merck-Hitachi, Tokyo, Japan) for absorbance measurement at 195 nm with a D-6000 interface (Merck-Hitachi). Concentrations of tartaric, malic, ascorbic, citric, and succinic acid were determined according to a standard curve; the values are expressed as mg·g−1 fresh weight (FW) of fruit. All standards were obtained from Sigma-Aldrich (St. Louis, MO, USA).

3.4. Crude Protein Extraction and Enzyme Assays

Total protein from each 3 g sample of homogenized tissue was extracted using 5 mL of grinding buffer (0.2 M Tris-HCL pH 8.2, 0.6 M sucrose and 10 mM isoascorbic acid); the mixture was centrifuged for 5 min at 4 °C at 4000× g, and the supernatant was centrifuged again (at 4000× g) for 10 min at 4 °C. The supernatant (4 mL) was mixed with 1 mL extraction buffer (0.2 M Tris-HCL pH 8.2, 10 mM isoascorbic acid, Triton 0.1% v/v), and 2 mL (tube A) was centrifuged at 15,000× g for 15 min at 4 °C; the supernatant was discarded, and the precipitate was resuspended in another 2 mL of extraction buffer. The volume of this fraction (3 mL) was brought to 6 mL with extraction buffer, another 2 mL aliquot was taken (tube B), and the remaining 4 mL (tube C) was dialyzed for 10 h against 800 mL of buffer. The protein concentration in the crude extract was determined by the method of Bradford [41] using the Bio-Rad protein assay reagent (Bio-Rad, Hercules, CA, USA) and bovine serum albumin as the standard. Extracts from tubes A, B and C were used for activity measurements with a Jenway 6715 UV/visible spectrophotometer (Bibby Scientific Limited, Staffordshire, UK). The reaction mixtures used for each enzyme according to Tang et al. [34] are given below. Each reaction was performed in a final volume of 500 µL, incubated at room temperature for 5 min, and started by the addition of the enzyme extract followed by immediate measurement after mixing.
  • Aconitase (ACON): 40 mM Tris-HCl (pH 7.5), 0.1 M NaCl and 200 µM cis-aconitate, with 100 µL from tube A; measurement at 240 nm.
  • Malate dehydrogenase (MDH): 40 mM Tris-HCl (pH 8.2), 2 mM MgCl2, 10 mM KHCO3, 0.5 mM GSH, 2 mM oxaloacetate and 150 µM NADH, with 100 µL from tube B; measurement at 340 nm.
  • Citrate synthase (CS): 40 mM Tris-HCl (pH 9), 40 µM DTNB, 40 µM acetyl-CoA and 4 mM oxaloacetate, with 100 µL from tube C; measurement at 412 nm.

3.5. RNA Extraction and cDNA Synthesis

Total RNA from 2–4 g of frozen tissue from each development and ripening stage was extracted using the modified hot borate method [42]. The quantity of RNA was assessed using a Qubit® 2.0 fluorometer (Invitrogen™, Eugene, OR, USA); the quality was assessed by measuring A260/280 and 260/230 ratios and by electrophoresis through a 1.5% formaldehyde-agarose gel. First-strand cDNA was obtained by reverse transcription reactions using 2 µg of DNase I-treated total RNA (Fermentas, Thermo Fisher Scientific Inc., Waltham, MA, USA) as the template, MMLV-RT reverse transcriptase (Promega, Madison, WI, USA) and oligo dT primers according to a standard procedure. The concentration of cDNA was assessed by measuring the absorbance at 260 nm. Each cDNA sample was diluted to 50 ng/μL prior to use in qPCR assays.

3.6. Isolation of Partial cDNAs for Organic Acid-Related Genes

To amplify cDNAs encoding isocitrate dehydrogenase (NADP-IDH, EC 1.1.1.42), aconitate hydratase 1 (ACON, EC 4.2.1.3), NADP-dependent malic enzyme (NADP-ME, EC 1.1.1.40), NAD-dependent malic enzyme (NAD-ME, EC 1.1.1.39), phosphoenolpyruvate carboxylase (PEPC, EC 4.1.1.31), mitochondrial citrate synthase (mCS, EC 2.3.3.1), ATP-citrate synthase (ATP-CS, EC 2.3.3.8) and cytosolic NAD-malate dehydrogenase (cyNAD-MDH, EC 1.1.1.37), heterologous or degenerate primers were designed according to conserved regions in the corresponding protein in other plant species; alternatively, those cited by Yang et al. [43], Moing et al. [44] or Iannetta et al. [14] were used. The sequences of the forward and reverse primers used are given in Table 4. In general, the PCR programs involved an initial denaturation step at 94 °C for 1 min, followed by 30–35 cycles of 94 °C for 30 s, 50–60 °C (depending upon the primers) for 30 s, and 72 °C for 60 s, and a final extension step at 72 °C for 10 min. All PCR reactions were performed in a MyCycler thermal cycler (Bio-Rad). The PCR products were verified by electrophoresis through a 1.5% (w/v) agarose gel containing ethidium bromide and then cloned into the pGEM-T Easy vector (Promega) followed by sequencing (Macrogen Corp., Seoul, Korea). All primary sequences were compared to sequences from National Center for Biotechnology Information (NCBI) using BLAST alignment programs [33].

3.7. Cloning of Full-Length Annona Cherimola Organic Acid-Related Genes

To obtain the full-length cDNAs of organic acid-related genes, A. cherimola-specific primers (Table 4) were designed using Primer Premier 5.0 software (Premier Biosoft International, Palo Alto, CA, USA). RACE-PCR assays were performed using the adaptors, primers, enzymes, and procedures of the GeneRacer kit (Invitrogen, Breda, The Netherlands). Amplified 5′ and 3′ RACE fragments were analyzed by agarose gel electrophoresis, and selected DNA fragments were cloned into pGEM T-Easy (Promega) according to the manufacturer’s recommendations. Both strands were sequenced and compared using BLAST alignment programs. The nucleotide sequence of each new A. cherimola organic acid-related gene was translated, and open reading frames (ORFs) were identified using ORF Finder [46] and Swiss-Model Tools [47]. The subcellular localization of predicted cytoplasmic and mitochondrial proteins, as based on the identification of a transit peptide, was analyzed using TargetP software [48].

3.8. Real-Time Quantitative PCR Assays

The transcript abundance of the nine organic acid-related genes identified in this study was analyzed by qPCR with a LightCycler® 96 Real-Time PCR System (Roche Diagnostics, Mannheim, Germany) using LC-FastStart DNA Master SYBR Green I to measure amplified RNA-derived DNA products and gene-specific primers (Table 4), similar to García-Rojas et al. [49]. Real-time quantitative PCR was performed on each of four biological samples in duplicate, and the gene expression values were normalized to the AcUbiq (GenBank FJ664263) [45].

3.9. Statistical Analyses

All data were subjected to statistical analyses of variance, and the means were separated by an LSD test at the 5% significance level using Statgraphics Centurion Plus 5 (Manugistics Inc., Rockville, MD, USA).

4. Conclusions

In this work we conducted a comprehensive investigation of organic acid biosynthetic pathways in cherimoya fruit. To the best of our knowledge, this is the first study to evaluate the expression of genes, enzyme activities, and metabolites related to organic acid pathways, which are possibly related to the particular behavior of titratable acidity during cherimoya ripening. A total of eight novel A. cherimola genes showing various levels of expression throughout cherimoya development and ripening were identified and characterized. In addition, citric and malic acids were demonstrated to be the most abundant organic acids in “Concha Lisa” cherimoya fruits. These results reveal an early accumulation of citric acid as well as other changes associated with the abundance of transcripts encoding malate and citrate catabolism enzymes at the beginning of ripening; however, this stage may not define the particular acidity behavior of cherimoya during ripening. The increase in malic acid at the last stage may be due to increased activity of NAD-MDH during ripening, an increase in the transcript levels of Ac-cyNAD-MDH and down-regulation of AcNAD-ME. Similarly, the greater amount of citric acid could be due to an increase in the activity of CS, up-regulation of the Ac-mCS gene, and a decrease in ACON activity throughout A. cherimola ripening. Finally, the objective of this research was to understand why this particular increase in acidity occurs during cherimoya ripening; thus, future experiments for characterizing in more detail the individual components of organic acid metabolism (e.g., Ac-mCS) and other factors related to the transport and accumulation of organic acids could help broaden our understanding of the molecular mechanisms involved in these biosynthetic pathways in A. cherimola.

Acknowledgments

Mauricio González-Agüero gratefully acknowledges the FONDECYT 1130630 project for financial support.

Author Contributions

The conception and design of experiments was performed by Mauricio González-Agüero, with the collaboration of Bruno G. Defilippi and Pedro Undurraga in the interpretation and discussing of the results. Mauricio González-Agüero, Luis Tejerina Pardo and María Sofía Zamudio performed the experiments. Mauricio González-Agüero, María Sofía Zamudio and Carolina Contreras wrote the paper. All authors revised the draft and approved the version submitted.

Conflicts of Interest

The authors declare no conflict of interest.

Abbreviations

The following abbreviations are used in this manuscript:
cyNAD-MDH
cytoplasmic NAD-dependent malate dehydrogenase
mCS
mitochondrial citrate synthase
TSS
total soluble solids
TA
titratable acidity
TCA
tricarboxylic acid cycle
PEP
phosphoenolpyruvate
PEPC
phosphoenolpyruvate carboxylase
NADP-ME
NADP-malic enzyme
ACON
aconitase
NAD-IDH
NAD-dependent isocitrate dehydrogenase
BBCH
Biologische Bundesanstalt, Bundessortenamt und Chemische Industrie 
FW
fresh weight
WAB
weeks after blooming
NAD-ME
NAD-dependent malic enzyme
ATP-CS
ATP citrate synthase
aa
amino acids
qPCR
real-time quantitative PCR assays
OAA
oxaloacetate
SE
standard error
ORF
open reading frame

References

  1. Giovannoni, J.J. Molecular biology of fruit maturation and ripening. Annu. Rev. Plant Physiol. Plant Mol. Biol. 2001, 52, 725–749. [Google Scholar] [CrossRef] [PubMed]
  2. Giovannoni, J.J. Genetic regulation of fruit development and ripening. Plant Cell 2004, 16, S170–S180. [Google Scholar] [CrossRef] [PubMed]
  3. Kader, A.A. Flavor quality of fruits and vegetables. J. Sci. Food Agric. 2008, 88, 1863–1868. [Google Scholar] [CrossRef]
  4. Obenland, D.; Collin, S.; Mackey, B.; Sievert, J.; Fjeld, K.; Arpaia, M.L. Determinants of flavor acceptability during the maturation of navel oranges. Postharvest Biol. Technol. 2009, 52, 156–163. [Google Scholar] [CrossRef]
  5. Ferguson, I.B.; Boyd, L.M. Inorganic nutrients and fruit quality. In Fruit Quality and its Biological Basis; Knee, M., Ed.; CRC Press LLC: Boca Raton, FL, USA, 2002; pp. 17–45. [Google Scholar]
  6. Pehrson, J.E.; Ivans, E.M. Variability in early season navel orange clone maturity and consumer acceptance. Proc. Int. Soc. Citric. 1988, 4, 1631–1635. [Google Scholar]
  7. Crisosto, C.H.; Crisosto, G.M. Understanding American and Chinese consumer acceptance of “Redglobe” table grapes. Postharvest Biol. Technol. 2002, 24, 155–162. [Google Scholar] [CrossRef]
  8. Crisosto, C.H.; Crisosto, G.M.; Metheney, P. Consumer acceptance of “Brooks” and “Bing” cherries is mainly dependent on fruit SSC and visual skin color. Postharvest Biol. Technol. 2003, 28, 159–167. [Google Scholar] [CrossRef]
  9. Sweetman, C.; Deluc, L.G.; Cramer, G.R.; Ford, C.M.; Soole, K.L. Regulation of malate metabolism in grape berry and other developing fruits. Phytochemistry 2009, 70, 1329–1344. [Google Scholar] [CrossRef] [PubMed]
  10. Etienne, A.; Génard, M.; Lobit, P.; Mbeguié-A-Mbéguié, D.; Bugaud, C. What controls fleshy fruit acidity? A review of malate and citrate accumulation in fruit cells. J. Exp. Bot. 2013, 64, 1451–1469. [Google Scholar] [CrossRef] [PubMed]
  11. Bai, Y.; Dougherty, L.; Cheng, L.; Xu, K. A co-expression gene network associated with developmental regulation of apple fruit acidity. Mol. Genet. Genom. 2015, 4, 1247–1463. [Google Scholar] [CrossRef] [PubMed]
  12. Schulze, J.; Tesfaye, M.; Litjens, R.; Bucciarelli, B.; Trepp, G.; Miller, S.; Samac, D.; Allan, D.; Vance, C.P. Malate plays a central role in plant nutrition. Plant Soil 2002, 247, 133–139. [Google Scholar] [CrossRef]
  13. Sadka, A.; Dahan, E.; Or, E.; Roose, M.L.; Marsh, K.B.; Cohen, L. Comparative analysis of mitochondrial citrate synthase gene structure, transcript level and enzymatic activity in acidless and acid-containing Citrus varieties. Funct. Plant Biol. 2001, 28, 383–390. [Google Scholar] [CrossRef]
  14. Iannetta, P.P.M.; Escobar, N.M.; Ross, H.A.; Souleyre, E.J.F.; Hancock, R.D.; Witte, C.P.; Davies, H.V. Identification, cloning and expression analysis of strawberry (Fragaria X ananassa) mitochondrial citrate synthase and mitochondrial malate dehydrogenase. Physiol. Plant. 2004, 121, 15–26. [Google Scholar] [CrossRef] [PubMed]
  15. Sadka, A.; Dahan, E.; Cohen, L.; Marsh, K.B. Aconitase activity and expression during the development of lemon fruit. Physiol. Plant. 2000, 108, 255–262. [Google Scholar] [CrossRef]
  16. Sha, S.F.; Li, J.C.; Wu, J.; Zhang, S.L. Changes in the organic acid content and related metabolic enzyme activities in developing “Xinping” pear fruit. Afr. J. Agric. Res. 2011, 6, 3560–3567. [Google Scholar]
  17. Etienne, C.; Moing, A.; Dirlewanger, E.; Raymond, P.; Monet, R.; Rothan, C. Isolation and characterization of six peach cDNAs encoding key proteins in organic acid metabolism and solute accumulation: Involvement in regulating peach fruit acidity. Physiol. Plant. 2002, 114, 259–270. [Google Scholar] [CrossRef] [PubMed]
  18. Ackermann, J.; Fischer, M.; Amado, R. Changes in sugars, acids, and amino acids during ripening and storage of apples (cv. Glockenapfel). J. Agric. Food Chem. 1992, 40, 1131–1134. [Google Scholar] [CrossRef]
  19. Gutierrez-Carnelossi, M.A.; Costa de Sena, H.; Narain, N.; Yaguiu, P.; da Silva, G.F. Physico-Chemical Quality Changes in Mangaba (Hancornia speciosa gomes) Fruit Stored at Different Temperatures. Braz. Arch. Biol. Technol. 2009, 52, 985–990. [Google Scholar] [CrossRef]
  20. Paull, R.E.; Deputy, J.; Chen, N.J. Changes in organic acids, sugars, and headspace volatiles during fruit ripening of soursop. J. Am. Soc. Hortic. Sci. 1983, 108, 931–934. [Google Scholar]
  21. Palma, T.; Aguilera, J.M.; Stanley, D. A review of postharvest events in cherimoya. Postharvest Biol. Technol. 1993, 2, 187–208. [Google Scholar] [CrossRef]
  22. Gutierrez, M.; Lahoz, J.M.; Sola, M.M.; Pascaul, L.; Vargas, A.M. Postharvest changes in total soluble solids and tissue pH of cherimoya fruit stored at chilling and non-chilling temperatures. J. Hortic. Sci. 1994, 69, 459–463. [Google Scholar] [CrossRef]
  23. Manríquez, D.; Muñoz, P.; Gudenschwager, O.; Robledo, P.; Defilippi, B. Development of flavor-related metabolites in cherimoya (Annona cherimola Mill.) fruit and their relationship with ripening physiology. Postharvest Biol. Technol. 2014, 94, 58–65. [Google Scholar] [CrossRef]
  24. Muñoz, T.; Sanchez-Ballesta, M.T.; Ruiz-Cabello, J.; Escribano, M.I.; Merodio, C. The acid metabolism of Annona fruit during ripening. J. Hortic. Sci. Biotechnol. 2004, 79, 472–478. [Google Scholar] [CrossRef]
  25. Cautín, R.; Agustí, M. Phenological growth stages of the cherimoya tree (Annona cherimola Mill.). Sci. Hortic. 2005, 105, 491–497. [Google Scholar] [CrossRef]
  26. Higuchi, H.; Utsunomiya, N.; Sakuratani, T. High temperature effects on cherimoya fruit set, growth and development under greenhouse conditions. Sci. Hortic. 1998, 77, 23–31. [Google Scholar] [CrossRef]
  27. Alique, R.; Oliveira, G. Changes in sugar and organic acids in cherimoya (Annona cherimola Mill.) fruit under controlled-atmosphere storage. J. Agric. Food Chem. 1994, 42, 799–803. [Google Scholar] [CrossRef]
  28. Mounet, F.; Moing, A.; Garcia, V.; Petit, J.; Maucourt, M.; Deborde, C.; Bernillon, S.; le Gall, G.; Colquhoun, I.; Defernez, M.; et al. Gene and metabolite regulatory network analysis of early developing fruit tissues highlights new candidate genes for the control of tomato fruit composition and development. Plant Physiol. 2009, 149, 1505–1528. [Google Scholar] [CrossRef] [PubMed]
  29. Ruffner, H.P.; Hawker, J.S. Control of glycolysis in ripening berries of Vitis vinifera. Phytochemistry 1977, 16, 1171–1175. [Google Scholar] [CrossRef]
  30. Famiani, F.; Walker, R.P.; Tecsi, L.; Chen, Z.H.; Proietti, P.; Leegood, R.C. An immunohistochemical study of the compartmentation of metabolism during the development of grape (Vitis vinifera L.) berries. J. Exp. Bot. 2000, 51, 675–683. [Google Scholar] [CrossRef] [PubMed]
  31. Fortes, A.M.; Agudelo-Romero, P.; Silva, M.S.; Ali, K.; Sousa, L.; Maltese, F.; Choi, Y.H.; Grimplet, J.; Martinez-Zapater, J.M.; Verpoorte, R.; Pais, M.S. Transcript and metabolite analysis in Trincadeira cultivar reveals novel information regarding the dynamics of grape ripening. BMC Plant Biol. 2011, 11, 149. [Google Scholar] [CrossRef] [PubMed] [Green Version]
  32. DeBolt, S.; Cook, D.; Ford, C. L-Tartaric acid synthesis from vitamin C in higher plants. Proc. Natl. Acad. Sci. USA 2006, 103, 5608–5613. [Google Scholar] [CrossRef] [PubMed]
  33. The Basic Local Alignment Search Tool. Available online: http://blast.ncbi.nlm.nih.gov/Blast.cgi (accessed on 9 December 2015).
  34. Tang, M.; Bie, Z.; Wub, M.; Yi, H.; Feng, J. Changes in organic acids and acid metabolism enzymes in melon fruit during development. Sci. Hortic. 2010, 123, 360–365. [Google Scholar] [CrossRef]
  35. Pareek, S.; Yahia, E.M.; Pareek, O.P.; Kaushik, R.A. Postharvest physiology and technology of Annona fruits. Food Res. Int. 2011, 44, 1741–1751. [Google Scholar] [CrossRef]
  36. Bruinsma, J.; Paull, R.E. Respiration during postharvest development of soursop fruit, Annona muricata L. Plant Physiol. 1984, 76, 131–138. [Google Scholar] [CrossRef] [PubMed]
  37. Chen, F.X.; Liu, X.H.; Chen, L.S. Developmental changes in pulp organic acid concentration and activities of acid-metabolising enzymes during the fruit development of two loquat (Eriobotrya japonica L.) cultivars differing in fruit acidity. Food Chem. 2009, 114, 657–664. [Google Scholar] [CrossRef]
  38. Saradhuldhat, P.; Paull, R.E. Pineapple organic acid metabolism and accumulation during fruit development. Sci. Hortic. 2007, 112, 297–303. [Google Scholar] [CrossRef]
  39. Morgan, M.J.; Osorio, S.; Gehl, B.; Baxter, C.J.; Kruger, N.J.; Ratcliffe, R.G.; Fernie, A.R.; Sweetlove, L.J. Metabolic engineering of tomato fruit organic acid content guided by biochemical analysis of an introgression line. Plant Physiol. 2013, 161, 397–407. [Google Scholar] [CrossRef] [PubMed]
  40. Mattoo, A.; Modi, V. Citrate cleavage enzyme in mango fruit. Biochem. Biophys. Res. Commun. 1970, 39, 895–904. [Google Scholar] [CrossRef]
  41. Bradford, M.M. A Rapid and quantitative method for quantitation of microgram quantities of protein utilizing the principle of protein-dye binding. Anal. Biochem. 1976, 72, 248–252. [Google Scholar] [CrossRef]
  42. Gudenschwager, O.; González-Agüero, M.; Defilippi, B.G. A general method for high-quality RNA isolation from metabolite-rich fruits. S. Afr. J. Bot. 2012, 83, 186–192. [Google Scholar] [CrossRef]
  43. Yang, L.T.; Jiang, H.X.; Qi, J.P.; Chen, L.S. Differential expression of genes involved in alternative glycolytic pathways, phosphorus scavenging and recycling in response to aluminum and phosphorus interactions in Citrus roots. Mol. Biol. Rep. 2012, 39, 6353–6366. [Google Scholar] [CrossRef] [PubMed]
  44. Moing, A.; Rothan, C.; Svanella, L.; Just, D.; Diakou, P.; Raymond, P.; Gaudillere, J.P.; Monet, R. Role of phosphoenolpyruvate carboxylase in organic acid accumulation during peach fruit development. Physiol. Plant. 2000, 108, 1–10. [Google Scholar] [CrossRef]
  45. González-Agüero, M.; Cifuentes-Esquivel, N.; Ibañez-Carrasco, F.; Gudenschwager, O.; Campos-Vargas, R.; Defilippi, B.G. Identification and characterization of genes differentially expressed in cherimoya (Annona cherimola Mill.) after exposure to chilling injury conditions. J. Agric. Food Chem. 2011, 59, 13295–13299. [Google Scholar] [CrossRef] [PubMed]
  46. Wheeler, D.L.; Church, D.M.; Federhen, S.; Lash, A.E.; Madden, T.L.; Pontius, J.U.; Schuler, G.D.; Schriml, L.M.; Sequeira, E.; Tatusova, T.A. Database resources of the National Center for Biotechnology. Nucleic Acids Res. 2003, 31, 28–33. [Google Scholar] [CrossRef] [PubMed]
  47. Arnold, K.; Bordoli, L.; Kopp, J.; Schwede, T. The SWISS-MODEL Workspace: A web-based environment for protein structure homology modelling. Bioinformatics 2006, 22, 195–201. [Google Scholar] [CrossRef] [PubMed]
  48. TargetP software. Available online: http://www.cbs.dtu.dk/services/TargetP/ (accessed on 6 June 2015).
  49. García-Rojas, M.; Gudenschwager, O.; Defilippi, B.G.; González-Agüero, M. Identification of genes possibly related to loss of quality in late-season “Hass” avocados in Chile. Postharvest Biol. Technol. 2012, 73, 1–7. [Google Scholar] [CrossRef]
  • Sample Availability: No available.
Figure 1. Expression profiles of putative organic acid-related genes during the growth of cherimoya cv. “Concha Lisa”. Quantitative real-time PCR assays were performed in duplicate on samples from 3 to 42 weeks after blooming (WAB). The genes analyzed related to malic acid (MA) were, (A) phosphoenol pyruvate carboxylase, AcPEPC; (B) cytoplasmic NAD-dependent malate dehydrogenase, Ac-cyNAD-MDH; (C) NADP-dependent malic enzyme, AcNADP-ME; and (D) NAD-dependent malic enzyme, AcNAD-ME. The genes analyzed related to citric acid (CA) were; (E) citrate synthase, Ac-mCS; (F) aconitate hydratase 1, AcACON; (G) NADP-dependent isocitrate dehydrogenase, AcNADP-IDH; and (H) ATP citrate synthase, AcATP-CS. Expression was normalized to a reference gene (AcUbiq, GenBank FJ664263) and the value is expressed against the lowest value of relative abundance. The relative expression of each gene (bars) was compared with the concentration of the respective acid (gray rhombus). Different letters (capitals for expression and lower cases for activity) between each time point represent significant differences at p0.05 by the LSD test.
Molecules 21 00398 g001
Figure 2. Expression profiles for four genes related to malic acid metabolism during ripening of “Concha Lisa” cherimoyas at 20 °C. The following genes were analyzed by qPCR: (A) phosphoenol pyruvate carboxylase, AcPEPC; (B) cytoplasmic NAD-dependent malate dehydrogenase, Ac-cyNAD-MDH; (C) NADP-dependent malic enzyme, AcNADP-ME; and (D) NAD-dependent malic enzyme, AcNAD-ME. Expression was normalized to a reference gene AcUbiq (GenBank FJ664263) and the value is expressed against the lowest value of relative abundance. The expression of each gene (bars) was compared with the concentration of malic acid (gray rhombus). Different letters between each sample point represent significant differences at p ≤ 0.05 by the LSD test.
Molecules 21 00398 g002
Figure 3. Activity profiles of organic acid-related enzymes during “Concha Lisa” cherimoya ripening. Assays were performed in duplicate using samples of 4 fruits per time point during ripening at 20 °C. The following enzymes were analyzed: (A) NAD-dependent malate dehydrogenase, NAD-MDH; (B) citrate synthase, CS; and (C) aconitate hydratase, ACON. In each panel, enzymatic activity (black rectangles) is related to and compared with the concentration of the respective organic acid (gray rhombus). Different letters between each sample point represent significant differences at p ≤ 0.05 by the LSD test.
Molecules 21 00398 g003
Figure 4. Expression profiles of putative genes related to the synthesis or degradation of citric acid during ripening of cherimoya cv. “Concha Lisa”. The following genes were analyzed by qPCR: (A) citrate synthase, Ac-mCS; (B) aconitate hydratase 1, AcACON; (C) ATP citrate synthase, AcATP-CS; and (D) NADP-dependent isocitrate dehydrogenase, AcNADP-IDH. Expression was normalized to the reference gene AcUbiq (GenBank FJ664263) and the value is expressed against the lowest value of relative abundance. In each panel, gene expression (bars) was compared with the concentration of citric acid (gray rhombus). Different letters between each time point represent significant differences at p ≤ 0.05 by the LSD test.
Molecules 21 00398 g004
Table 1. Organic acid contents of cherimoya fruit at nine stages of development, collected during 42 weeks. Results are expressed as the mean ± standard error (SE) of four separate extractions and determinations.
Sample PointWeeks after Blooming (WAB)Phenological Stage 1Fruit Weight (g)Organic Acids (mg/g Fresh Weight)
TartaricMalicAscorbicCitricSuccinic
S13711.1 ± 0.1 *,h1.12 ± 0.01 b2.29 ± 0.17 a,b0.14 ± 0.01 b7.05 ± 1.25 a2.97 ± 0.69 a
S28723.4 ± 0.7 h1.34 ± 0.17 a1.84 ± 0.43 b,c0.18 ± 0.04 a5.37 ± 1.09 b0.62 ± 0.12 c
S3127332.6 ± 4.0 g0.57 ± 0.06 c,d1.58 ± 0.15 c,d0.03 ± 0.01 c1.51 ± 0.31 c1.75 ± 0.29 b
S4177470.5 ± 14.6 f0.40 ± 0.05 d,e1.62 ± 0.12 c,d0.03 ± 0.01 c0.97 ± 0.39 c,d0.62 ± 0.19 c
S52175123.0 ± 14.4 e0.41 ± 0.03 c,d,e1.83 ± 0.07 b,c0.03 ± 0.00 c0.25 ± 0.04 d0.61 ± 0.14 c
S62676186.8 ± 10.3 d0.61 ± 0.8 c2.78 ± 0.27 a0.05 ± 0.01 c0.29 ± 0.03 c,d0.85 ± 0.06 c
S73077231.1 ± 15.7 c0.39 ± 0.7 d,e1.85 ± 0.17 b,c0.04 ± 0.01 c0.23 ± 0.02 d0.66 ± 0.03 c
S83478328.5 ± 49.9 b0.25 ± 0.06 e1.20 ± 0.10 d0.04 ± 0.00 c0.20 ± 0.05 c,d0.55 ± 0.06 c
S94279475.0 ± 74.4 a,b0.51 ± 0.15 c,d1.89 ± 0.11 b,c0.04 ± 0.00 c0.20 ± 0.07 d0.46 ± 0.05 c
1 According to Cautín and Agustí [25], using the BBCH-scale. * In the same column, different letters indicated differences among development stages at p ≤ 0.05 by LSD test.
Table 2. Isolated genes related to organic acid metabolism in Annona cherimola.
GeneGenBank AccessLength (aa)Coding Enzyme and Type of Sequence IdentifiedOrthologous Sequence: Specie and GenBank Access 1Identity (%)
Ac-cyNAD-MDHKU524480332Cytosolic NAD-malate dehydrogenase, complete sequenceAnnona cherimola—AHY99589100
AcNADP-MEKU524481587Putative NADP-dependent malic enzyme, complete sequenceTheobroma cacao—EOY1572985
AcNAD-MEKU524482606Putative NAD-dependent malic enzyme, complete sequenceTheobroma cacao—EOX9604485
AcATP-CSKU524483423Putative ATP-citrate synthase, complete sequenceRicinus communis—XP_00251256791
AcNADP-IDHKU524484416Putative isocitrate dehydrogenase protein, complete sequencePrunus persica—AAL1150390
Ac-mCSKU524485473Putative mitochondrial citrate synthase, complete sequenceCucumis sativus—XP_00413590288
AcPEPCKU524486164Putative phosphoenolpyruvate carboxylase, partial sequenceElaeis guineensis—AEQ9411286
AcACONKU524487473Putative aconitate hydratase 1, partial sequenceCitrus clementina—CBE7105691
1 Access code according to BLASTp sequence alignment [33].
Table 3. Quality, physiological parameters and organic acid contents of cherimoya fruit during ripening at 20 °C. Results are expressed as the mean ± SE of a series of separate determinations and extractions. TSS: total soluble solids, and TA: titratable acidity.
Days at 20 °C
025810
Quality and physiological parametersFirmness (kgf)18.2 ± 2.2 *,a18.1 ± 1.6 a1.6 ± 0.8 b0.5 ± 0.2 b0.6 ± 0.2 b
Respiratory rate (mL CO2 Kg−1·h−1)17.3 ± 0.8 d67.6 ± 3.7 b54.7 ± 3.0 c121.7 ± 9.5 a138.8 ± 8.3 a
Ethylene rate (µl·Kg−1·h−1)0.0 ± 0.0 c1.0 ± 0.3 c68.6 ± 13.3 b327.2 ± 38.0 a266.7 ± 49.6 a
TA (% malic acid)0.09 ± 0.01 c0.10 ± 0.01 c0.22 ± 0.01 b0.30 ± 0.01 a0.25 ± 0.01 b
TSS (%)6.8 ± 0.2 d10.2 ± 0.2 c15.5 ± 0.3 b16.2 ± 0.5 b18.2 ± 0.9 a
Organic acids (mg/g fresh weight)Tartaric0.51 ± 0.15 a,b0.65 ± 0.07 a0.30 ± 0.04 b,c0.26 ± 0.05 c0.31 ± 0.06 b,c
Malic1.89 ± 0.11 b2.26 ± 0.21 b3.73 ± 0.27 a3.19 ± 0.18 a3.53 ± 0.32 a
Ascorbic0.04 ± 0.00 a0.04 ± 0.00 a0.05 ± 0.01 a0.05 ± 0.00 a0.05 ± 0.00 a
Citric0.20 ± 0.07 b0.35 ± 0.04 b1.30 ± 0.17 a0.92 ± 0.08 a1.23 ± 0.25 a
Succinic0.46 ± 0.05 a,b0.63 ± 0.06 a,b0.85 ± 0.27 a0.75 ± 0.20 a,b0.44 ± 0.07 b
* In the same row, different letters indicated differences among sample points at p ≤ 0.05 by LSD test.
Table 4. Heterologous, degenerate and specific primers used for isolating cDNAs from cherimoya cv. “Concha Lisa”, RACE-PCR and qPCR assays.
Primer NameForward (F) and Reverse (R) Primers (5′→3′)Tm (°C)Reference
PpNADP-IDH heterologous primers (Prunus persica)F: GGCCATGTACAACACTGATGAG58Yang et al. [43]
R: CATTGTCATCCAACTTTGCCCTG
AcNADP-IDHF: TCCAAATGGAAGTCAAAGTTCGAG64N/A 1
R: CCTTTCTGGTGAACACGGTAATG
CmACON heterologous primers (Citrus maxima)F: GAAGCAATCACCAAAGGGAATC52Yang et al. [43]
R: TACTACGGTGAATTCGCTCAAAG
AcACON RACE-PCR primersF: ACCATGTCCCCTCCTGGCCC64N/A
R: TCCACATTGGATTTCCTTTCGTG
AcACON qPCR primersF: GCAGGCACGGTTGACATTGATT64N/A
R: GCCTGATGGCACGGATAATTGG
VvNADP-ME heterologous primers (Vitis vinifera)F: GGAGGAGTTCGTCCTTCAGCCTG58Yang et al. [43]
R: CCTTTGAGTCCACAAGCCAAATC
AcNADP-ME RACE-PCR primersF: GCACAATCTCCGCCAATATGAAG64N/A
F: AAGCCTCGCCAACGGTCGGT
AcNADP-ME qPCR primersF: AGAACGACTGGTCAGGAGTATG64N/A
R: CCTCGCCTGCGCCAAGGAATA
VvNAD-ME heterologous primers (Vitis vinifera)F: TGATCTTGGAGTTCAGGGAATTGGA58Yang et al. [43]
R: GCACTTCCTGCTCCAACTACAACTA
AcNAD-MEF: GCTGCTGGCATGAATCCACAAA64N/A 1
R: GCGTGTAAAAACAGCTTCCATGA
PEPC degenerate primersF: CCITGGATHTTYGCITGGAC54Moing et al. [44]
R: GCIGCDATICCYTTCATIG
AcPEPC RACE-PCR primersF: GAGACCCTGGTATTGCTGCTTT64N/A
R: ACATTTTCTTGAGCATTTGGAGC
AcPEPC qPCR primersF: TGGACCCAGACCAGATTTCACC66N/A
R: AATTGCTTCTCAGCCGCTCACC
mCS degenerate primersF: GGTTTRGCTGGRCCACTYC46Iannetta et al. [14]
R: GRGCATCAACATTWGGC
Ac-mCSF: ATCAAGTCTGTTGTAGAAGAATGT62N/A 1
R: CTCTGGCATGTGTATCGTGGA
AcATP-CSF: AAGTTCACCGTCCTCAACCCTA62González-Agüero et al. [45]
R: GCATAACCCAAATCTCCAACAG
DEGcyNAD-MDH degenerate primersF: TTTCYATYTACAAGTCMCARGC46N/A 2
R: CAGCTTWCGRGCCTTGATRATT
Ac-cyNAD-MDHF: AGAGTTTGCTCCATCCATTCCT62N/A 1
R: CTCGTTGTTGGACGGTTGTAAT
AcUbiq (Genbank FJ664263)F: TCCTGCAGAATCAGTGGAGTC64González-Agüero et al. [45]
R: AGGAACCAAATCCGCAAACAGC
1 Specific primer for A. cherimola designed for RACE-PCR and also used for qPCR assays; 2 Degenerate primers designed using conserved domain by a ClustalW alignment from sequences of several plant NAD-MDHs.

